bucknell university fall 2016 endowment … · office of the president bucknell university ......
TRANSCRIPT
BUCKNELL UNIVERSITY FALL 2016 ENDOWMENT REPORT

Office of the President
Bucknell University
Lewisburg, Pennsylvania 17837
BUCKNELL UNIVERSITY 2016 ENDOWMENT REPORT | 1
I am pleased to present the Bucknell University Endowment Report for fiscal year 2016, and to share with you an update on the management of University investments.
Market returns in the second half of 2015 and first quarter of 2016 were challenging for many university endow-ments and foundations, including Bucknell; the University is among the majority of institutions that experienced losses during the previous fiscal year. As a result of those losses as well as regular transfers from the endowment in support of University operations, net of new gifts, our total endowment value was $722 million at June 30, 2016. A more detailed analysis is included in the enclosed report. While still early, the start of fiscal year 2017 has been more positive, with first quarter returns having recovered a significant portion of the 2016 investment loss.
It is important to remember that the University endowment has grown through the generosity of thousands of donors over many decades. As with any long-term investment, some fluctuation in value is to be expected. We continue our policy of assuming prudent risk that we believe will yield the returns required to continue educating Bucknellians long after our time as stewards of the University has passed.
To better achieve this goal, we recently committed to a new endowment management model. After exhaustive research and due diligence, our Board of Trustees Investment Committee and our Investment Office staff selected a new strategic partner, Commonfund, to complement the University’s own expertise with the deep resources and investment acumen of an outside firm. This approach blends an array of strengths that will provide long-term continuity of investment management at a reasonable cost to Bucknell. You can learn more about Commonfund and the new management model at bucknell.edu/InvestmentOffice.
Gifts to the endowment are a priority of WE DO, The Campaign for Bucknell University. As of this writing, we have raised $410 million toward our half-billion-dollar goal, and we are already realizing the impact of these gifts. Endowed funding comprises more than $215 million of our current campaign total. That includes a record $20 million commitment to financial aid endowment from Bob ’45 and Doris Malesardi. We are grateful for their leadership, loyalty and foresight, and for all alumni, parents and friends who have made a permanent investment in Bucknell. Their generosity will benefit the University forevermore.
To amplify their pledge, the Malesardis also established a matching gift program. Through the Malesardi Match, gifts of $100,000 or more to need-based endowed scholarships will be matched on a 1:2 basis. The program has already inspired nearly $6 million in additional gifts from nearly 20 donors. The Malesardi Match is one of several exciting opportunities to support endowed funds as we look to conclude the WE DO Campaign in summer 2017. Other priority opportunities include investments in our College of Management, which we will formally establish on July 1, 2017; and endowed academic programs. More details are available at bucknell.edu/WeDo.
We will continue to look for additional strategic opportunities to strengthen and grow our endowment, which is critical to our long-term sustainability as an elite institution of undergraduate education. Thank you for your support in this endeavor. Together, we are building an even stronger Bucknell.
My best,
John Bravman President
Spendingwithdrawal
One Year ActivityJune 30, 2015-16 (in millions)
($35)
($42) Netinvestment
return
Gifts & other additions
$789Market value June 30, 2015
$10
$722Market value
June 30, 2016
Spendingwithdrawal
$575
Five Year ActivityJune 30, 2011-16 (in millions)
$129
($174)
Netinvestment
return
Gifts & other additions
Market value June 30, 2011
$192
$722Market value
June 30, 2016
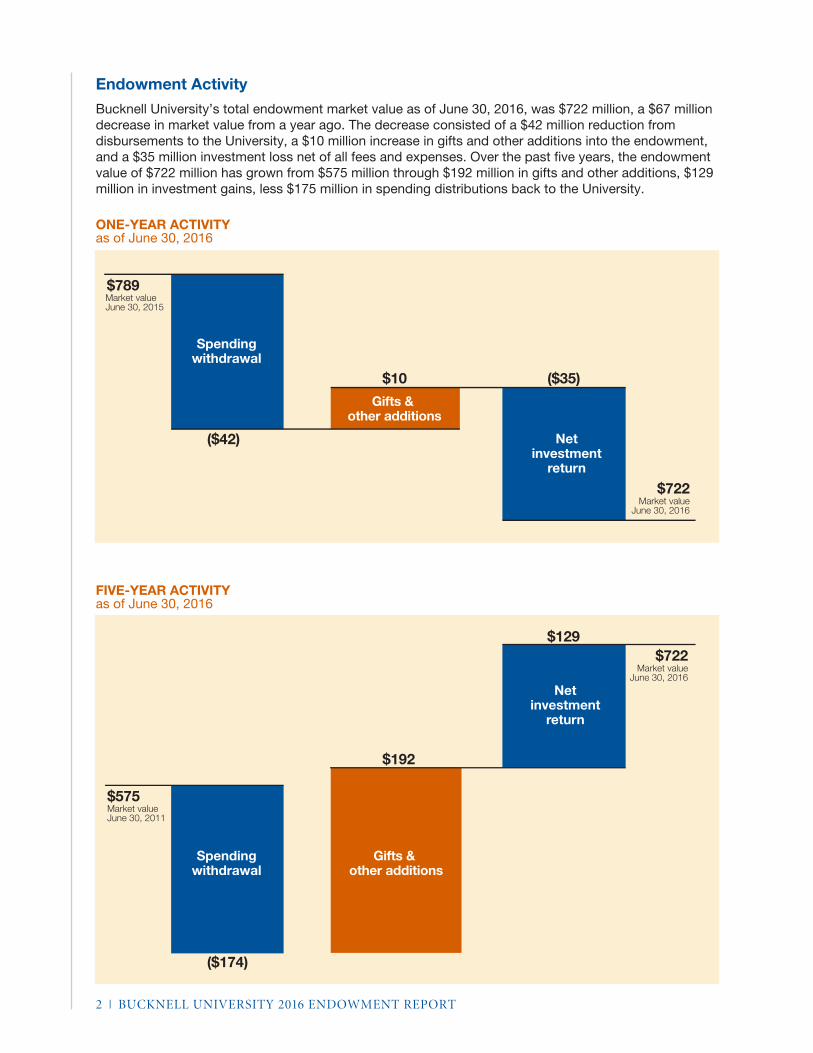
Endowment Activity
Bucknell University’s total endowment market value as of June 30, 2016, was $722 million, a $67 million decrease in market value from a year ago. The decrease consisted of a $42 million reduction from disbursements to the University, a $10 million increase in gifts and other additions into the endowment, and a $35 million investment loss net of all fees and expenses. Over the past five years, the endowment value of $722 million has grown from $575 million through $192 million in gifts and other additions, $129 million in investment gains, less $175 million in spending distributions back to the University.
ONE-YEAR ACTIVITYas of June 30, 2016
FIVE-YEAR ACTIVITYas of June 30, 2016
2 | BUCKNELL UNIVERSITY 2016 ENDOWMENT REPORT
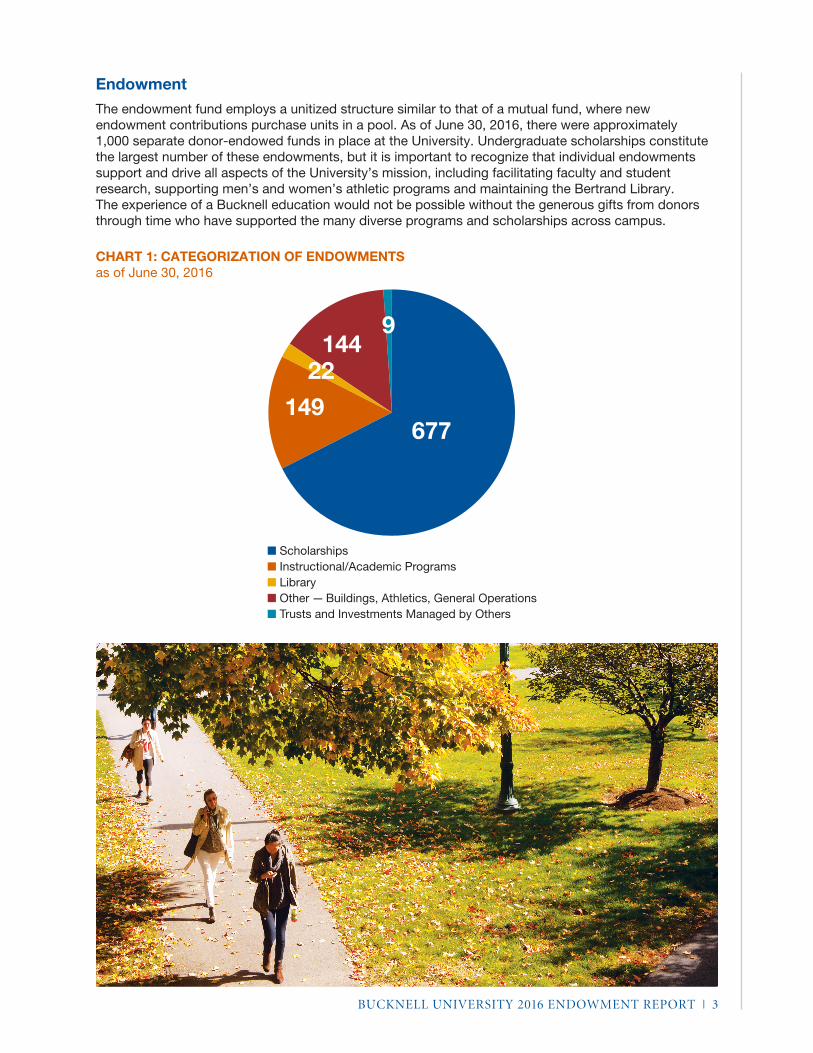
Endowment
The endowment fund employs a unitized structure similar to that of a mutual fund, where new endowment contributions purchase units in a pool. As of June 30, 2016, there were approximately 1,000 separate donor-endowed funds in place at the University. Undergraduate scholarships constitute the largest number of these endowments, but it is important to recognize that individual endowments support and drive all aspects of the University’s mission, including facilitating faculty and student research, supporting men’s and women’s athletic programs and maintaining the Bertrand Library. The experience of a Bucknell education would not be possible without the generous gifts from donors through time who have supported the many diverse programs and scholarships across campus.
CHART 1: CATEGORIZATION OF ENDOWMENTS as of June 30, 2016
BUCKNELL UNIVERSITY 2016 ENDOWMENT REPORT | 3
� Scholarships� Instructional/Academic Programs� Library� Other — Buildings, Athletics, General Operations� Trusts and Investments Managed by Others
677
22
9144
149

The power of these endowments to continue to shape the University is also evident through time, as these funds have appreciated in value while annually providing support to their designated program, department or scholarship. As a hypothetical example:
• An endowment gift of $1,000,000 established on July 1, 1996, and invested in the pooled endowment fund would have distributed approximately $1,600,000 in spendable endowment income to the University in support of the scholarship, department or program to which it was designated.
• Over the same 20-year period, the endowment gift would have grown to approximately $1,800,000.• Additionally, the annual support to the University from this gift would have grown as well, from
approximately $35,000 in 1996 to more than $100,000 today.
HYPOTHETICAL GROWTH OF A $1,000,000 DONATIONon July 1, 1996 through June 30, 2016
Asset Allocation
The asset allocation of the endowment is structured to achieve a maximum rate of return given a level of expected investment risk that is deemed prudent within the context of the University’s mission. The endowment’s asset allocation is structured to balance three main objectives:
• To maintain sufficient near-term liquidity in order to provide quarterly disbursements to the University;• To minimize the likelihood of a potential decline of the endowment that may permanently impair the
University’s mission; and• To generate a return that will allow the endowment to grow in excess of the disbursements made to
support the University and the eroding effects of inflation.
$2M
$1.5M
$1M
$5M
Endowment Value vs. Spendable Incomeas of June 30, 2016 (in millions)
1996
1998
2000
2002
2004
2006
2008
2010
2012
2014
2016
$1,793,716
$1,000,000
$1,537,362
$1,890,278
$1,973,779
$1,681,595 $1,781,302
$2,072,023
$2,027,639
$1,572,296 $1,648,444
$3,413,050
$2,210,456
$1,899,422
$2,145,224
$1,612,648
$2,554,394
$2,809,899
$2,705,737
$2,996,596
$3,482,531
Net Endowment ValueNet Endowment Value + Spendable Income
$4M
$3.5M
$3M
$2.5M
4 | BUCKNELL UNIVERSITY 2016 ENDOWMENT REPORT
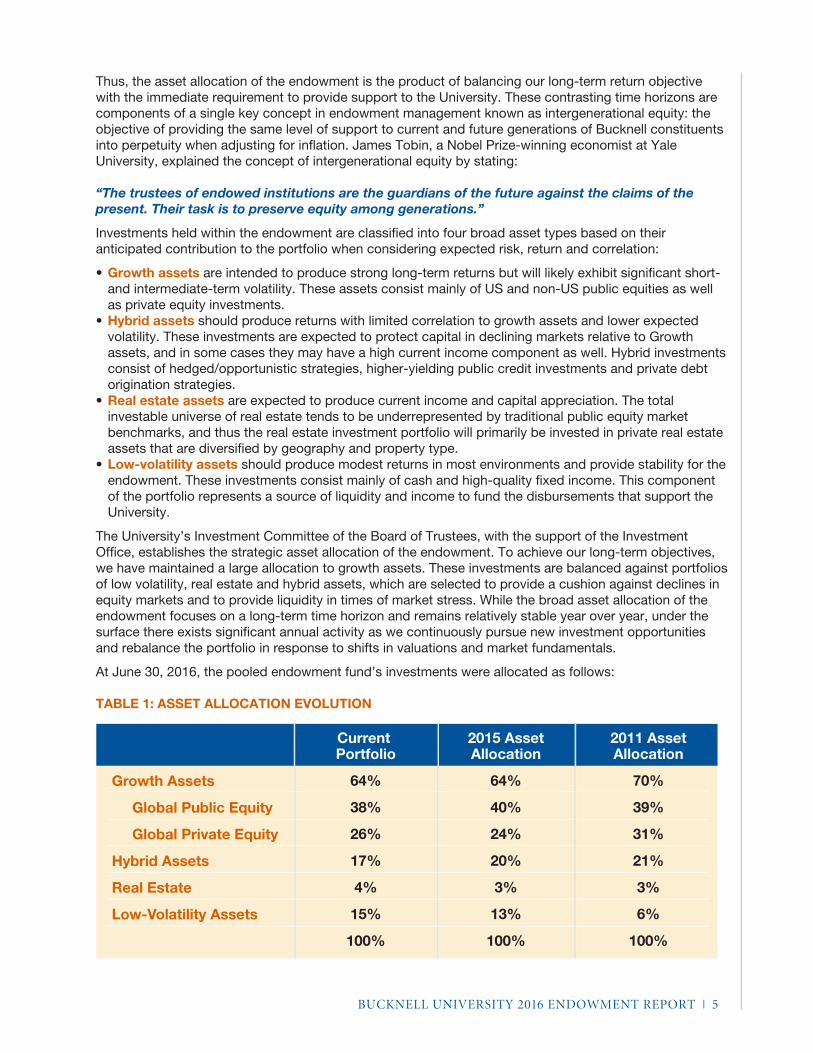
Thus, the asset allocation of the endowment is the product of balancing our long-term return objective with the immediate requirement to provide support to the University. These contrasting time horizons are components of a single key concept in endowment management known as intergenerational equity: the objective of providing the same level of support to current and future generations of Bucknell constituents into perpetuity when adjusting for inflation. James Tobin, a Nobel Prize-winning economist at Yale University, explained the concept of intergenerational equity by stating:
“The trustees of endowed institutions are the guardians of the future against the claims of the present. Their task is to preserve equity among generations.”
Investments held within the endowment are classified into four broad asset types based on their anticipated contribution to the portfolio when considering expected risk, return and correlation:
• Growth assets are intended to produce strong long-term returns but will likely exhibit significant short- and intermediate-term volatility. These assets consist mainly of US and non-US public equities as well as private equity investments.
• Hybrid assets should produce returns with limited correlation to growth assets and lower expected volatility. These investments are expected to protect capital in declining markets relative to Growth assets, and in some cases they may have a high current income component as well. Hybrid investments consist of hedged/opportunistic strategies, higher-yielding public credit investments and private debt origination strategies.
• Real estate assets are expected to produce current income and capital appreciation. The total investable universe of real estate tends to be underrepresented by traditional public equity market benchmarks, and thus the real estate investment portfolio will primarily be invested in private real estate assets that are diversified by geography and property type.
• Low-volatility assets should produce modest returns in most environments and provide stability for the endowment. These investments consist mainly of cash and high-quality fixed income. This component of the portfolio represents a source of liquidity and income to fund the disbursements that support the University.
The University’s Investment Committee of the Board of Trustees, with the support of the Investment Office, establishes the strategic asset allocation of the endowment. To achieve our long-term objectives, we have maintained a large allocation to growth assets. These investments are balanced against portfolios of low volatility, real estate and hybrid assets, which are selected to provide a cushion against declines in equity markets and to provide liquidity in times of market stress. While the broad asset allocation of the endowment focuses on a long-term time horizon and remains relatively stable year over year, under the surface there exists significant annual activity as we continuously pursue new investment opportunities and rebalance the portfolio in response to shifts in valuations and market fundamentals.
At June 30, 2016, the pooled endowment fund’s investments were allocated as follows:
TABLE 1: ASSET ALLOCATION EVOLUTION
Growth Assets
Global Public Equity
Global Private Equity
Hybrid Assets
Real Estate
Low-Volatility Assets
Current Portfolio
64%
38%
26%
17%
4%
15%
100%
2015 AssetAllocation
64%
40%
24%
20%
3%
13%
100%
2011 AssetAllocation
70%
39%
31%
21%
3%
6%
100%
BUCKNELL UNIVERSITY 2016 ENDOWMENT REPORT | 5
Investment Activity
Activity for the past fiscal year is summarized below:
• The University’s Investment Committee of the Board of Trustees meets regularly with the Bucknell Investment Office and other senior administrators of the University. At these meetings, the endowment portfolio is reviewed within the context of the University’s return objectives and risk constraints, the global macroeconomic landscape is appraised for relevant trends, and specific investment opportunities or themes are discussed. Below is a summary of current key themes within the endowment portfolio:
• Within growth assets, the endowment continues to favor public US equities over those found abroad as earnings outlooks and macroeconomic factors continue to look attractive for US companies relative to many other major developed and emerging markets nations. However, we recognize that the bull market in US equities that began in 2009 is now in its eighth year. As is often the case following such a robust and lengthy market expansion, many asset classes are near or above what could be considered a fair valuation. Equities still appear to offer relative value as many sovereign bonds trade close to multicentury-low yields. During the past year in this challenging market environment, we have focused on improving the efficiency of the portfolio by shifting to new and existing underlying investment managers that meet our highest conviction while also reducing investment-related expenses.
• Our allocation to hybrid assets, which are comprised mostly of hedged, opportunistic and credit-oriented strategies, seeks to provide returns with limited correlation to traditional public equity and fixed-income investments. Should valuations of traditional stocks and bonds continue to extend above their long-term averages, the hybrid portfolio may represent an opportunity for attractive relative returns. Many of the more compelling opportunities that we have reviewed over the last year have been within the hybrid portfolio.
• The endowment has a modest allocation to real estate today given that traditional measures of valuation imply that public and private core real estate investments may not be compelling. We continue to review idiosyncratic opportunities in real estate globally with a focus on strategies that can purchase properties at a discount and add value through increasing cash flows by decreasing vacancies, refurbishing and increasing rental income, or otherwise improving the underlying properties.
• The allocation to low-volatility assets is above our long-term strategic target as we patiently seek opportunities in an aging bull market. Much of the low-volatility portfolio is comprised of cash and high-quality, short-term fixed income. This positioning presented some opportunity cost during fiscal year 2016 as traditional bond market indices offered mid-single-digit returns, and a large portion of foreign government bonds have appreciated to the point of providing investors with negative yields.
6 | BUCKNELL UNIVERSITY 2016 ENDOWMENT REPORT

Overall Performance
Over the one-, five-, 10- and 20-year periods ended June 30, 2016, Bucknell’s pooled endowment fund generated annualized returns of -4.7, 4.0, 4.8 and 7.8 percent, respectively.
• The investment return of the endowment portfolio over the past fiscal year of -4.7% was primarily attributable to commodity-related investments and low relative performance of some global public equity managers during the 12 month period. While we are disappointed by these losses, we are encouraged by the recent portfolio and endowment management changes that have already begun to have a positive impact in the first fiscal quarter of 2017.
• The long-term investment objective of the endowment fund is to generate a real return that will allow for growth in excess of the disbursements transferred to the University that support financial aid and other key programs. During the 10-year period that also factors in the drawdown from the global financial crisis, the endowment fund return of 4.8 percent did not meet this return objective.
• Bucknell’s endowment return over the past 10 years is slightly above the estimated median return of other college and university endowments of 4.7 percent1 but below our strategic policy index2. Over a longer 20-year period, the endowment fund has generated a 7.8 percent return that is above both the policy index and the estimated college and university endowment median.
RETURNS FOR PERIODS ENDING JUNE 30, 2016
1 FY2016 estimated return based on preliminary results collected from multiple consulting firm universes. Previous fiscal year returns based on the NACUBO-Commonfund Study of Endowments.
2 Blended benchmark based on the strategic asset allocation of the endowment. Consists of 20% Wilshire 5000, 20% MSCI ACWI ex US, 10% Barclay’s Aggregate Bond Index, 20% HFR Fund of Funds, 15% S&P500 +5% and 15% CPI + 5%. Prior to 2003, the Policy index consists of 70% S&P 500 and 30% Barclays Aggregate Bond Index.
Returns for Periods Ending June 30, 2015
-4.7-5
-4
-3
-2
-1
0
1
2
3
4
5
6
7
8
-2.7
0.0
4.0
5.1
6.6
4.8 4.7
5.9
7.8
6.67.5
Bucknell Pooled Endowment
Estimated Endowment/Foundation Median2
Bucknell University Policy Index1
1-YEAR 5-YEAR 10-YEAR 20-YEAR
BUCKNELL UNIVERSITY 2016 ENDOWMENT REPORT | 7
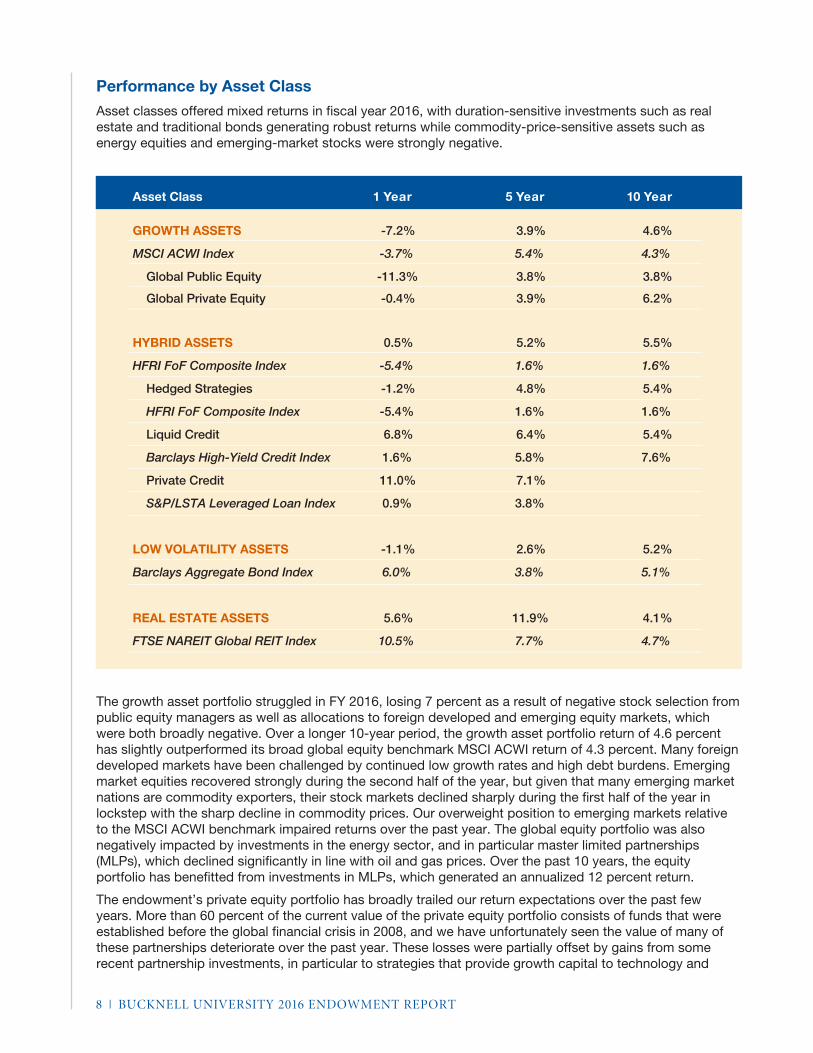
Performance by Asset Class
Asset classes offered mixed returns in fiscal year 2016, with duration-sensitive investments such as real estate and traditional bonds generating robust returns while commodity-price-sensitive assets such as energy equities and emerging-market stocks were strongly negative.
The growth asset portfolio struggled in FY 2016, losing 7 percent as a result of negative stock selection from public equity managers as well as allocations to foreign developed and emerging equity markets, which were both broadly negative. Over a longer 10-year period, the growth asset portfolio return of 4.6 percent has slightly outperformed its broad global equity benchmark MSCI ACWI return of 4.3 percent. Many foreign developed markets have been challenged by continued low growth rates and high debt burdens. Emerging market equities recovered strongly during the second half of the year, but given that many emerging market nations are commodity exporters, their stock markets declined sharply during the first half of the year in lockstep with the sharp decline in commodity prices. Our overweight position to emerging markets relative to the MSCI ACWI benchmark impaired returns over the past year. The global equity portfolio was also negatively impacted by investments in the energy sector, and in particular master limited partnerships (MLPs), which declined significantly in line with oil and gas prices. Over the past 10 years, the equity portfolio has benefitted from investments in MLPs, which generated an annualized 12 percent return.
The endowment’s private equity portfolio has broadly trailed our return expectations over the past few years. More than 60 percent of the current value of the private equity portfolio consists of funds that were established before the global financial crisis in 2008, and we have unfortunately seen the value of many of these partnerships deteriorate over the past year. These losses were partially offset by gains from some recent partnership investments, in particular to strategies that provide growth capital to technology and
GROWTH ASSETS -7.2% 3.9% 4.6%
MSCI ACWI Index -3.7% 5.4% 4.3%
Global Public Equity -11.3% 3.8% 3.8%
Global Private Equity -0.4% 3.9% 6.2%
HYBRID ASSETS 0.5% 5.2% 5.5%
HFRI FoF Composite Index -5.4% 1.6% 1.6%
Hedged Strategies -1.2% 4.8% 5.4%
HFRI FoF Composite Index -5.4% 1.6% 1.6%
Liquid Credit 6.8% 6.4% 5.4%
Barclays High-Yield Credit Index 1.6% 5.8% 7.6%
Private Credit 11.0% 7.1%
S&P/LSTA Leveraged Loan Index 0.9% 3.8%
LOW VOLATILITY ASSETS -1.1% 2.6% 5.2%
Barclays Aggregate Bond Index 6.0% 3.8% 5.1%
REAL ESTATE ASSETS 5.6% 11.9% 4.1%
FTSE NAREIT Global REIT Index 10.5% 7.7% 4.7%
Asset Class 1 Year 5 Year 10 Year
8 | BUCKNELL UNIVERSITY 2016 ENDOWMENT REPORT

healthcare companies. We look forward to leveraging our new strategic partnership with Commonfund to assist with maximizing value from our existing private portfolio while also providing access to high-quality firms to help drive stronger future returns.
Hybrid assets were slightly positive during fiscal year 2016, partially offsetting the significant losses in the growth asset portfolio. On a relative basis, our portfolios of hedged and credit investments all significantly outperformed their respective benchmarks over the past fiscal year. Over the longer term, our hybrid assets have performed very well on both a relative and absolute basis, and we continue to find attractive opportunities to invest capital in new strategies moving forward.
As global interest rates continued to decline throughout the fiscal year, duration-sensitive fixed income and real estate investments performed very well. Our low-volatility investment portfolio lost 1 percent over the past fiscal year as our limited-duration position and credit exposure negatively impacted performance. While the endowment does have exposure to interest rate movements, we’ve chosen to limit interest rate exposure within the fixed-income portfolio given the near-zero absolute yields for many sovereign bonds. We are comfortable remaining underweight interest rate sensitivity within the fixed-income portfolio, and we will await opportunities to invest at higher rates in the future. Lastly, the real estate portfolio provided a strong positive contribution to performance in fiscal year 2016 as real estate markets rallied significantly. Property level fundamentals continue to improve, and prices have now recovered to pre-2008 levels for many residential and commercial property markets.
Outlook
The bull market and accommodative monetary policy of the last several years have inflated the prices of risk assets while simultaneously depressing the expected yields for cash and high-quality bonds. Today, it feels like most assets are “priced to perfection” with economic growth in the US and many developed nations remaining low but stable. This environment presents challenges for endowments, many of which provide approximately 5 percent of their value annually in support to their respective universities. As asset allocators and stewards of the University’s endowed funds, we will continue to take a long-term approach while striving to remain nimble in order to capitalize on opportunities as they arise. We will add capital to asset classes and investing strategies that offer attractive risk/return dynamics while seeking to minimize the portfolio risks that can occur when asset class prices or fundamental characteristics become less compelling.
As of this writing, US citizens are just weeks away from deciding on the nation’s next president. Simultaneously, the Federal Reserve is deciding its policy on short-term interest rates within the context of US economic health and inflation among other considerations. Investors, policymakers and central bank officials globally will likely be watching the evolution of these two decisions very closely. Despite the very real potential for increased short-term volatility and consternation, in the long run innovation and entrepreneurialism are expected to continue to be powerful forces within the global economy, companies will seek to add value for shareholders, borrowers are expected to repay loans and patient long-term investors, like the Bucknell endowment fund, should be rewarded.
As always, we remain committed to the dual mandate of the endowment fund: ensuring the assets we manage, which have been generously built over decades of giving, are available to support Bucknell University today as well as in the future. Thank you for your continued interest and support.
BUCKNELL UNIVERSITY 2016 ENDOWMENT REPORT | 9

DEVELOPMENT & ALUMNI RELATIONSLEWISBURG, PENNSYLVANIA
BUCKNELL.EDU