bubble, critical zone and the crash of royal ahold … · this article on one particular case,...
TRANSCRIPT

arX
iv:c
ond-
mat
/040
3563
v1 [
cond
-mat
.sta
t-m
ech]
22
Mar
200
4 Bubble, Critical Zone
and the Crash of Royal Ahold
Gerrit Broekstra a, Didier Sornette b,c,d,1, Wei-Xing Zhou b
aOrganization Behavior and Systems Sciences, Nyenrode University, Breukelen,
The Netherlands
bInstitute of Geophysics and Planetary Physics, University of California, Los
Angeles, CA 90095
cDepartment of Earth and Space Sciences, University of California, Los Angeles,
CA 90095
dLaboratoire de Physique de la Matiere Condensee, CNRS UMR 6622 and
Universite de Nice-Sophia Antipolis, 06108 Nice Cedex 2, France
Abstract
Our analysis of financial data, in terms of super-exponential growth, suggests thatthe seed of the 2002/03 crisis of the Dutch supermarket giant AHOLD was plantedin 1996. It became quite visible in 1999 when the post-bubble destabilization regimewas well-developed and acted as the precursor of an inevitable collapse fueled byraising expectations of investors to maintain strong herding pressures. We haveadapted Weidlich’s theory of opinion formation to describe the formation of buyor sell decisions among investors, based on a competition between the mechanismsof herding and of personal opinion opposing the herd. Among four typical patternsof stock price evolution, we have identified a “critical zone” in the model charac-terized by a strong sensitivity of the price trajectory on the herding and personalinclination parameters. The critical zone describes the maturation of a systemicinstability forewarning of an inevitable crash. Classification and recognition of thespontaneous emergence of patterns of stock market evolution based on Weidlich’stheory of complex systems, and in particular our discovery of the post-bubble desta-bilization regime which acts as a precursor to a subsequent crash or antibubble, notonly presents the possibility of developing early warning signals but also suggeststo top management ways of dealing with the coming crisis.
1 Corresponding author. Department of Earth and Space Sciences and Instituteof Geophysics and Planetary Physics, University of California, Los Angeles, CA90095-1567, USA. Tel: +1-310-825-2863; Fax: +1-310-206-3051. E-mail address: [email protected] (D. Sornette)http://www.ess.ucla.edu/faculty/sornette/
Preprint submitted to Elsevier Science 22 March 2018

1 Introduction
The 21st century opened with a deep confidence crisis in the financial marketscaused by unprecedented corporate scandals both in the USA (Enron, World-com) and in Europe (Ahold, Parmalat). Financial authorities and investorswould greatly benefit from a systematic analysis of publicly available corpo-rate financial performance data such as sales and earnings and, particularly,stock price dynamics of high-growth companies that would enable them todetect early warning signals of impending problems in bullish times. It is ourpurpose to present a study showing the relationship between these variablesand a model to understand the origin of crises in individual companies.
In the wake of the worldwide stock markets bubbles followed by crashes or‘antibubbles’ of the second half of the 1990s and early 2000s, the analysis ofsuch critical phenomena in aggregate stock markets has been intensified; see forinstance (Abreu, 2001; Richardson and Ofek, 2001; Visano, 2002; Caballeroand Hammour, 2002; Bohl, 2003; Brooks and Katsaris, 2003; Siegel, 2003;Scheinkman and Xiong, 2003; Griffin et al., 2003; Brunnermeier and Nagel,2003; Chari and Kehoe, 2003; Kaizoji, 2004; Engsted and Tanggaard, 2004).A series of synthesis papers (including Kindleberger (2000), Shefrin (2000),Shiller (2000), Shleifer (2000), Sornette (2003)) have pointed out the role ofcollective behaviors, such as herding and optimism feedback on itself, in thedevelopment of bubbles in aggregate markets. Far less attention has beenpaid to the fate of individual companies during these bubbles (see however(Johansen and Sornette, 2000) and (Lamdin, 2002)) and particularly thosehigh-growth companies that couldn’t resist to manipulate their earnings toinfluence investors’ behavior eventually ending up with cutting their own flesh.That a propensity of earnings manipulation during bullish times is not unusualwas recently emphasized from research in the Chinese stock market (Jiao,2003).
The present work has two main goals. First, we study the recent bubble andits aftermath of the Ahold company. Our purpose is to extend previous workson bubbles and crashes that were essentially performed on aggregates, suchas indices or major currencies. We particularly refer to (Johansen et al., 1999;2000; Sornette and Johansen, 2001; Sornette and Zhou, 2002; Zhou and Sor-nette, 2003; Sornette, 2003; Johansen and Sornette, 2004), where a quanti-tative framework has been developed to test for the presence of speculativebubbles and to predict their termination, often in the form of crashes. In anutshell, these works propose that speculative bubbles reflect the interplaybetween preponderant positive feedbacks modulated by intermittent negativefeedbacks, leading to characteristic “log-periodic power law” (LPPL) signa-tures. These works have tested the LPPL signatures on major financial aggre-gates. Johansen and Sornette (2000) have previously performed a rapid analy-
2

sis of the price of the shares of IBM and of Procter & Gamble and showed thepresence of a speculative bubble preceding the crash in both cases. Profession-als have used this methodology to develop trading techniques on individualcompanies (private communications) but we are not aware of other publishedworks on other individual companies. To attain sufficient depth, we focus inthis article on one particular case, Royal Ahold, which is of interest to bothsides of the Atlantic, because a relatively large share of the sales of one of theworld’s largest supermarket chains occurs in both Europe, and the Nether-lands in particular, and in the USA. We address the questions to what degreebubbles can occur on individual companies, how they are linked to objectivevariables characterizing the company (such as sales and earnings), how theyare coupled with the dynamics of related indices.
Our second goal is to introduce the new concept of a “critical zone” charac-terizing the termination of a bubble and the transition to another regime, beit via a crash, a correction or simply a plateau. Johansen et al. (1999; 2000)have developed a rational expectation (RE) model of bubbles and crashes in-corporating herding behavior, which shows that the bubble termination timeis the instant at which a crash is the most probable (but is still not certain).In this class of RE models, a crash can occur at any time but is more andmore probable as the bubble develops. In addition, there is a finite probabilitythat no crash occurs, that is, that the bubble ends smoothly. However, thequestion remains open as to how the bubble transitions to a different phaseafter its demise. Sornette and Zhou (2004) have shown that the LPPL theorycan be used in a general pattern recognition method with efficient generalizingproperties to detect times of changes of regime which are not necessarily orimmediately associated with a crash (that is a sharp price drop of say morethan 15% occurring over a short time interval of say less than 2-3 weeks).In addition, most of the LPPL studies of bubbles previously performed (see(Sornette, 2003) and references therein) have shown that the maximum of abubble is not immediately followed by a crash but that a rather complex be-havior (lasting a few days to a few weeks) develops before the crash occurs.Here, we propose a simple model of the interplay between prevailing opinionsand personal preference of investors to buy or sell shares which provides auseful classification of evolutionary patterns of stock price dynamics includingthe so-called “critical zone.”
2 A short history of Ahold
Albert Heijn started in 1887 with a small grocery store in Zaandam, just northof Amsterdam. The Netherlands-based holding company Ahold was listed onthe AEX, the Amsterdam Stock Exchange, in 1948 and opened its first self-service supermarket in Rotterdam in 1955. The operating company of Albert
3

Heijn became the supermarket leader in the Netherlands and a householdword for quality and value-for-money. Shortly after the Queen awarded thecompany the designation “Royal,” the last Heijn retired in 1989 as CEO fromthe company. Under his leadership, Royal Ahold had started already in the1980s an expansion program in the USA. Ahold is the largest food providerin the Netherlands and one of the largest in the United States. At the end of2002, Ahold operated some 5600 stores and employed approximately 280,000people. Its major operations are in Europe and the United States, but is hasalso expanded into retail operations in Latin America and Asia as well. In thelatter regions the company is now in the process of divesting all its operations.
In 1993, Cees van der Hoeven became the new CEO. He had the at first widelyapplauded ambition to make Ahold one of the largest food providers in theworld. At that time, Ahold’s sales were about 10 billion euro’s. When he wasforced to resign ten years later, in 2003, the sales amounted to almost 63 billioneuro’s, a six-fold increase. But then, the company almost collapsed under itsdebt burden of 13 billion euro’s, fraud and mismanagement. It is generallyassumed that the acquisition in 2000 of U.S. Foodservice, a non-core activity,which in itself can be viewed as a strategic mistake, was the start of a hostof problems including the bookkeeping fraud at this same company. On 24February 2003, the Ahold bubble collapsed and, while the stock price on theAEX had been coming down under the threat of profit warnings during thewhole of 2002 from a high of 35 euro in 2001 to about 10 euro at the end ofthe year, it fell on that day with a bang of 63% down to 3.6 euro. The crisiswas deep and prolonged for customers, investors and employees alike.
1980 1985 1990 1995 2000 20051
1.5
2
2.5
3
3.5
4
4.5
time
ln(N
et s
ales
)
Fig. 1. Annual ln(sales) (billion euro) of Ahold fitted with two linear regressionlines indicating an acceleration of the exponential growth rate at the intersectionof the lines in 1996. The lower line was fitted to the data from 1983 to 1995 andcorresponds to ln(sale) = 0.103(t− 1900)− 7.16. The upper line is a fit of the datafrom 1995 to 1999 and corresponds to ln(sales) = 0.223(t−1900)−18.58. The salesdata of 2000 and 2001 indicate another growth acceleration. The corrected 2000and 2001 sales data and the 2002 sales, all reported in October 2003 by Ahold, areshown to coincide with the upper regression line.
4

Inspection of a simple diagram (Figure 1), which shows the natural logarithmof the annual sales of Ahold from 1983 onwards, ln(sales), is already quiterevealing. A straight line in this plot indicates exponential growth. The com-parison of the two lines in Figure 1 is suggestive of an acceleration of thegrowth rate of net sales in 1996. From the regression lines, it can be seenthat the average growth rate has more than doubled from the first (1983-1995) to the second period (1995-1999). The beginning of the second periodcorresponds approximately to the time when Ahold started to consolidate theresults of their latest acquisition, the US supermarket chain Stop & Shop. Alsoin 1996, Royal Ahold became, in more than one way, an “American company”rather than a Dutch one because, for the first time, Ahold’s sales in the USAexceeded 50% of total sales bypassing the sales in The Netherlands (41%),which in the previous year still represented the largest share of 48 %. Further-more, in the years 2000 and 2001, the growth appeared to accelerate again(The corrections on the reported sales made in October 2003 indicate thatthe sales figures were somewhat “blown up” since they better fit the extensionof the 1995-1999 regression line). Though revealing, this simple description interms of two, three or more periods with different growth rates falls short ofcapturing adequately the behavior of the Ahold sales as we discuss in the nextsection.
3 “Super-exponential” growth of Ahold’s sales, earnings and stockmarket prices
3.1 Super-exponential growth due to positive feedback
Figure 1 actually shows a super-exponential growth in sales. Such super-exponential behavior can be explained by the concept of “positive feedbacks,”that is, conditioned on the observation that the sales or market have recentlymoved up (respectively, down), this makes them more probable to keep themmoving up (respectively, down), so that a large cumulative move ensues. Theconcept of “positive feedbacks” has a long history in economics and is relatedto the idea of “increasing returns,” which says that goods become cheaper themore of them are produced (and the closely related idea that some products,like fax machines, become more useful the more people use them). Positivefeedback is the opposite of negative feedback which is well-known in popula-tion dynamics: the larger the population of rabbits in a valley, the less grassthere is per rabbit. If the population grows too much, the rabbits will even-tually starve, slowing down their reproduction rate, which thus reduces theirpopulation at a later time. Thus negative feedback means that the higher thepopulation, the slower the growth rate, leading to a spontaneous regulation ofthe population size. In finance, value investing for instance leads to negative
5

feedbacks: if the observed price of a company is larger than the estimatedfundamental value, a value investor will tend to sell, expecting the price toconverge back in the future to the true value. But by selling, he also tendsto push the price down, the very expected move that led to the investmentdecision in the first place.
Positive feedback is the opposite phenomenon. In the context of populationdynamics, positive feedbacks have characterized the evolution of human pop-ulation growth over most of the last two thousand years (see (Johansen andSornette, 2001) and references therein). The difference between humans andrabbits in this context is that humans modify the carrying capacity of theplanet by various agriculture and technological innovations: the larger the hu-man population, the more probable the occurrence of improvements and theexploitation of new habitats and resources, etc., leading to a positive feed-back of population on food availability, providing a positive feedback on thegrowth rate and so on. The consequence is that, until recently, the growthrate of the human population has grown itself, leading to a super-exponentialgrowth of the population (one could say that Malthus was an optimist!). Forstock markets, when positive feedbacks dominate, the higher the price or theprice return in the recent past, the higher will be the price growth in the fu-ture. Apart from technical mechanisms for positive feedback such as derivativehedging and portfolio insurance strategies, behavioral traits of investors suchas imitation and herding akin to self-fulfilling prophecies play an importantrole (see Chap. 4 of (Sornette, 2003) for a detailed discussion and referencestherein). Positive feedbacks, when unchecked, can produce runaways until thedeviation from equilibrium is so large that the growth becomes unstable sothat any disturbance/news may lead to ruptures or crashes (Sornette, 2003).See (Sornette et al., 2003) for examples of run-away hyperinflation due topositive feedbacks.
To illustrate the concept of positive feedback in a mathematical form, considerthe variable X (net sales, or earnings, or logarithm of prices). The familiarpicture of a healthy growth of X is related to an exponential
dX/dt = rX , (1)
where r is the instantaneous growth rate. For r = r0 constant, X grows ex-ponentially with the constant growth rate r. We interpret r0 as the naturaland normal growth rate for instance associated with population growth andgains of productivity. Since gains of productivity are usually small (Fair, 2002;van Biesebroeck, 2004) and population growth is very small for a developedcountry, r0 is small for a company that has already a substantial part of thelocal market as is the case of Ahold.
However, top managers are usually not satisfied with such small growth ratesand attempt to increase growth for example by making acquisitions in foreign
6

countries, which is partly due to the fact that they can perceive more positivebenefits from high growth rates (Erickson, Hanlon & Maydew, 2004). Thenr itself becomes a function of time. There are several ways to describe thisphenomenon. For instance, one can argue that r increases with X due toexpansion through acquisitions (like in Ahold’s case) according to
r = r0 + aXk, (2)
where k > 0 and a a positive constant. This expression embodies the conceptof positive feedback of the sales on its growth rate. Putting this dependence(2) in (1) yields
dX/dt = r0X + (X/X0)k+1 , (3)
where X0 = a−1/(k+1) is a constant. Since k > 0, the positive feedback in (3)is initially small for small X < X0 and then accelerates progressively as Xreaches and overpasses the characteristic value X0. For X > X0, the solutionof (3) tends to the asymptotic power law
X(t) ∝1
(tc − t)1/k, (4)
where tc is a constant of integration. The solution (3) leads to what is called inmathematical terms a “movable finite-time singularity”: “singularity” becauseof the divergence in finite time as t → tc and “movable” because the criticaltime tc is not fixed a priori by the structure of the feedback and of the dynamicsbut is sensitively dependent upon (and fixed by) the initial conditions.
The acceleration of growth can also take the form of a feedback of the velocityof change of the sales on the growth rate, such that
r = b(dX/dt)q (5)
with 0 ≤ q < 1. In words, the larger the slope of variation of the sales, thelarger the number of acquisitions and therefore the larger the growth rate andso on. Placing (5) in (1) leads to an equation of the form (3) (without thelinear term in the r.h.s.) with 1 < k + 1 replaced by 1 < 1/(1 − q). This
leads to X(t) ∝ 1/(tc− t)1−q
q . Note that the limit q → 0 recovers the standardconstant growth rate, with an exponential growth formally retrieved as thelimit of a power law with an infinite exponent. These two models (2) and (5)are end-members of more general feedback mechanisms that can combine botheffects.
The important point is that a rather broad class of positive feedback mecha-nisms give rise to a power law acceleration, which can be written generally as
X(t) = A+B(tc − t)m , (6)
7

1991 1992 1993 1994 1995 1996 1997 1998 1999 2000 2001 20020
2
4
6
8
10
12
14
16
18
20
time
Net
sal
es
Fig. 2. Super-exponential growth of the quarterly net sales (Billion Euro). The linesare respectively the fits to a pure power law model (6) and to a periodically oscil-latory power law model (7). The power-law fit gives tc = 2002/05/20, m = −0.79,A = −0.975, and B = 2185 with a r.m.s of fit residual equal to 0.609. The oscilla-tory power-law fit gives tc = 2002/04/29, m = −0.65, fs = 1.0006/365, φ = 4.99,A = −2.24, B = 983.5, and C = −54.4 with a r.m.s. of fit residuals equal to 0.5186.
where m = − 1k= −(1 − q)/q < 0 and A and B > 0 are two constants. In
particular, the constant A has been added to represent the first correctionto the leading power law behavior valid for t close to tc. Note that model(6) is much more parsimonious than a model such as suggested in Figure 1consisting in several distinct regimes of exponential growth.
The form of the solution (6) illustrates the concept that super-exponentialgrowth hides an inherent danger. Though theoretically, it may appear to goto infinity, what everybody knows is that in practice it can not continue indef-initely. The finite-time singular structure of (6) is actually the mathematicaltranslation of a change of regime, a cross-over from an unsustainable pace to acrash or maybe a smooth landing of the accelerating bubble regime (Johansenet al., 1999; 2000).
3.2 Super-exponential growth in net sales and earnings
Figures 2 and 3 expand on Figure 1 and show respectively the quarterly netsales (from 1991 to 2001) and net earnings (from 1991 to 2001) of Royal Ahold.The fits by the power law (6) of the quarterly net sales (Billion Euro), netearnings (Million Euro) and logarithm of stock prices of Ahold from 1991 totheir historical highs at tmax are shown in figures 2 and 3. For the quarterlynet sales, tmax = 2001/03/31. For the net earnings, tmax = 2000/12/31. Thesethree time series exhibit a clear super-exponential growth. This occurred ata time when the company was aggressively increasing its share of the worldmarket, transforming itself into an ever faster growing entity.
8

1991 1992 1993 1994 1995 1996 1997 1998 1999 2000 2001 20020
50
100
150
200
250
300
350
400
time
Net
ear
ning
s
Fig. 3. Super-exponential growth of the quarterly net earnings (Million Euro). Thelines are respectively the fits to a pure power law model (6) and to a periodically os-cillatory power law model (7). The power-law fit gives tc = 2002/09/28, m = −0.95,A = −39.8, and B = 17882 with a r.m.s of the fit residuals equal to 13.7. The oscil-latory power-law fit gives tc = 2004/08/02, m = −1.77, fs = 0.9989/365, φ = 1.75,A = −8.43, B = 1.1× 10⁸, and C = 1.3× 10⁷ with a r.m.s. of fit residuals equal to8.26.
Inspection of the figures 2 and 3 shows that the last quarter is always by farthe highest sales and earnings of the year. We can take into account this yearlyperiodicity by the improved model
X(t) = A+B(tc − t)m + C(tc − t)m cos(2πfst+ φ) , (7)
where fs is the fundamental frequency of the seasonal cycle. The theoreticalvalue of 1/365 (for t in units of day) of a yearly cycle is confirmed by fitting.The fits of the sales and earnings with (7) are also shown in Figures 2 and 3.A standard Wilks test (Rao, 1966) for the statistical significance of the addedterm C(tc− t)m cos(2πfst+φ) gives a log-likelihood ratio between the models(6) and (7) equal to 13.5, so that the probability that the added explanatorypower provided by (7) over (6) results from chance is 0.12%. The statisticalsignificance of model (7) is thus established at the 99.9% confidence level.Similarly, the corresponding log-likelihood ratio between the models (6) and(7) for the net earnings is equal to 41.5, so that the probability that theexplanatory power of (7) results from chance is essentially zero.
3.3 Bubble and post-bubble regimes in stock prices
For the stock prices of Royal Ahold, the super-exponential bubble culminatedon tmax = 1997/07/23. Figure 4 shows the super-exponential growth of thelogarithm of Ahold stock prices.
The post-bubble regime since the local high on 1997/07/23 has also been
9

91 92 93 94 95 96 97 98 99 00 01 02 03 040.5
1
1.5
2
2.5
3
3.5
4
4.5
t
ln[P
(t)]
Fig. 4. Ahold stock price as a function of time. The vertical axis is in logarithmicscale while the horizontal axis uses a linear scale. The power-law fit to the data from1991/01/10 to tmax = 1997/07/23 gives tc = 2004/06/19, m = −4.62, A = 1.71,B = 8.11 × 10¹⁵ with a r.m.s of the fit residuals equal to 0.062. The log-periodicpower-law fit to the data from 1997/04/09 to 2002/08/09 gives tc = 1996/07/24,α = 0.48, ω = 12.31, φ = 3.61, A = 3.14, B = 0.0078, C = 0.0055, and the r.m.s. ofthe fit residuals is χ = 0.103.
fitted with a log-periodic post-bubble power law (Johansen and Sornette, 1999;Sornette, 2003)
ln [P (t)] = A+B(t− tc)m + C(t− tc)
m cos [ω ln(t− tc) + φ] , (8)
showing an oscillatory pattern of increasing amplitude. The fit is also illus-trated in Fig. 4. It is striking to note that tc is also located in 1996, the pointin time where according to the simpler analysis in Fig. 1 the growth acceler-ation took place. This reinforces the conclusion that 1996 is the year wherea change of regime took place and the seed of the 2002/03 crisis was plantedinitiating a “critical zone” of destabilization. This pattern will be discussedmore thoroughly later in the paper.
These analyses suggest that the crisis was not due to a proximate event butwas seeded a long time ago when the policy of accelerating growth startedto be implemented in 1996. Sornette (2003) has synthesized a large body ofthe academic literature showing that the general reason for a crash or crisis israrely due to proximate causes but results from the progressive maturation andemergence of an unstable phase. When the unstable phase is ripe, basically anyperturbation may trigger the crisis. This concept allows to understand whyit is often so difficult to explain or understand the origin of the crisis or whyso many different explanations are sometimes advanced, when one insists insearching for a proximate origin. The fundamental origin based on a growinginstability could be called “emergent” and “systemic” in the jargon of thetheory of complex systems. For these, one needs to develop a description ofthe collective bottom-up behavior rather than attempting to find a smoking
10

gun.
An important question concerns the predictive power of such fits. We shouldstress that no precise timing can be claimed here, for instance by using thefitted tc as a prediction for an impending crash. Our analysis performed jointlyon the sales, earnings and prices can only be used to point to the approachof a change of regime which is indicated by the critical times. Results fromfitting procedures using truncated time series on general markets like the S&P500 have shown that, as a rule of thumb, the critical time tc can be “ratherrobust to approximately one year prior to a crash” (Sornette, 2003, p.330).The determination of the precise timing seems more complex for individualcompanies than for the overall market bubbles ending in crashes documentedin (Sornette, 2003), probably due to several factors: the interference with theglobal market mood, the coupling with the policy of acquisitions and themanipulations of the corporate performance data as well as other idiosyncraticfactors. Nonetheless it is striking to note that the above rule of thumb alsoappears to apply to the prediction of the critical times in 2002 from the salesdata (Fig. 2) when fitted by (6) and (7). Using a truncated fitting procedurethis result of a tc in 2002 appears to be rather robust. Although (6) alsopredicts a tc in 2002 for the earnings data, this is not a robust result. Thiscomes as no surprise since quarterly earnings data are much more subject tomanipulation showing no consistent results.
So, whereas the super-exponential growth of sales and earnings can not beexpected to give precise warnings of an impending crash within at most oneyear, combining these data with the stock market price evolution opens newpossibilities for advanced warnings. As shown in Fig. 4, 4-5 years before thecrash in 2002 the stock price has changed from super-exponential growth toa different oscillatory regime. It is also clear that the transition from thesuper-exponential growth to the crash did not proceed directly but through anintermediate regime punctuating the evolution. The model we discuss belowsuggests an interpretation in terms of a variation with time of the opinionformation process among investors after the peak of the bubble, during thecritical zone and then during the crash. The important point of our analysisis to focus on medium-term evolutionary patterns rather than on short-termvagaries. This strategy leads to the possibility of recognizing years before theactual crash occurred that a company, while its sales and earnings are racingupward, is really moving through a critical zone which, if allowed to continue,makes a crash inevitable.
11

4 Weidlich’s model of opinion formation applied to the stock mar-ket
4.1 Motivation
To summarize, we have argued that the evidence of positive feedbacks on thesales, earnings and stock market price of Ahold can be characterized by theoccurrence of an apparent finite-time singularity. This singularity must be un-derstood as announcing a change of regime. Usually, this change of regimetakes the form of a break in the super-exponential growth which transitionsinto what we propose to define as a “critical zone.” The maturation of the crit-ical zone may last weeks, months to years (rarely), and is usually followed bya catastrophic crash. Our motivation for introducing the concept of a “criticalzone” is based on the following.
• Previous related works have found that the crash does not immediatelyfollow the top of the stock market bubble but there is a transitional period(Sornette, 2003 and references therein).
• Models of rational expectation (RE) bubbles incorporating the mechanismof positive feedbacks (Johansen et al., 1999; 2000; Sornette and Andersen,2002) predict a very large crash hazard rate in the vicinity of the end of thebubble; in such models, there is an effective “critical zone” characterized bya very large risk of a crash, without the need for the price to continue toaccelerate. Since RE models of bubbles are only providing coarse-graineddescriptions, it would be interesting to develop finer models of this regime.
• There are general arguments to expect that a finite-time singularity isrounded by finite-size effects (Cardy, 1988) and by the triggering of neg-ative feedback mechanisms that were sub-dominant but come progressivelyinto play as the dynamics approach the singularity. This rounding may bepart of the “critical zone.”
We now turn to the development of a model of the “critical zone” and otherpatterns as well, based on Weidlich’s approach to social models using conceptsfrom synergetics, which we will use to describe and interpret the evolution ofAhold stock price.
4.2 Background of the Weidlich model
Synergetics was originally developed by the German physicist Hermann Haken(1983) to study the behavior of complex systems of any kind. Composed ofmany interacting parts, these systems, whether physical, biological or social,are known to be able to spontaneously form analogous spatial, temporal or
12

functional structures or patterns through self-organization. Since its focus isparticularly on what happens in those situations where complex system changetheir behavior qualitatively, Haken (2000) also considered synergetics as a the-ory of emergence of new qualities at a macroscopic level. The mechanismsunderlying the observed processes at non-equilibrium phase transitions andbifurcations are studied with concepts of instability, order parameters andslaving. The slaving principle yields the important insight that close to in-stability points complex systems are governed by a low-dimensional, thoughnoisy, dynamics (Haken, 2000).
Haken’s colleagues, Weidlich and Haag (1983), focused synergetics on socialscience applications such as the dynamics of the political opinion formationprocess and, in economics, on the non-equilibrium theory of investment behav-ior, also known as ‘Schumpeter’s clock.’ Studying the dynamics of two types ofinvestment projects, expansionary and rationalizing through a model that for-mally resembles the opinion formation model, Weidlich and Haag (1983) wereable to faithfully reproduce the evolutionary pattern of industrial strategicinvestment in Germany between 1956 and 1978. Under the title Sociodynam-ics, Weidlich (2000) published an elaborated version of the formal opinionformation model and included further examples of patterns of political phasetransition and destabilization which are accompanied by unpredictable criticalfluctuations where ‘anything can happen.’ The formal model, though relativelysimple, is very powerful and has also been applied to the phenomenon of lock-in of a dominant technology in a situation of competing technologies (Arthur,1994) and the inverse phenomenon of the lock-out of a dominant technologyor product through disruptive innovations (Broekstra, 2002).
We will here closely follow Weidlich’s (2000) extended formal model of opin-ion formation and political phase transitions which has a strong resemblanceto the dynamics of investors’ opinions or decisions as to ‘buying’ or ‘selling’shares in the stock market. Particularly, the discontinuity that occurs in thetransition from a liberal democratic to a totalitarian political system or viceversa (the lib-tot phase transition) is argued to have a close analogy to thedevelopment of bubbles and crashes in the financial markets. Political phe-nomena like public pressure to conform to the ruling ideology on the one handand dissident behavior on the other can equally be transferred to the economicdomain where the combination of imitation pressures and herding on the handand idiosyncratic or contrarian behavior on the other may be responsible forpotentially unstable situations in stock markets (Sornette, 2003).
Simple models of dynamic behavior of investors in the stock market considerinvestors to be in one of only two possible states, such as ‘buy’ or ‘sell,’ ‘opti-mistic’ or ‘pessimistic,’ and ‘bullish’ or ‘bearish.’ In addition, several modelshave considered at least two types of investors such as ‘trend followers’ and‘value investors’ (e.g. Farmer, 1998; Lux and Marchesi, 1999; Levy et al., 2000;
13

Ide and Sornette, 2002). Here, we will not assume from the outset that thereare two rigid types of investors who basically account for positive and negativefeedback processes, but we will introduce parameters for a population of in-vestors holding ‘buy’ or ‘sell’ opinions. These control parameters can co-evolvewith the order parameters to determine the degree of public conformity withthe prevailing opinion, which influences the degree of imitation and herding,and the personal inclination to approve or disapprove of the prevailing opinion,which governs the degree of affirmation or dissidence with it. This allows us toinvestigate all possible patterns of evolution of share prices and, particularly,the complete patterns of destabilization of the price trajectories other thanbubbles and crashes alone. We will show that, because of the flexible psychol-ogy of investors, the dynamics of one of the parameter of the model controllingtrends will play an important if not decisive role. Describing the dynamics ofsuch control parameters in an endogenous manner massively complicates thestructure of the model. Furthermore, it will not be simple to find plausiblesystems of equations of motion for them. Such equations would also have todepend on the global economical and political situation, i.e., not only on theendogenous variables described below following Weidlich (2000). Therefore,we choose the simpler but efficient method (also used in the Schumpeter clockmodel (Weidlich and Haag, 1983)) to distinguish different time periods, eachwith plausibly chosen trends to evaluate the stock price evolution of Ahold.This requires a careful interpretation based on detailed information on thehistorical development of the Ahold drama.
Naturally, a lot of attention has focused on the development of bubbles andcrashes, but hardly to what happens in the time period right after a super-exponential growth spurts, when the bubble has run out of steam, and beforea crash may occur. This intermediate stage preceding a crash turns out to bea period of increasing destabilization, which may take weeks, months or years.Furthermore, a lot more attention has been given to stock market indices thanto the fate of individual companies.
4.3 The evolution equations of majority and personal opinions
We first consider the evolution of the so-called “investors’ configuration”,nB(t), nS(t), where it is assumed that at a given point in time the sumof the time-varying numbers of buyers nB(t) and sellers nS(t) is a constantand equal to 2N . The investors’ configuration can then be defined by thenormalized variable y(t) defined by
y(t) =nB(t)− nS(t)
2N, where − 1 ≤ y(t) ≤ 1 . (9)
14

When y(t) = 0, the two types of investors holding opinions ‘buy’ or ‘sell’ arein balance: nB(t) = nS(t). Supply and demand are equal and the share priceremains constant. If the number of buyers is larger (smaller) than the numberof sellers, y(t) > 0 (resp. y(t) < 0), then demand exceeds (resp. is lower than)supply and the price will go up (resp. down).
Investors may hold a personal inclination or preference concerning buying orselling, which may approve or disapprove of the prevailing opinion. For exam-ple, during a bubble formation when the psychology of herding and imitationtakes over, traders may be forced to conform to pressures from their clients tobuy even when they privately disapprove. This effect is taken into account bya personal preference variable mi(t) where i is either the ‘buy’ or ‘sell’ state,such that a value mi(t) > 0 describes an individual’s personal preference forthe i-th state, a value mi(t) = 0 describes inner neutrality to the state i; avaluemi(t) < 0 describes personal disapproval of the i-th state. Assuming thatmB = −mS = m(t) varies between limits, −M ≤ m(t) ≤ M , a normalizedvariable (the personal preference index) is introduced
x(t) = m(t)/M , where − 1 ≤ x(t) ≤ 1 . (10)
If x(t) = 0, personal preferences towards buying and selling are neutral; ifx(t) > 0 (resp. x(t) < 0), personal inclinations are to approve of the prevailingopinion to buy (sell) and disapprove of selling (buying). The more positive ornegative x(t) is, the stronger the growth of the personal preference towardsone or the other position.
The quantities that govern the dynamics of investment decision making arethe individual transition probabilities per unit time period of a ‘buy’ to a ‘sell’state or opinion and vice versa, and the individual transition rates of the per-sonal preference towards higher (lower) values of approval or disapproval. Anindividual changes its opinion randomly depending on the aggregated averageopinion found in the population and on his own opinion. Thus, individuals donot interact directly at the micro level, but indirectly via the macro level (seefor instance Helbing, 1992 for a generalization including pair interactions).In Weidlich’s (1983, 2000) theory, an ensemble of configurations is consideredwhere each is a homogeneous population of 2N investors. The probability dis-tribution over these configurations p(x, y; t) is then defined as the probabilitythat one sample configuration has the configuration x, y at time t. A nonlin-ear differential equation is then defined, the master equation, which describesthe changes of the probability distribution over time. For further details thereader is referred to Weidlich (2000; see also Broekstra, 2002).
Approximate solutions to the probabilistic master equation can be obtainedby considering the quasi-meanvalue equations for the mean evolution of theorder parameters x and y. This is the approach followed here. However, for afuller understanding of the origin of the quasi-meanvalue equations to follow,
15

it is noted that Weidlich (2000) proved without loss of generality that thetransition rates must be of the form m exp(u(final) − u(initial)), where m isa mobility factor and u(initial) and u(final) are utility functions dependingon the system variables and personal state before and after the transition.The actual form of the utility function still has to be determined and, forreasons of simplicity, was based by Weidlich on a linear dependence on thenumber of investors holding the ‘buy’ or ‘sell’ opinion (Weidlich, 2004, privatecommunication). The quasi-mean value equations consist of a system of twononlinear differential equations for the normalized personal preference x(t)and investors configuration y(t) (Weidlich, 2000):
dy
dt=sinh(κy + γx)− y cosh(κy + γx) , (11)
dx
dt=µ [sinh(βy)− x cosh(βy)] . (12)
To simplify the notations, x and y are now to be read as mean values and thetime t is also a scaled variable. Equations (11) and (12) have four parametersκ, γ, β and µ, which describe behavioral trends and express the investors’psychology. We will treat them as constant in each relevant regime.
κ is a parameter coupling individuals to the majority. We refer to it as thecoupling or conformity parameter. If positive, it strengthens the investors’personal readiness to conform to the majority opinion. If it is high, then theinfluence of a ‘buy’ majority on an individual transition from ‘sell’ to ‘buy’ ishigh. Inspection of Eq.(11) shows that if y > 0, the existing majority opinionto ‘buy’ further favors transitions from ‘sell’ to ‘buy’, and similarly discouragesthe inverse transitions. As we will see, if κ attains a critical value, a herdingprocess starts which can lead to a bubble. Conversely, if κ > 0 and y < 0, amajority opinion to ‘sell’ will put pressure on individual investors to conformby changing their position from ‘buy’ to ‘sell’. As Eq.(11) shows, the evolutionof the majority also depends on the investors’ personal preference x. Clearly,with γ > 0 and personal preference x is positive, these effects will be reinforced.If however x < 0 and investors tend to personally disapprove of the majority‘buy’ position, this will diminish the effect of the majority pressure to conform.In fact, this idiosyncratic or contrarian inclination, which Weidlich (2000)called a ‘dissidence propensity’ in the case of a political opinion formationprocess, may eventually lead to the destabilization of the system.
The inclination parameter β governs the evolution of the personal preference.If positive, it measures an approving tendency and, as Eq.(12) shows, whenthe majority y > 0 favors the ‘buy’ decision, the evolution of a positive xwill be reinforced stabilizing the majority opinion. However, if β is sufficientlynegative, that is, attains a critical value, the dissident propensity may lead to astrong tendency to personally disapprove of the existing situation, eventually
16

leading to a negative x, which in turn may lead to a destabilization of themajority position.
The preference influence parameter γ determines the strength of the influenceof the personal preference x on the evolution of the majority opinion, and µ is aparameter which determines the speed of evolution of the personal preferencerelative the speed of evolution of the majority opinion y. In other words, µis the ratio of the characteristic time scales of the dynamics of the majorityopinion to the dynamics of personal preference. A small (large) µ correspondsto a slow (fast) adjustment of personal preference to majority opinion.
We complement this system (11) and (12) by an equation for the price. Wemake the simplified assumption that the mean individual order sizes OB forbuyers and OS sellers are equal and constant, such that OB = −OS = O. Then,the net order size of the population is Ω(t) = nBOB + nSOS = O(nB − nS) =2NOy(t), using (9). Dividing both sides by the size 2N of the population, weobtain the scaled linear equation for the net order size per agent
ω(t) = αy(t) (13)
where α is a positive constant. If supply and demand balance each other,y(t) = 0, and the net order size equals zero. If buyers prevail over sellers (orvice versa), y(t) > 0 (y(t) < 0), the net order size is positive (negative). Tomake the theory simple, we assume following many previous workers that themarket impact function which relates the logarithm of the stock price P tothe net order size Ω reads
d lnP (t)
dt= Ω(t)/L , (14)
where L is some ‘market depth’ assumed to be constant. Scaling this equation,and henceforth for reasons of convenience using the notation p(t) for lnP (t)for the mean value of the stock price, in the numerical integration we used thesimple equation for the logarithmic stock price evolution
dp(t)
dt= ay(t) , (15)
where a is a positive constant. This expression (15) implies that the logarithmp(t) of the price is proportional to the integral of the majority opinion or-der parameter y(t) and reciprocally y(t) is proportional to the market returndp/dt. The system we study below is thus made of (11), (12) and (15).
Using expression (15) to eliminate y(t) in the r.h.s. of (11) and (12) offers aninteresting interpretation of the opinion formation process in stock markets:the proxy for the majority opinion y(t) is indeed the stock market returndp/dt which is the major factor influencing the dynamics of the opinions. The
17

following quip “in the long run, markets are weighing machines, but in theshort term, they are voting machines” is often attributed to B. Graham andW.Buffet. This quote exemplifies why the theory of Weidlich developed to modelopinion formation processes can indeed be a useful model of stock market priceevolution at short and intermediate times. At long times, economic factors andfundamental valuations have to be introduced, giving a competition betweenthe “voting” and “weighing” properties of the stock market.
4.4 Stability analysis
The analysis of Eqs.(11) and (12) reveals that the evolution equations exhibitfive singular points, that is, points where the left-hand side derivatives becomeequal to zero (Weidlich and Haag, 1983; Weidlich 2000). Stability analysis ofthe behavior of x(t) and y(t) in the vicinity of the singular point (x, y) = (0, 0)is of particular interest because it deals with the possibility of deviation froma balanced situation where the number of buyers and sellers is equal andtheir personal preference towards either decision is neutral. When adding noise(stochastically), this stationary point (0, 0) corresponds to the random walksituation and the question whether it is a stable or unstable point becomesimportant to detect the emergence of a runaway bubble or crash. Withoutgoing into further detail we will just state the following stability conditions(see Weidlich, 2000).
The stationary point (x, y) = (0, 0) is stable if and only if
κ < 1 + µ and β < (1− κ)/γ . (16)
The stationary state (0, 0) is thus unstable if at least one of the two inequalitiesin (16) is broken. These conditions (16) express that a balanced situation cancontinue to exist only if the pressure κ to conform to the majority opinion isrelatively small, while simultaneously the personal inclination β to approve ordisapprove also remains small. Starting from a small degree of conformity, ifκ > 0 starts to grow meaning that the tendency to herd starts to increase,condition (16) shows that the value of β has to become increasingly smallerand even negative, indicating that the degree of dissidence among investorsneeds to increase in order for the point (0, 0) to remain stable. However, if κexceeds the critical threshold value 1+ µ, whatever the amount of dissidence,(0, 0) becomes an unstable stationary point, and a runaway situation, wherethe market locks in on either a bull market or a crash, may result. As (16) alsoshows, if β exceeds a critical value even if κ has not, (0, 0) becomes unstable.This is reasonable to find that too much dissidence can equally destabilize theneutral point.
Finally, a limit cycle solution or attractor of the mean value equations exists
18

if at least one of inequalities in (16) is broken and if in addition
β < −(µ+ κ− 1)2
4µγ< 0 (17)
holds.
4.5 Classification of evolution patterns
The system of Eqs. (11) and (12) was numerically integrated using a 4th orderRunge-Kutta scheme, for a number of different values of the parameters. In thenumerical integrations presented below, we have used a scaled time step of 0.01throughout. The numerical integrations have allowed us to classify four basicpatterns of evolution of the mean values of the investors configuration y(t),of the personal preference x(t) and of the price p(t), for different parametervalues. First, to attain some basic insights, we will keep the trend parameters κand β constant. However, during transitions, it is more reasonable to assumethat particularly the trend parameters κ as a measure of herding pressureand β as a measure of the degree of dissidence will co-evolve with the systemvariables. This will be dealt with in the next section when we discuss theevolution of the stock price value of Ahold.
4.5.1 Pattern A: (0, 0) stability and ‘random walk’
This pattern is exemplified in Figure 5, where a large negative initial valueof y(0), a sudden preponderance of sellers over buyers, is quickly restored tothe balanced situation. Due to the large negative, disapproving β used in thisexample, the personal preference index x becomes highly positive, driving theout-of-balance situation quickly back to normal. Furthermore, since β = −4 <−(µ+κ−1)2/(4µγ) = −0.8, condition (17) indicates that we may expect thatthe return will occur in an oscillatory manner. In contrast, for example withβ = −1, the y-trajectory will approach the (0, 0) state somewhat more slowly,but without oscillations.
As a response to the sudden strong ‘sell’ mood in the market, the stock priceevolution drops sharply and, with diminishing selling pressure, approaches inan oscillatory manner a new stable value. This is reminiscent of a suddenlarge sell-off of some company stock which unexpectedly publishes some badnews but, where due to insufficient conformity or herding pressure and animmediate reaction opposing the irrational sell-off, the damage is limited toa price drop to a new stable though lower level representing the new pricediscounting the novel piece of news. This behavior of a sharp drop followed bydamped oscillations converging to a well-defined lower plateau is also observed
19

0 2 4 6 8 10−1
−0.8
−0.6
−0.4
−0.2
0
0.2
0.4
0.6
0.8
1
x
y
p
t
Fig. 5. Evolution Pattern A when (x(t), y(t)) = (0, 0) is a stable stationary state.This simulation corresponds to µ = 2, γ = 1, κ = 1.5, β = −4, and a = 1. Sinceκ = 1.5 < 1 + µ = 3 and β = −4 < (1− κ)/γ = −0.5, according to condition (16),(x, y) = (0, 0) is a stable stationary state and any deviation from it will quicklyreturn to that state. For reasons of presentation, in this and the following figures,the logarithm of the stock price p(t) starts at an arbitrary initial point p(0).
very clearly for the crash of October 1987, for instance in the US (see figure3 of (Sornette et al., 1996) reproduced here as figure 6). Symmetrically, if theinitial condition for y(0) is positive, the average opinion y(t) decreases sharplyto 0 and there is an increase of the stock price level.
To compare with empirical data, one needs to re-introduce a stochastic compo-nent, for instance in the form of an additive white noise to the right-hand-sideof expression (15) (Weidlich, 2000). In this case, the fact that (0, 0) is stablecorresponds to the log-price p(t) following a random walk.
4.5.2 Pattern B: “the CEO’s dream”
As shown in Figure 7, this is an interesting situation because the opposingtendency β is too weak to prevent a runaway situation to occur. In the stockmarket, this represents the bullish formation of a bubble as the price trajec-tory indicates. In terms of investors’ behavior, the value analysts lose to thetrend followers. Eventually, this leads to a new stable state for y where thebuyers form a large majority, while simultaneously personal preference settlesat a negative stationary value which is not big enough to defuse or destabilizethe bubble. Weidlich (2000) discussed this scenario in the context of the tran-sition of a liberal to a totalitarian state. He called it quite appropriately ‘thedictator’s dream,’ because while the pressure to conform is moderate, due toa too small opposition of dissident opinion, it is enough to transform a liberalsituation into a completely totalitarian state. Likewise, in the stock market,this situation of a bullish market could be called the CEO’s dream.
20

200
220
240
260
280
300
320
87.8 87.82 87.84 87.86 87.88 87.9
S&P 500
time(year)
Fig. 6. Time evolution of the S&P 500 index over a time window of a few weeksduring and after the crash of October 19, 1987. The fit with an exponentially de-caying sinusoidal function suggests that a good model for the short-time responseof the US market is close to single dissipative harmonic oscillator. Reproduced from(Sornette et al., 1996).
A more precise analytical understanding of this regime can be obtained byneglecting x in expression (11). Starting with a small initial value y(0), theinitial growth of the global opinion follows
dy
dt≈ κy+
1
6κ3y3−y
(
1 +1
2κ2y2
)
+O(
y5)
= (κ−1)y+(
κ
3− 1
)
κ2
2y3+O
(
y5)
,
(18)up to third order in y. As long as y is small, it first grows exponentially(corresponding to the first linear term (κ − 1)y) for κ > 1. This first regime
21

0 5 10 15 20−1
−0.8
−0.6
−0.4
−0.2
0
0.2
0.4
0.6
0.8
1
x
y
p
t
Fig. 7. Evolution Pattern B: Illustration with µ = 2; γ = 1; κ = 1.5; β = −0.25;a = 0.5. Since κ = 1.5 < 1 + µ = 3 and β = −0.25 > (1 − κ)/γ = −0.5, condition(16) is broken and (x, y) = (0, 0) is unstable. The limit cycle condition (17) does notapply since b = −0.25 > −(µ+κ−1)2/(4µγ) = −0.8. Note the upward curvature ofthe log-price p(t) exemplifying the super-exponential growth discussed in the text.
translates also into an initial exponential growth of the log-price p(t) andthus to an exponential of an exponential growth of the price. This is a clearsuper-exponential growth characterizing a bubble (Sornette and Johansen,2001; Sornette, 2003; Johansen and Sornette, 2004). Such exponential of anexponential law, proposed to describe phases of accelerated hyperinflation,has been shown to be essentially indistinguishable from power law growthleading to an apparent finite-time singularity of the form (6); actually, thediscretized version of an accelerated growth leading to (6) can been shown tobe an exponential of an exponential growth (Sornette et al., 2003).
Then, as y grows, the nonlinear term starts to dominate and leads to an evenfaster transient super-exponential growth if κ > 3. For instance, if the cubicnonlinearity held throughout the dynamics with κ > 3, this would give riseeventually to a solution at later times of the form y(t) ∼ 1/(tc − t)1/2 clearlyexpressing the super-exponential behavior characteristic of bubbles. In thiscase, the log-price would becomes of the form (6) with m = 1/2 by integrationof (15). However, as y(t) increases and becomes a finite fraction of 1, theapproximation (18) becomes inaccurate as y saturates and converges to thestable fixed point y∗ < 1, solution of sinh(κy) − y cosh(κy) = 0. A constantasymptotic value of y then translates into a linear growth of the log-price p(t)and thus to an exponential growth of the price. This suggests that the super-exponential characteristic of a bubble is, according to Weidlich’s theory, onlya transient regime.
There are additional factors to consider. In addition to the saturation mech-anism captured by the second term y cosh(κy + γx) in the r.h.s. of (11), thesuper-exponential growth of the stock price may be halted in many cases before
22

the new stationary state of y is reached where a large majority of investors arebuyers. As shown below, at some time during the formation of the stock pricebubble, although initially supportive, some investors will personally becomeincreasingly worried despite the herding pressures, and the contrarian inclina-tion β is likely to become more strongly negative. Likewise, the totalitarianswill become more bullish and κ may also increase. This emerging battle be-tween the degree of personal opposition β and the degree of public conformitypressures κ, between order and disorder, will eventually induce a critical phaseof destabilization of the bubble. Note that this reasoning amounts to add pos-itive feedbacks of the opinion and price dynamics on the control parametersof the contrarian inclination β and public conformity pressures κ.
Finally, note that pattern B reproduces the well-known lock-in through fluctu-ation situation in cases where, rather than two opposing opinions, two compet-ing new products or technologies through some random fluctuations in marketshare declare one winner, who takes it all, and one loser (Arthur, 1994; Broek-stra, 2002). In other words, if in Figure 7 the initial condition would havebeen slightly negative rather than positive, the symmetrical situation of astock market crash would have been developed resulting in a new stationarystate of a high majority of sellers. This sensitivity to initial conditions is alsocaptured by Ising-like models of opinion formation (Sornette, 2003, Fig.4.10)associated with the presence of a critical point around which the collapse intoone of two states bifurcates essentially randomly.
4.5.3 Pattern C (“critical zone”): the destabilization regime ending in a col-lapse
0 5 10 15 20 25 30−1
−0.8
−0.6
−0.4
−0.2
0
0.2
0.4
0.6
0.8
1
x y p
t
Fig. 8. Evolution Pattern C: Illustration with µ = 2, γ = 1, κ = 3.5, β = −4, anda = 0.5. Since κ = 3.5 > 1 + µ = 3 and β = −4 < (1− κ)/γ = −2.5, condition (16)is broken and (x, y) = (0, 0) is unstable. The limit cycle condition (17) applies sinceb = −4 < −(µ+ κ− 1)2/(4µγ) = −2.5.
Rather than an abrupt transition point, there exists a transition range between
23

relatively small negative values of β below the limit cycle condition (−2.5 <β < 0), where y swiftly approaches one of two opposing new stationary states,and relatively high negative values of β < −4.1, where a true limit cycle and astable attractor appears (see pattern D below). This transition range reflectsthe dependence of the exact pattern of evolution on the initial conditions.Within this transition range −4.1 < β < −2.5, starting from low values of|β| and small initial conditions for y, with increasing |β|, one observes anincreasing number of oscillations of increasing amplitude which all end in abreakdown characterized, depending on the initial conditions, by one of twoopposing stationary states of large positive or negative y.
Figure 8 shows a typical Pattern C in which, starting from small initial con-ditions, both x and y show increasingly larger and opposing oscillations untila sudden breakdown occurs. This typical pattern where the stationary state(0, 0) has become unstable and whose unstable oscillatory growth ends in acollapse deserves the name “destabilization regime.” The stock price shows asimilar pattern of increasing oscillations ending in a crash. This destabiliza-tion regime which acts a precursor to an inevitable collapse only occurs underthe condition of strong herding pressures, κ = 3.5 > 1 + µ. This is in quali-tative correspondence with previous observations of the ubiquitous existenceof oscillations of increasing amplitudes preceding crashes, which have alsobeen interpreted as the signature of strong herding pressure (Sornette et al.,1996; Sornette and Johansen, 2001; Sornette, 2003). The tendency to stronglyconform with the prevailing majority is fueled by exogenous factors like theoverall market mood, as happened during the bull market of the late 1990s,but also endogenous factors like announcements of acquisitions and manage-ment promises of significantly increased earnings. As we will see below, Aholdis a case in point.
−1 −0.5 0 0.5 1−1
−0.8
−0.6
−0.4
−0.2
0
0.2
0.4
x
y
Fig. 9. Phase portrait in the x(t); y(t) phase space, corresponding to Figure 8. Thestable limit cycle for β = −4.2 is shown as the elliptic-like attractor. The spiralingtrajectory is for β = −4, which falls in the destabilization regime. It starts near theorigin and escapes the basin of attraction at the lower right end, corresponding tothe collapse discussed in the text.
24
A better understanding of Pattern C can be obtained from its phase portraitin the x(t), y(t) phase space. Figure 9 shows the stable elliptic-like attractorfor a slightly higher negative value β = −4.2, other parameters being equal.When started from conditions close to the unstable stationary state (0, 0), alltrajectories stay within the domain of attraction and converge towards it. Thisleads to a stationary limit cycle (see Pattern D below). Note that the attractoris somewhat deformed at its far ends, tipping slightly upward on the far leftside, and downward on the far right side. Increasing β slightly to −4, as shownabove, enters the transition range characterized by trajectories starting closeto (0, 0) as shown in Figure 9: after a number of increasing oscillations, thetrajectory escapes at the far end from the attractor to collapse in the lowerright bottom of the (x, y) phase space. Under different initial conditions, thetrajectory may also escape from the upper far end on the left side to the upperright corner of the phase space.
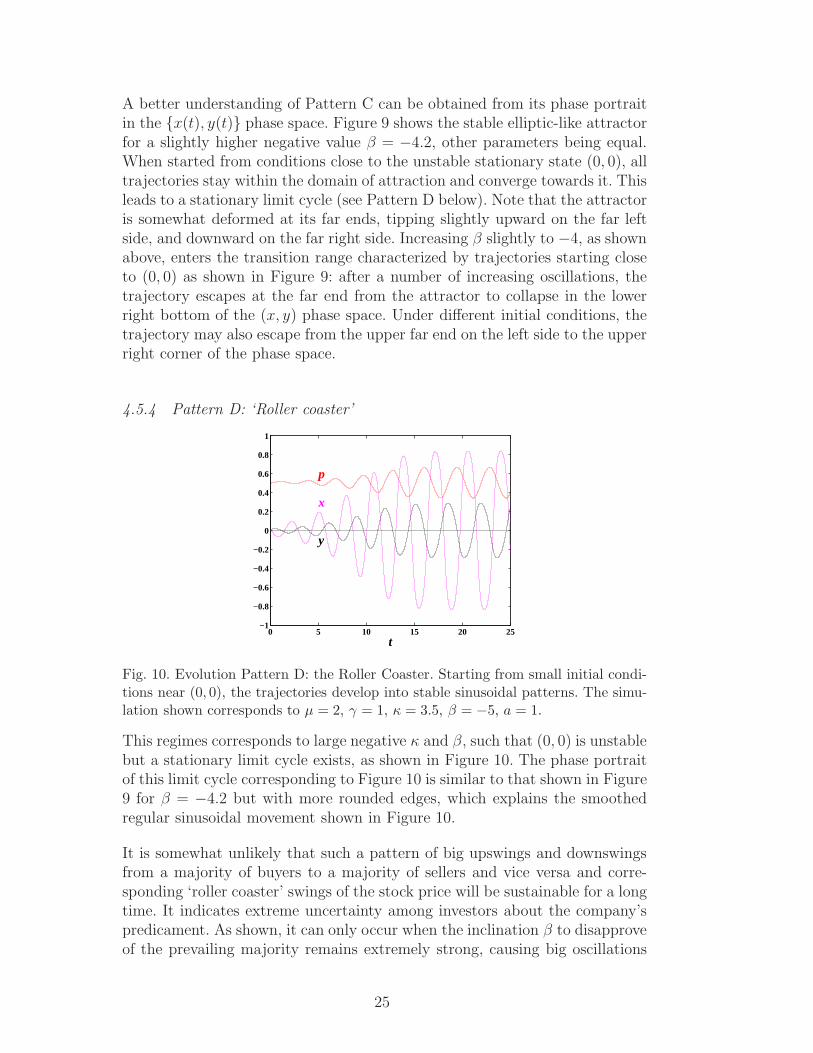
4.5.4 Pattern D: ‘Roller coaster’
0 5 10 15 20 25−1
−0.8
−0.6
−0.4
−0.2
0
0.2
0.4
0.6
0.8
1
x
y
p
t
Fig. 10. Evolution Pattern D: the Roller Coaster. Starting from small initial condi-tions near (0, 0), the trajectories develop into stable sinusoidal patterns. The simu-lation shown corresponds to µ = 2, γ = 1, κ = 3.5, β = −5, a = 1.
This regimes corresponds to large negative κ and β, such that (0, 0) is unstablebut a stationary limit cycle exists, as shown in Figure 10. The phase portraitof this limit cycle corresponding to Figure 10 is similar to that shown in Figure9 for β = −4.2 but with more rounded edges, which explains the smoothedregular sinusoidal movement shown in Figure 10.
It is somewhat unlikely that such a pattern of big upswings and downswingsfrom a majority of buyers to a majority of sellers and vice versa and corre-sponding ‘roller coaster’ swings of the stock price will be sustainable for a longtime. It indicates extreme uncertainty among investors about the company’spredicament. As shown, it can only occur when the inclination β to disapproveof the prevailing majority remains extremely strong, causing big oscillations
25

in personal preference. However, the slightest drop of |β| will cause the systemto fall back into the destabilization regime ending in a collapse (Pattern C).
4.5.5 Summary of the classification of patterns
Let us now summarize the obtained classification in four fundamental patternsof evolution. As long as the conformity parameter κ remains sufficiently smalland less than 1 + µ, indicating little propensity among investors to herd, andas long as the inclination parameter β remains also below its threshold (1 −κ)/γ, counteracting as it were any inclination to herd, the stability condition(16) for (0, 0) applies and nothing much interesting happens. This is PatternA. However, if the stability condition (16) for (0, 0) breaks down, either theherding pressure exceeds the critical value 1 + µ, or if it does not but thecounteracting disapproval parameter β is insufficiently strong, the investors’system locks into a runaway situation. Whether this is a bubble or a crashsensitively depends on the initial conditions. This is evolution Pattern B.
If the stability condition (16) breaks down, and for a given herding pressureκ, when the inclination parameter β becomes sufficiently negative so thatcondition (17) applies, a broad transition range of β values appears betweenunstable growing oscillations ending in a run-away (Pattern C) for smallervalues of |β| and a stable limit cycle for sufficiently large |β| (Pattern D).Pattern C is the more interesting pattern particularly when the bullish rise ofthe stock price is temporarily halted in a moment of hesitation, and accordingto Eq.(15), y(t) becomes equal to zero. Within the transition range, it appearsas if a climate of escalation between trend followers and value investors inducesa destabilization regime which acts as a precursor to an inevitable collapse(Sornette et al., 1996; Sornette and Johansen, 2001; Sornette, 2003).
The specifics of the basic evolution patterns are also governed by the speedand influence parameters µ and γ. To simplify the discussion, we have keptthem constant throughout.
As already indicated, in actual practice, the conformity and personal inclina-tion parameters κ and β will not remain constant but will change under theinfluence of or co-evolve with changes of x(t) and y(t). This would require theintroduction of evolution equations for these parameters, thus complicatingthe model considerably not in the least because it will also introduce aspectsof chaos dynamics. A simpler approach, which has the advantage of bringingout the essence of what is involved, is to change parameters discontinuously.Weidlich and Haag (1983) has successfully applied this method in reproducingthe strategic investment evolution in Germany (see also Weidlich, 2000). Wehave followed this approach to reproduce the qualitative and main features ofthe Ahold stock price evolution. In this way, we propose an interpretation and
26

understanding of what happened.
5 Interpretation of the stock price evolution of Ahold
Figure 11 shows the result of a simulation using Weidlich’s equations (11) and(12) performed to reproduce the basic qualitative features of the Ahold stockprice evolution. For this, four phases are distinguished, each characterized witha different pair (κ, β).
0 5 10 15 20 25 30 35 40−0.8
−0.6
−0.4
−0.2
0
0.2
0.4
0.6
t
p
Fig. 11. This figure shows a simulation of the log-price using Weidlich’s equations(11) and (12) performed to reproduce the basic qualitative features of the Aholdstock price evolution shown in Figure 4. To obtain the corresponding log-price tra-jectory, four stages can be distinguished in which each time just one parameterwas changed discontinuously. The parameters µ = 2, γ = 1, and a = 0.5 are keptconstant throughout the simulation. Only κ and β are changed.
5.1 Phase 1 (time period: 0 ≤ t ≤ 12, i.e. 1993-mid 1997): κ = 1.5, β =−0.25 (Pattern B)
This regime corresponds to Pattern B, in which a bullish super-exponentialprice rise occurs because of relatively moderate herding pressures which arenot counteracted by a sufficiently strong personal disapproval. This is theCEO’s dream. From roughly 1995/1996 onwards, the stock market as a whole(the AEX) had become increasingly bullish. So Ahold was riding the bull whenit accelerated its growth strategy during that period. In the third quarter of1996, due the consolidation of the large American supermarket chain Stop &Shop, the quarterly net earnings increase, which during the preceding periodin the 1990s usually remained well below 20%, discontinuously rose to 54%,initiating a new period of (promises of) considerably higher increases in bothsales and earnings.
27

5.2 Phase 2 (time period: 12 < t ≤ 14, i.e., mid 1997-end 1997): κ = 1.5, β =−4 (Pattern A)
At some point in time for some reason, investors hesitate and the stock pricereaches a first peak. Perhaps fear of heights and/or a decrease in the stockmarket as a whole (the AEX showed a peak followed by a temporary decline inmid 1997) have increased investors’ wariness and fueled the contrarians. Justby decreasing β from a weak (β = −0.25) to a more strongly disapprovingpropensity (β = −4), the herding pressure is temporarily counteracted suchthat the stability condition for (0, 0) applies and Pattern A occurs (actuallythe inverse of the example given in Fig.5). After a peak in the stock price,when y(t) = 0 (see Eq.(15), the bullishness quickly returns with a vengeanceleading to phase 3.
5.3 Phase 3 (time period: t > 14 until p(t) drops below p(0), i.e., 1998- end2002): κ = 3.5, β = −4 (Pattern C)
Keeping the degree of dissidence high, β = −4, but now increasing the herdingpressures from κ = 1.5 to 3.5, indicating both the general bullish markettendencies and investors’ expectations about the company, Pattern C comesinto play. By the end of 1997, Ahold had completed its first peak and a newupward trend occurred. This point in time could be regarded as the start ofthe destabilization regime which became increasingly clear over time whenfurther oscillations occurred. This was the precursor for the collapse of thestock price in 2002 followed by a final blow due to the publication of fraud inFebruary 2003.
In general, it is not unlikely that top management fuels the dynamics of Pat-tern C, by raising expectations of increased earnings in the investors’ com-munity. For example, before 1996, the year the growth rate accelerated, theannouncement that ‘further increases’ in earnings (per share) were expectedwas the standard statement in press releases of Ahold. After the report ofthe unprecedented 54% earnings increase in the third quarter of 1996, an-nouncements were upgraded in terms of ‘significantly’ or ‘considerably higherearnings’ that could be expected. Finally, the company became daringly pre-cise and bullish by announcing as of March 1999 that its outlook for the wholeyear foresaw an expected earnings per share growth of at least 15%.
However, 1999 was also the year that Ahold’s stock price declined 44% froman all time high of 38.5 euro in April to a low of 21.2 euro in February 2000,while in the same period the Dutch stock market index AEX showed an overallupward trend and appreciated by more than 20%. The start of this downward
28

trend could have made Ahold’s top management somewhat nervous, and in anunprecedented statement, the company included an upbeat quote of its CEOin its 10 June 1999 press release, covering the Q1 1999 results and outlook for1999, saying that the prospects were excellent and that the company was wellon course. A statement like this could, of course, fuel the conformity pressurestowards bullishness.
On the other hand, a growing skepticism may have developed among investorswho were concerned by the overvaluation of the stock and disapproved of achange in management strategy. This happened in 1999 to Ahold, after thefailed takeover of yet another supermarket chain (Pathmark in the USA), whenit announced the acquisition of US Foodservice at the end of 1999. Some an-alysts (including Standard & Poor’s) disapproved of this change of course tothe unfamiliar non-core activities of the wholesale food service industry. Also,early 2001, the dollar started its decline, which may have increased investors’degree of disapproval throughout the last part of the destabilization phase.This situation of increasing opposing tendencies is reflected in the relativelyhigh values of the conformity parameter κ and the negative inclination pa-rameter β, which are responsible for the destabilization as a precursor to theunavoidable collapse of the stock price as shown above in Pattern C and Figure11.
The year 1999 appears to have been a critical year. With the destabilizationwell on its way (according to our classification), Ahold’s stock price continuedits overall decline in 1999 until the higher increase of net earnings of 37% in1999 (compared with 29% in 1998) was reported in March 2000. This togetherwith the future consolidation of US Foodservice and other acquisitions in 2000(other food service companies and PYA/Monarch in the USA among others)in 2000 were expected to further enhance growth. By then, the AEX wasalso on a final growth spurt which ended early September 2000 when themarket started its long decline. The Ahold stock price then started its lastmini-bubble, undoubtedly fueled by these expectations of higher earnings. Asbecame evident in 2003, however, these turned out to be misplaced, and thecompany performance results had to be corrected downwards for 2000 and2001.
Qualitatively, the overall oscillating pattern of stock price evolution after thefirst peak is strikingly similar to that of Pattern C. Although Ahold priceshows a somewhat increasing trend in this regime, it should be noted that, forreasons of clarity, longer-term trend lines have been left out of the above simplemodel of patterns of evolution (see also Weidlich’s example of Schumpeter’sclock, 1983).
Pattern C shows that the increasing oscillations are a part of the destabi-lization of the bubble, which, if not defused in time, is the precursor for an
29

impending collapse as happened with Ahold. Pattern C is really the expressionof the age-old adage: What goes up, must come down.
5.4 Phase 4 (Beyond the time where p(t) drops below p(0): 2003- mid 2003):κ = 2.5, β = −4 (Pattern A)
Some time during the collapse of the stock price, here somewhat arbitrarilylocated at the point in time when p(t) drops below p(0), the herding pressureswill deflate, and we are back to Pattern A. In the process, the inclinationparameter β will also return to smaller values, but to keep to the essentials,for a return to the stability of (0, 0), it is already sufficient for the conformityparameter to drop below 1 + µ.
With phase 4, we have completed the description of a complete bubble usinga very simple synergetics model and Ahold as an example to demonstratethe power of the method. The discovery of the destabilization regime after abullish rise of the market enhances the possibility of developing early warningsignals by focusing on pattern recognition rather than on short-term gains.Would this knowledge have been available, in Ahold’s case, having spotted itsgrowth acceleration in 1996 to super-exponential proportions, as early as theend of 1997 when the first oscillation was completed and the next one started,investors could have become somewhat concerned about the consequences oftheir own bullishness by realizing that they were really riding the waves of aself-created destabilization regime which, if nothing changed, is the precursorof an inevitable collapse, sooner or later. But certainly by the end of 1999,the destabilization pattern C was quite evident and an eventual collapse couldonly have been prevented by defusing overheated expectations. This evidentlydid not happen, on the contrary, and the destabilization regime ran its courseending in a dramatic collapse of the stock price.
The paradoxical conclusion is that, particularly at times of overheated post-bubble stock markets where strong herding pressures are counteracted byequally strong contrarian propensities, companies are advised not to throwoil on the fire by overly raising or even manipulating expectations of higherearnings. Although it may go against the grain for ambitious CEOs, giventhe humans’ latent animal instinct to herd, cooling the stampeding crowd ofinvestors would be a far better policy in an attempt to defuse a dangerousdestabilization regime which acts as the precursor of a future collapse.
Destabilization is not an abstract phenomenon that is without consequencesfor the internal functioning of a company. Although this aspect requires furtherresearch, it is highly likely that in the case of Ahold starting in 1999 a certainloss of control became internally visible. For example, newspapers have re-
30

ported that the bookkeeping problems at US Foodservice were already knownin 2000. Dogmatic preoccupation with the growth strategy by top manage-ment, lack of adequate supervision by and short-term orientations of directorsand accountants alike prevented the internal consequences of the destabiliza-tion to surface in time.
5.5 Another corporate example: Aegon
The Dutch insurance group Aegon is one of the largest in the world oper-ating in three major markets of North-America, The Netherlands and theUnited Kingdom. Its net income for the year 2003 was 1.8 billion Euros ofwhich, like Ahold, the largest share is in the USA. Figure 12 shows anotherremarkable illustration of a similar sequence of phases as discussed for Ahold.The first regime is characterized by an upward curvature of the log-price ofAegon as a function of time, which is again a signature of super-exponentialgrowth, that culminated mid-1998. Then, a plateau decorated with oscillationsfrom mid-1998 to the beginning of 2001 can be represented rather faithfullyby the “roller-coaster” pattern D (fitted with a regular sinusoidal oscillationln[P (t)] = A+B cos(ωt+φ)). This second phase contrasts with the enthusiasmof investors of the first phase, as being a time of large uncertainty among in-vestors about the company’s future. Recall that this regime only occurs whenthe personal inclination β to disapprove of the prevailing majority remainsextremely strong. Then, the price seems to transition from pattern D to thecritical zone C ending in a crash. The subsequent behavior is reminiscent ofpattern A in which oscillations are progressively dampened towards an equi-librium point.
Figure 13 shows a schematic synthesis of the regimes after the bubble phase(Phase 1 and 2) which is basically similar to the Ahold simulation.
Phase 3 (time period 0 ≤ t ≤ 12): κ = 3.5 and β = −5. This is patternD, where after the bubble there are strong herding pressures and such strongdissident inclinations that β is beyond the transition range, and a stable limitcycle results. However, as suggested when we discussed Pattern D above, if thedisapproval starts to relax somewhat so that β falls back into the transitionrange, the stable wave quickly destabilizes and collapses. Although due to verystrong herding and dissidence pressures a stable limit cycle is produced, thedanger lures that, with the slightest relaxing of the pressures, the system islikely to fall back into the destabilization regime causing it to collapse.
Phase 4 (time period 12 < t ≤ 15): κ = 3.5, β = −4.1 (Pattern C). Withβ now in the transition range, the limit cycle destabilizes and, as can be seenfrom Fig. 13, the y trajectory starts to collapse causing a stock price crash.
31

90 91 92 93 94 95 96 97 98 99 00 01 02 03 04 050.5
1
1.5
2
2.5
3
3.5
4
t
ln[P
(t)]
Fig. 12. Aegon stock price as a function of time. The vertical axis uses a logarithmicscale while the horizontal axis uses a linear scale. The power-law fit to the data from1990/01/02 to tmax = 1998/07/21 gives tc = 2015/06/15, m = −5.40, A = 0.51, andB = 9.48× 10²⁰ with a r.m.s. of the fit residuals equal to χ = 0.078. The sinusoidalfit to the data from 1998/07/21 to 2001/03/20 gives ω = 0.0204, φ = 3.73, A = 3.69,B = −0.0959 with a r.m.s. of the fit residuals equal to χ = 0.0755.
0 5 10 15 20−0.8
−0.6
−0.4
−0.2
0
0.2
0.4
0.6
0.8
1
y
p
t
Fig. 13. Simulation of the stock price pattern of Aegon after the bubble with µ = 2,γ = 1, and a = 1.
This would continue indefinitely, so like in the Ahold case, when investorsbecome dizzy from falling so fast, the herding pressures will evaporate, andthe balance between buyers and sellers will return.
Phase 5 (time period t > 15): κ = 1.5, β = −4.1 (Pattern A). This isthe return to the (0, 0) stability zone, as exemplified in Figure 6.
32

6 Concluding remarks
We have documented the concept of super-exponential growth characterizingcorporate sales, earnings and stock market prices of companies such as Aholdand Aegon which developed a furious race for growth via aggressive acquisi-tions as well as creative accounting. These behaviors allowed these companiesto create extraordinary positive or bullish sentiments among investors, and tomanipulate these sentiments for the sake of growth feeding positively on itself.It is well-known that high stock prices help a company grow and reciprocallythe company’s growth fuels the stock prices: a high stock market price makesit easier to raise money, to acquire other companies, to attract high level col-laborators and employees and so on. As pointed out by Krugman (2002), ahigh stock price facilitates aggressive plans for growth as well as accountingtricks, making the growth similar to a Ponzi scheme. The innovation of our pa-per has been to propose a simple quantification of these unsustainable growthphases often reported at a qualitative or descriptive level.
We have adapted Weidlich’s theory of opinion formation to describe the forma-tion of buy or sell decisions among investors, based on a competition betweenthe mechanisms of herding and of personal opinion opposing the herd. A studyof this model has provided a classification of four different regimes/patternsfor the price, which have then be used to explain the price evolution of Aholdas well as Aegon, from the bubble phase to the final crash. This study comple-ments previous studies of bubbles holding that a crash is the most probableclose to the end of a bubble by introducing the concept of a “critical zone”corresponding to a transition from the super-exponential bubble to the crash.The critical zone is characterized by (i) herding and (ii) strong shift of senti-ments (or in other words, instabilities in the shift of sentiments). The criticalzone is characterized by a strong sensitivity on these herding and inclinationparameters and describes the maturation of an instability, that is, the comingcrash. These ingredients have allowed us to explain the trajectories of Aholdand Aegon by suitable choices of the herding and inclination parameters, ac-cording to scenarios and a succession of phases which are essentially identical.While we have focused on just these two cases in order to get sufficient depth,we conjecture that more studies on other cases will allow to strengthen andrefine our model.
Concerning the potential for prediction, the important point of our analysis isto focus on medium-term evolutionary patterns which leads to the possibilityof recognizing years in advance that a critical zone is unfolding following asuper-exponential bubble phase, which foreshadows a coming crash. We havebeen able to show from the power law fits of sales and earnings of Aholdthat about a year in advance a tc, which indicates a change of regime, waspredicted, i.e. a crash in 2002. About five years earlier, in 1997, while sales
33

and earnings were still in the super-exponential growth regime, the stock priceevolutionary pattern entered a critical zone characterized by a destabilizationregime that over the years became increasingly apparent and was bound toend in a crash as the remarkable Pattern C of the critical zone has shown. Ourfindings that the combination of these patterns, continuing super-exponentialgrowth of sales and earnings of a company that resembles an unguided missile,and a stock market which exhibits the collective intelligence and transparencyto indicate, at least as early as 1998, that the missile is out of control andmoving through a dangerous destabilization zone entails an important lessonfor top managers and investors alike.
Acknowledgments
We acknowledge stimulating exchanges with Emeritus Professor WolfgangWeidlich of the Institute for Theoretical Physics of the University of Stuttgart,Germany and help of Carel ter Ellen of Rabobank International in retrievingsome of the publicly accessible raw data. This work was supported by theJames S. McDonnell Foundation 21st century scientist award/studying com-plex system.
References
[1] D. Abreu, Bubbles and Crashes, Princeton Working Paper (2001)(http://ssrn.com/abstract=296701)
[2] W.B. Arthur, Increasing returns and path dependence in the economy (TheUniversity of Michigan Press, Ann Arbor, 1994).
[3] M.T. Bohl, Periodically Collapsing Bubbles in the US Stock Market?International Review of Economics and Finance 12 (2003) 385-397.
[4] G. Broekstra, A Synergetics approach to disruptive innovation, Kybernetes:The International Journal of Systems & Cybernetics 31 (9/10) (2002) 1249-1258.
[5] C. Brooks and A. Katsaris, Rational Speculative Bubbles: An EmpiricalInvestigation of the London Stock Exchange, Bulletin of Economic Research55 (2003) 319-346.
[6] M.K. Brunnermeier and S. Nagel, Hedge Funds and the Technology Bubble,EFA 2003 Annual Conference Paper No. 446(http://ssrn.com/abstract=423940)
[7] R.J. Caballero and M. Hammour, Speculative Growth, MIT Department ofEconomics Working Paper No. 02-45 (2002)(http://ssrn.com/abstract=355901)
34

[8] J.L. Cardy, ed., Finite-size Scaling (North-Holland, Amsterdam, 1988).
[9] V.V. Chari and P.J. Kehoe, Financial Crises as Herds: Overturning theCritiques, NBER Working Paper No. W9658 (2003)(http://ssrn.com/abstract=398561)
[10] T. Engsted and C. Tanggaard, Speculative Bubbles in Stock Prices? TestsBased on the Price-Dividend Ratio, SSRN Electronic Paper Collection (2004)(http://ssrn.com/abstract=486006).
[11] M. Erickson, M. Hanlon and E.L. Maydew, Is There a Link BetweenExecutive Compensation and Accounting Fraud? (February 24, 2004).http://ssrn.com/abstract=509505.
[12] R.C. Fair, Testing for a New Economy in the 1990s, Cowles FoundationDiscussion Paper No. 1388; Yale ICF Working Paper No. 02-48 (2002)(http://ssrn.com/abstract=363560).
[13] J.D. Farmer, Market Force, Ecology and Evolution, Preprint available atadap-org/9812005 (1998).
[14] J. Griffin, J.H. Harris and S. Topaloglu, Investor Behavior over theRise and Fall of Nasdaq, Yale ICF Working Paper No. 03-27 (2003)(http://ssrn.com/abstract=459803).
[15] H. Haken, Synergetics, an Introduction, 3rd ed. (Springer, Berlin, 1983).
[16] H. Haken, Information and self-organization: A macroscopic approach tocomplex systems (Springer, Berlin, 2nd edition, 2000).
[17] D. Helbing, A mathematical model for attitude formation by pair interactions,Behavioral Science 37, 190-214 (1992).
[18] K. Ide and D. Sornette, Oscillatory Finite-Time Singularities in Finance,Population and Rupture, Physica A 307 (2002) 63-106.
[19] T. Jiao, Stock Market Bubble and Earnings Management: Model andEvidences From China’s Stock Market, working paper from Shanghai JiaoTong University (2003) (http://ssrn.com/abstract=474922).
[20] A. Johansen, O. Ledoit and D. Sornette, Crashes as critical points,International Journal of Theoretical and Applied Finance 3(2) (2000) 219-255.
[21] A. Johansen and D. Sornette, Financial “anti-bubbles”: log-periodicity in Goldand Nikkei collapses, Int. J. Mod. Phys. C 10 (1999) 563-575.
[22] A. Johansen and D. Sornette, The Nasdaq crash of April 2000: Yet anotherexample of log-periodicity in a speculative bubble ending in a crash, EuropeanPhysical Journal B 17 (2000) 319-328.
[23] A. Johansen and D. Sornette, Finite-time singularity in the dynamics of theworld population and economic indices, Physica A 294 (2001) 465-502.
35

[24] A. Johansen and D. Sornette, Endogenous versus Exogenous Crashes inFinancial Markets, in press in “Contemporary Issues in International Finance”(Nova Science Publishers, 2004) (http://arXiv.org/abs/cond-mat/0210509).
[25] A. Johansen, D. Sornette and O. Ledoit, Predicting Financial Crashes usingdiscrete scale invariance, Journal of Risk 1(4) (1999) 5-32.
[26] T. Kaizoji, Inflation and deflation in stock markets, working paper athttp://arXiv.org/abs/cond-mat/0401140 (2004)
[27] Kindleberger, C.P. (2000) Manias, panics, and crashes: a history of financialcrises (4th ed. New York: Wiley).
[28] P. Krugman, Two, three, many? The New York Times, February 1, 2002,reproduced in “The great unravelling” (Allen Lan, Penguin Books, London,England, 2003), pp. 104-106.
[29] D.J. Lamdin, Rational Bubbles in Individual Stock Prices and Implicationsfor Investment Management (2002) (http://ssrn.com/abstract=351861).
[30] M. Levy, H. Levy and S. Solomon, The Microscopic Simulation of FinancialMarkets: From Investor Behavior to Market Phenomena (Academic Press, SanDiego, 2000).
[31] T. Lux and M. Marchesi, Scaling and criticality in a stochastic multi-agentmodel of a financial market, Nature 397 (1999) 498-500.
[32] R.M. Miller, Can Markets Learn to Avoid Bubbles? Journal of Psychology &Financial Markets 3 (2002)
[33] C. Rao, Linear statistical Inference and Its Applications, Wiley, New York,1965.
[34] M.P. Richardson and E. Ofek, DotComMania: The Rise and Fall of InternetStock Prices, NYU Stern Department of Finance, Working Paper No. IN-01-037 (2001) (http://ssrn.com/abstract=293964)
[35] J.A. Scheinkman and W. Xiong, Overconfidence and Speculative Bubbles,Journal of Political Economy 111, December 2003
[36] Shefrin, H. (2000) Beyond greed and fear: understanding behavioral financeand the psychology of investing (Boston, Mass.: Harvard Business SchoolPress).
[37] Shiller, R.J. (2000) Irrational exuberance (Princeton University Press,Princeton, NJ: ).
[38] Shleifer, A. (2000) Inefficient markets: an introduction to behavioral finance(New York: Oxford University Press).
[39] J.J. Siegel, What Is an Asset Price Bubble? An Operational Definition,European Financial Management 9 (2003) 11-24.
36

[40] D. Sornette Why Stock Markets Crash, Critical Events in Complex FinancialSystems (Princeton University Press, Princeton NJ, 2003).
[41] D. Sornette, Critical market crashes, Physics Reports 378(1) (2003) 1-98.
[42] D. Sornette and J.V. Andersen, A Nonlinear Super-Exponential RationalModel of Speculative Financial Bubbles, Int. J. Mod. Phys. C 13 (2002) 171-188.
[43] D. Sornette and A. Johansen, Significance of log-periodic precursors tofinancial crashes, Quantitative Finance 1(4) (2001) 452-471.
[44] D. Sornette, A. Johansen and J.-P. Bouchaud, Stock market crashes,Precursors and Replicas, J.Phys.I France 6 (1996) 167-175.
[45] D. Sornette, H. Takayasu and W.-X. Zhou, Finite-Time Singularity Signatureof Hyperinflation, Physica A 325 (2003) 492-506.
[46] D. Sornette and W.-X. Zhou, The US 2000-2002 Market Descent: How MuchLonger and Deeper? Quantitative Finance 2 (2002) 468-481.
[47] D. Sornette and W.-X. Zhou, Predictability of Large Future Changes inComplex Systems, submitted to the International Journal of Forecasting(2004) (http://arXiv.org/abs/cond-mat/0304601)
[48] J. van Biesebroeck, Robustness of Productivity Estimates, NBER WorkingPaper No. W10303 (2004) (http://ssrn.com/abstract=502889).
[49] B.S. Visano, A Socioeconomic Perspective, The American Journal ofEconomics and Sociology 61 (2002) 801-827.
[50] W. Weidlich, Sociodynamics: A systematic approach to mathematicalmodelling in the social sciences (Harwood Academic Publishers, Amsterdam,2000).
[51] W. Weidlich and G. Haag, Concepts and models of a quantitative sociology:The dynamics of interacting populations (Springer, Berlin, 1983)
[52] W.-X. Zhou and D. Sornette, Evidence of a worldwide stock market log-periodic antibubble since mid-2000, Physica A 330 (2003) 543-583.
37