brief overview of the 2011 mississippi river...
TRANSCRIPT

BRIEF OVERVIEW OF THE
2011 MISSISSIPPI RIVER FLOODS
J. David Rogers, Ph.D., P.E., P.G., C.E.G., C.HG. Karl F. Hasselmann Chair in Geological Engineering
Missouri University of Science & Technology
for the
Society of American Military Engineers
Ft Wood Chapter Meeting
August 17, 2011

2011 Flood • We’re witnessing a peak flood flow of ~2,330,000
cfs (at Natchez on May 20th); about 86% of the design capacity of 2.71 million cfs
• We’re seeing record stage levels everywhere, downstream of Cairo. e.g. The Natchez gage hit 62.5 ft, 4.5 ft above the previous record
• The Bird’s Point-New Madrid floodway was opened for the first time since 1937
• The Morganza floodway was opened only the second time since it was constructed in 1954

• Flood Routing situation in the Mississippi Delta on May 7, 2011

• About 1300 cfs was leaking through the needle logs prior to their being lifted at Bonnet Carre for the 10th time since 1932, on May 9th. The spillway is 7000 ft long.

• Bystanders gather to view the opening of the needle log gates at the southern end of the Bonnet Carre Spillway, constructed in 1929-32. 330 of the 350 spillway bays were opened in May 2011, discharging up to 316,000 cfs.

• The design capacity of the spillway is 250,000 cfs, about one-fifth of the channel’s capacity. It was completed in 1932 and the railroad and highway relocations completed in 1936. The spillway was opened in 1937, 1945, 1950, 1973, 1975, 1979, 1983, 1997, 2008, and in 2011. Not statistically significant…yet e.g. 3X 1st 20 yrs; 7X next 40 yrs

• The Bonnet Carre Bypass Spillway diverts flow 6 miles, into Lake Pontchartrain, which is at sea level. It was constructed a few miles downstream of a natural crevasse, which had breeched 6 times in the previous 120 years.
• Four million cubic yards of sediment was mucked from the spillway channel after the 1997 overflows, increasing the spillway capacity.
Interstate 10
Lake Pontchartrain

The Morganza Spillway was constructed in 1953-56, to retard the flow passing Baton Rouge to 1,500,000 cfs. It was only opened once previous to 2011, during the 1973 flood. This shows the first bay being opened on May 11th, 2011 and the structure discharged a peak flow of 172,000 cfs on May 17th.

Explosives Barge
• Several thousand lineal feet of hollow PVC pipe was embedded in the fuse plug levee at Bird’s Point. When the time came to blow the dike, the pipes were filled with a mixture of ammonium nitrate fertilizer and diesel fuel (ANFO)
The explosives barge carry the ANFO components was parked at this location throughout the memorable 1993 flood of the lower Missouri and middle Mississippi Rivers

Detonation at Bird’s Point
• The middle-of-the-night detonation on May 2-3, 2011 created an artificial crevasse 11,000 feet long, diverting 335,000 to 375,000 cfs of the river’s flow

• Approximately 200,000 acres of essentially level flood plain within the Bird’s Point-New Madrid Floodway was inundated within 36 hours of the detonation.
• The USGS deployed 40 hurricane storm surge sensors to monitor excavation of the crevasse scour hole and flow velocities, every 30 seconds.

• The State of Missouri appealed to the US Supreme Court to prevent the Bird’s Point diversion, on basis of economic cost-benefit
• The U.S. Government maintains flowage rights in the four designated floodways, regardless of their post-1928 development
Bird’s Point-New Madrid Floodway
Fuse plug dike blown at New Madrid to allow flood waters to flow back into the Mississippi River

‘Hard points’ and backwater flooding in Memphis
• Some of the high-value developments in Memphis were afforded increased protection
• Older neighborhoods bereft of any recent flood protection were inundated for the first time, under record high gage flows

Tailwater Effects
• The areas initially impacted by high flows are often those inundated by low gradient tributaries to the Mississippi River

Flood Preparations
• An engineer from the Corps of Engineers Louisville District inspects the troubled floodwall at Hickman, Kentucky.
• The downtown area was destroyed by high groundwater in 1993 because of the sheetpile cutoff beneath this floodwall
• Volunteers unpack and assemble Hesco Bastion concertainers in Memphis. These can be filled with rock to create more substantial barricades than using sandbags.

The Waterways Experiment Station and the Mississippi River &
Tributaries Project

Long duration floods transport enormous volumes of sediment
Funnel-shaped basin drains 41% of the continental
United States

1st Lt Herbert D. Vogel West Point Class of 1924
MS Univ California Berkeley ’28 DEng Berlin Technical Univ ’29
MEng Univ Michigan ’34 First Director of the Waterways Experiment Station at Vicksburg
1930-34
BGEN Harley Ferguson (West Point ‘97) was President of the Mississippi River Commission from 1932-39, during the formative years of the Mississippi River & Tributaries Project
Dr. Vogel
“Vog” Class of ‘24
The Waterways Experiment Station was established by the Army Corps of Engineers in 1928, following the disastrous floods of 1927 along the lower Mississippi River. The Army chose 1st Lieutenant Herbert D. Vogel with standing up the facility, which he directed for five years, between late 1929 and mid-1934
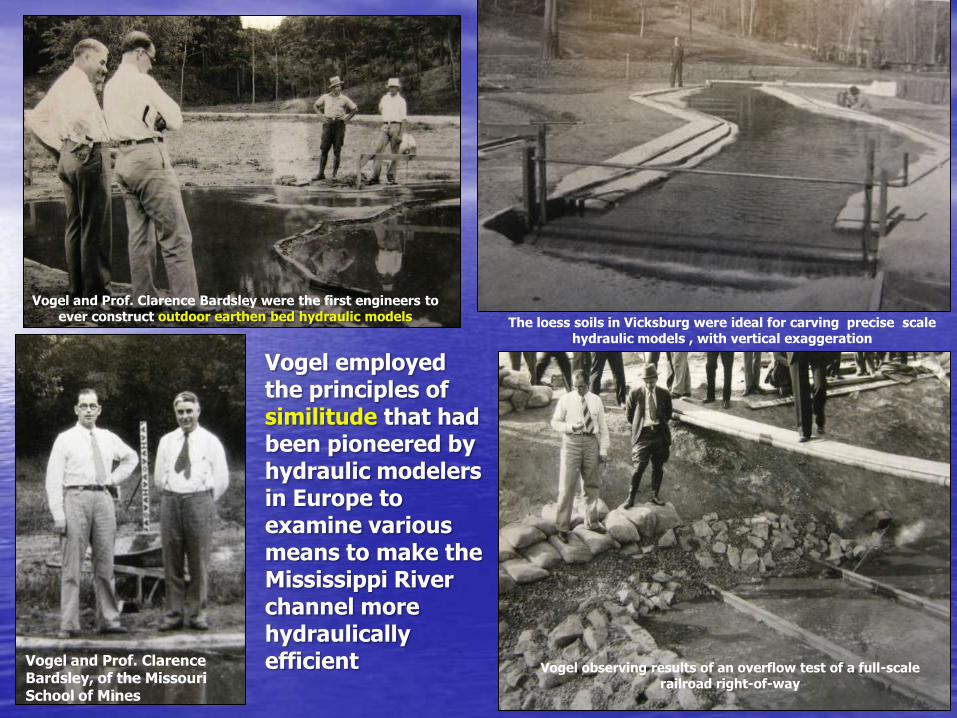
Vogel employed the principles of similitude that had been pioneered by hydraulic modelers in Europe to examine various means to make the Mississippi River channel more hydraulically efficient Vogel and Prof. Clarence
Bardsley, of the Missouri School of Mines
Vogel observing results of an overflow test of a full-scale railroad right-of-way
The loess soils in Vicksburg were ideal for carving precise scale hydraulic models , with vertical exaggeration
Vogel and Prof. Clarence Bardsley were the first engineers to ever construct outdoor earthen bed hydraulic models

• The Birds Point-New Madrid Floodway was located in Missouri and starting just below the confluence of the Mississippi and Ohio Rivers at Cairo, IL, covering about 206 square miles.
• In 1932 WES performed a model study to determine the effects of operating the floodway on the lands lying within it and to predict the draw-down on the Mississippi River with the floodway in use.
• With more than 100 miles of river to simulate, Vogel built an 80-foot-long outdoor concrete model of the river channel, the overbank between levees, backwater areas, and the floodway.
• Vog took special care to correctly place drainage ditches, levee borrow pits, and other details that would affect water levels, and raised miniature levees with soil taken from actual on-site levee borings. These tests indicated that the new levees were of sufficient height to contain any projected flood

Design Intent of the Bird’s Point Floodway
The Corps of Engineers designed the floodway to save Cairo, IL, a key rail and highway junction They also designed a drainage system to reclaim floodway lands for agriculture

One aspect the hydraulic models could not predict were long-term bed and bank adjustments, made over many decades by dramatically different flow regimens (Herbert D. Vogel and Missouri Mines
Professor Clarence Bardsley pictured at upper right).
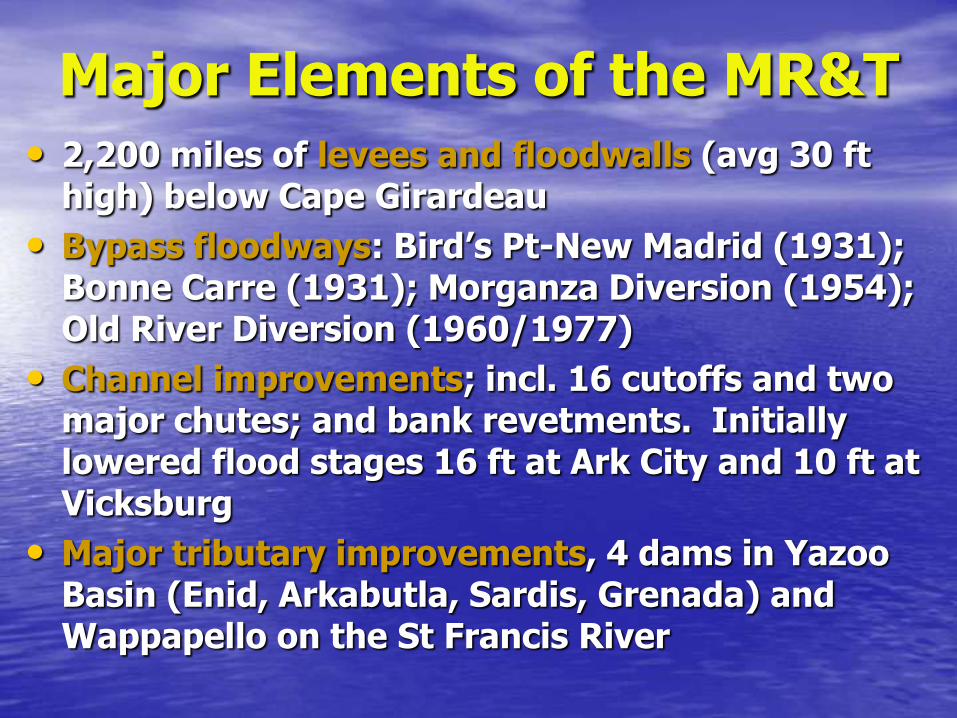
Major Elements of the MR&T
• 2,200 miles of levees and floodwalls (avg 30 ft high) below Cape Girardeau
• Bypass floodways: Bird’s Pt-New Madrid (1931); Bonne Carre (1931); Morganza Diversion (1954); Old River Diversion (1960/1977)
• Channel improvements; incl. 16 cutoffs and two major chutes; and bank revetments. Initially lowered flood stages 16 ft at Ark City and 10 ft at Vicksburg
• Major tributary improvements, 4 dams in Yazoo Basin (Enid, Arkabutla, Sardis, Grenada) and Wappapello on the St Francis River


Goal: reduce flood height thru increased channel efficiency: 16 cutoffs were made along the lower Mississippi River to increase grades and channel efficiency.

WES strove to improve channel
efficiency Framed timber dike under construction

• Timber dikes were employed along the Mississippi River to
confine flow and increase velocity along a preferred navigation channel. These dike caught organic debris which aided in their becoming backfilled with sediment.

Split Flow Conditions
• Channel improvements; incl. 16 cutoffs and two major chutes; and bank revetments (damaged during high flows).
• These improvements initially lowered flood stages 16 ft at Ark City and 10 ft at Vicksburg
• Requires corrective dredging

Levees, Floodwalls, and the Atchafalaya
• The MR&T employs 2,200 miles of levees and floodwalls below Cape Girardeau, which average 30 ft high
• In 1952 Prof. Fisk told the Corps of Engineers that under natural conditions the Mississippi River would divert itself down the Atchafalaya River, sometime by 1973
Prof H. N. Fisk briefs BGEN Max C. Tyler, of the Mississippi River Commission in 1942

MR&T Design Flood
• The Project Flood was developed in 1956. It combines Jan 1937, Jan 1950, and Feb 1938 storms over the Ohio and Mississippi Basins
• The peak flow of the Project Flood is 3,000,000 cfs at Red River landing
• The MR & T was constructed by the Army Corps of Engineers between 1928-60 for $8 billion
• Numerous additions since 1960
• Major diversions at Old River, Morganza Floodway, and Bonne Carre; which siphon off 54% of the maximum flow

Why are levees 1000X more likely to fail than dams?
• A major shortcoming of levee is the differing foundation conditions upon which they are founded.
Map of Mississippi River Valley
showing abandoned meanders.

Underseepage problematic in permeable point bar sands
• Saturated pervious foundations respond quickly to increased hydraulic pressure, leading to development of sand boils.
• Site geology and flood duration two most important factors.

Danger of horizontal correlations
• Inclined character of point bar deposits in a sinuous channel system. Note clay drapes; and how these might easily be mis-characterized by straight line correlations between adjacent borings.

Natural crevasses beneath levees
Crevasses lie beneath earthen
levees like ticking time bombs,
waiting to explode.

Major crevasse splays along lower Mississippi River channel (from John Day, LSU)

Levee construction techniques for the MR&T in 1930s

• Rapid drawdown is generally the most severe loading condition for an earthen levee. The severity is a function of how many flood cycles and how rapidly the high flow cycles drop, after peaking. Rapid drawdown also impacts natural river banks in the same manner.
Normal low flow condition
Slope failure triggered by sudden drawdown
Levee heightened during MR&T
Borrow pit
Old levee
High flow condition - seepage flood flow
Drop in flood flow

The 1973 Flood – all sorts of surprises
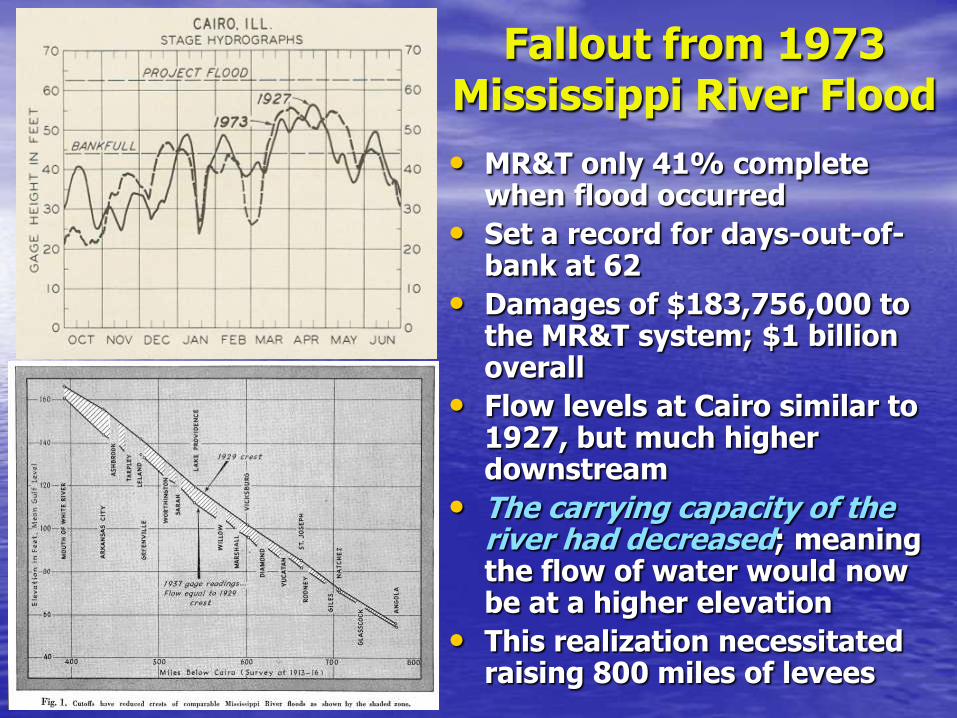
Fallout from 1973 Mississippi River Flood
• MR&T only 41% complete when flood occurred
• Set a record for days-out-of-bank at 62
• Damages of $183,756,000 to the MR&T system; $1 billion overall
• Flow levels at Cairo similar to 1927, but much higher downstream
• The carrying capacity of the river had decreased; meaning the flow of water would now be at a higher elevation
• This realization necessitated raising 800 miles of levees

Rapid Drawdown induced failures
• The 1973 flood was unusual in its duration (62 to 90 days), and its multiple cycles (loop effect)
• Levees resisted peak flows, but many failed when the river dropped precipitously, after its initial early season peak, in January, February, and April

• 1973 flow hydrograph for Donaldsonville. River flowed between 20 and 25 ft for two months during the 1973 flood, then dropped 7 feet in 9 days, creating a severe rapid drawdown condition.
Bank Failures most sensitive to drawdown
cycles

Near Disaster at the Old River
Control Structure
• During the ‘73 flood a large back-eddy scour hole developed on the up and downstream sides of the left abutment of the Low-Sill Diversion Structure
• Without the battered steel piles a new Mississippi River channel would have been carved down the Atchafalaya River to the Gulf !
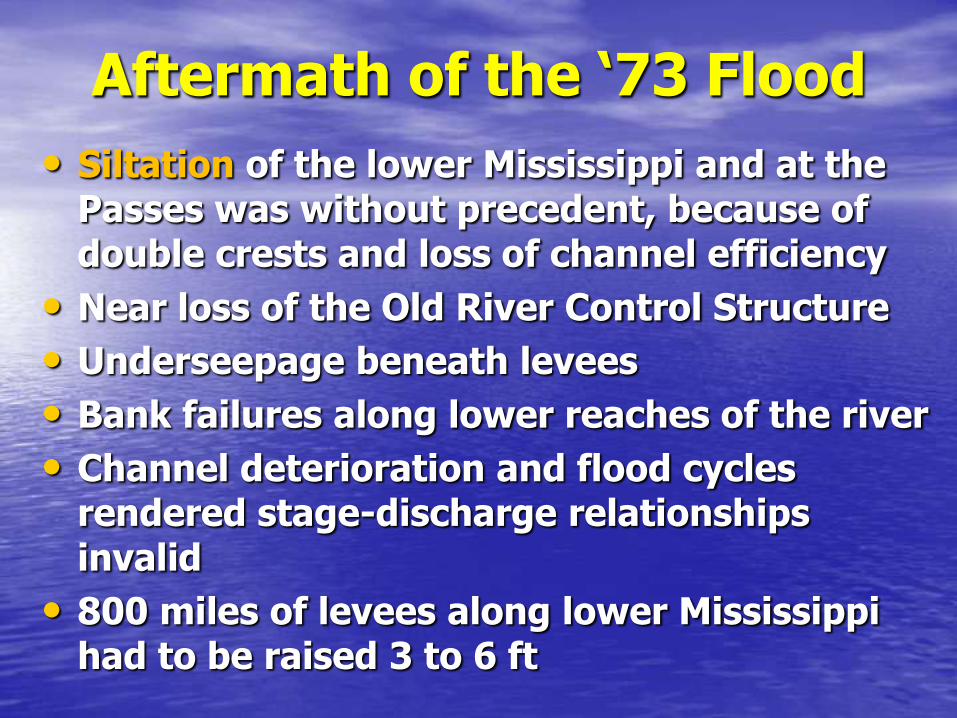
Aftermath of the ‘73 Flood
• Siltation of the lower Mississippi and at the Passes was without precedent, because of double crests and loss of channel efficiency
• Near loss of the Old River Control Structure
• Underseepage beneath levees
• Bank failures along lower reaches of the river
• Channel deterioration and flood cycles rendered stage-discharge relationships invalid
• 800 miles of levees along lower Mississippi had to be raised 3 to 6 ft

Old River Control Structure Complex was completely rebuilt following the ‘73 flood
Why are the river’s stage-discharge relationships on
the rise ?

Examining transient bed effects at constant
flow values
Natural sand bed channel (lower left); dredged channel (upper right); and impact
of structural dikes (lower right)

Prophetic Revelations
• In the late 1950s Luna Leopold led the USGS-WRD team who discovered that river depth and velocity increase at predictable rates preceding downstream, counter to previously-held theorems.
Luna B. Leopold, Ph.D., P.E.
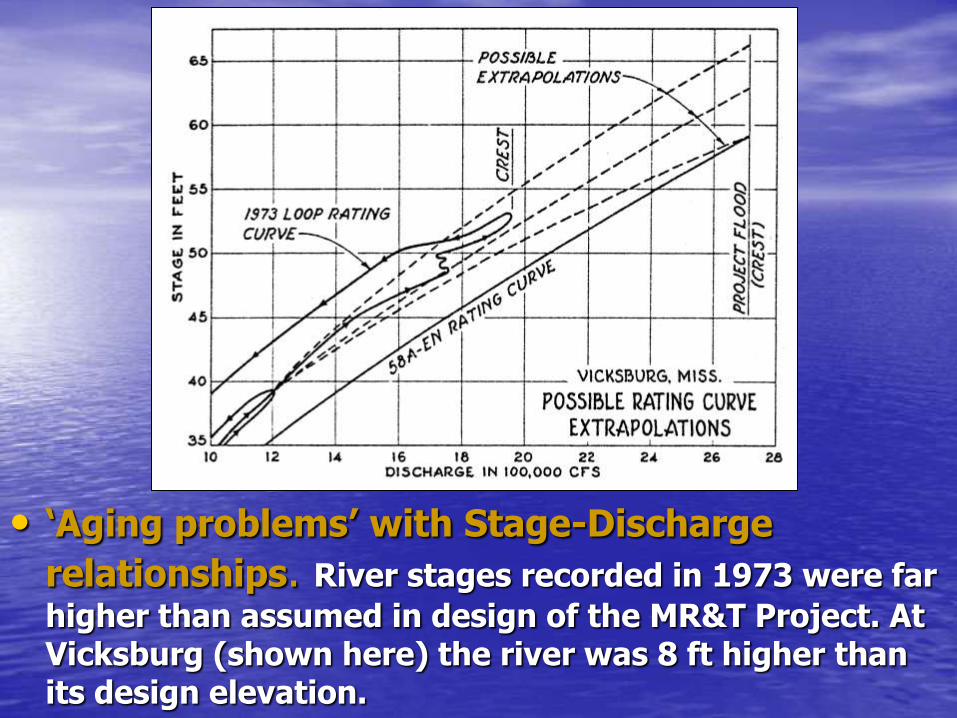
• ‘Aging problems’ with Stage-Discharge
relationships. River stages recorded in 1973 were far
higher than assumed in design of the MR&T Project. At Vicksburg (shown here) the river was 8 ft higher than its design elevation.

• Stage-Discharge ‘Loop Rating Curve:’ Typical increases in flow stage that accompanies successive peak flows, as observed in the 1973 Flood.
The Loop Effect

• Reasons for unstable stage-discharge relationships: sand waves, bank migration, changing bed movements during successive high flow cycles during peak discharge years, like 1973, 1993, and 2011.
• Since 1950 the river has been working via entropy to re-establish its original length, losing some of the channel capacity gained by the streamlining carried out during the two previous decades.
Sediment is deposited adjacent to and within most of the structural cutoffs when high flows drop rapidly. These deposits degrade channel efficiency. Other complications: sediment starvation by reservoirs and submerged navigation training structures, such as groins.

Comparison of 1973 & 2011 at Vicksburg
Stage-Discharge Curves Comparing 2011 and 1973 Mississippi River Floods at Vicksburg MS
y = 0.0918x0.4393
R2 = 0.9081
35
40
45
50
55
60
65
1,000,000 1,200,000 1,400,000 1,600,000 1,800,000 2,000,000 2,200,000 2,400,000 2,600,000 2,800,000
Discharge (cfs)
Ga
ge
He
igh
t (f
t)
H2011 (ft) H1973 (ft) Power (H2011 (ft)) Power (H1973 (ft))

Comparison of 1973 & 2011 at Natchez
Stage-Discharge for Mississippi River at Natchez in 1973 and 2011
y = 0.047x0.4927
R2 = 0.9653
y = 0.0435x0.4932
R2 = 0.904
20
25
30
35
40
45
50
55
60
65
250,000 500,000 750,000 1,000,000 1,250,000 1,500,000 1,750,000 2,000,000 2,250,000 2,500,000
Discharge (cfs)
Gag
e H
eig
ht
(ft)
'2011' '1973' Power ('2011') Power ('1973')

Comparison of 1973 & 2011 at Red River Landing
Comparison of Stage-Discharge Curves from 2011 and 1973 at Red River Landing
y = 0.2548x0.3861
R2 = 0.9725
y = 0.1165x0.4391
R2 = 0.9519
40
45
50
55
60
65
400,000 600,000 800,000 1,000,000 1,200,000 1,400,000 1,600,000 1,800,000
Discharge (cfs)
Gag
e H
eig
ht
(ft)
2011
1973
+1.8 feet @ 1.5 million cfs

Comparison of 1973 & 2011 at Baton Rouge
Comparison of Stage-Discharge Curves for the Mississippi River at Baton Rouge:
1973 and 2011
HBR2011= 2E-05x + 13.214
R2 = 0.9962
HBR1973 = 2E-05x + 18.742
R2 = 0.901
25
26
27
28
29
30
31
32
33
34
35
36
37
38
39
40
41
42
43
44
45
600,000 700,000 800,000 900,000 1,000,000 1,100,000 1,200,000 1,300,000 1,400,000 1,500,000
Discharge (cfs)
Gag
e H
eig
ht
(ft)
BR2011 BR1973 Linear (BR2011) Linear (BR1973)
1973
2011
+2 to 5 feet @1.4 million cfs

Mississippi River Stage-Discharge at Belle Chasse for 1973 and 2011 Flood
HNO2011 = 8E-06x + 8.8588
R2 = 0.9784
HNO1973 = 9E-06x + 7.1282
R2 = 0.8413
14.0
14.5
15.0
15.5
16.0
16.5
17.0
17.5
18.0
18.5
19.0
600,000 700,000 800,000 900,000 1,000,000 1,100,000 1,200,000 1,300,000
QBC2011 QBC1973 Linear (QBC2011) Linear (QBC1973)
Bonnet Carre Opens April 8, 1973
Max 1,248,000 cfs Past NO
Bonnet Carre Opens May 9, 2011
Max 1,230,000 cfs Past NO
Comparison of 1973 & 2011 at Belle Chasse

Atchafalaya Input and Output Hydrographs Showing Lag (10 days) and Diminishment of
Peak Q (50,000 cfs)
300,000
350,000
400,000
450,000
500,000
550,000
600,000
650,000
700,000
750,000
800,000
850,000
900,000
950,000
2/26/2011 3/18/2011 4/7/2011 4/27/2011 5/17/2011 6/6/2011 6/26/2011 7/16/2011
Date
Disc
harg
e (c
fs)

Atchafalaya Basin Discharge through Lower Atchafalaya (56%) and Wax Lake Outlet (44%)
0
100,000
200,000
300,000
400,000
500,000
600,000
2/26/2011 3/18/2011 4/7/2011 4/27/2011 5/17/2011 6/6/2011 6/26/2011 7/16/2011
Date
Disc
harg
e (c
fs)

Comparison of Stage Discharge Curves on Lower Atchafalaya River at Morgan City: 1973
and 2011
y = 0.0015x0.6705
R2 = 0.9299
y = 7E-06x1.0871
R2 = 0.8721
4
5
6
7
8
9
10
11
100,000 150,000 200,000 250,000 300,000 350,000 400,000 450,000 500,000 550,000
Discharge (cfs)
Gag
e H
eig
ht
(ft)
1973
2011
Same Discharge in 2011 as in 1973 but S-D
Curve is Flattened

Rising Profile of the Lower Mississippi
The bed of the Mississippi River is below sea level during the last 450 miles of its course, up to Greenville, Mississippi.

The employment of dual levees, lengthening of the jetties, and the silt load of the river have combined to heighten the channel bed and lower the hydraulic grade, lifting the river’s flow surface.

• The high-stand mud ediface digitate (birdfoot-shaped) delta deposited by the Mississippi River is the only delta in the world that extends out to the edge of the Continental Shelf (image from Fisk, 1956).

• Land loss shown in orange
• During the next large runoff event, the river will likely jump its banks somewhere above Head-of-Passes
• We’ll be stuck with wherever it decides to go
Change is coming, get ready for it…
Historic land loss in the Birdsfoot Delta through 2005, shown in orange. There is very little land mass physically constraining the main stem channel, and its flow is becoming diffuse, especially during this year’s flows. Less than a third of the river’s flow now makes it to the main navigation outlets (from LSU
Marine Sciences).

Head of Passes
West Bay
Venice
NASA image (2001)
The east channel off Head of Passes used to convey 25% of the river’s flow. That’s now fallen just to 7 or 8%. Dredge spoils have been placed in Pass-a-Loutre and it has become blocked. Two new channels are siphoning water off to the west, at Tiger Pass and Grand Pass. The 11-mile long Bohemia Spillway and Bayou Baptiste Collette lie along the lower river’s eastern bank. These four outlets are now siphoning off about 67% of the river’s flow, above Southwest Pass.

• Flow dispersion of the lower Mississippi River. The outflow deceleration is responsible for about 20 to 30% of the siltation occurring in the lower Mississippi River channel, while the other 70 to 80% of the accumulated sediment is not explained (Barras et al., 2009).

• The ‘depositional center’ of the lower Mississippi River is moving upstream each year, increasing dredging costs. In 2010 the dredging cost $100 million, but, the Corps was unable to maintain the 45 ft deep navigation channel (for the first time).
• New Orleans generates about $107 billion each year in revenue, or about $294 million per day. It remains to be seen if Congress will appropriate more than $100 million annually to maintain the navigation channel, or will seek some sort of match from those navigation interests who have so much at stake.
Since 1877 the jetties have extended the river’s length by 11.3 km, lowering the hydraulic gradient, while sea level
has risen 13 inches.

This lecture will be posted on my Missouri S&T website as a
pdf file for easy downloading. It is not copyrighted
www.mst.edu/~rogersda/levees/
Mississippi Delta Region