brandfinance global banking 500
TRANSCRIPT

BrandFinance®
Global Banking 500
The annual report on the most valuable global banking brands
February 2009

Foreword
01
Brands are the most valuable intangible assets in business today. They drive demand, motivate staff, secure business partners and reassure financial markets. Leading edge organisations recognise the need to understand brand equity and brand value when making strategic decisions
This report, first published in 2006, was the first publicly available study analyzing the financial value of the world’s top 100 banking brands. It is published annually and incorporates data from the world’s 32 largest stock markets. For the second year running we have extended our analysis to the top 500 financial services brands globally. Each brand has been accorded a brand rating: a bench-marking study of the strength, risk and future potential of a brand relative to its competitor set as well as a brand value: a summary meas-ure of the financial strength of the brand.
The banking crisis dominated the headlines in 2008. The credit crunch has resulted in significantly adjusted expectations of future financial performance, enterprise values and brand values with only 31 of the top 500 banking brands growing their brand value this year. Across the 500 we have seen a brand value destruction equivalent to US$209 billion. Amongst the win-ners, we have seen the continued rise of powerful banking brands from the Chinese market in the top 20 and the continued advance of other emerging market brands. Some of the best known developed world banks have disappeared or were subsumed by stronger rivals in 2008. Some are dead men walking awaiting a silver bullet. Governments’ fingers are on triggers.
This report serves to provide an opinion on the point-in-time valuations of the most valuable financial services brands, and also illustrates how our methodology, findings and value-based marketing techniques can be used for decision-making and to determine the impact of brand equity on business performance.
David Haigh, CEO, Brand Finance plc
““
About Brand Finance®
02
Brand Finance is an independent global consultancy focused on advising strongly branded organisations on how to maximize value through the effective management of their intangible assets. Since it was founded in 1996, Brand Finance has performed thousands of business and intangible asset valuations with an aggregate value of over US$10 trillion.
Brand Finance's services support a variety of business needs:
• Technical valuations for accounting, tax and legal purposes
• Valuations in support of commercial transactions (acquisitions, divestitures, licensing and joint ventures) involving different forms of intellectual property
• Valuations as part of a wider mandate to deliver value-based marketing strategy and tracking, thereby bridging the gap between marketing and finance.
Our clients include international brand owners, tax authorities such as the IRS and HMRC, IP lawyers and investment banks. Our work is frequently peer-reviewed by the big four audit practices and our approach has also been accepted by the UK Takeover Panel.
Brand Finance is headquartered in London and has a network of international offices in Amsterdam, Athens, Bangalore, Barcelona, Cape Town, Colombo, Dubai, Geneva, Helsinki, Hong Kong, Istanbul, Madrid, Moscow, New York, Paris, Sao Paulo, Sydney, Singapore, Toronto and Zagreb.
www.brandfinance.com
The world's leading independent brand valuation consultancy “ “
Brand Finance® and BrandFinance® are registered trademarks

Contents
03
Foreword ......................................... 01
About Brand Finance .......................... 02
Introduction .................................... 04
Executive summary ............................ 06
Top 100 table .................................. 07
Commentary on the top 20 brands ......... 11
Sector and regional analysis .................. 21
Why is bank branding important ........... 29
Rationalisation of bank brands ............. 33
Explanation of methodology ............... 35
Brand Finance ................................. 36
Table – 101 – 500 ............................. 40
Please note that all figures in this report are in US$ million unless stated otherwise.
For further information on the Brand Finance Global Banking 500 please visit www.brandfinance.com
Introduction
04
2008 was characterised by the deepening of the financial crisis that had begun with 2007’s United States sub-prime mortgage crisis and the domino effect of defaulting mortgage backed securities and structured credit products that incurred huge losses. Liquidity was still a worldwide issue with inter-bank lending and customer lending severely hamstrung by the economic climate. Liquidity was helped by the injection of credit by central banks, government guarantees, announcements of fiscal stimuli and other bail-outs, but the success of these interventions will only be known in the year ahead.
What we do know is that 2008 was the year the rot set in. The de facto nationalisation of Northern Rock in February began the roll- call of bad news. Then in March Bear Stearns was rescued at just US$10 a share by JP Morgan. House prices were down; oil went from US$147 a barrel on July to US$50 in December reflecting the fever in the markets that was to end in the single most dramatic day of the financial year when Bank of America swallowed Merrill Lynch and Lehman Brothers went under. The US Government-sponsored enterprises Fannie Mae and Freddie Mac were taken into federal conservatorship.
If sub-prime was the watchword of 2008, Libor may be for 2009. Stubbornly high inter-bank lending rates have forced the Bank of England to slash interest rates to their lowest level in 300 years. Other governments have been forced into similarly drastic action.
Impact On Financial CorporationsBanks have been affected by the continuing financial crisis in a number of ways.
• Increase in cost of capital• Earnings hit by continuing defaults on mortgages and loans
I welcome the Brand Finance report's findings that HSBC is the only AAA+ ranked brand in financial services and is the most valuable financial services brand in the world. In these difficult times, values are more important than ever to our customers and they want a bank that they can trust. So brands have never been more important in financial services and, within the category, HSBC stands out as being special. At HSBC, we believe that by recognising and understanding our customers’ values and priorities in life, we can better serve them
Alex Hungate Group Managing Director, HSBC Personal Financial Services & Marketing
““
Introduction (cont.)
05
• Changes in asset valuation led to volatility in earnings and stock prices• Liquidity problems became capital problems, causing banks to rein in lending
Lack of liquidity caused by market panic and freezing of inter-bank lending led to various corporations and hedge funds to go bankrupt. Bail-outs like the US$700 billion authorised by Congress in September to buy failing bank assets require that government officials sit on the boards of global banks. Central banks injected cash to unfreeze the credit markets making it easier for businesses and banks to obtain loans. Banks were criticised for not passing favourable rate cuts immediately to borrowers, choosing instead to rebuild the capital on their balance sheets.
Globally, write-downs went from US$231bn in April to US$592.9bn in September. Analysts said that of the capital raised in the last quarter of the year (including rescue-packages) by the three US giants Citigroup, Bank of America and JP Morgan, 20% to 42% would be needed to rebuild 2009’s credit card reserves alone.
Disaster Study: Lehman BrothersOn September 5th 5,000 staff at Lehman Brothers cleared their desks in what was the biggest single job loss since the collapse of Rover in 2005. The 158-year-old US investment bank collapsed when the US Treasury refused to adopt a Bear Stearns-style rescue plan. Lehman held US$60bn in toxic bad debts and when it went under, assets of US$639bn against debts of US$613bn. The bank had supported 100% mortgage loans offered by specialist lenders to customers with poor credit ratings. Other banks refused to trade with it, and without this cash flow investors were not prepared to bet on its long-term viability.
While US Treasury Secretary Henry Paulson committed trillions to saving Fannie Mae and Freddie Mac, he believed a trading house like Lehman, with little direct connection to retail markets could be allowed to go bust without creating the systemic risk Mae and Mac posed. On top of this, a grand jury subpoena is out on Lehman executives concerning whether they made false or misleading statements about the firm leading up to its collapse.
Banking And Investment In Emerging MarketsAccording to the World Bank in January, “resilient emerging markets are cushioning the global economy amid the US slowdown”. This resilience was in parts overestimated. According to EPFR Global, emerging market equity investors withdrew US$48.3bn from their funds in 2008 as the global financial crisis hurt demand for riskier assets. The MSCI Emerging Markets Index that tracks 746 companies in developing nations dropped 54%, its worst performance since its inception in 1987. The index rebounded 33% late in the year. Brad Durham, EPFR’s managing director, said: “The question for 2009 is whether credit markets will continue to thaw and whether the fiscal stimulus to come and the expectation of a recovery in economic activity later this year will be enough to coax some of the cash back into equity and bond exposure.”
On November 6th the IMF said that emerging and developing countries’ growth will be at 5.1% compared to 2.2% in the global economy as a whole. China’s growth for 2009 is forecast at 6.8%, the lowest for five years. Not even emerging markets have avoided the crunch.
Executive Summary
06
The total decline in brand value of the Global Banking 500 is US$209bn.
• 84% of the total loss in brand value is among the top 100 brands.
• 198 brands drop out of the study, reflecting an extremely turbulent year in markets where once famous brands like Lehman Brothers are no more.
• New arrivals perform with greater consistency than the multinational giants; indicative of this report’s finding that smaller, more localised financial services are surviving better. The 401st to 500th ranked brands register a US$1.7bn rise in value, in marked contrast to the drastic tumbling in values above them.
• Consumer banks have higher market capitalisation to brand value ratio than investment banks, reflecting the need to connect with the high-street consumer.
• Banks in developed economies register the greatest falls with US brands losing 40% of their overall value and the UK, 15%. The US stranglehold on the Global 500 is loosened; the number of US banks in the study drops by 29 to 95.
• The greatest sector losses are among credit card brands, where the top five lost 34% of their value during 2008.
• Combined, Turkey and South Korea contribute five of the most improved financial brands.
• BRIC brands once again performed well. Brazil, Russia and China were three of only five countries whose combined value of brands increased.
Since the publication of the Banker Magazine’s article Brand Finance has made a small number of amendments to the top 500 that relate to updated financial information, for further detail please contact us at [email protected]
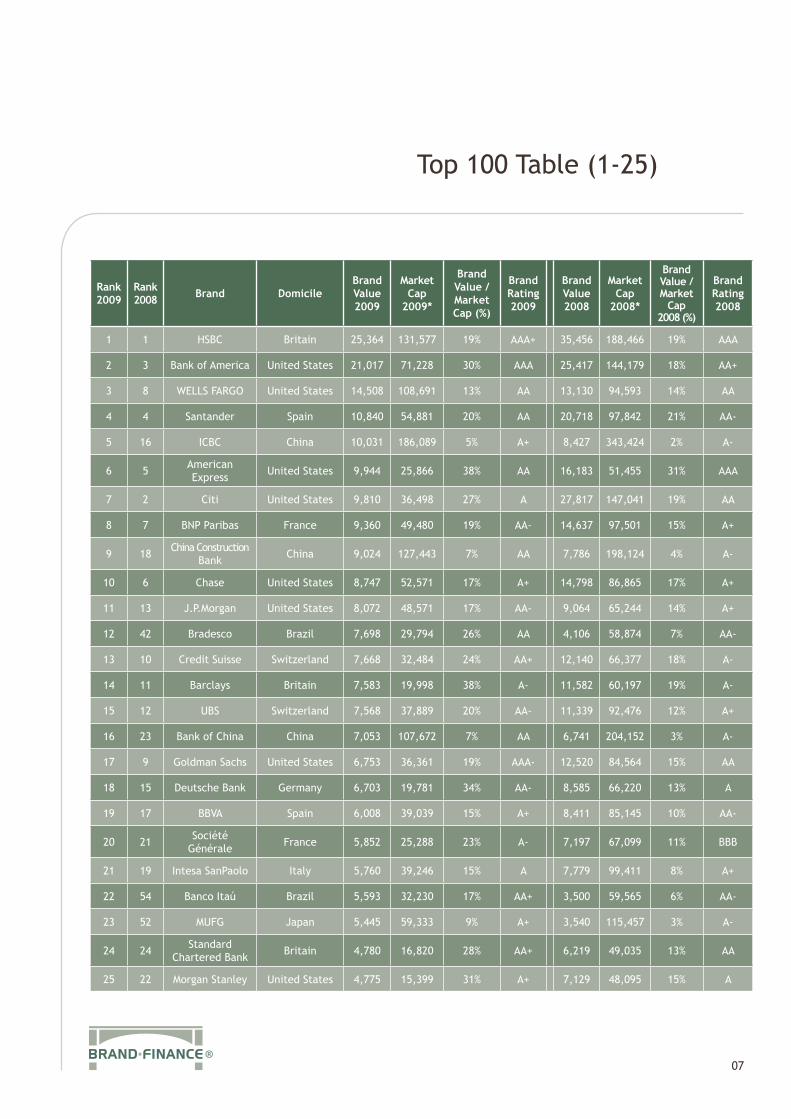
Top 100 Table (1-25)
07
Rank 2009
Rank 2008 Brand Domicile
Brand Value 2009
Market Cap
2009*
Brand Value / Market Cap (%)
Brand Rating 2009
Brand Value 2008
Market Cap
2008*
Brand Value / Market
Cap 2008 (%)
Brand Rating 2008
1 1 HSBC Britain 25,364 131,577 19% AAA+ 35,456 188,466 19% AAA
2 3 Bank of America United States 21,017 71,228 30% AAA 25,417 144,179 18% AA+
3 8 WELLS FARGO United States 14,508 108,691 13% AA 13,130 94,593 14% AA
4 4 Santander Spain 10,840 54,881 20% AA 20,718 97,842 21% AA-
5 16 ICBC China 10,031 186,089 5% A+ 8,427 343,424 2% A-
6 5 American Express United States 9,944 25,866 38% AA 16,183 51,455 31% AAA
7 2 Citi United States 9,810 36,498 27% A 27,817 147,041 19% AA
8 7 BNP Paribas France 9,360 49,480 19% AA- 14,637 97,501 15% A+
9 18 China Construction Bank China 9,024 127,443 7% AA 7,786 198,124 4% A-
10 6 Chase United States 8,747 52,571 17% A+ 14,798 86,865 17% A+
11 13 J.P.Morgan United States 8,072 48,571 17% AA- 9,064 65,244 14% A+
12 42 Bradesco Brazil 7,698 29,794 26% AA 4,106 58,874 7% AA-
13 10 Credit Suisse Switzerland 7,668 32,484 24% AA+ 12,140 66,377 18% A-
14 11 Barclays Britain 7,583 19,998 38% A- 11,582 60,197 19% A-
15 12 UBS Switzerland 7,568 37,889 20% AA- 11,339 92,476 12% A+
16 23 Bank of China China 7,053 107,672 7% AA 6,741 204,152 3% A-
17 9 Goldman Sachs United States 6,753 36,361 19% AAA- 12,520 84,564 15% AA
18 15 Deutsche Bank Germany 6,703 19,781 34% AA- 8,585 66,220 13% A
19 17 BBVA Spain 6,008 39,039 15% A+ 8,411 85,145 10% AA-
20 21 Société Générale France 5,852 25,288 23% A- 7,197 67,099 11% BBB
21 19 Intesa SanPaolo Italy 5,760 39,246 15% A 7,779 99,411 8% A+
22 54 Banco Itaú Brazil 5,593 32,230 17% AA+ 3,500 59,565 6% AA-
23 52 MUFG Japan 5,445 59,333 9% A+ 3,540 115,457 3% A-
24 24 Standard Chartered Bank Britain 4,780 16,820 28% AA+ 6,219 49,035 13% AA
25 22 Morgan Stanley United States 4,775 15,399 31% A+ 7,129 48,095 15% A
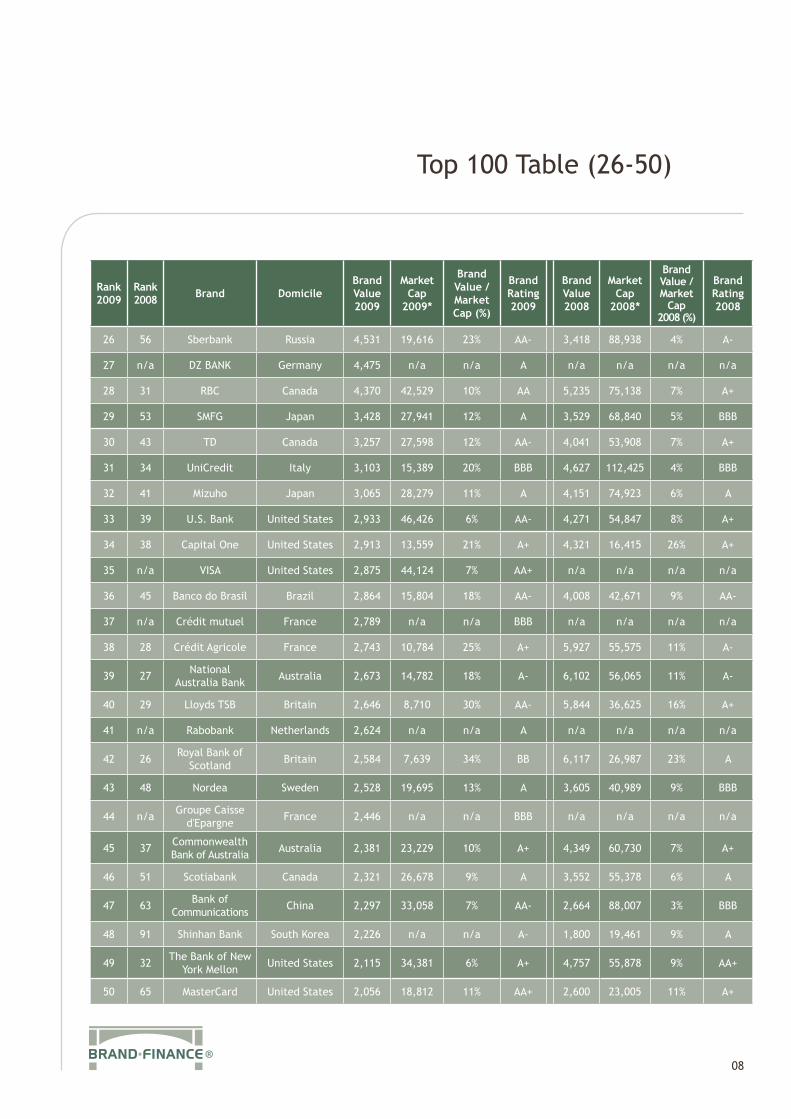
Top 100 Table (26-50)
08
Rank 2009
Rank 2008 Brand Domicile
Brand Value 2009
Market Cap
2009*
Brand Value / Market Cap (%)
Brand Rating 2009
Brand Value 2008
Market Cap
2008*
Brand Value / Market
Cap 2008 (%)
Brand Rating 2008
26 56 Sberbank Russia 4,531 19,616 23% AA- 3,418 88,938 4% A-
27 n/a DZ BANK Germany 4,475 n/a n/a A n/a n/a n/a n/a
28 31 RBC Canada 4,370 42,529 10% AA 5,235 75,138 7% A+
29 53 SMFG Japan 3,428 27,941 12% A 3,529 68,840 5% BBB
30 43 TD Canada 3,257 27,598 12% AA- 4,041 53,908 7% A+
31 34 UniCredit Italy 3,103 15,389 20% BBB 4,627 112,425 4% BBB
32 41 Mizuho Japan 3,065 28,279 11% A 4,151 74,923 6% A
33 39 U.S. Bank United States 2,933 46,426 6% AA- 4,271 54,847 8% A+
34 38 Capital One United States 2,913 13,559 21% A+ 4,321 16,415 26% A+
35 n/a VISA United States 2,875 44,124 7% AA+ n/a n/a n/a n/a
36 45 Banco do Brasil Brazil 2,864 15,804 18% AA- 4,008 42,671 9% AA-
37 n/a Crédit mutuel France 2,789 n/a n/a BBB n/a n/a n/a n/a
38 28 Crédit Agricole France 2,743 10,784 25% A+ 5,927 55,575 11% A-
39 27 National Australia Bank Australia 2,673 14,782 18% A- 6,102 56,065 11% A-
40 29 Lloyds TSB Britain 2,646 8,710 30% AA- 5,844 36,625 16% A+
41 n/a Rabobank Netherlands 2,624 n/a n/a A n/a n/a n/a n/a
42 26 Royal Bank of Scotland Britain 2,584 7,639 34% BB 6,117 26,987 23% A
43 48 Nordea Sweden 2,528 19,695 13% A 3,605 40,989 9% BBB
44 n/a Groupe Caisse d'Epargne France 2,446 n/a n/a BBB n/a n/a n/a n/a
45 37 Commonwealth Bank of Australia Australia 2,381 23,229 10% A+ 4,349 60,730 7% A+
46 51 Scotiabank Canada 2,321 26,678 9% A 3,552 55,378 6% A
47 63 Bank of Communications China 2,297 33,058 7% AA- 2,664 88,007 3% BBB
48 91 Shinhan Bank South Korea 2,226 n/a n/a A- 1,800 19,461 9% A
49 32 The Bank of New York Mellon United States 2,115 34,381 6% A+ 4,757 55,878 9% AA+
50 65 MasterCard United States 2,056 18,812 11% AA+ 2,600 23,005 11% A+

09
Rank 2009
Rank 2008 Brand Domicile
Brand Value 2009
Market Cap
2009*
Brand Value / Market Cap (%)
Brand Rating 2009
Brand Value 2008
Market Cap
2008*
Brand Value / Market
Cap 2008 (%)
Brand Rating 2008
51 n/a Groupe Banque Populaire France 2,013 n/a n/a BBB n/a n/a n/a n/a
52 76 State Street United States 1,953 17,559 11% A 2,186 31,366 7% A+
53 57 Westpac Australia 1,936 20,955 9% A+ 3,229 47,085 7% A
54 66 Bank of Montreal Canada 1,930 14,389 13% A+ 2,555 33,061 8% A-
55 46 CIBC Canada 1,891 14,051 13% A+ 3,756 35,962 10% A-
56 50 ANZ Australia 1,883 15,313 12% AA- 3,559 49,056 7% A+
57 71 ERSTE Austria 1,870 7,356 25% BBB 2,371 20,224 12% A-
58 n/a "la Caixa" Spain 1,778 n/a n/a A- n/a n/a n/a n/a
59 73 Natixis France 1,753 5,998 29% AA- 2,312 23,386 10% A+
60 n/a PNC United States 1,752 18,246 10% A+ n/a n/a n/a n/a
61 49 Commerzbank Germany 1,738 5,431 32% A+ 3,560 24,679 14% A+
62 82 SunTrust United States 1,721 10,715 16% AA- 1,989 21,606 9% BBB
63 30 Merrill Lynch United States 1,682 19,062 9% BBB 5,702 46,816 12% A
64 75 KBC Belgium 1,658 10,529 16% BB 2,224 49,239 5% B
65 n/a LaSalle Bank United States 1,584 6,194 26% AA+ n/a n/a n/a n/a
66 102 BB&T United States 1,546 16,370 9% A+ 1,558 16,782 9% BBB
67 n/a JPMorgan Chase United States 1,538 114,285 1% AA- n/a n/a n/a n/a
68 n/a Unibanco Brazil 1,520 7,714 20% A n/a n/a n/a n/a
69 84 Dexia Belgium 1,448 7,709 19% A 1,937 32,206 6% BB
70 60 State Bank of India India 1,448 9,834 15% AA 2,852 12,021 24% AA
71 110 Danske Bank Denmark 1,412 8,460 17% BB 1,328 26,530 5% BB
72 72 First National Bank South Africa 1,369 6,642 21% AA 2,358 16,556 14% A-
73 101 DBS Singapore 1,362 12,972 11% AA 1,564 21,031 7% A-
74 92 China Merchants Bank China 1,362 25,992 5% A- 1,794 82,082 2% A-
75 n/a Resona Bank Japan 1,338 15,489 9% A n/a n/a n/a n/a
Top 100 Table (51-75)

10
Rank 2009
Rank 2008 Brand Domicile
Brand Value 2009
Market Cap
2009*
Brand Value / Market Cap (%)
Brand Rating 2009
Brand Value 2008
Market Cap
2008*
Brand Value / Market
Cap 2008 (%)
Brand Rating 2008
76 n/a VTB Russia 1,329 7,934 17% A n/a n/a n/a n/a
77 14 Wachovia United States 1,319 12,209 11% BBB 8,686 72,120 12% AA-
78 106 Raiffeisen Bank Austria 1,303 4,376 30% BBB 1,445 20,417 7% A-
79 n/a Caixa Geral de Depósitos Portugal 1,300 n/a n/a BB n/a n/a n/a n/a
80 40 Halifax Britain 1,299 3,947 33% A- 4,234 29,121 15% A+
81 n/a Bank of China (Hong Kong) Hong Kong 1,290 11,076 12% A n/a n/a n/a n/a
82 74 Standard Bank South Africa 1,282 6,373 20% AA 2,239 19,279 12% A-
83 20 NatWest Britain 1,263 3,644 35% A- 7,259 31,423 23% A
84 85 National Bank of Greece Greece 1,244 9,372 13% B 1,916 31,732 6% BBB
85 96 CIC France 1,226 5,244 23% A 1,671 12,485 13% A+
86 190 Isbank Turkey 1,208 7,036 17% A 557 16,802 3% B
87 114 Regions United States 1,191 6,920 17% A- 1,287 14,229 9% A-
88 n/a Scottish Widows Britain 1,189 3,820 31% AA- n/a n/a n/a n/a
89 n/a Dresdner Bank Germany 1,172 n/a n/a A n/a n/a n/a n/a
90 n/a LCL (Credit Lyonnais) France 1,161 5,033 23% A n/a n/a n/a n/a
91 n/a Blackstone United States 1,155 6,897 17% A+ n/a n/a n/a n/a
92 95 National City United States 1,140 4,092 28% A+ 1,719 9,647 18% A-
93 103 SEB Sweden 1,125 6,048 19% A 1,539 16,446 9% BB
94 104 Hang Seng Bank Hong Kong 1,104 24,061 5% A 1,522 39,424 4% A+
95 n/a ABSA South Africa 1,102 7,236 15% AA n/a n/a n/a n/a
96 n/a Ameriprise Financial United States 1,082 3,858 28% A n/a n/a n/a n/a
97 59 Bank of Scotland Britain 1,075 3,250 33% BBB 3,024 22,895 13% A
98 77 St George Bank Australia 1,069 8,271 13% AA- 2,142 16,685 13% AA-
99 n/a Western Union United States 1,053 9,374 11% AA- n/a n/a n/a n/a
100 90 Discover United States 1,043 4,900 21% B 1,864 6,032 31% BBB
Top 100 Table (76-100)
Commentary on the Top 20 banking brands
11
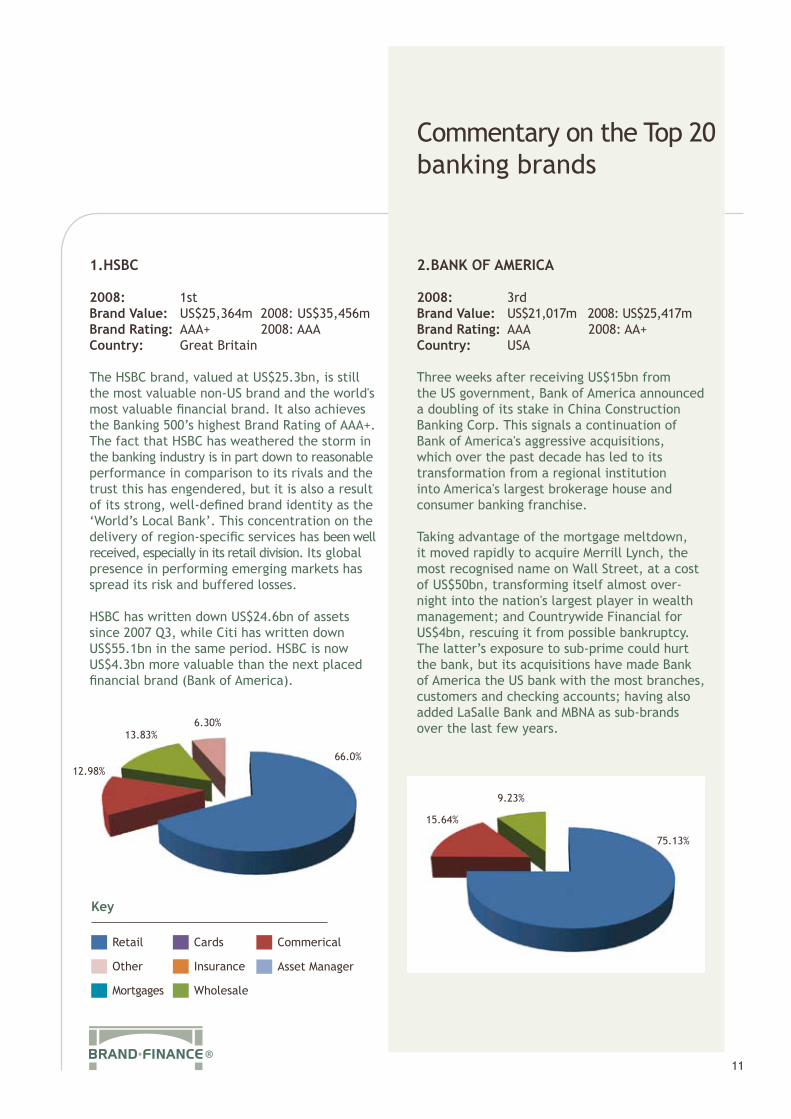
1.HSBC
2008: 1stBrand Value: US$25,364m 2008: US$35,456mBrand Rating: AAA+ 2008: AAACountry: Great Britain
The HSBC brand, valued at US$25.3bn, is still the most valuable non-US brand and the world's most valuable financial brand. It also achieves the Banking 500’s highest Brand Rating of AAA+. The fact that HSBC has weathered the storm in the banking industry is in part down to reasonable performance in comparison to its rivals and the trust this has engendered, but it is also a result of its strong, well-defined brand identity as the ‘World’s Local Bank’. This concentration on the delivery of region-specific services has been well received, especially in its retail division. Its global presence in performing emerging markets has spread its risk and buffered losses. HSBC has written down US$24.6bn of assets since 2007 Q3, while Citi has written down US$55.1bn in the same period. HSBC is now US$4.3bn more valuable than the next placed financial brand (Bank of America).
2.BANK OF AMERICA
2008: 3rd Brand Value: US$21,017m 2008: US$25,417mBrand Rating: AAA 2008: AA+Country: USA
Three weeks after receiving US$15bn from the US government, Bank of America announced a doubling of its stake in China Construction Banking Corp. This signals a continuation of Bank of America's aggressive acquisitions, which over the past decade has led to its transformation from a regional institution into America's largest brokerage house and consumer banking franchise. Taking advantage of the mortgage meltdown, it moved rapidly to acquire Merrill Lynch, the most recognised name on Wall Street, at a cost of US$50bn, transforming itself almost over-night into the nation's largest player in wealth management; and Countrywide Financial for US$4bn, rescuing it from possible bankruptcy. The latter’s exposure to sub-prime could hurt the bank, but its acquisitions have made Bank of America the US bank with the most branches, customers and checking accounts; having also added LaSalle Bank and MBNA as sub-brands over the last few years.
Retail
Other
Mortgages
Cards
Insurance
Wholesale
Asset Manager
Commerical
Key
13.83%
15.64%
12.98%
6.30%
9.23%
66.0%
75.13%
Commentary on the Top 20 banking brands (cont.)
12
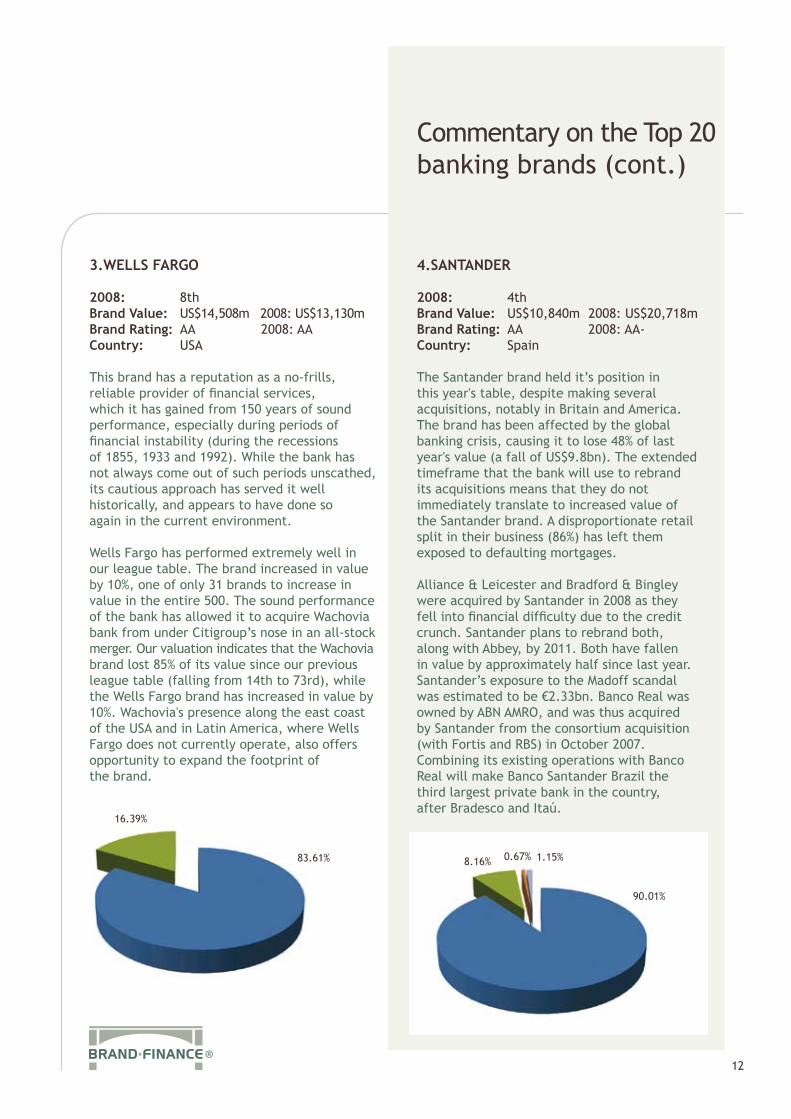
3.WELLS FARGO
2008: 8th Brand Value: US$14,508m 2008: US$13,130m Brand Rating: AA 2008: AACountry: USA
This brand has a reputation as a no-frills, reliable provider of financial services, which it has gained from 150 years of sound performance, especially during periods of financial instability (during the recessions of 1855, 1933 and 1992). While the bank has not always come out of such periods unscathed, its cautious approach has served it well historically, and appears to have done so again in the current environment.
Wells Fargo has performed extremely well in our league table. The brand increased in value by 10%, one of only 31 brands to increase in value in the entire 500. The sound performance of the bank has allowed it to acquire Wachovia bank from under Citigroup’s nose in an all-stock merger. Our valuation indicates that the Wachovia brand lost 85% of its value since our previous league table (falling from 14th to 73rd), while the Wells Fargo brand has increased in value by 10%. Wachovia's presence along the east coast of the USA and in Latin America, where Wells Fargo does not currently operate, also offers opportunity to expand the footprint of the brand.
4.SANTANDER
2008: 4th Brand Value: US$10,840m 2008: US$20,718mBrand Rating: AA 2008: AA-Country: Spain
The Santander brand held it’s position in this year's table, despite making several acquisitions, notably in Britain and America. The brand has been affected by the global banking crisis, causing it to lose 48% of last year's value (a fall of US$9.8bn). The extended timeframe that the bank will use to rebrand its acquisitions means that they do not immediately translate to increased value of the Santander brand. A disproportionate retail split in their business (86%) has left them exposed to defaulting mortgages.
Alliance & Leicester and Bradford & Bingley were acquired by Santander in 2008 as they fell into financial difficulty due to the credit crunch. Santander plans to rebrand both, along with Abbey, by 2011. Both have fallen in value by approximately half since last year. Santander’s exposure to the Madoff scandal was estimated to be €2.33bn. Banco Real was owned by ABN AMRO, and was thus acquired by Santander from the consortium acquisition (with Fortis and RBS) in October 2007. Combining its existing operations with Banco Real will make Banco Santander Brazil the third largest private bank in the country, after Bradesco and Itaú.
16.39%
83.61% 8.16% 0.67% 1.15%
90.01%
Commentary on the Top 20 banking brands (cont.)
13
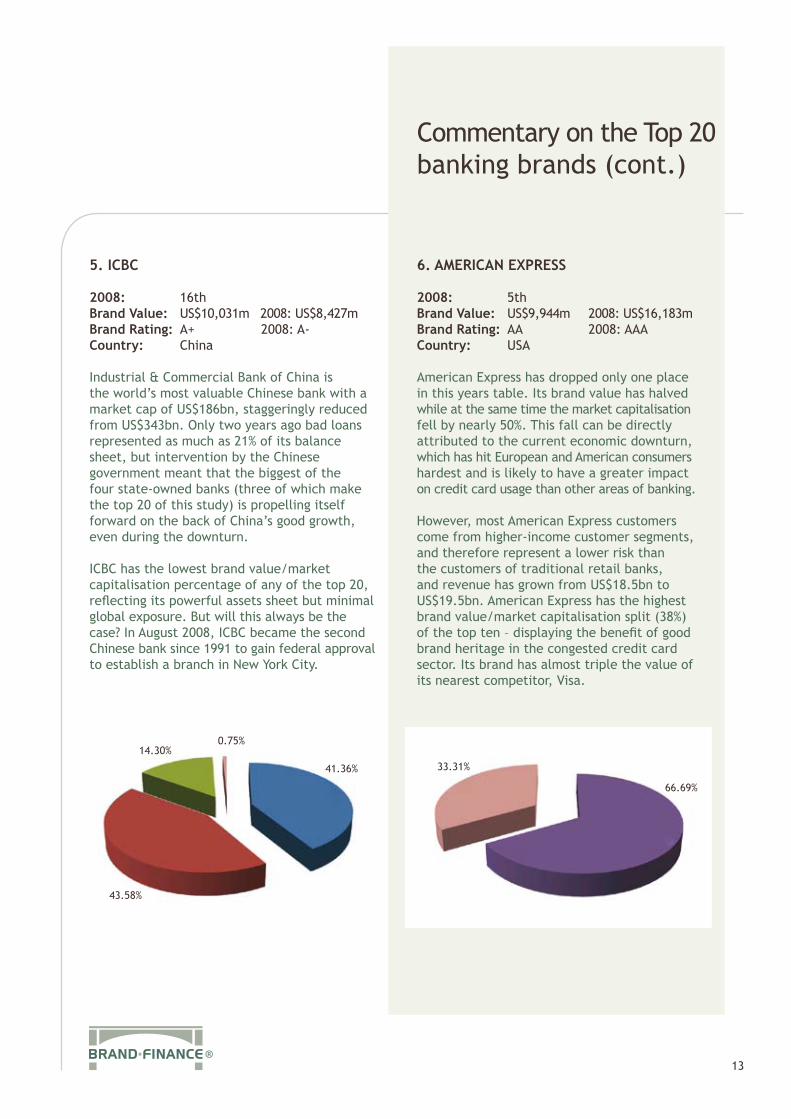
5. ICBC
2008: 16th Brand Value: US$10,031m 2008: US$8,427mBrand Rating: A+ 2008: A-Country: China
Industrial & Commercial Bank of China is the world’s most valuable Chinese bank with a market cap of US$186bn, staggeringly reduced from US$343bn. Only two years ago bad loans represented as much as 21% of its balance sheet, but intervention by the Chinese government meant that the biggest of the four state-owned banks (three of which make the top 20 of this study) is propelling itself forward on the back of China’s good growth, even during the downturn.
ICBC has the lowest brand value/market capitalisation percentage of any of the top 20, reflecting its powerful assets sheet but minimal global exposure. But will this always be the case? In August 2008, ICBC became the second Chinese bank since 1991 to gain federal approval to establish a branch in New York City.
6. AMERICAN EXPRESS
2008: 5thBrand Value: US$9,944m 2008: US$16,183mBrand Rating: AA 2008: AAA Country: USA
American Express has dropped only one place in this years table. Its brand value has halved while at the same time the market capitalisation fell by nearly 50%. This fall can be directly attributed to the current economic downturn, which has hit European and American consumers hardest and is likely to have a greater impact on credit card usage than other areas of banking.
However, most American Express customers come from higher-income customer segments, and therefore represent a lower risk than the customers of traditional retail banks, and revenue has grown from US$18.5bn to US$19.5bn. American Express has the highest brand value/market capitalisation split (38%) of the top ten – displaying the benefit of good brand heritage in the congested credit card sector. Its brand has almost triple the value of its nearest competitor, Visa.
43.58%
14.30%0.75%
41.36% 33.31%
66.69%
Commentary on the Top 20 banking brands (cont.)
14
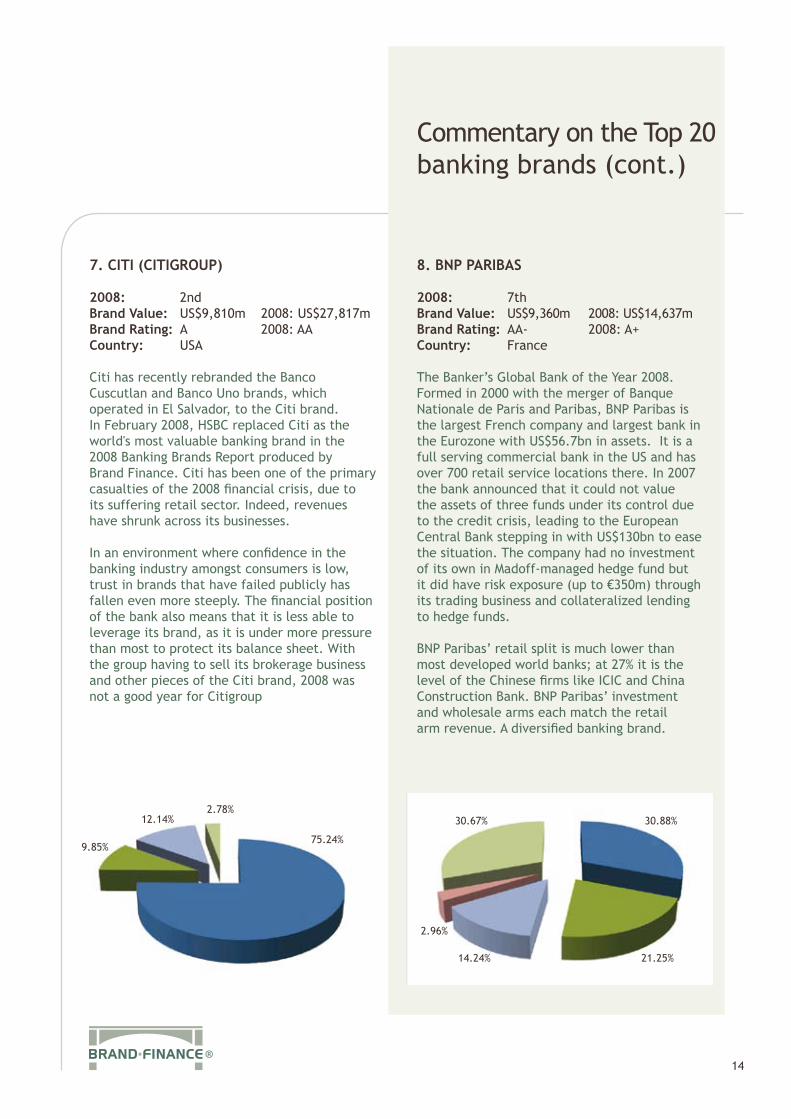
7. CITI (CITIGROUP)
2008: 2nd Brand Value: US$9,810m 2008: US$27,817m Brand Rating: A 2008: AACountry: USA
Citi has recently rebranded the Banco Cuscutlan and Banco Uno brands, which operated in El Salvador, to the Citi brand. In February 2008, HSBC replaced Citi as the world's most valuable banking brand in the 2008 Banking Brands Report produced by Brand Finance. Citi has been one of the primary casualties of the 2008 financial crisis, due to its suffering retail sector. Indeed, revenues have shrunk across its businesses.
In an environment where confidence in the banking industry amongst consumers is low, trust in brands that have failed publicly has fallen even more steeply. The financial position of the bank also means that it is less able to leverage its brand, as it is under more pressure than most to protect its balance sheet. With the group having to sell its brokerage business and other pieces of the Citi brand, 2008 was not a good year for Citigroup
8. BNP PARIBAS
2008: 7th Brand Value: US$9,360m 2008: US$14,637mBrand Rating: AA- 2008: A+Country: France
The Banker’s Global Bank of the Year 2008. Formed in 2000 with the merger of Banque Nationale de Paris and Paribas, BNP Paribas is the largest French company and largest bank in the Eurozone with US$56.7bn in assets. It is a full serving commercial bank in the US and has over 700 retail service locations there. In 2007 the bank announced that it could not value the assets of three funds under its control due to the credit crisis, leading to the European Central Bank stepping in with US$130bn to ease the situation. The company had no investment of its own in Madoff-managed hedge fund but it did have risk exposure (up to €350m) through its trading business and collateralized lending to hedge funds.
BNP Paribas’ retail split is much lower than most developed world banks; at 27% it is the level of the Chinese firms like ICIC and China Construction Bank. BNP Paribas’ investment and wholesale arms each match the retail arm revenue. A diversified banking brand.
9.85%
12.14%2.78%
75.24%
30.67%
2.96%
14.24%
30.88%
21.25%
Commentary on the Top 20 banking brands (cont.)
15
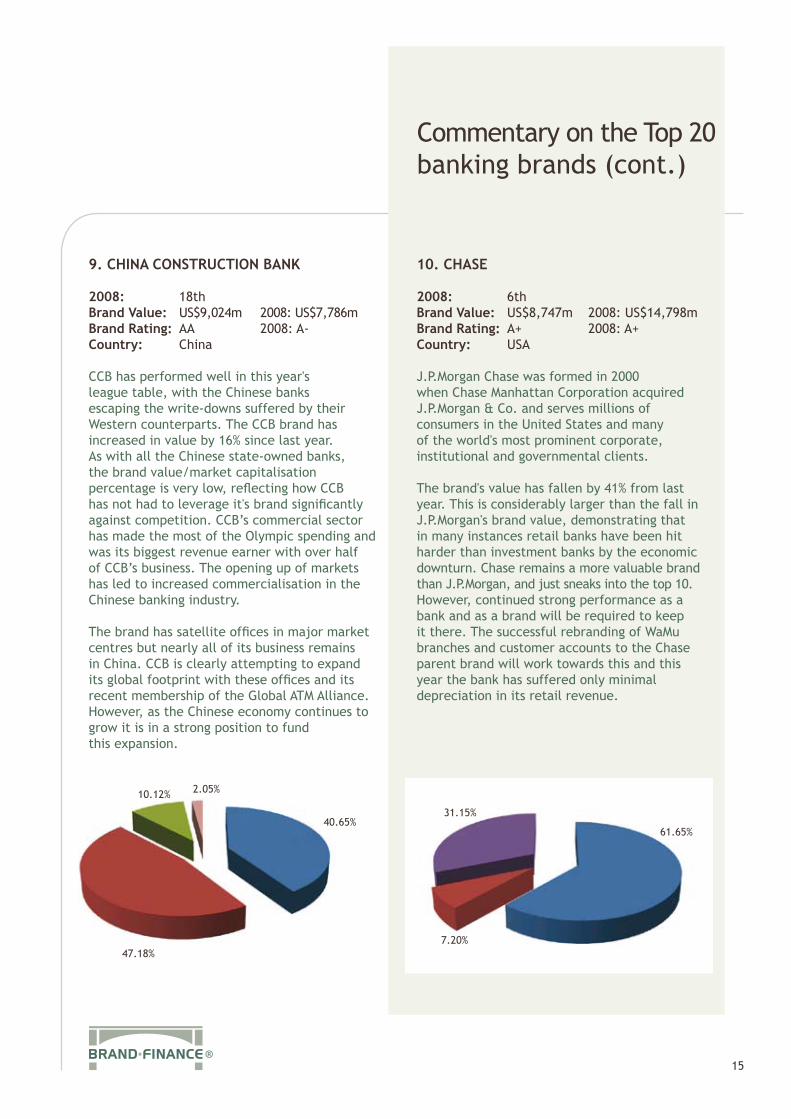
9. CHINA CONSTRUCTION BANK
2008: 18thBrand Value: US$9,024m 2008: US$7,786mBrand Rating: AA 2008: A-Country: China
CCB has performed well in this year's league table, with the Chinese banks escaping the write-downs suffered by their Western counterparts. The CCB brand has increased in value by 16% since last year. As with all the Chinese state-owned banks, the brand value/market capitalisation percentage is very low, reflecting how CCB has not had to leverage it's brand significantly against competition. CCB’s commercial sector has made the most of the Olympic spending and was its biggest revenue earner with over half of CCB’s business. The opening up of markets has led to increased commercialisation in the Chinese banking industry.
The brand has satellite offices in major market centres but nearly all of its business remains in China. CCB is clearly attempting to expand its global footprint with these offices and its recent membership of the Global ATM Alliance. However, as the Chinese economy continues to grow it is in a strong position to fund this expansion.
10. CHASE
2008: 6th Brand Value: US$8,747m 2008: US$14,798mBrand Rating: A+ 2008: A+Country: USA
J.P.Morgan Chase was formed in 2000 when Chase Manhattan Corporation acquired J.P.Morgan & Co. and serves millions of consumers in the United States and many of the world's most prominent corporate, institutional and governmental clients.
The brand's value has fallen by 41% from last year. This is considerably larger than the fall in J.P.Morgan's brand value, demonstrating that in many instances retail banks have been hit harder than investment banks by the economic downturn. Chase remains a more valuable brand than J.P.Morgan, and just sneaks into the top 10. However, continued strong performance as a bank and as a brand will be required to keep it there. The successful rebranding of WaMu branches and customer accounts to the Chase parent brand will work towards this and this year the bank has suffered only minimal depreciation in its retail revenue.
47.18%
2.05%10.12%
40.65%
7.20%
31.15%
61.65%
Commentary on the Top 20 banking brands (cont.)
16
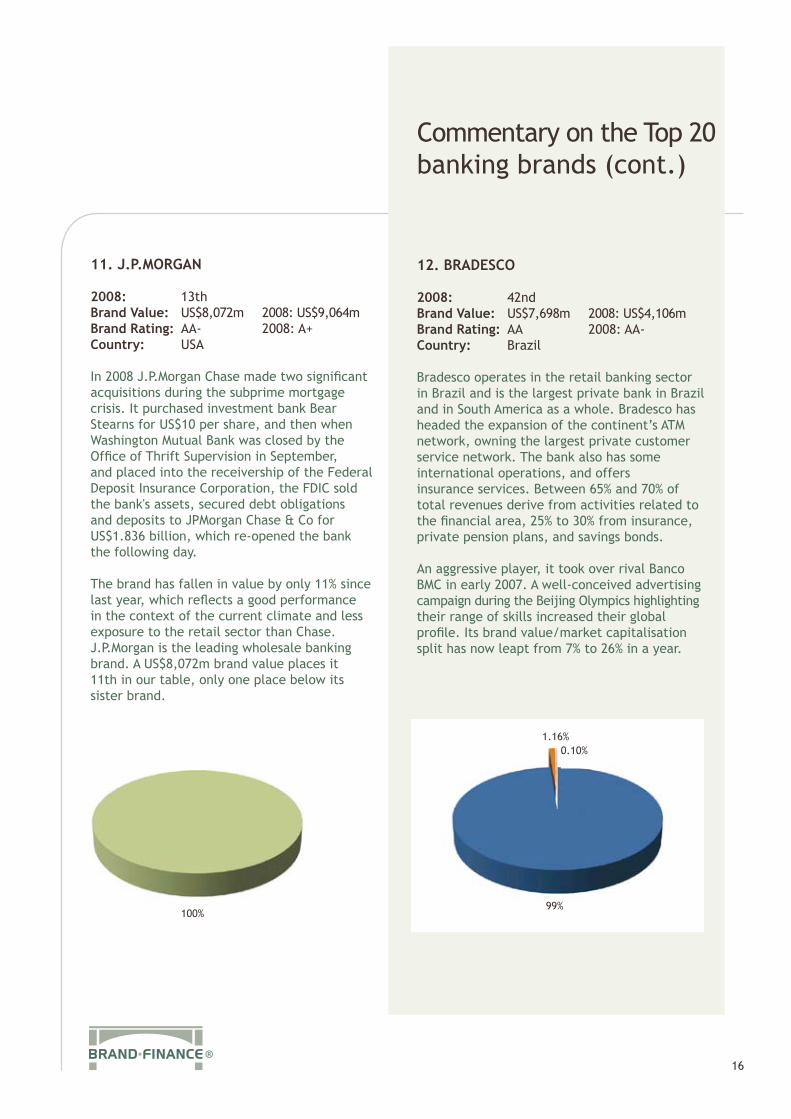
11. J.P.MORGAN
2008: 13th Brand Value: US$8,072m 2008: US$9,064mBrand Rating: AA- 2008: A+ Country: USA
In 2008 J.P.Morgan Chase made two significant acquisitions during the subprime mortgage crisis. It purchased investment bank Bear Stearns for US$10 per share, and then when Washington Mutual Bank was closed by the Office of Thrift Supervision in September, and placed into the receivership of the Federal Deposit Insurance Corporation, the FDIC sold the bank's assets, secured debt obligations and deposits to JPMorgan Chase & Co for US$1.836 billion, which re-opened the bank the following day.
The brand has fallen in value by only 11% since last year, which reflects a good performance in the context of the current climate and less exposure to the retail sector than Chase. J.P.Morgan is the leading wholesale banking brand. A US$8,072m brand value places it 11th in our table, only one place below its sister brand.
12. BRADESCO
2008: 42nd Brand Value: US$7,698m 2008: US$4,106mBrand Rating: AA 2008: AA-Country: Brazil
Bradesco operates in the retail banking sector in Brazil and is the largest private bank in Brazil and in South America as a whole. Bradesco has headed the expansion of the continent’s ATM network, owning the largest private customer service network. The bank also has some international operations, and offers insurance services. Between 65% and 70% of total revenues derive from activities related to the financial area, 25% to 30% from insurance, private pension plans, and savings bonds.
An aggressive player, it took over rival Banco BMC in early 2007. A well-conceived advertising campaign during the Beijing Olympics highlighting their range of skills increased their global profile. Its brand value/market capitalisation split has now leapt from 7% to 26% in a year.
100%
1.16%0.10%
99%

Commentary on the Top 20 banking brands (cont.)
17
13. CREDIT SUISSE
2008: 10thBrand Value: US$7,668m 2008: US$12,140mBrand Rating: AA+ 2008: A-Country: Switzerland
The Banker’s 2007 "Global Investment Bank of the Year" has fallen on hard times. Its investment arm has seen revenue drop dramatically from US$15.6bn to US$8.5bn while its retail and asset management divisions have seen falls too. The company lost US$2.5bn in the two months to the end of November and is cutting 11% of its workforce, mainly in the investment arm. Investor confidence is certainly diminishing with the share-price down two-thirds in value at some points during the year. Credit Suisse said that inflows and profitability in its private banking business remained good.
The reputation of Swiss banks for prudent operating has suffered as Credit Suisse’s write-downs have been reported, and the Swiss government is forcing super-capitalisation on its banks which means Credit Suisse will practically be shut out of any capital-intensive financing activities - such as the lucrative business of financing takeovers.
14. BARCLAYS
2008: 11th Brand Value: US$7,583m 2008: US$11,582mBrand Rating: A- 2008: A-Country: Britain
Barclays is set to post a profit for 2008. A busy year saw the bank buying pieces of Lehman Brother’s core North American assets and re-capitalising through sovereign wealth funds.Write-downs on it's huge balance sheet were less than expected but there is a genuine fear after the near-total nationalization of RBS that Barclays could end up in state hands, with the share-price plummeting to a 17 year low. The bank has been criticized for not marking down asset values enough and there is increasing investor cynicism towards banks like Barclays’ declaring toxic assets.
Barclays’ ‘brand concept’ bank in Piccadilly showed that Barclays had its mind on front- running technological interaction with customers and developing brand awarness in synergy with its high-end sponsorship of the Premiership. Its strength in Africa and in the credit card sector has buoyed losses elsewhere in the business. Its brand value/market capitalisation split is, at 38%, the highest of any bank in the world and equalled only by American Express.
50.08%
4.97%
9.23%
35.72%
28.49%
19.21%
4.32% 0.14%
47.82%
Commentary on the Top 20 banking brands (cont.)
18
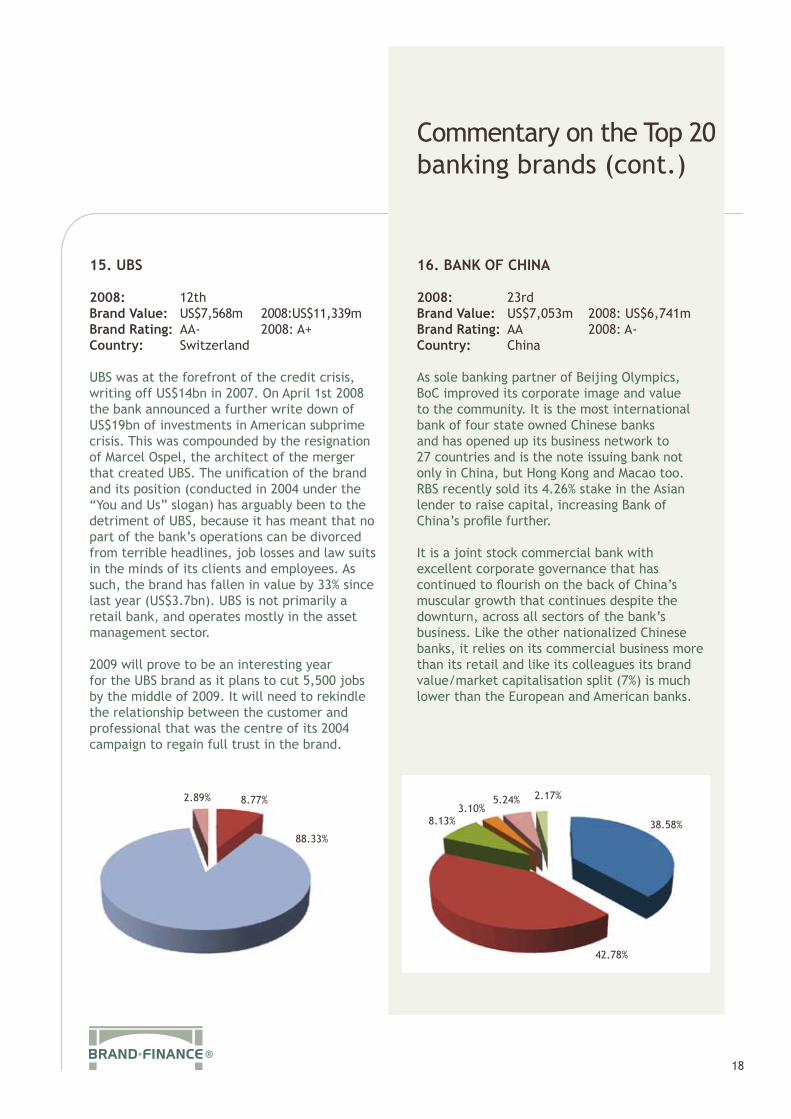
15. UBS
2008: 12thBrand Value: US$7,568m 2008:US$11,339mBrand Rating: AA- 2008: A+Country: Switzerland
UBS was at the forefront of the credit crisis, writing off US$14bn in 2007. On April 1st 2008 the bank announced a further write down of US$19bn of investments in American subprime crisis. This was compounded by the resignation of Marcel Ospel, the architect of the merger that created UBS. The unification of the brand and its position (conducted in 2004 under the “You and Us” slogan) has arguably been to the detriment of UBS, because it has meant that no part of the bank’s operations can be divorced from terrible headlines, job losses and law suits in the minds of its clients and employees. As such, the brand has fallen in value by 33% since last year (US$3.7bn). UBS is not primarily a retail bank, and operates mostly in the asset management sector.
2009 will prove to be an interesting year for the UBS brand as it plans to cut 5,500 jobs by the middle of 2009. It will need to rekindle the relationship between the customer and professional that was the centre of its 2004 campaign to regain full trust in the brand.
16. BANK OF CHINA
2008: 23rd Brand Value: US$7,053m 2008: US$6,741mBrand Rating: AA 2008: A-Country: China
As sole banking partner of Beijing Olympics, BoC improved its corporate image and value to the community. It is the most international bank of four state owned Chinese banks and has opened up its business network to 27 countries and is the note issuing bank not only in China, but Hong Kong and Macao too. RBS recently sold its 4.26% stake in the Asian lender to raise capital, increasing Bank of China’s profile further.
It is a joint stock commercial bank with excellent corporate governance that has continued to flourish on the back of China’s muscular growth that continues despite the downturn, across all sectors of the bank’s business. Like the other nationalized Chinese banks, it relies on its commercial business more than its retail and like its colleagues its brand value/market capitalisation split (7%) is much lower than the European and American banks.
2.89% 8.77%
88.33%
42.78%
8.13%3.10%
5.24% 2.17%
38.58%

Commentary on the Top 20 banking brands (cont.)
19
17. GOLDMAN SACHS
2008: 9th Brand Value: US$6,753m 2008: US$12,520mBrand Rating: AAA- 2008: AACountry: USA
During the subprime crisis, Goldman Sachs profited from selling short subprime mortgage-backed securities. There was a plunge in revenue on its trading floor and in its investment banking division because of market fluctuation. Newest acquisitions include the subprime portfolio of folded Popular Financial Holdings in the third quarter of 2008. Despite posting its first loss since going public, Goldman Sachs employees netted US$2.6bn worth of bonuses, which was poorly received by the media in the times of executive level financial mismanagement. Its wholesale bank saw revenue drop from US$31bn in 2008 to US$20bn, its asset management revenue dropped from US$7bn to US$4.5bn while its investment arm has stayed steady.
CFO David Vinlar summed up the buoyant mood in the company that it has weathered the crisis better than most, saying he wanted to expand the group’s US$20bn base of deposits about five-fold. "The strategy is evolving," Viniar said. "We were an investment bank for 139 years and have been a bank holding company for three months. We're still a little new at this game." Goldman Sachs’ losses suggest that the image of this once formidable titan has been tarnished.
18. DEUTSCHE BANK
2008: 15th Brand Value: US$6,703m 2008: US$8,585mBrand Rating: AA- 2008: ACountry: Germany
Deutsche Bank expanded its presence in consumer banking during the downturn, buying a 27.4% stake in Germany’s biggest retail bank Postbank. It suffered extraordinary hits on its credit rating in equity derivatives despite reducing its balance sheet by €300bn. Germany’s biggest bank posted a net-loss of €4.8bn in the final quarter of 2008.
The boom time for Deutsche Banks investment arm seems to have come to an end with its retail business now providing a greater percentage of revenue for the bank. Investment banking revenue dropped from US$30.5bn to US$21.5bn.Despite the end of year palpitations, the brand has held its position due to its excellent geographic spread and performing brokerage.
14.80%
21.09%
67.05%
32.95%
64.11%
Commentary on the Top 20 banking brands (cont.)
20
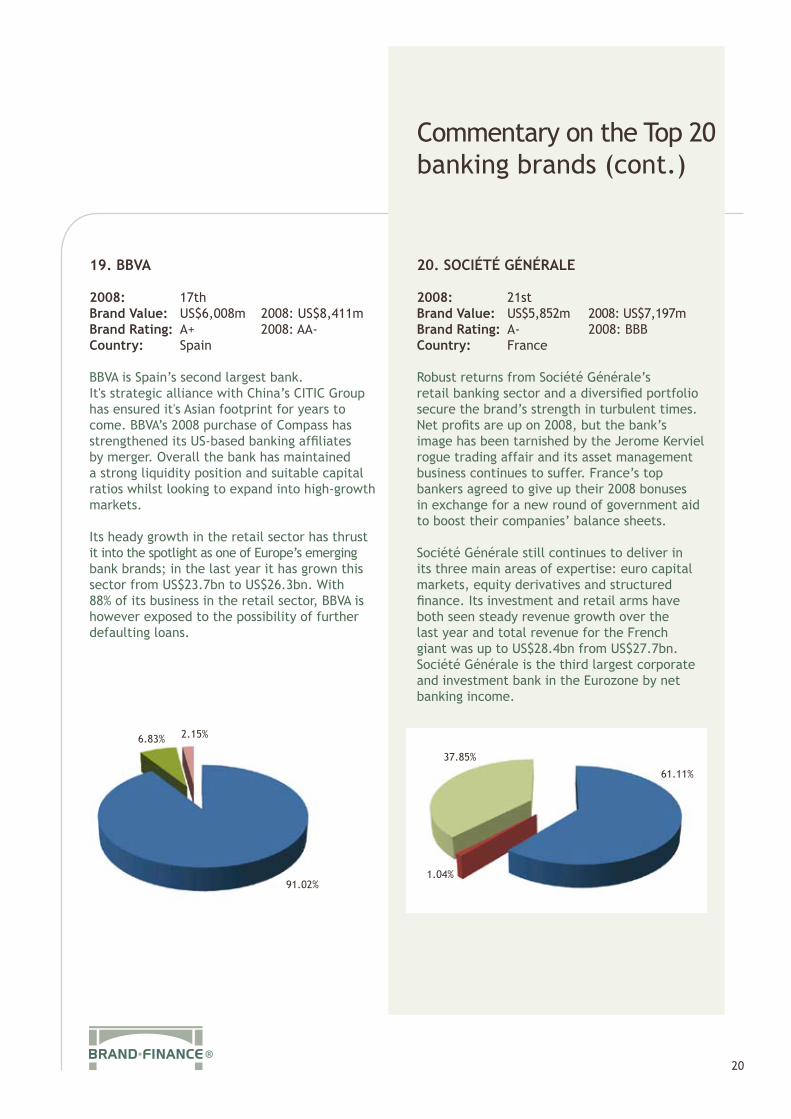
19. BBVA
2008: 17th Brand Value: US$6,008m 2008: US$8,411mBrand Rating: A+ 2008: AA-Country: Spain
BBVA is Spain’s second largest bank. It's strategic alliance with China’s CITIC Group has ensured it's Asian footprint for years to come. BBVA’s 2008 purchase of Compass has strengthened its US-based banking affiliates by merger. Overall the bank has maintained a strong liquidity position and suitable capital ratios whilst looking to expand into high-growth markets.
Its heady growth in the retail sector has thrust it into the spotlight as one of Europe’s emerging bank brands; in the last year it has grown this sector from US$23.7bn to US$26.3bn. With 88% of its business in the retail sector, BBVA is however exposed to the possibility of further defaulting loans.
20. SOCIÉTÉ GÉNÉRALE
2008: 21st Brand Value: US$5,852m 2008: US$7,197mBrand Rating: A- 2008: BBBCountry: France
Robust returns from Société Générale’s retail banking sector and a diversified portfolio secure the brand’s strength in turbulent times. Net profits are up on 2008, but the bank’s image has been tarnished by the Jerome Kerviel rogue trading affair and its asset management business continues to suffer. France’s top bankers agreed to give up their 2008 bonuses in exchange for a new round of government aid to boost their companies’ balance sheets.
Société Générale still continues to deliver in its three main areas of expertise: euro capital markets, equity derivatives and structured finance. Its investment and retail arms have both seen steady revenue growth over the last year and total revenue for the French giant was up to US$28.4bn from US$27.7bn. Société Générale is the third largest corporate and investment bank in the Eurozone by net banking income.
6.83% 2.15%
91.02%
37.85%
61.11%
1.04%
Sector & Regional Analysis
21
Within the BrandFinance® Global Banking 500, banks’ revenue streams have been split between five sectors to allow further analysis of their brand value. These sectors include: retail, commercial, wholesale, cards and asset management. Sectors are a ‘best fit’ grouping from the different reporting practices and terminology used by individual banks within the 500. It is important to note that while Brand Finance considers this information to be reliable, we cannot guarantee the accuracy or completeness of each bank’s reported data. In comparing and contrasting this year’s sector split to the 2008 Global Banking 500 we have reanalyzed past results to ensure the sectors are comparable. Due to differences in data sourcing between the 2008 and 2009’s reports, yearly change in brand value in the sectors of wholesale and asset management are not directly comparable.
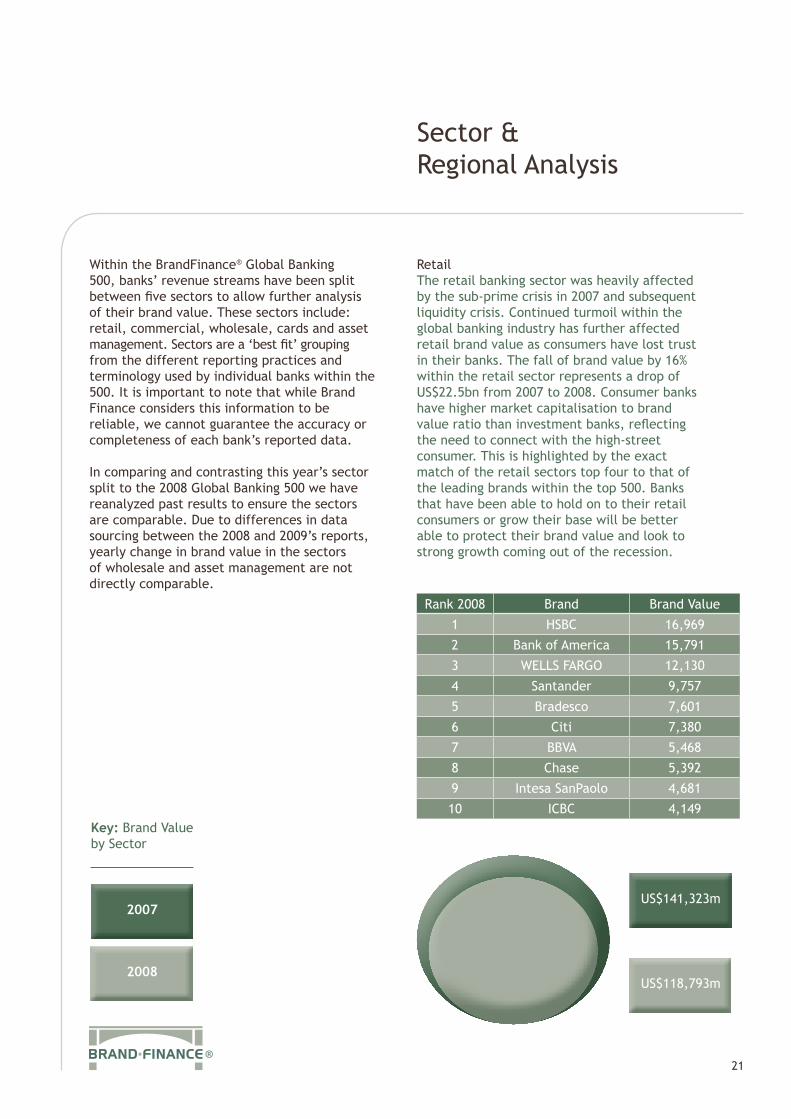
RetailThe retail banking sector was heavily affected by the sub-prime crisis in 2007 and subsequent liquidity crisis. Continued turmoil within the global banking industry has further affected retail brand value as consumers have lost trust in their banks. The fall of brand value by 16% within the retail sector represents a drop of US$22.5bn from 2007 to 2008. Consumer banks have higher market capitalisation to brand value ratio than investment banks, reflecting the need to connect with the high-street consumer. This is highlighted by the exact match of the retail sectors top four to that of the leading brands within the top 500. Banks that have been able to hold on to their retail consumers or grow their base will be better able to protect their brand value and look to strong growth coming out of the recession.
Rank 2008 Brand Brand Value
1 HSBC 16,969
2 Bank of America 15,791
3 WELLS FARGO 12,130
4 Santander 9,757
5 Bradesco 7,601
6 Citi 7,380
7 BBVA 5,468
8 Chase 5,392
9 Intesa SanPaolo 4,681
10 ICBC 4,149
US$141,323m
US$118,793m
2007
2008
Key: Brand Value by Sector

Sector & Regional Analysis (cont.)
22
Commercial The commercial banking sector, relating in this instance specifically to corporate banking, saw the second largest fall in brand value of 28%, a result of continuing corporate failures and loan write-offs. This highlights the effect of the halt in banks’ willingness to lend money and the subsequent tightening of liquidity seen globally. HSBC, top in the retail sector cement it's position as the leading brand through operations across different banking sectors, coming fourth with a brand value of US$3,291m. ICBC has been one of the success stories of the current crisis, jumping from 7th to 1st place in commercial banking and from 16th to 5th in the top 500 with an uplift in brand value of 20% (brand value: US$10,031m, brand rating A+).
Rank 2008 Brand Brand Value
1 ICBC 4,372
2 China Construction Bank 4,257
3 MUFG 3,384
4 HSBC 3,291
5 Bank of America 3,286
6 Bank of China 3,017
7 Banco do Brasil 2,864
8 Rabobank 2,624
9 Mizuho 2,547
10 Sberbank 1,729
WholesaleWholesale banking (which includes asset management in the year on year comparison) has fallen 9% in brand value over 2008, representing the smallest drop out of the comparable sectors. Amongst the top brands Goldman Sachs dropped to second place reporting a fall in wholesale revenue from US$31bn in 2007 to US$20bn in 2008. Attempting to protect it's brand, Goldman Sachs became a bank holding company in late September taking the security that is included in the regulation provided by the US Federal Reserve. J.P.Morgan took first place from Goldman Sachs whilst losing only 11% in brand value. J.P.Morgan’s lack of exposure to the retail market was supported by its dominance in the wholesale market and improved its overall group performance.
Rank 2008 Brand Brand Value
1 J.P.Morgan 8,072
2 Goldman Sachs 5,754
3 BNP Paribas 4,860
4 Deutsche Bank 4,494
5 Credit Suisse 3,840
6 HSBC 3,507
7 Morgan Stanley 3,104
8 WELLS FARGO 2,378
9 PRUDENTIAL 2,347
10 Société Générale 2,215
US$41,307m
US$29,641m
US$63,329m
US$57,722m
Sector & Regional Analysis (cont.)
23
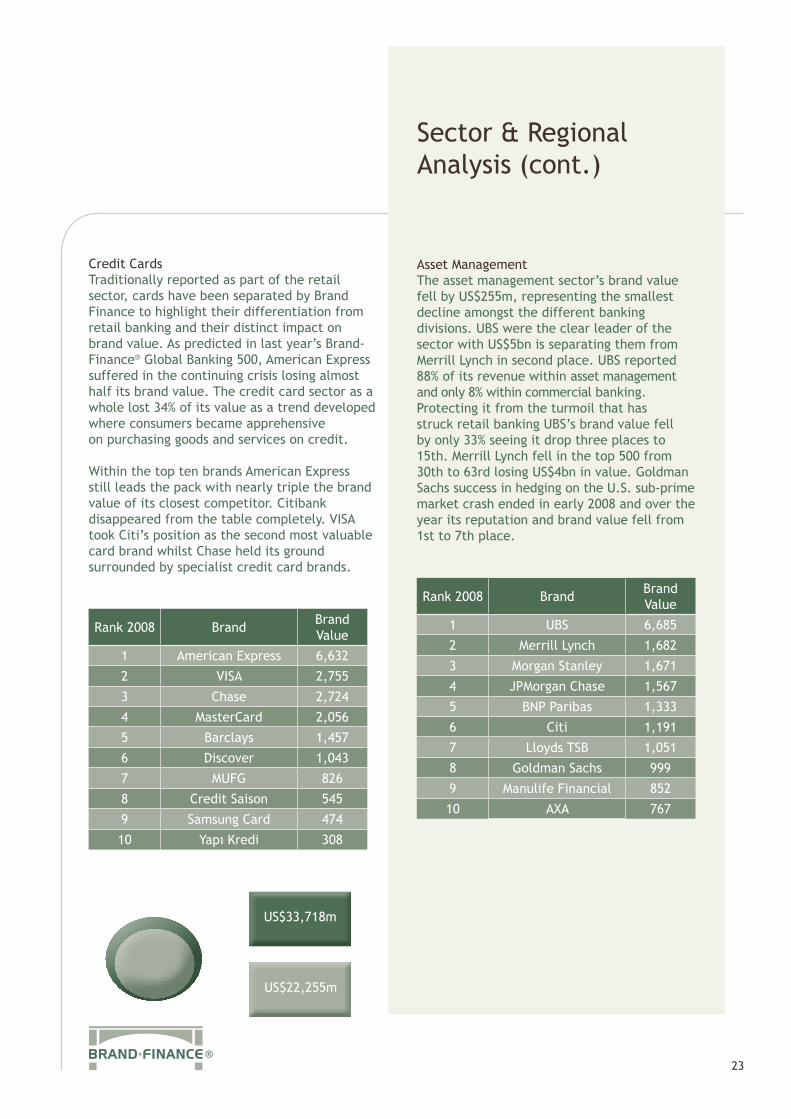
Credit CardsTraditionally reported as part of the retail sector, cards have been separated by Brand Finance to highlight their differentiation from retail banking and their distinct impact on brand value. As predicted in last year’s Brand-Finance® Global Banking 500, American Express suffered in the continuing crisis losing almost half its brand value. The credit card sector as a whole lost 34% of its value as a trend developed where consumers became apprehensive on purchasing goods and services on credit. Within the top ten brands American Express still leads the pack with nearly triple the brand value of its closest competitor. Citibank disappeared from the table completely. VISA took Citi’s position as the second most valuable card brand whilst Chase held its ground surrounded by specialist credit card brands.
Rank 2008 Brand Brand Value
1 American Express 6,632
2 VISA 2,755
3 Chase 2,724
4 MasterCard 2,056
5 Barclays 1,457
6 Discover 1,043
7 MUFG 826
8 Credit Saison 545
9 Samsung Card 474
10 Yapı Kredi 308
Asset ManagementThe asset management sector’s brand value fell by US$255m, representing the smallest decline amongst the different banking divisions. UBS were the clear leader of the sector with US$5bn is separating them from Merrill Lynch in second place. UBS reported 88% of its revenue within asset management and only 8% within commercial banking. Protecting it from the turmoil that has struck retail banking UBS’s brand value fell by only 33% seeing it drop three places to 15th. Merrill Lynch fell in the top 500 from 30th to 63rd losing US$4bn in value. Goldman Sachs success in hedging on the U.S. sub-prime market crash ended in early 2008 and over the year its reputation and brand value fell from 1st to 7th place.
Rank 2008 Brand Brand Value
1 UBS 6,685
2 Merrill Lynch 1,682
3 Morgan Stanley 1,671
4 JPMorgan Chase 1,567
5 BNP Paribas 1,333
6 Citi 1,191
7 Lloyds TSB 1,051
8 Goldman Sachs 999
9 Manulife Financial 852
10 AXA 767
US$33,718m
US$22,255m
Sector & Regional Analysis (cont.)
24
REGIONAL ANALYSISAs the banking turmoil spread globally, the epicentre of the crisis saw the largest fall in brand value with America and Europe’s loss representing 90% of global fall. This saw a number of the established brands fall out of the top 500 to be replaced by developing nation bank brands that, through localised operations, have performed with greater consistency than the multinational giants.
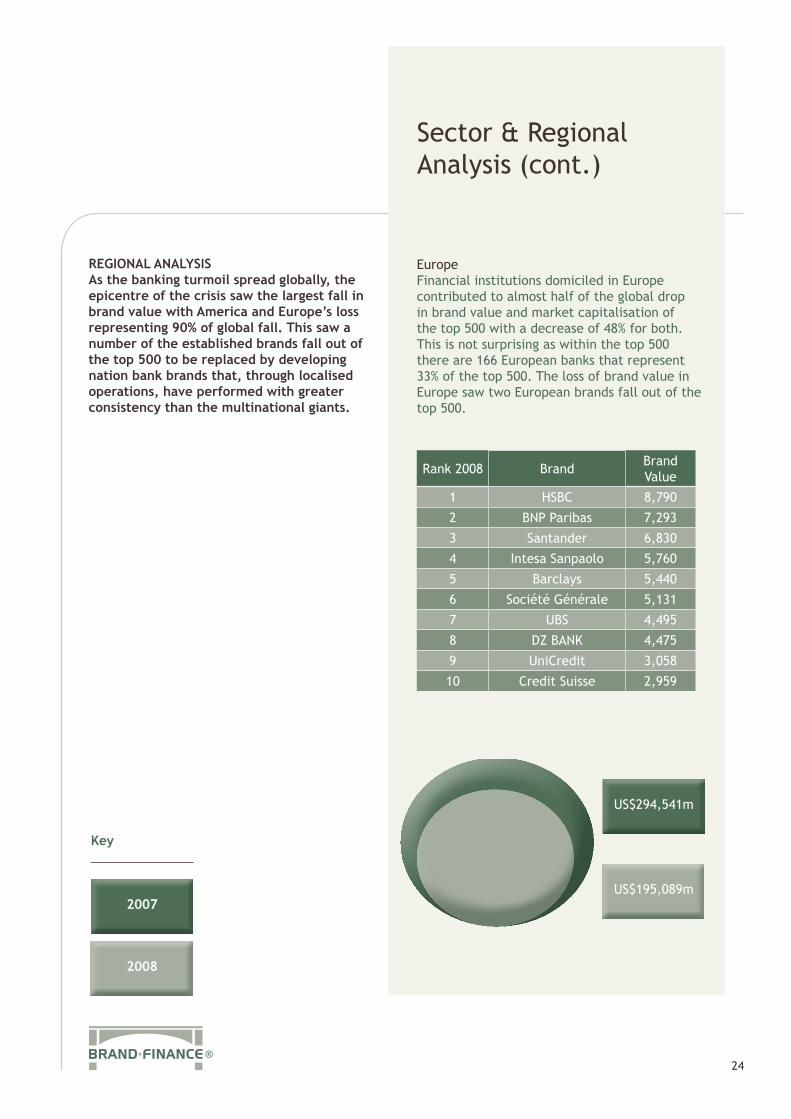
EuropeFinancial institutions domiciled in Europe contributed to almost half of the global drop in brand value and market capitalisation of the top 500 with a decrease of 48% for both. This is not surprising as within the top 500 there are 166 European banks that represent 33% of the top 500. The loss of brand value in Europe saw two European brands fall out of the top 500.
Rank 2008 Brand Brand Value
1 HSBC 8,790
2 BNP Paribas 7,293
3 Santander 6,830
4 Intesa Sanpaolo 5,760
5 Barclays 5,440
6 Société Générale 5,131
7 UBS 4,495
8 DZ BANK 4,475
9 UniCredit 3,058
10 Credit Suisse 2,959
US$294,541m
US$195,089m2007
2008
Key

Sector & Regional Analysis (cont.)
25
North AmericaNorth America was the second biggest contributor to the overall loss in brand value representing 42%. There was a fall of US$88bn in the market capitalisation of financial institutions domiciled in North America, contributing to only 17% of the global loss in market capitalisation. By itself, the US made up 40% of the loss in brand value and 14% of the total loss in market capitalisation, making it the country that contributed the most to the global loss in brand value and market capitalisation. In total 29 US companies have dropped out of the 2009 top 500, mostly because of bankruptcy.
Rank 2008 Brand Brand Value
1 Bank of America 18,930
2 WELLS FARGO 14,508
3 American Express 6,941
4 HSBC 6,519
5 Chase 6,389
6 J.P.Morgan 5,896
7 Citi 4,384
8 RBC 3,847
9 TD 2,963
10 U.S. Bank 2,933
AsiaAsia was the second biggest contributor to the overall loss in market capitalisation with a fall of 23%. However, banks with exposure in the region saw only small reductions in brand value as the Asian region contributed only 3% to the global fall in brand value. The Asian region is unsurprisingly dominated by banks based in China. However, HSBC is extremely prominent within this region as well many of the other regions, supporting its claim as the ‘World’s Local Bank’.
Rank 2008 Brand Brand Value
1 ICBC 9,794
2 China Construction Bank 8,866
3 Bank of China 6,907
4 HSBC 5,571
5 Sberbank 4,531
6 MUFG 4,051
7 SMFG 2,900
8 Mizuho 2,309
9 Shinhan Bank 2,226
10 Bank of Communications 2,188
US$92,488m
US$85,753m
US$237,988m
US$149,478m
Sector & Regional Analysis (cont.)
26
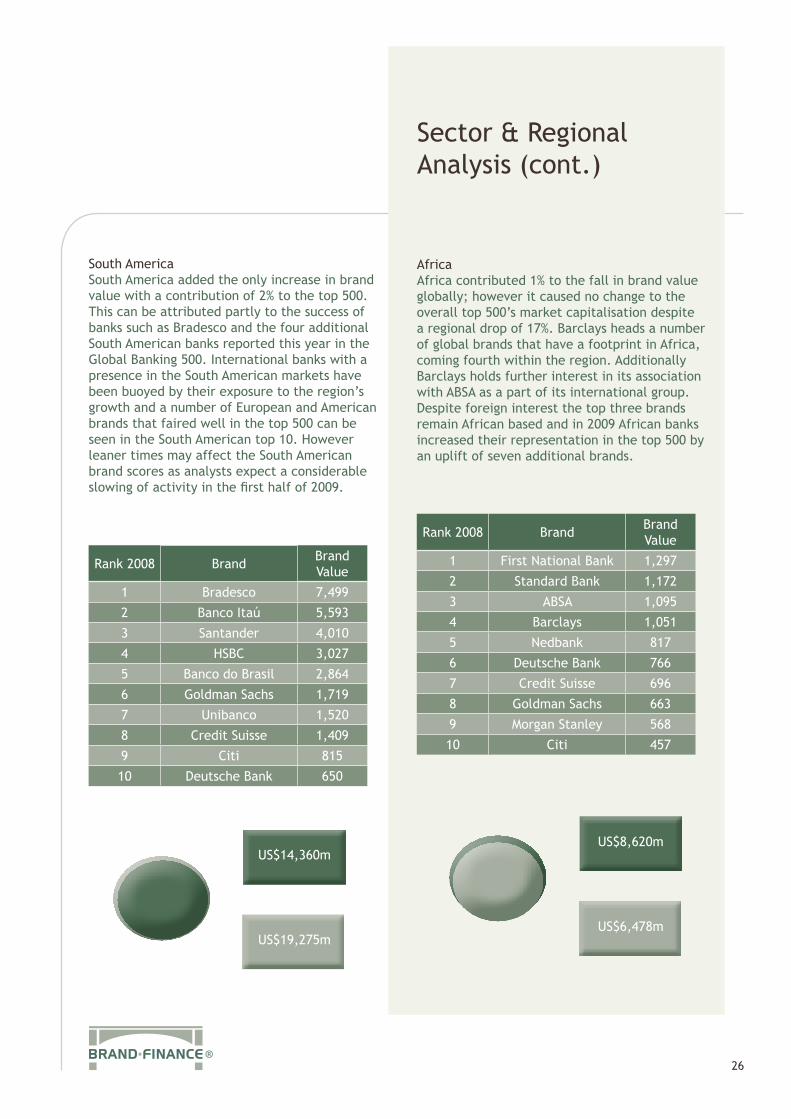
South AmericaSouth America added the only increase in brand value with a contribution of 2% to the top 500. This can be attributed partly to the success of banks such as Bradesco and the four additional South American banks reported this year in the Global Banking 500. International banks with a presence in the South American markets have been buoyed by their exposure to the region’s growth and a number of European and American brands that faired well in the top 500 can be seen in the South American top 10. However leaner times may affect the South American brand scores as analysts expect a considerable slowing of activity in the first half of 2009.
Rank 2008 Brand Brand Value
1 Bradesco 7,499
2 Banco Itaú 5,593
3 Santander 4,010
4 HSBC 3,027
5 Banco do Brasil 2,864
6 Goldman Sachs 1,719
7 Unibanco 1,520
8 Credit Suisse 1,409
9 Citi 815
10 Deutsche Bank 650
AfricaAfrica contributed 1% to the fall in brand value globally; however it caused no change to the overall top 500’s market capitalisation despite a regional drop of 17%. Barclays heads a number of global brands that have a footprint in Africa, coming fourth within the region. Additionally Barclays holds further interest in its association with ABSA as a part of its international group. Despite foreign interest the top three brands remain African based and in 2009 African banks increased their representation in the top 500 by an uplift of seven additional brands.
Rank 2008 Brand Brand Value
1 First National Bank 1,297
2 Standard Bank 1,172
3 ABSA 1,095
4 Barclays 1,051
5 Nedbank 817
6 Deutsche Bank 766
7 Credit Suisse 696
8 Goldman Sachs 663
9 Morgan Stanley 568
10 Citi 457
US$8,620m
US$6,478m
US$14,360m
US$19,275m
Sector & Regional Analysis (cont.)
27
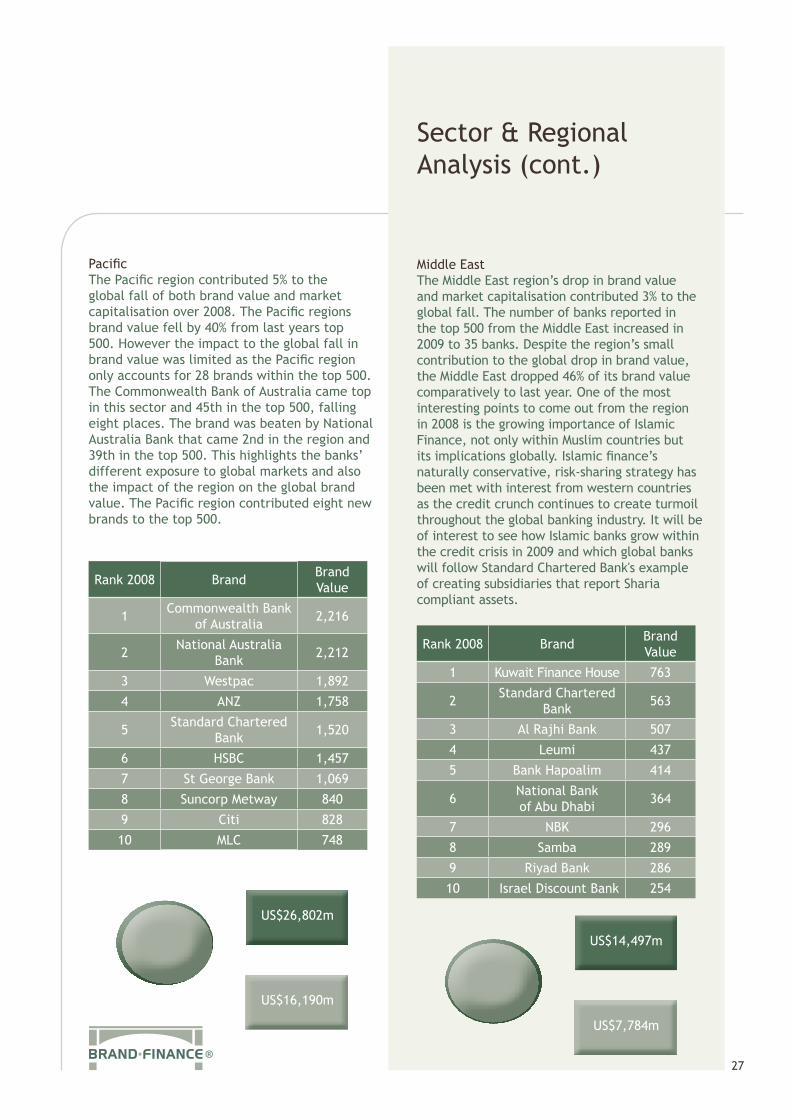
PacificThe Pacific region contributed 5% to the global fall of both brand value and market capitalisation over 2008. The Pacific regions brand value fell by 40% from last years top 500. However the impact to the global fall in brand value was limited as the Pacific region only accounts for 28 brands within the top 500. The Commonwealth Bank of Australia came top in this sector and 45th in the top 500, falling eight places. The brand was beaten by National Australia Bank that came 2nd in the region and 39th in the top 500. This highlights the banks’ different exposure to global markets and also the impact of the region on the global brand value. The Pacific region contributed eight new brands to the top 500.
Rank 2008 Brand Brand Value
1 Commonwealth Bank of Australia 2,216
2 National Australia Bank 2,212
3 Westpac 1,892
4 ANZ 1,758
5 Standard Chartered Bank 1,520
6 HSBC 1,457
7 St George Bank 1,069
8 Suncorp Metway 840
9 Citi 828
10 MLC 748
Middle EastThe Middle East region’s drop in brand value and market capitalisation contributed 3% to the global fall. The number of banks reported in the top 500 from the Middle East increased in 2009 to 35 banks. Despite the region’s small contribution to the global drop in brand value, the Middle East dropped 46% of its brand value comparatively to last year. One of the most interesting points to come out from the region in 2008 is the growing importance of Islamic Finance, not only within Muslim countries but its implications globally. Islamic finance’s naturally conservative, risk-sharing strategy has been met with interest from western countries as the credit crunch continues to create turmoil throughout the global banking industry. It will be of interest to see how Islamic banks grow within the credit crisis in 2009 and which global banks will follow Standard Chartered Bank's example of creating subsidiaries that report Sharia compliant assets.
Rank 2008 Brand Brand Value
1 Kuwait Finance House 763
2 Standard Chartered Bank 563
3 Al Rajhi Bank 507
4 Leumi 437
5 Bank Hapoalim 414
6 National Bank of Abu Dhabi 364
7 NBK 296
8 Samba 289
9 Riyad Bank 286
10 Israel Discount Bank 254
US$14,497m
US$7,784m
US$26,802m
US$16,190m
Sector & Regional Analysis (cont.)
28
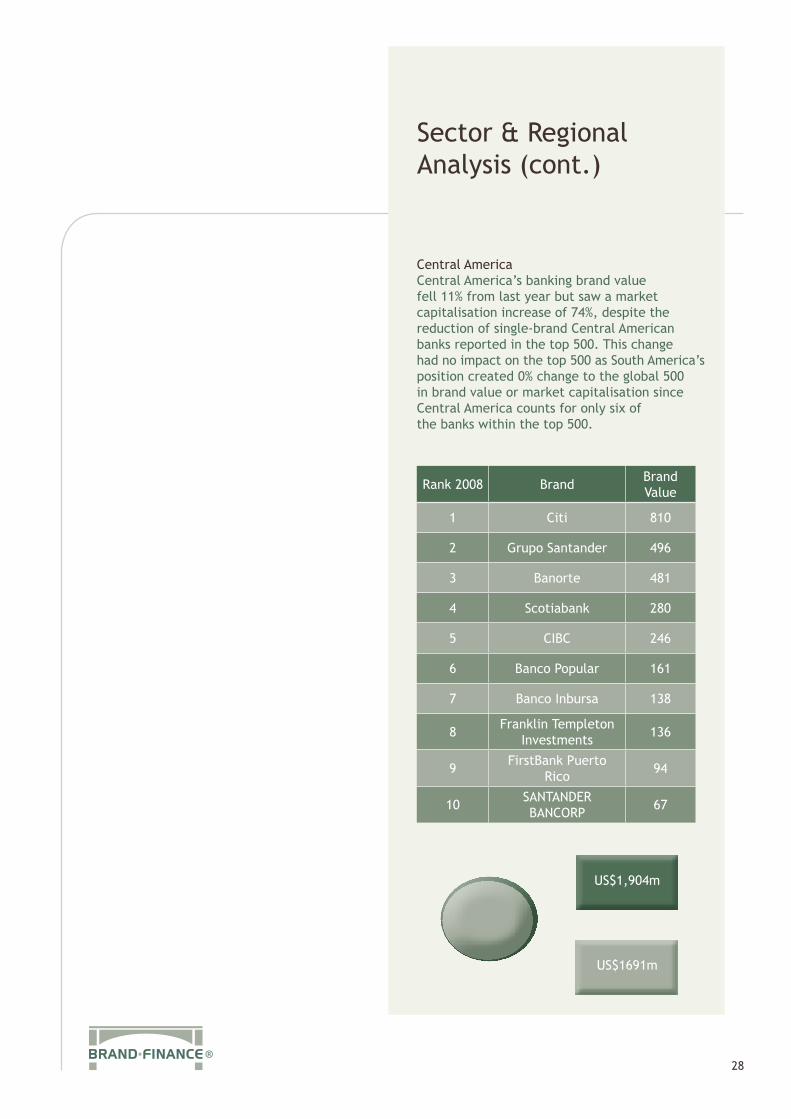
Central AmericaCentral America’s banking brand value fell 11% from last year but saw a market capitalisation increase of 74%, despite the reduction of single-brand Central American banks reported in the top 500. This change had no impact on the top 500 as South America’s position created 0% change to the global 500 in brand value or market capitalisation since Central America counts for only six of the banks within the top 500.
Rank 2008 Brand Brand Value
1 Citi 810
2 Grupo Santander 496
3 Banorte 481
4 Scotiabank 280
5 CIBC 246
6 Banco Popular 161
7 Banco Inbursa 138
8 Franklin Templeton Investments 136
9 FirstBank Puerto Rico 94
10 SANTANDER BANCORP 67
US$1,904m
US$1691m
Why is bank branding important?
29
During the recent market turmoil some have argued that branding is the last thing bank CEOs should be wasting their time on. Collapsing public confidence and wilting share prices are apparently the result of market or product failure, poor regulation, government incompetence, inept ratings agencies and economic circumstances. They are nothing to do with superficial issues like branding!
The characteristics of strong brands However, branding is far more important now than it has ever been, precisely because it is about much more than logos and marketing communications. It is about having a unique personality, a point of view and a ‘positioning’ in the hearts and minds of customers.
Strong brands have clear and guiding principles, values, behaviour and culture, which they consistently maintain. Strong brands don’t rely on external regulation to govern their behaviour. Their own strong value systems create powerful self regulation and balance. Apple, BBC, Body Shop, Co-operative, Innocent, PwC and Virgin are all brands which display these characteristics. They all stand for something genuine and worthwhile. As a result they are liked, respected and trusted by customers.
Take Virgin. In 1968, Richard Branson, the idealistic college drop out, developed an enduring brand promise. In his own words:
“The Virgin brand promise is based on five key factors: value for money, quality, reliability, innovation and an indefinable, but nonetheless palpable, sense of fun.”
“At Virgin, we know what the brand name means, and when we put our brand name on something, we’re making a promise. It’s a promise we’ve always kept and always will. It’s harder work keeping promises than making them, but there is no secret formula.
Virgin sticks to its principles and keeps its promises.”
Every customer who has been exposed to Virgin’s 300 businesses will recognize what he means and agree. Once Virgin Group stops delivering on its unique brand promise it will stop growing.
The power of the Virgin brand was seen in the banking arena when the UK Government’s made Virgin Money its preferred bidder for Northern Rock. During the downturn banks need to leverage the goodwill accrued from brands, maximizing brand performance in a market that looks increasingly competitive now the flow of credit has slowed.
The need for strong brand leadershipUnfortunately, Virgin’s clarity and strength of brand vision is sorely lacking in most banks. Even banks with strong customer loyalty and traditional brand values have been brought low by dumping their own guiding principles. Examples of this include Northern Rock, Bradford and Bingley, Halifax, Bank of Scotland and AIG.
So the demand for principled leadership with a clear perspective on what the brand stands for is stronger than ever. On top of the challenge of the novelty of brand management, a firm faces the challenge of staying relevant to its many different types of clients in the financial services world. Banks serve a variety of clients with differing needs, which in turn makes it difficult to build a brand that is relevant to all groups.
However, financial services firms can transform this challenge into an opportunity to tailor a more comprehensive group of products/ services to a specified client type. For example, the individual wealth management client not only benefits from the standard equity investments, IRA (Investment Retirement Account) and ISA (Investment Savings Account)

Why is bank branding important? (cont.)
30
accounts, but can also take advantage of foreign exchange services and innovative products like equity linked securities- once the sole domain of business clients. Another difficulty of financial brand management is the similarity of product offerings from firm to firm. Product innovations in financial services are short-lived since it is relatively easy to annex original products.
The result is that financial firms must find other aspects of their business, such as the client / advisor relationship, as a means to differentiate from the competition.
The difficulty in differentiating based on product offering leads to the elevation of the customer / advisor relationship to the most important driver of customer loyalty. This trend creates another challenge for financial services firms since the most influential ways of reaching the customer base are the most difficult to manage. Investment in the advisor results in a virtuous cycle where client-facing staff are more willing to engage clients, the brand is then strengthened, and client-facing staff become more enthusiastic about service delivery and deliver a consistent, branded experience.
A final set of challenges in financial services involves the difficulty of positioning brand(s) in the face of industry trends such as the global/local debate and recent merger and acquisition activity. The task of positioning a brand involves deciding which part of “what a brand stands for” will be actively communicated to the target audience. Many firms, from smaller banks to the biggest, have encountered the challenge of highlighting global capacity and simultaneously emphasizing the ability to deliver locally tailored products/ services. At the same time, the recent slew of mergers and acquisitions has required financial services firms to make significant decisions about the relationship between their brands. In light of their sub-brands’ performances,
banks like HBOS, Santander and RBS need to reconsider the branding of their domestic subsidiaries, as their multi-brand strategy has not protected them from the crunch.
Creating a strong brand management functionTo make sure that the brand promise is achieved a strong guardianship function is required. The best approach is to create a dedicated Brand Management Company to:
• Define brand vision and mission
• Articulate brand behavior and culture
• Plan and execute visual identity and brand communications
• Co-ordinate brand innovation and extension strategies
• Register, maintain and defend the brand’s intellectual property (trademarks, trade names, copyrights, design rights, URLs etc)
• Develop design and customer service guidelines
• Establish training and quality controls
• Value the brand and set terms, conditions and royalties for its use
• Manage brand licensing, joint venturing and partnerships
• Exercise central control and discipline
Happily, as well as being the right thing to do this approach is also the most profitable way of managing brands. Procurement, management, funding and tax are all optimized under a Brand Management Company structure.

Why is bank branding important? (cont.)
31
Understanding all key stakeholders While the most important audience for brands is their customers, it must never be forgotten that brands affect the attitude and behavior of all stakeholder groups.
Direct stakeholders:• Customers• Staff• Suppliers• Distributers• Finance providers
Indirect stakeholders:• Communities and general public• Government and regulatory bodies• Industry and professional peers• Special interest and pressure groups• Media
Brand ValuationBrand Valuations can help management decide the relative value of different brands and will help strategic decisions regarding portfolio re-views. Brand tracking systems using brand valu-ation techniques can also be operated so that management can track relative performance and redress marketing spend to those areas in which focus is needed.
At the core of the brand valuation are three work-studies. As standalone outputs each of these provides insight and value to a business. For a brand valuation, the strength arises from the combination of these elements.
Brand ForecastsThe first building block is the brand forecast. It requires two types of analysis.
a) Market Context Analysis This is based on an analysis of the size of the market (by major segment), market and industry trends, channel information, and constraints on demand• Financial Analysis
Historic p&ls and forecasts for three to five years at a predetermined level of segmentation. A due diligence of the forecasts is carried out on the forecasts based on the market and competitive analysis. Where forecasts are credible the valuation results are both robust and actionable.
Analysis of the Drivers of Demand (Brand Value Added – BVA™)The second ‘building block’ looks into the identification and relative importance of factors that are driving demand for the brand in each agreed segment. What is the relative contribution of, for example, location, prices, sales staff, product range, after sales service, image, promotions, etc?
Trade-off analysis can be conducted at a number of levels to identify the importance of the brand to the purchase decision from: one brand to another, one time period to another, one target audience sub-segment to another and one product class to another.
It is an invaluable, statistically robust means of attributing income to the brand within segments. In addition it can be used for tracking the changing importance of different drivers within given markets and segments, for planning resource allocation behind different drivers of demand and for tracking the effect such resource allocations may have on the profile of factors affecting demand for the brand. It can also be used to assist in anticipating future demand. If time and financial resources are available it is useful to evaluate the drivers of demand for competitor brands.
Competitive review (Brandbeta® Analysis)This is the third building block of the valuation process. The competitor analysis is based on internal databases, studies and existing third party research. One purpose is to calculate the discount rate which feeds into the valuation
Why is bank branding important? (cont.)
32
methodology, but as a stand-alone tool it is invaluable in determining where the brand fits versus it’s competitor set in any particular market segment.
The exact evaluation criteria need to be established with the management team in line with the data and research available – generic attributes can include, number of years in the market, distribution, market share, market position, sales growth, price premium, price elasticity, marketing/ media spend, advertising/ brand awareness, and perceived qualityAlthough the three building blocks involve independent processes they can be worked in parallel. A generic example of the final model is represented as to the left:
ConclusionBrands are a key driver of business and with further consolidation likely, in the banking sector, their value needs to be considered. Brand valuations can be used as a defensive ploy to attract a higher premium (or take-over at all) or as a post deal method of conducting a portfolio review and assessing what strategically will happen to both the acquired and existing portfolio of brands.
Brands are one of the most valuable intangible assets in business today “ “
Brand rationalisation
33
Simplicity is always hard to achieve at the best of times and with brand portfolios it can be virtually impossible. Brand Managers love creating new brands and acquisitions bring in additional brands to expand the portfolio. The trouble is that, like junk in the attic, no-one ever wants to throw anything away.
There are perfectly valid reasons for brand proliferation. Having different brands to service different channels to market as well as different customer segments can make a lot of sense. Similar products and services can be positioned and priced differently where the brands differ. Keeping brands that have developed strong customer loyalty is also compelling. Staff also cling to the brands they have worked with and don’t want to see them disappear. Nationalism and politics can also intervene.
In the banking world some like HSBC and Bank of America have cut the Gordian knot and simply transitioned huge and complex brand portfolios into strong and focussed mono-brands. Both have systematically eliminated smaller brands even where they may have had some residual brand equity. The benefit is clarity on a worldwide basis, standout from more fragmented organisations and far greater media communications efficiency.
It comes as no surprise to me that both these banks have performed well in the Brand Finance® Global Banking 500. HSBC is clear number one bank brand in terms of value and strength, supported by its positioning as the ‘world’s local bank’.
By contrast the HBOS and RBS groups made a virtue of their brand diversity, the famous ‘house of brands’ strategy rather than HSBC’s ‘branded house’. Perhaps it is no surprise that both these groups have displayed poor management, run into serious difficulties and have been all but nationalised.
Lloyds HBOS’ portfolio of brands looks unbalanced: in many areas it has two and, in some cases, three brands. Halifax and Bank of Scotland join the Lloyds TSB chain on the high street. In mortgages, Lloyds brings its Cheltenham & Gloucester brand to sit along-side Halifax, which has a 21% mortgage market share working alongside specialist mortgage arm Birmingham Midshires. In life assurance and pensions, Lloyds’ Scottish Widows and Scottish Widows Investment Partnerships join HBOS’s Clerical Medical and Halifax Life. HBOS even runs Sainsbury’s Bank.
The new Lloyds Group will have to review this catalogue of brands, weighing the need to streamline its acquisitions against the short term retention of some brands in case com-petition authorities demand their pound of flesh. Whether Halifax is a lethally-damaged brand name needs to be properly considered. Northern Rock is still going, despite collapsing last year and being nationalized. It seems the British public has a short memory for brand calamities. An incontestable fact is that the current disaster increases brand recognition. Nationalisation is a symptom of prior poor brand management, but for many investors it is also a statement of future security. People who invest in part- nationalised banks are protected by government assurances of capital. In India this has led to well managed private banks losing out to profligate nationalised brands that guarantee deposits with unearned government credit.
Not only is the new Lloyds Group likely to scrap a number of long-standing and well-known financial services brands, but it will also renounce many of the number of mortgage, savings and current account products on the market by axing the aggressive price-slashing tactics of Halifax.
Nationalisation in this way strikes a blow against the financial services industry’s capacity for consumer-marketing and development in
Brand rationalisation
34
favour of reconsolidating safely. Innovation is put aside for cost cutting; Lloyd’s TSB is looking to save £1bn of cost savings in the merger by 2011.
A feature of this year’s results is that not only have multi-brand banks done badly but also that the sub-brands have done worse than the lead brands. RBS has dropped less than NatWest and Citizens; there have been similar relation-ships with Santander and Abbey, Commerzbank and Eurohypo, not to mention Halifax and Bank of Scotland. Sub-brands are taking the hit as much as their parent brands. NatWest was never subsumed into the RBS brand, meaning that it suffered when the Bank of England bailed the parent company out to the tune of £20 billion in October. NatWest looked exposed without RBS’ emerging market presence to offset a disastrous year for UK retail and commercial banking business. Parent brands Santander and Commerzbank both performed better than their respective sub-brands Abbey and EuroHypo because global presence offsets localised deficiencies in particular sectors or regions.
The objective of a brand portfolio or brand valuation review is to identify which brands are performing in their sectors and which are not. The first step is to identify a brand rationalisation team of internal and external specialists, which has high level authority and support. The second is to define a framework of key information requirements and a sensible timetable for action. The third stage is to evaluate all brands and sub brands under different scenarios and the final stage is to define a measured action plan. Inevitably the devil is in the technical detail, (market research, financial, strategy) but the principles are simple common sense. For example a casual observer conducting a review of this type for BMW when it acquired Rover would have accepted that the two brands overlapped, that BMW was stronger and that Rover should have been quietly put to sleep.
After throwing hundreds of millions down the pan, BMW has sold Rover. Sadly for BMW emotion rather than objective evaluation prevailed.
Companies which own sector specific brands have found them precariously isolated. But hope comes from a leading marketing academic, Professor Andrew Ehrenberg: ‘From a narrow consumer perspective, brand equity merely reflects market share. Big brands generally score higher on consumer loyalty measures than small brands. This does not mean that big brands will necessarily grow bigger. It simply mirrors the fact they are already big.”

Explanation of Methodology
35
The methodology employed by Brand Finance in this Global Banking 500 listing uses a discounted cash flow (DCF) technique to discount estimated future royalties, at an appropriate discount rate, to arrive at a net present value (NPV) of the trademark and associated intellectual property: the brand value.
The steps in this process are:• Obtain brand-specific financial and revenue data. The revenue was then segmented into the following revenue streams: retail banking, commercial banking, wholesale banking, insurance, asset management and credit cards.
• Model the market to identify market demand and the position of individual banks in the context of all other market competitors. Three forecast periods were used: - Estimated financial results for 2008 using Institutional Brokers Estimate System (IBES) consensus forecast. - A five-year forecast period (2009-2013), based on three data sources (IBES, historic growth and GDP growth). - Perpetuity growth, based on a combination of growth expectations (GDP and IBES).
• Establish the royalty rate for each bank. This is done by: - Calculating brand strength – on a scale of 0 to 100 – for each product and service area, according to a number of attributes such as brand presence, emotional connection, market share and profitability, among others. - Determining the royalty rate for each of the revenue streams mentioned in step 1. - Calculate future royalty income stream.
• Calculate the discount rate specific to each bank, taking account of its size, geographical presence, reputation, gearing and brand rating (see below).
• Discount future royalty stream (explicit forecast and perpetuity periods) to a net present value – ie: the brand value.
Royalty Relief ApproachBrand Finance uses a ‘relief from royalty’ methodology that determines the value of the brand in relation to the royalty rate that would be payable for its use were it owned by a third party. The royalty rate is applied to future revenue to determine an earnings stream that is attributable to the brand. The brand earnings stream is then discounted back to a net present value.
The relief from royalty approach is used for two reasons: it is favoured by tax authorities and the courts because it calculates brand values by reference to documented third-party transactions; and it can be done based on publicly available financial information.
Brand RatingsThese are calculated using Brand Finance’s ßrandßeta® analysis, which benchmarks the strength, risk and future potential of a brand relative to its competitors on a scale ranging from AAA to D. It is conceptually similar to a credit rating.
The data used to calculate the ratings comes from various sources including Bloomberg, annual reports and Brand Finance research.
Brand Ratings DefinitionsRating Definition:
Brand Rating Strength
AAA Extremely strong
AA Very strong
A Strong
BBB-B Average
CCC-C Weak
DDD-D Failing
Valuation DateAll brand values in the report are for the end of the year, 31st December 2008.
Note: The AAA to A ratings can be altered by including a plus (+) or minus (-) sign to show their more detailed positioning.
About Brand Finance- a detailed overview
36
Intangible assets, most notably brands, are vital strategic and financial assets which marketers are increasingly being held accountable for managing and building. At the same time, finance directors and smart investors want greater understanding and disclosure of intangible asset values and marketing performance to improve their investment decisions.
We help our clients to value, articulate and build their intangible asset base using language and approaches understood by financial, marketing and investor audiences.
OUR EXPERIENCE The Brand Finance team has a unique combination of talents. We employ experienced consultants and analysts with backgrounds in accounting, finance, economics, investment banking, brand management, strategy and market research.
We work for blue chip companies across a wide range of sectors. We customise our tools and approaches to meet specific client needs. Our flexible approach has resulted in longstanding client relationships.
We provide a robust way of addressing client needs, combining commercial acumen, creativity, marketing insights and sound corporate finance practice.
OUR SERVICESValuationBrand Finance is the world’s leading independent brand valuation consultancy. We conduct valuation and analytics assignments for branded enterprises and branded businesses. We value brands, intangible assets and intellectual property in many jurisdictions for accounting, tax, corporate finance and marketing purposes.
We act on behalf of intellectual property owners, tax authorities and work closely with lawyers, private equity firms, and investment
About Brand Finance- a detailed overview (cont.)
37
banks. Our work is frequently peer-reviewed by independent audit practices and our approach has been accepted by regulatory bodies worldwide.
REASONS FOR BRAND VALUATION
Financial Reporting: Accounting standards in most developed markets allow for capitalisation of purchased intangible assets. The initial valuations and subsequent impairment reviews generally require the opinion of an independent valuation expert
Tax Planning: The growing importance of intangible assets has significant tax planning implications. Brand Finance works for both fiscal authorities and brand owners on transfer pricing and capital gains tax issues
Dispute Resolution: We have helped clients protect the commercial value of their brands through a range of licensing and trademark disputes that have been settled both in and out of court. We also provide litigation support work for various legal firms and IP companies
Marketing & Brand Management: There is an increasing demand from investors and analysts for information on brand value and brand performance. Brand Finance advises clients on both the external disclosures and required brand metrics. Our valuation services have assisted many companies to understand and improve the value of their intangible assets
Commercial Transactions: We help clients to determine the value of their intangible assets and enterprise value for mergers and acquisitions, negotiations, franchise and licensing and deal structuring to ensure that they make informed decisions
ANALYTICSOur analytical services help clients to better understand the drivers of business and brand value. Understanding how value is created, where it is created and the relationship between brand value and business value is a vital input to strategic decision making. By furthering knowledge of this relationship, Brand Finance is able to help clients’ leverage brand value and ultimately maximise share-holder value.
BRAND ANALYTIC SERVICES
Brand Scorecards: We help companies improve brand performance management and reporting by integrating market research, investment, market and financial metrics into a single insightful model to track performance over time and against competitors and to uncover the most important drivers of overall brand and business value
Competitor Benchmarking: We conduct a benchmarking study of the strength, risk and future potential of a clients brand relative to its competitor set. This helps understanding the strengths and weaknesses of the client brand compared with key competitor brands
Marketing Mix Modelling: We help improve the efficiency of brand campaign planning and targeting by isolating and quantifying the impact of different marketing activities. The model guides the mix and combination of future marketing activities
Marketing ROI: We help clients improve decision-making by providing insights which assist with budget optimisation, resource allocation, brand performance and evaluation of marketing activities
Combined with brand valuation results, our analytical service creates the framework for better corporate reporting and brand performance management

About Brand Finance- a detailed overview (cont.)
38
STRATEGYWe conduct market studies, market sizing, feasibility studies, brand audits and brand portfolio evaluation. Combining market intelligence, brand analytics, market research and financial assessment, we provide greater depth and insights into our clients’ strategies.
BRAND STRATEGY ADVISORY SERVICES
Brand Strategy Evaluation: We help clients make disciplined choices about how to maximise economic value, by providing a framework for optimal resource allocation and strategy selection. This helps identify the value optimising allocation of marketing investment, provides a strategic overview of the risks and returns associated with each market segment Strategic Optimisation: We help branded businesses increase their value. Using brand valuation techniques, we help clients determine the financial impact of different strategic brand options such as licensing, joint ventures, investment, divestment, brand architecture changes, entering or exiting new segments or markets and other transactions
Value Drivers Analysis: We help businesses understand the relationship between brand attributes and key value drivers in the business model. This is achieved by creating a framework for measuring brand equity and connecting it to value driving behaviour in each stakeholder group. Resources can then be allocated and prioritised based on the overall impact on financial value
Brand Architecture: We help companies evaluate different branding architecture scenarios. Using sensitivity analysis, this identifies potential addition or loss of economic value under alternative brand architecture options and enables informed decision making
Budget Determination & Resource Allocation: We help clients identify which products or services and brands create or destroy the most value. Clients can use this to allocate resources and budgets across their marketing activities to yield the best returnsDemand Forecasting: We provide clients with a market demand forecasting framework for long term strategic planning.
TransactionsOur transaction support services help companies evaluate and mitigate risks, extract maximum value in mergers and acquisitions as well as private equity investments. We also assist private equity companies, venture capitalists, brand owners and businesses identify and assess the value of opportunities through brand due diligence and brand strategy option, including licensing.
Transaction Support ServicesBrand and Market Due Diligence: We help clients by valuing branded businesses, brands and other intangible assets for purchase or sale providing reassurance to the investment and management teams. In addition, we assist in securing finance against brands by using a mixture of financial, legal, marketing and commercial due diligence
Brand Licensing and Franchising: We help maximise earnings and provide greater brand presence and knowledge by identifying the best opportunities for licensing and franchising, both internally and externally. We also provide advice on best practice in licensing agreements
Purchasing & Sales: We provide clients with an understanding of the financial potential of their intellectual property to help inform negotiation of rates and terms to strike the best deals. Our role also includes the identification of potential purchasers and execution of the sales process
About Brand Finance- a detailed overview (cont.)
39
Financing & Securitisation: We help clients communicate the financial potential of the brand to inform and assist potential investors. Our independent reports provide reassurance to leveraged finance / debt providers and have enabled clients to secure finance against their brand, intellectual property and intangible assets
Thought LeadershipEvery year Brand Finance produces Global Brand Studies, which reveal the most valuable brands across specific sectors and countries. Each report uses publicly available information to calculate the worth of the most valuable brands within a range of sectors and countries.
STUDIES INCLUDE:BrandFinance® Global 500 BrandFinance® Global Intangible TrackerCountry and sector specific studiesFor further detail on these studies, please visit www.brandfinance.com.
BRAND FINANCE INSTITUTEThe Brand Finance Institute, is the education and training division of Brand Finance plc. The Institute runs forums on subjects including brand valuation, analysis and strategy.
The Institute has expanded its global footprint, holding forums in Australia, Brazil, Canada, Croatia, Dubai, Malaysia, India, Singapore, the UK and USA.
For further details on forthcoming events, please visit www.brandfinance.com.
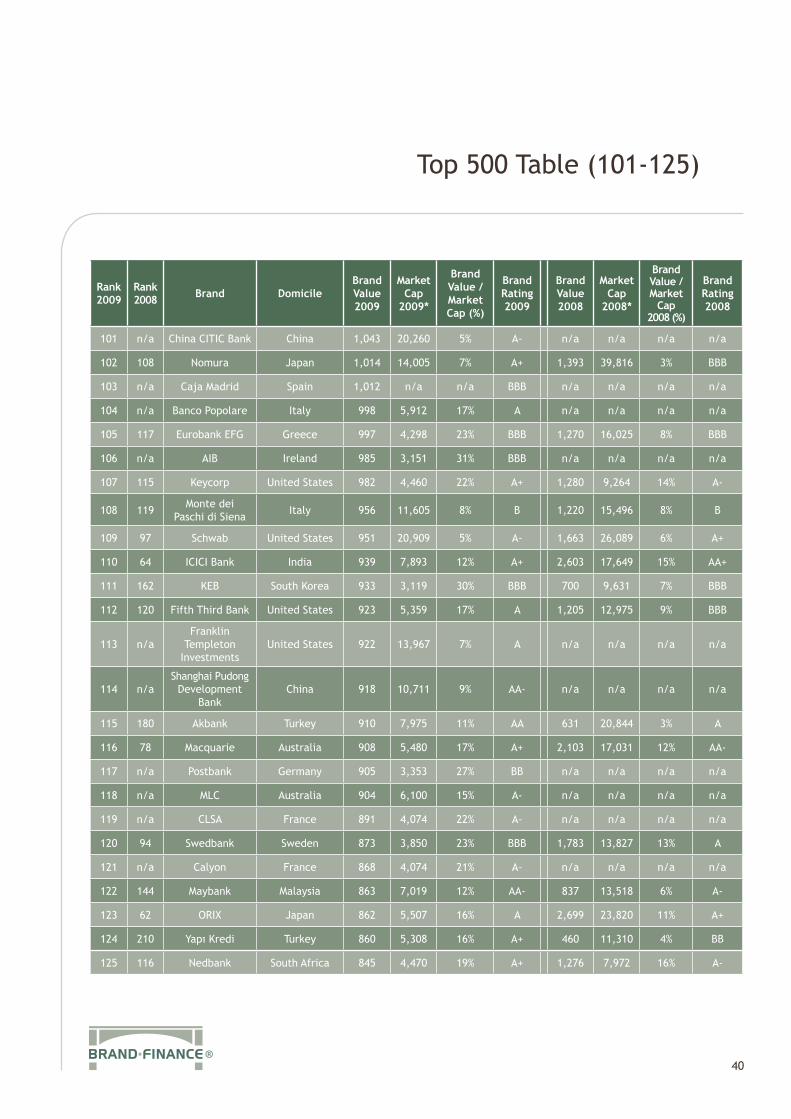
Top 500 Table (101-125)
40
Rank 2009
Rank 2008 Brand Domicile
Brand Value 2009
Market Cap
2009*
Brand Value / Market Cap (%)
Brand Rating 2009
Brand Value 2008
Market Cap
2008*
Brand Value / Market
Cap 2008 (%)
Brand Rating 2008
101 n/a China CITIC Bank China 1,043 20,260 5% A- n/a n/a n/a n/a
102 108 Nomura Japan 1,014 14,005 7% A+ 1,393 39,816 3% BBB
103 n/a Caja Madrid Spain 1,012 n/a n/a BBB n/a n/a n/a n/a
104 n/a Banco Popolare Italy 998 5,912 17% A n/a n/a n/a n/a
105 117 Eurobank EFG Greece 997 4,298 23% BBB 1,270 16,025 8% BBB
106 n/a AIB Ireland 985 3,151 31% BBB n/a n/a n/a n/a
107 115 Keycorp United States 982 4,460 22% A+ 1,280 9,264 14% A-
108 119 Monte dei Paschi di Siena Italy 956 11,605 8% B 1,220 15,496 8% B
109 97 Schwab United States 951 20,909 5% A- 1,663 26,089 6% A+
110 64 ICICI Bank India 939 7,893 12% A+ 2,603 17,649 15% AA+
111 162 KEB South Korea 933 3,119 30% BBB 700 9,631 7% BBB
112 120 Fifth Third Bank United States 923 5,359 17% A 1,205 12,975 9% BBB
113 n/aFranklin
Templeton Investments
United States 922 13,967 7% A n/a n/a n/a n/a
114 n/aShanghai Pudong
Development Bank
China 918 10,711 9% AA- n/a n/a n/a n/a
115 180 Akbank Turkey 910 7,975 11% AA 631 20,844 3% A
116 78 Macquarie Australia 908 5,480 17% A+ 2,103 17,031 12% AA-
117 n/a Postbank Germany 905 3,353 27% BB n/a n/a n/a n/a
118 n/a MLC Australia 904 6,100 15% A- n/a n/a n/a n/a
119 n/a CLSA France 891 4,074 22% A- n/a n/a n/a n/a
120 94 Swedbank Sweden 873 3,850 23% BBB 1,783 13,827 13% A
121 n/a Calyon France 868 4,074 21% A- n/a n/a n/a n/a
122 144 Maybank Malaysia 863 7,019 12% AA- 837 13,518 6% A-
123 62 ORIX Japan 862 5,507 16% A 2,699 23,820 11% A+
124 210 Yapı Kredi Turkey 860 5,308 16% A+ 460 11,310 4% BB
125 116 Nedbank South Africa 845 4,470 19% A+ 1,276 7,972 16% A-
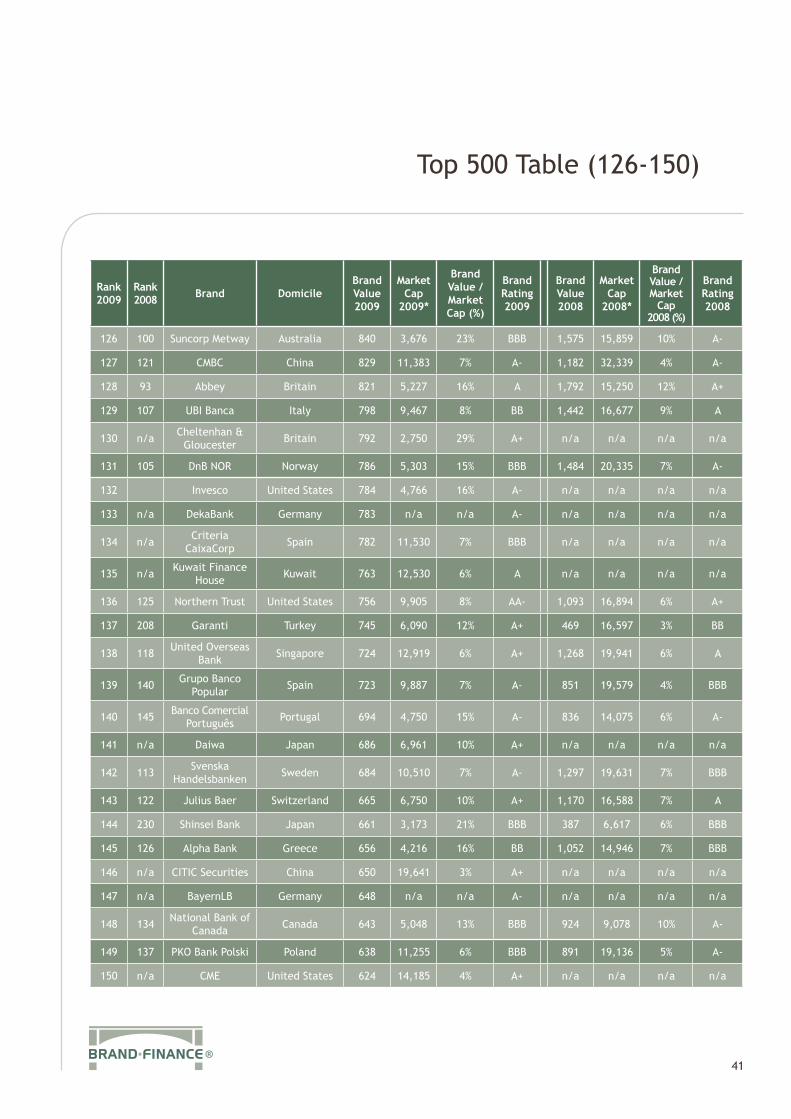
Top 500 Table (126-150)
41
Rank 2009
Rank 2008 Brand Domicile
Brand Value 2009
Market Cap
2009*
Brand Value / Market Cap (%)
Brand Rating 2009
Brand Value 2008
Market Cap
2008*
Brand Value / Market
Cap 2008 (%)
Brand Rating 2008
126 100 Suncorp Metway Australia 840 3,676 23% BBB 1,575 15,859 10% A-
127 121 CMBC China 829 11,383 7% A- 1,182 32,339 4% A-
128 93 Abbey Britain 821 5,227 16% A 1,792 15,250 12% A+
129 107 UBI Banca Italy 798 9,467 8% BB 1,442 16,677 9% A
130 n/a Cheltenhan & Gloucester Britain 792 2,750 29% A+ n/a n/a n/a n/a
131 105 DnB NOR Norway 786 5,303 15% BBB 1,484 20,335 7% A-
132 Invesco United States 784 4,766 16% A- n/a n/a n/a n/a
133 n/a DekaBank Germany 783 n/a n/a A- n/a n/a n/a n/a
134 n/a Criteria CaixaCorp Spain 782 11,530 7% BBB n/a n/a n/a n/a
135 n/a Kuwait Finance House Kuwait 763 12,530 6% A n/a n/a n/a n/a
136 125 Northern Trust United States 756 9,905 8% AA- 1,093 16,894 6% A+
137 208 Garanti Turkey 745 6,090 12% A+ 469 16,597 3% BB
138 118 United Overseas Bank Singapore 724 12,919 6% A+ 1,268 19,941 6% A
139 140 Grupo Banco Popular Spain 723 9,887 7% A- 851 19,579 4% BBB
140 145 Banco Comercial Português Portugal 694 4,750 15% A- 836 14,075 6% A-
141 n/a Daiwa Japan 686 6,961 10% A+ n/a n/a n/a n/a
142 113 Svenska Handelsbanken Sweden 684 10,510 7% A- 1,297 19,631 7% BBB
143 122 Julius Baer Switzerland 665 6,750 10% A+ 1,170 16,588 7% A
144 230 Shinsei Bank Japan 661 3,173 21% BBB 387 6,617 6% BBB
145 126 Alpha Bank Greece 656 4,216 16% BB 1,052 14,946 7% BBB
146 n/a CITIC Securities China 650 19,641 3% A+ n/a n/a n/a n/a
147 n/a BayernLB Germany 648 n/a n/a A- n/a n/a n/a n/a
148 134 National Bank of Canada Canada 643 5,048 13% BBB 924 9,078 10% A-
149 137 PKO Bank Polski Poland 638 11,255 6% BBB 891 19,136 5% A-
150 n/a CME United States 624 14,185 4% A+ n/a n/a n/a n/a
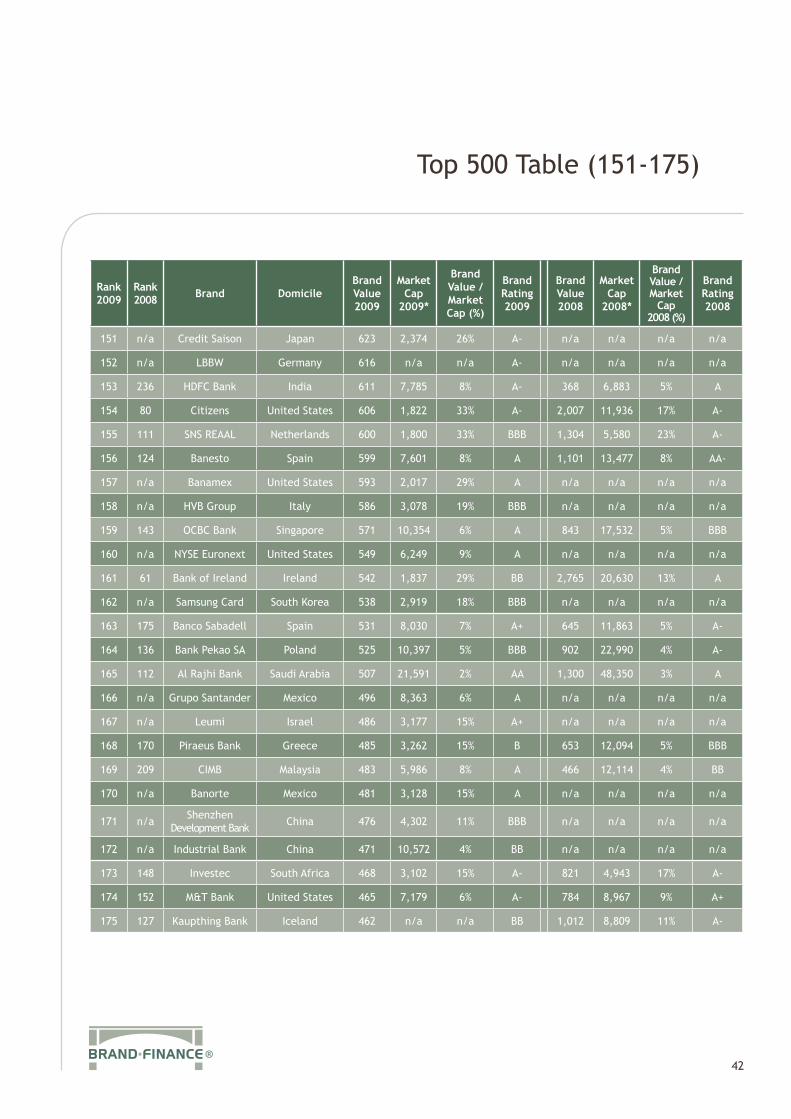
Top 500 Table (151-175)
42
Rank 2009
Rank 2008 Brand Domicile
Brand Value 2009
Market Cap
2009*
Brand Value / Market Cap (%)
Brand Rating 2009
Brand Value 2008
Market Cap
2008*
Brand Value / Market
Cap 2008 (%)
Brand Rating 2008
151 n/a Credit Saison Japan 623 2,374 26% A- n/a n/a n/a n/a
152 n/a LBBW Germany 616 n/a n/a A- n/a n/a n/a n/a
153 236 HDFC Bank India 611 7,785 8% A- 368 6,883 5% A
154 80 Citizens United States 606 1,822 33% A- 2,007 11,936 17% A-
155 111 SNS REAAL Netherlands 600 1,800 33% BBB 1,304 5,580 23% A-
156 124 Banesto Spain 599 7,601 8% A 1,101 13,477 8% AA-
157 n/a Banamex United States 593 2,017 29% A n/a n/a n/a n/a
158 n/a HVB Group Italy 586 3,078 19% BBB n/a n/a n/a n/a
159 143 OCBC Bank Singapore 571 10,354 6% A 843 17,532 5% BBB
160 n/a NYSE Euronext United States 549 6,249 9% A n/a n/a n/a n/a
161 61 Bank of Ireland Ireland 542 1,837 29% BB 2,765 20,630 13% A
162 n/a Samsung Card South Korea 538 2,919 18% BBB n/a n/a n/a n/a
163 175 Banco Sabadell Spain 531 8,030 7% A+ 645 11,863 5% A-
164 136 Bank Pekao SA Poland 525 10,397 5% BBB 902 22,990 4% A-
165 112 Al Rajhi Bank Saudi Arabia 507 21,591 2% AA 1,300 48,350 3% A
166 n/a Grupo Santander Mexico 496 8,363 6% A n/a n/a n/a n/a
167 n/a Leumi Israel 486 3,177 15% A+ n/a n/a n/a n/a
168 170 Piraeus Bank Greece 485 3,262 15% B 653 12,094 5% BBB
169 209 CIMB Malaysia 483 5,986 8% A 466 12,114 4% BB
170 n/a Banorte Mexico 481 3,128 15% A n/a n/a n/a n/a
171 n/a Shenzhen Development Bank China 476 4,302 11% BBB n/a n/a n/a n/a
172 n/a Industrial Bank China 471 10,572 4% BB n/a n/a n/a n/a
173 148 Investec South Africa 468 3,102 15% A- 821 4,943 17% A-
174 152 M&T Bank United States 465 7,179 6% A- 784 8,967 9% A+
175 127 Kaupthing Bank Iceland 462 n/a n/a BB 1,012 8,809 11% A-

Top 500 Table (176-200)
43
Rank 2009
Rank 2008 Brand Domicile
Brand Value 2009
Market Cap
2009*
Brand Value / Market Cap (%)
Brand Rating 2009
Brand Value 2008
Market Cap
2008*
Brand Value / Market
Cap 2008 (%)
Brand Rating 2008
176 172 Sumitomo Trust Japan 459 7,318 6% A- 647 17,503 4% B
177 n/a Wüstenrot & Württembergische Germany 458 1,507 30% BB n/a n/a n/a n/a
178 67 OTP Bank Hungary 441 3,843 11% BBB 2,496 13,543 18% A-
179 138 Bank Hapoalim Israel 440 2,567 17% BBB 873 6,066 14% BBB
180 35 Fortis Belgium 439 1,409 31% BBB 4,400 56,242 8% A-
181 197 Mediobanca Italy 428 8,577 5% A- 506 18,658 3% BBB
182 218 Industrial Bank of Korea South Korea 428 1,858 23% B 422 7,520 6% B
183 154 Bank of Cyprus Cyprus 426 2,261 19% BBB 782 9,897 8% A
184 n/a Banco Popolare Emilia Romagna Italy 419 3,221 13% BB n/a n/a n/a n/a
185 n/a Caixa Catalunya Spain 419 n/a n/a B n/a n/a n/a n/a
186 n/a Legg Mason United States 412 2,484 17% BBB n/a n/a n/a n/a
187 141 Alliance & Leicester Britain 408 n/a n/a A 846 6,158 14% A
188 176 Comerica United States 403 3,202 13% A 641 6,529 10% A-
189 n/a Public Bank Malaysia 398 8,253 5% A- n/a n/a n/a n/a
190 n/a Och-Ziff United States 392 1,781 22% BBB n/a n/a n/a n/a
191 251 Marfin Popular Bank Cyprus 387 2,183 18% BBB 320 9,114 4% BBB
192 n/a Punjab National Bank India 384 2,853 13% A- n/a n/a n/a n/a
193 n/a Huntington Bancshares United States 379 2,841 13% BBB n/a n/a n/a n/a
194 178 Promise Japan 376 2,798 13% BB 638 4,789 13% BBB
195 n/a Mashreq Uae 376 n/a n/a A- n/a n/a n/a n/a
196 n/a Bank of Beijing China 375 7,669 5% A- n/a n/a n/a n/a
197 214 Raymond James United States 374 2,041 18% BB 429 3,948 11% BBB
198 n/a National Bank of New Zealand Australia 374 3,592 10% A n/a n/a n/a n/a
199 156 National Bank of Abu Dhabi Uae 364 5,650 6% A 775 10,619 7% A
200 n/a NORD/LB Germany 360 n/a n/a A- n/a n/a n/a n/a

Top 500 Table (201-225)
44
Rank 2009
Rank 2008 Brand Domicile
Brand Value 2009
Market Cap
2009*
Brand Value / Market Cap (%)
Brand Rating 2009
Brand Value 2008
Market Cap
2008*
Brand Value / Market
Cap 2008 (%)
Brand Rating 2008
201 n/a Chuo Mitsui Japan 360 4,075 9% A- n/a n/a n/a n/a
202 n/a Hua Xia Bank China 357 5,641 6% BBB n/a n/a n/a n/a
203 142 Sovereign Bank United States 357 1,587 23% BBB 844 5,488 15% BBB
204 157 NBK Kuwait 344 15,267 2% A+ 762 19,984 4% A
205 166 Acom Japan 337 6,305 5% A- 675 6,698 10% BBB
206 167 Commerce Bank United States 334 n/a n/a A- 669 7,234 9% BBB
207 n/a Helaba Germany 334 n/a n/a BBB n/a n/a n/a n/a
208 207 AEON Credit Service Japan 330 1,832 18% BBB 471 2,982 16% BBB
209 219 BEA Hong Kong 327 3,476 9% A- 421 9,992 4% A-
210 273 Banca Carige Italy 327 4,297 8% B 277 6,845 4% A-
211 n/a Zions Bancorporation United States 325 3,592 9% A- n/a n/a n/a n/a
212 n/a NASDAQ OMX United States 324 4,316 8% A n/a n/a n/a n/a
213 191 Banca Popolare di Milano Italy 321 2,156 15% B 552 5,496 10% BBB
214 225 Chiba Bank Japan 314 4,194 7% BBB 396 7,907 5% A
215 220 Komer_ní banka Czech 310 5,078 6% AA- 418 8,982 5% A
216 n/a Colonial First State Australia 307 4,525 7% A- n/a n/a n/a n/a
217 252 Bank Moskvy Russia 306 n/a n/a BBB 319 6,838 5% A-
218 174 TD AMERITRADE United States 301 7,756 4% A- 646 10,835 6% A
219 200 Emporiki Bank Greece 296 1,194 25% BBB 497 3,924 13% A-
220 179 Anglo Irish Bank Ireland 295 911 32% BBB 635 14,254 4% A-
221 237 VakifBank Turkey 294 1,908 15% BBB 366 8,034 5% BB
222 192 Samba Saudi Arabia 289 11,563 2% A- 547 28,304 2% BBB
223 n/a BES Portugal 288 3,767 8% B n/a n/a n/a n/a
224 198 Riyad Bank Saudi Arabia 286 8,317 3% A 505 16,036 3% A-
225 193 Bank of Yokohama Japan 281 6,694 4% BBB 537 10,408 5% A

Top 500 Table (226-250)
45
Rank 2009
Rank 2008 Brand Domicile
Brand Value 2009
Market Cap
2009*
Brand Value / Market Cap (%)
Brand Rating 2009
Brand Value 2008
Market Cap
2008*
Brand Value / Market
Cap 2008 (%)
Brand Rating 2008
226 n/a Halkbank Turkey 278 3,227 9% BBB n/a n/a n/a n/a
227 227 Shizuoka Bank Japan 275 6,912 4% BBB 391 7,560 5% A
228 n/a Bank of India India 273 2,567 11% BBB n/a n/a n/a n/a
229 n/a Global Payments United States 269 2,828 10% BB n/a n/a n/a n/a
230 196 ATEbank Greece 268 1,774 15% BB 516 5,233 10% A-
231 336 Samsung Securities South Korea 267 2,847 9% BB 175 3,557 5% A-
232 223 Nossa Caixa Brazil 265 2,995 9% A- 404 1,575 26% A-
233 130 Sallie Mae United States 263 4,411 6% A- 954 10,304 9% AA-
234 289 Daewoo Securities South Korea 262 1,262 21% BBB 248 3,405 7% A-
235 213 Bank of Greece Greece 261 1,037 25% AA- 433 2,121 20% AAA-
236 n/a Promina Australia 260 1,161 22% BBB n/a n/a n/a n/a
237 n/a FFG Japan 258 2,648 10% BB n/a n/a n/a n/a
238 150 Eurohypo Germany 258 958 27% A- 793 14,118 6% A-
239 169 Banco Popular Puerto Rico 257 1,735 15% AA- 659 2,666 25% BBB
240 182 Dubai Islamic Bank Uae 256 2,317 11% A- 612 9,262 7% A
241 n/a iberCaja Spain 255 n/a n/a BBB n/a n/a n/a n/a
242 n/a Israel Discount Bank Israel 254 835 30% BBB n/a n/a n/a n/a
243 177 SABB Saudi Arabia 252 7,837 3% A 640 16,036 4% A-
244 228 Kasikorn Thailand 252 2,837 9% A- 390 6,427 6% BBB
245 n/a M&I United States 250 3,727 7% BB n/a n/a n/a n/a
246 195 Bangkok Bank Thailand 249 3,556 7% A- 516 7,302 7% BBB
247 186 Hokuhoku Financial Group Japan 247 2,799 9% BB 586 4,801 12% A-
248 222 Banca CR Firenze Italy 245 n/a n/a BBB 406 8,118 5% A-
249 n/a Deutsche Börse Germany 244 14,043 2% A- n/a n/a n/a n/a
250 304 Hudson City Savings Bank United States 243 8,543 3% A 225 7,254 3% BB
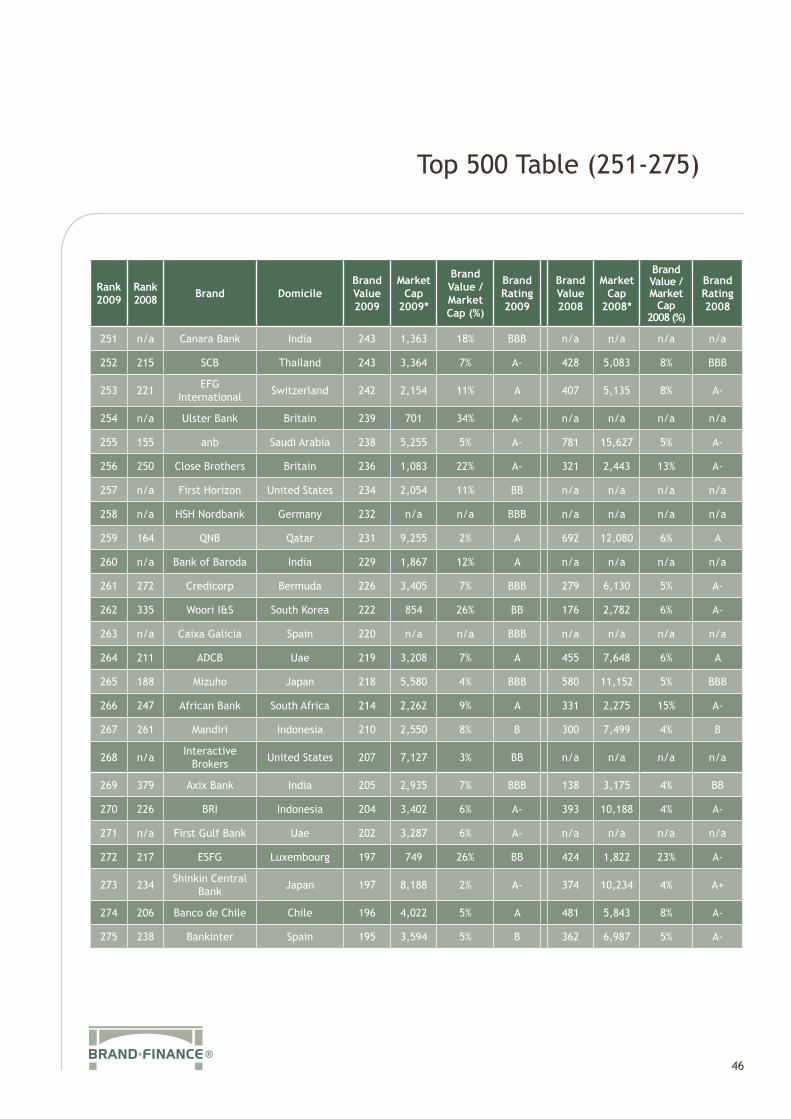
Top 500 Table (251-275)
46
Rank 2009
Rank 2008 Brand Domicile
Brand Value 2009
Market Cap
2009*
Brand Value / Market Cap (%)
Brand Rating 2009
Brand Value 2008
Market Cap
2008*
Brand Value / Market
Cap 2008 (%)
Brand Rating 2008
251 n/a Canara Bank India 243 1,363 18% BBB n/a n/a n/a n/a
252 215 SCB Thailand 243 3,364 7% A- 428 5,083 8% BBB
253 221 EFG International Switzerland 242 2,154 11% A 407 5,135 8% A-
254 n/a Ulster Bank Britain 239 701 34% A- n/a n/a n/a n/a
255 155 anb Saudi Arabia 238 5,255 5% A- 781 15,627 5% A-
256 250 Close Brothers Britain 236 1,083 22% A- 321 2,443 13% A-
257 n/a First Horizon United States 234 2,054 11% BB n/a n/a n/a n/a
258 n/a HSH Nordbank Germany 232 n/a n/a BBB n/a n/a n/a n/a
259 164 QNB Qatar 231 9,255 2% A 692 12,080 6% A
260 n/a Bank of Baroda India 229 1,867 12% A n/a n/a n/a n/a
261 272 Credicorp Bermuda 226 3,405 7% BBB 279 6,130 5% A-
262 335 Woori I&S South Korea 222 854 26% BB 176 2,782 6% A-
263 n/a Caixa Galicia Spain 220 n/a n/a BBB n/a n/a n/a n/a
264 211 ADCB Uae 219 3,208 7% A 455 7,648 6% A
265 188 Mizuho Japan 218 5,580 4% BBB 580 11,152 5% BBB
266 247 African Bank South Africa 214 2,262 9% A 331 2,275 15% A-
267 261 Mandiri Indonesia 210 2,550 8% B 300 7,499 4% B
268 n/a Interactive Brokers United States 207 7,127 3% BB n/a n/a n/a n/a
269 379 Axix Bank India 205 2,935 7% BBB 138 3,175 4% BB
270 226 BRI Indonesia 204 3,402 6% A- 393 10,188 4% A-
271 n/a First Gulf Bank Uae 202 3,287 6% A- n/a n/a n/a n/a
272 217 ESFG Luxembourg 197 749 26% BB 424 1,822 23% A-
273 234 Shinkin Central Bank Japan 197 8,188 2% A- 374 10,234 4% A+
274 206 Banco de Chile Chile 196 4,022 5% A 481 5,843 8% A-
275 238 Bankinter Spain 195 3,594 5% B 362 6,987 5% A-

Top 500 Table (276-300)
47
Rank 2009
Rank 2008 Brand Domicile
Brand Value 2009
Market Cap
2009*
Brand Value / Market Cap (%)
Brand Rating 2009
Brand Value 2008
Market Cap
2008*
Brand Value / Market
Cap 2008 (%)
Brand Rating 2008
276 n/a HKEx Hong Kong 193 8,307 2% A- n/a n/a n/a n/a
277 n/a Ecobank Togo 191 2,289 8% A- n/a n/a n/a n/a
278 n/a Schroders Britain 190 3,362 6% A n/a n/a n/a n/a
279 n/a Banca Popolare di Vicenza Italy 189 n/a n/a B n/a n/a n/a n/a
280 318 kotak India 188 2,388 8% A- 199 3,599 6% A-
281 242 Bank Zachodni WBK Poland 188 2,440 8% A- 351 6,161 6% A-
282 327 Shinko Securities Japan 188 1,606 12% BBB 188 3,924 5% BBB
283 263 Credem Italy 187 1,735 11% B 299 3,582 8% A-
284 184 Banque Saudi Fransi Saudi Arabia 187 6,927 3% A- 608 17,139 4% A-
285 265 TCF United States 186 2,124 9% A- 295 2,056 14% A-
286 245 Glitnir Iceland 186 n/a n/a CC 341 4,791 7% BBB
287 n/a Bank of Ayudhya Thailand 185 1,577 12% BBB n/a n/a n/a n/a
288 286 Vontobel Switzerland 184 1,349 14% A+ 249 2,764 9% A-
289 296 Credito Valtellinese Italy 182 1,449 13% BBB 241 2,074 12% A-
290 254 Banco Pastor Spain 182 1,821 10% B 316 3,762 8% A-
291 n/a Clydesdale Bank Britain 182 939 19% A- n/a n/a n/a n/a
292 n/a Federated United States 180 1,935 9% BB n/a n/a n/a n/a
293 384 Hyundai Securities South Korea 179 851 21% BB 133 1,838 7% A-
294 n/a ASB Bank Australia 177 2,112 8% BBB n/a n/a n/a n/a
295 343 Mirae Asset Securities South Korea 177 2,311 8% BBB 167 7,234 2% A-
296 n/a Yorkshire Bank Britain 176 939 19% A- n/a n/a n/a n/a
297 253 BCV Switzerland 176 2,435 7% A- 316 3,590 9% A+
298 233 Bancolombia Colombia 175 3,977 4% BB 375 6,553 6% A-
299 259 Associated Bank United States 174 2,685 6% BBB 302 3,059 10% BBB
300 243 Basler Kantonalbank Switzerland 174 2,858 6% AA 343 3,122 11% AA

Top 500 Table (301-325)
48
Rank 2009
Rank 2008 Brand Domicile
Brand Value 2009
Market Cap
2009*
Brand Value / Market Cap (%)
Brand Rating 2009
Brand Value 2008
Market Cap
2008*
Brand Value / Market
Cap 2008 (%)
Brand Rating 2008
301 n/a ICAP Britain 173 2,811 6% BB n/a n/a n/a n/a
302 n/a NYCB United States 173 4,433 4% A- n/a n/a n/a n/a
303 n/a AWD Germany 172 1,369 13% BB n/a n/a n/a n/a
304 301 Citi Handlowy Poland 172 2,050 8% BBB 234 4,383 5% A-
305 241 BPI Portugal 170 1,711 10% B 356 5,012 7% A-
306 n/a Bendigo and Adelaide Bank Australia 170 1,996 8% A- n/a n/a n/a n/a
307 n/a Banco Estado Brazil 169 1,214 14% BBB n/a n/a n/a n/a
308 n/a Ca Ile de France France 169 1,740 10% A- n/a n/a n/a n/a
309 n/a Sarasin Switzerland 168 1,213 14% A- n/a n/a n/a n/a
310 n/a WGZ Bank Germany 168 n/a n/a A- n/a n/a n/a n/a
311 239 Krung Thai Bank Thailand 167 1,016 16% BBB 361 3,501 10% BB
312 271 Finansbank Turkey 166 4,598 4% A 282 6,384 4% A-
313 287 Daegu Bank South Korea 165 626 26% BBB 249 2,022 12% A-
314 281 Commerce Bank United States 164 3,227 5% A 259 3,221 8% A
315 n/a BOK Financial United States 164 3,083 5% BBB n/a n/a n/a n/a
316 309 People's United Bank United States 163 6,552 2% A 214 5,360 4% A-
317 n/a First Bank of Nigeria Nigeria 162 4,932 3% BBB n/a n/a n/a n/a
318 n/a Mercantil Venezuela 161 930 17% A- n/a n/a n/a n/a
319 303 Frost Bank United States 160 3,202 5% A 229 2,761 8% A-
320 298 Gunma Bank Japan 159 2,919 5% BB 238 3,537 7% A-
321 n/aDeutsche
Apotheker- und Ärztebank
Germany 158 n/a n/a BB n/a n/a n/a n/a
322 274 BRE Bank Poland 158 2,215 7% B 275 5,151 5% A-
323 n/a Irish Life & Permanent Ireland 157 571 28% A n/a n/a n/a n/a
324 n/a Bci Chile 157 1,703 9% A n/a n/a n/a n/a
325 n/a TEB Turkey 155 539 29% A n/a n/a n/a n/a

Top 500 Table (326-350)
49
Rank 2009
Rank 2008 Brand Domicile
Brand Value 2009
Market Cap
2009*
Brand Value / Market Cap (%)
Brand Rating 2009
Brand Value 2008
Market Cap
2008*
Brand Value / Market
Cap 2008 (%)
Brand Rating 2008
326 291 Pusan Bank South Korea 155 601 26% BB 248 2,183 11% A-
327 199 LLB Germany 155 3,272 5% A 504 8,797 6% A-
328 314 First Citizens Bank United States 153 1,489 10% A 203 1,528 13% A-
329 n/a Suruga Bank Japan 152 2,592 6% BBB n/a n/a n/a n/a
330 240 Gulf Bank Kuwait 149 n/a n/a BBB 357 7,668 5% BBB
331 n/a Bank West United States 149 542 27% BBB n/a n/a n/a n/a
332 n/a Janus United States 149 1,261 12% A- n/a n/a n/a n/a
333 n/a Eaton Vance United States 149 2,039 7% BBB n/a n/a n/a n/a
334 405 Daishin Securities South Korea 148 581 25% BB 112 1,170 10% A-
335 n/a Mizrahi Tefahot Israel 147 1,099 13% A n/a n/a n/a n/a
336 n/a Intercontinental Bank Nigeria 146 1,965 7% BBB n/a n/a n/a n/a
337 n/a Arab Bank Jordan 145 9,918 1% A- n/a n/a n/a n/a
338 n/a Waddell & Reed United States 144 1,116 13% A- n/a n/a n/a n/a
339 n/a MARFIN EGNATIA BANK Greece 144 793 18% BB n/a n/a n/a n/a
340 n/a Pohjola Bank Finland 143 2,639 5% BBB n/a n/a n/a n/a
341 248 Jyske Bank Denmark 142 1,221 12% BBB 326 4,040 8% A
342 264 BCA Indonesia 141 5,524 3% A- 296 9,472 3% A-
343 n/a FIBA Israel 141 511 28% BBB n/a n/a n/a n/a
344 255 AmBank Malaysia 140 1,559 9% B 314 2,317 14% A-
345 173 Synovus United States 140 2,573 5% A 647 3,870 17% A-
346 83 Freddie Mac United States 139 2,544 5% BB 1,975 19,033 10% A
347 n/a Inbursa Mexico 138 8,304 2% A n/a n/a n/a n/a
348 324 BankMuscat Oman 138 2,398 6% BBB 193 5,057 4% BBB
349 n/a Union National Bank Uae 138 1,639 8% A n/a n/a n/a n/a
350 n/a WestLB Germany 137 n/a n/a A n/a n/a n/a n/a

Top 500 Table (351-375)
50
Rank 2009
Rank 2008 Brand Domicile
Brand Value 2009
Market Cap
2009*
Brand Value / Market Cap (%)
Brand Rating 2009
Brand Value 2008
Market Cap
2008*
Brand Value / Market
Cap 2008 (%)
Brand Rating 2008
351 n/a Union Bank of India India 137 1,466 9% BB n/a n/a n/a n/a
352 269 Jefferies United States 135 2,209 6% A- 287 2,303 12% BBB
353 267 Ahli United Bank Bahrain 135 3,878 3% BBB 292 6,239 5% A-
354 348 RHB Malaysia 135 2,263 6% B 162 4,031 4% A-
355 306 Wilmington Trust United States 133 1,618 8% A 220 2,392 9% A-
356 216 Takefuji Japan 133 966 14% BBB 426 5,660 8% BB
357 n/a ING Bank Poland 133 1,875 7% BB n/a n/a n/a n/a
358 249 AmeriCredit United States 133 802 17% BB 323 3,150 10% BB
359 n/a HBL Pakistan 133 1,333 10% BBB n/a n/a n/a n/a
360 282 Sydbank Denmark 132 744 18% BBB 256 2,754 9% A-
361 n/a Seven Bank Japan 131 4,256 3% A- n/a n/a n/a n/a
362 n/a ICG Britain 131 1,002 13% BBB n/a n/a n/a n/a
363 n/a GFI United States 130 421 31% BBB n/a n/a n/a n/a
364 322 GETIN Poland 130 1,232 11% BB 197 4,000 5% A-
365 260 Joyo Bank Japan 129 3,997 3% BBB 300 5,004 6% A-
366 n/a UBL Pakistan 129 876 15% BBB n/a n/a n/a n/a
367 n/a YMFG Japan 129 2,437 5% BB n/a n/a n/a n/a
368 305 Bank of Kyoto Japan 128 3,552 4% BBB 222 4,066 5% A-
369 n/a State Bank of Hyderabad India 128 1,083 12% A n/a n/a n/a n/a
370 383 Juroku Bank Japan 128 1,430 9% BB 135 2,074 6% BBB
371 n/a Indian Overseas Bank India 127 705 18% B n/a n/a n/a n/a
372 244 Cattles Britain 127 397 32% B 342 1,781 19% A-
373 n/a Raiffeisen Bank Aval Ukraine 126 891 14% BBB n/a n/a n/a n/a
374 347 Nishi-Nippon City Bank Japan 125 1,711 7% BB 164 3,539 5% A-
375 231 Orient Corp Japan 125 532 24% BBB 386 1,478 26% BB

Top 500 Table (376-400)
51
Rank 2009
Rank 2008 Brand Domicile
Brand Value 2009
Market Cap
2009*
Brand Value / Market Cap (%)
Brand Rating 2009
Brand Value 2008
Market Cap
2008*
Brand Value / Market
Cap 2008 (%)
Brand Rating 2008
376 n/a Stifel Financial Corp United States 125 1,100 11% BB n/a n/a n/a n/a
377 285 City National Bank United States 123 2,018 6% A- 253 2,758 9% A-
378 266 Commercial Bank of Kuwait Kuwait 123 5,877 2% A 294 7,189 4% BBB
379 n/a Sun Hung Kai Financial Hong Kong 122 547 22% BBB n/a n/a n/a n/a
380 308 Banca Popolare di Sondrio Italy 121 2,661 5% BBB 216 4,566 5% A-
381 n/a Alliance Bank Kazakhstan 121 601 20% BBB n/a n/a n/a n/a
382 262 Zagrebacka banka Croatia 121 2,094 6% BB 299 8,240 4% BBB
383 363 Bank Danamon Indonesia 121 1,089 11% BB 146 4,080 4% B
384 350 Bank of Hawaii United States 120 2,122 6% A+ 159 2,237 7% A-
385 330 BancorpSouth United States 119 1,828 7% A- 182 1,762 10% BBB
386 n/a National Bank of Pakistan Pakistan 118 1,058 11% BBB n/a n/a n/a n/a
387 297 Bradford & Bingley Britain 118 n/a n/a BB 239 3,102 8% BBB
388 317 Banco de Valencia Spain 118 4,690 3% A- 199 5,950 3% A-
389 n/aBanque Privée
Edmond de Rothschild S.A.
Switzerland 118 2,246 5% BBB n/a n/a n/a n/a
390 n/a Hong Leong Bank Malaysia 117 2,185 5% BBB n/a n/a n/a n/a
391 n/a Momentum South Africa 117 1,510 8% A- n/a n/a n/a n/a
392 398 Laurentian Bank Canada 115 662 17% A- 120 1,095 11% BB
393 n/a Bank Of Ningbo China 115 2,581 4% A- n/a n/a n/a n/a
394 n/a Union Bank of Nigeria Nigeria 114 2,070 6% BB n/a n/a n/a n/a
395 n/a Astoria Financial Corp United States 114 1,691 7% BBB n/a n/a n/a n/a
396 n/a Van Lanschot Netherlands 114 1,986 6% BB n/a n/a n/a n/a
397 n/a Zenith Bank Nigeria 114 3,224 4% BBB n/a n/a n/a n/a
398 313 Bank Millennium Poland 113 1,070 11% BB 206 3,059 7% A-
399 229 Provident Financial Britain 113 1,677 7% BBB 388 1,963 20% A-
400 n/a Halyk Savings Bank Kazakhstan Kazakhstan 113 998 11% B n/a n/a n/a n/a

Top 500 Table (401-425)
52
Rank 2009
Rank 2008 Brand Domicile
Brand Value 2009
Market Cap
2009*
Brand Value / Market Cap (%)
Brand Rating 2009
Brand Value 2008
Market Cap
2008*
Brand Value / Market
Cap 2008 (%)
Brand Rating 2008
401 319 Sapporo Hokuyo Holdings Japan 112 1,502 7% BBB 198 4,004 5% A-
402 n/a GLG United States 110 609 18% B n/a n/a n/a n/a
403 268 Commercialbank Qatar 110 3,313 3% A- 290 7,767 4% A-
404 n/a National Bank of Belgium Belgium 110 1,010 11% BB n/a n/a n/a n/a
405 307 The 77 Bank Japan 109 1,795 6% BB 219 2,482 9% A-
406 n/a Banesco Banco Universal Venezuela 109 359 30% BBB n/a n/a n/a n/a
407 n/a AMG United States 108 1,149 9% BBB n/a n/a n/a n/a
408 n/a ICBC Asia Hong Kong 107 1,162 9% BB n/a n/a n/a n/a
409 366 TT Hellenic Postbank Greece 107 968 11% A- 145 2,401 6% A-
410 315 St Galler Kantonalbank Reg. Switzerland 106 1,832 6% A 203 2,463 8% A-
411 388 Chang Hwa Com-mercial Bank Taiwan 105 1,736 6% BBB 131 2,629 5% A-
412 406 Ogaki Kyoritsu Bank Japan 105 1,273 8% BB 111 1,320 8% A-
413 n/a Compagnie Financière Tradition Switzerland 104 314 33% BB n/a n/a n/a n/a
414 n/a Banco de Venezuela Venezuela 103 849 12% BBB n/a n/a n/a n/a
415 n/a BNZ Australia 103 704 15% A- n/a n/a n/a n/a
416 n/a Wing Hang Bank Hong Kong 103 1,300 8% BBB n/a n/a n/a n/a
417 n/a MLP Germany 103 1,343 8% BBB n/a n/a n/a n/a
418 395 IDBI Bank Limited India 103 880 12% A- 123 1,292 10% BBB
419 n/a Commercial Bank of Dubai Uae 103 1,864 6% A n/a n/a n/a n/a
420 168 AIFUL Corp Japan 103 423 24% B 666 4,396 15% BBB
421 337 DenizBank Turkey 102 2,113 5% A 175 3,514 5% A-
422 356 Gulf Finance House Bahrain 102 757 13% A- 152 2,592 6% BBB
423 371 MCB Bank Pakistan 102 1,878 5% BBB 142 3,800 4% A-
424 295 The Chugoku Bank Japan 101 3,194 3% BBB 241 3,063 8% A
425 n/a DundeeWealth Canada 101 512 20% A- n/a n/a n/a n/a
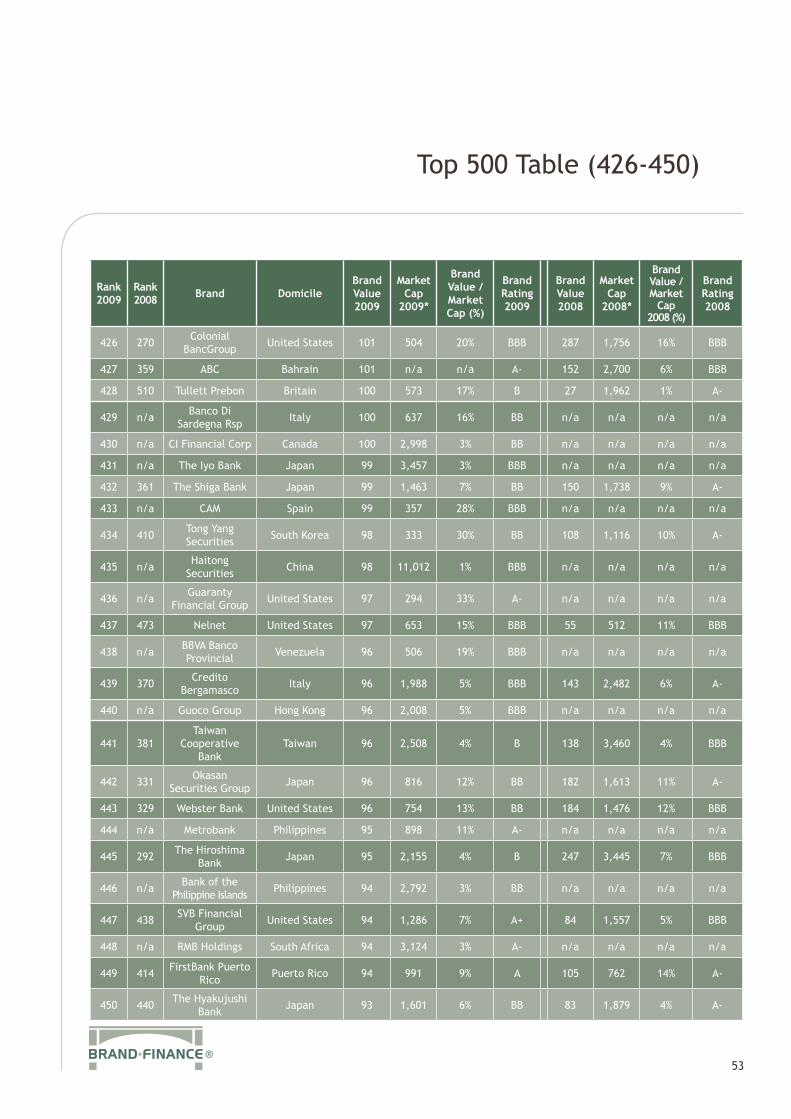
Top 500 Table (426-450)
53
Rank 2009
Rank 2008 Brand Domicile
Brand Value 2009
Market Cap
2009*
Brand Value / Market Cap (%)
Brand Rating 2009
Brand Value 2008
Market Cap
2008*
Brand Value / Market
Cap 2008 (%)
Brand Rating 2008
426 270 Colonial BancGroup United States 101 504 20% BBB 287 1,756 16% BBB
427 359 ABC Bahrain 101 n/a n/a A- 152 2,700 6% BBB
428 510 Tullett Prebon Britain 100 573 17% B 27 1,962 1% A-
429 n/a Banco Di Sardegna Rsp Italy 100 637 16% BB n/a n/a n/a n/a
430 n/a CI Financial Corp Canada 100 2,998 3% BB n/a n/a n/a n/a
431 n/a The Iyo Bank Japan 99 3,457 3% BBB n/a n/a n/a n/a
432 361 The Shiga Bank Japan 99 1,463 7% BB 150 1,738 9% A-
433 n/a CAM Spain 99 357 28% BBB n/a n/a n/a n/a
434 410 Tong Yang Securities South Korea 98 333 30% BB 108 1,116 10% A-
435 n/a Haitong Securities China 98 11,012 1% BBB n/a n/a n/a n/a
436 n/a Guaranty Financial Group United States 97 294 33% A- n/a n/a n/a n/a
437 473 Nelnet United States 97 653 15% BBB 55 512 11% BBB
438 n/a BBVA Banco Provincial Venezuela 96 506 19% BBB n/a n/a n/a n/a
439 370 Credito Bergamasco Italy 96 1,988 5% BBB 143 2,482 6% A-
440 n/a Guoco Group Hong Kong 96 2,008 5% BBB n/a n/a n/a n/a
441 381Taiwan
Cooperative Bank
Taiwan 96 2,508 4% B 138 3,460 4% BBB
442 331 Okasan Securities Group Japan 96 816 12% BB 182 1,613 11% A-
443 329 Webster Bank United States 96 754 13% BB 184 1,476 12% BBB
444 n/a Metrobank Philippines 95 898 11% A- n/a n/a n/a n/a
445 292 The Hiroshima Bank Japan 95 2,155 4% B 247 3,445 7% BBB
446 n/a Bank of the Philippine Islands Philippines 94 2,792 3% BB n/a n/a n/a n/a
447 438 SVB Financial Group United States 94 1,286 7% A+ 84 1,557 5% BBB
448 n/a RMB Holdings South Africa 94 3,124 3% A- n/a n/a n/a n/a
449 414 FirstBank Puerto Rico Puerto Rico 94 991 9% A 105 762 14% A-
450 440 The Hyakujushi Bank Japan 93 1,601 6% BB 83 1,879 4% A-
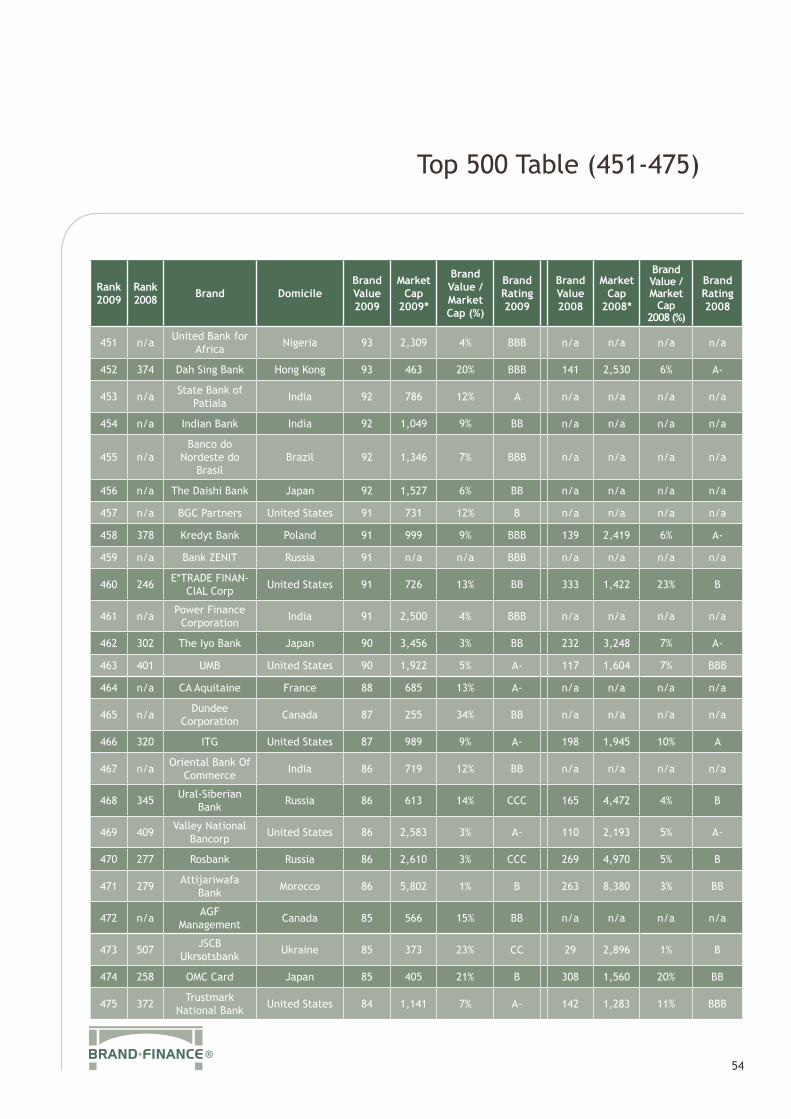
Top 500 Table (451-475)
54
Rank 2009
Rank 2008 Brand Domicile
Brand Value 2009
Market Cap
2009*
Brand Value / Market Cap (%)
Brand Rating 2009
Brand Value 2008
Market Cap
2008*
Brand Value / Market
Cap 2008 (%)
Brand Rating 2008
451 n/a United Bank for Africa Nigeria 93 2,309 4% BBB n/a n/a n/a n/a
452 374 Dah Sing Bank Hong Kong 93 463 20% BBB 141 2,530 6% A-
453 n/a State Bank of Patiala India 92 786 12% A n/a n/a n/a n/a
454 n/a Indian Bank India 92 1,049 9% BB n/a n/a n/a n/a
455 n/aBanco do
Nordeste do Brasil
Brazil 92 1,346 7% BBB n/a n/a n/a n/a
456 n/a The Daishi Bank Japan 92 1,527 6% BB n/a n/a n/a n/a
457 n/a BGC Partners United States 91 731 12% B n/a n/a n/a n/a
458 378 Kredyt Bank Poland 91 999 9% BBB 139 2,419 6% A-
459 n/a Bank ZENIT Russia 91 n/a n/a BBB n/a n/a n/a n/a
460 246 E*TRADE FINAN-CIAL Corp United States 91 726 13% BB 333 1,422 23% B
461 n/a Power Finance Corporation India 91 2,500 4% BBB n/a n/a n/a n/a
462 302 The Iyo Bank Japan 90 3,456 3% BB 232 3,248 7% A-
463 401 UMB United States 90 1,922 5% A- 117 1,604 7% BBB
464 n/a CA Aquitaine France 88 685 13% A- n/a n/a n/a n/a
465 n/a Dundee Corporation Canada 87 255 34% BB n/a n/a n/a n/a
466 320 ITG United States 87 989 9% A- 198 1,945 10% A
467 n/a Oriental Bank Of Commerce India 86 719 12% BB n/a n/a n/a n/a
468 345 Ural-Siberian Bank Russia 86 613 14% CCC 165 4,472 4% B
469 409 Valley National Bancorp United States 86 2,583 3% A- 110 2,193 5% A-
470 277 Rosbank Russia 86 2,610 3% CCC 269 4,970 5% B
471 279 Attijariwafa Bank Morocco 86 5,802 1% B 263 8,380 3% BB
472 n/a AGF Management Canada 85 566 15% BB n/a n/a n/a n/a
473 507 JSCB Ukrsotsbank Ukraine 85 373 23% CC 29 2,896 1% B
474 258 OMC Card Japan 85 405 21% B 308 1,560 20% BB
475 372 Trustmark National Bank United States 84 1,141 7% A- 142 1,283 11% BBB
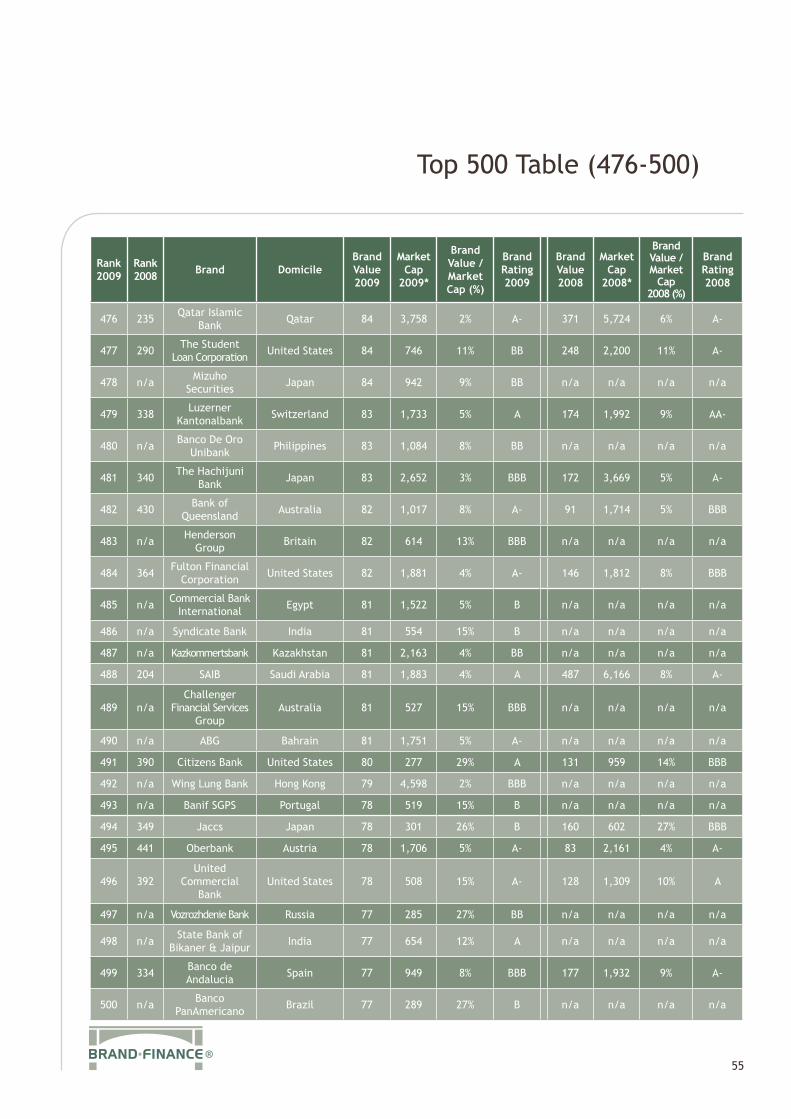
Rank 2009
Rank 2008 Brand Domicile
Brand Value 2009
Market Cap
2009*
Brand Value / Market Cap (%)
Brand Rating 2009
Brand Value 2008
Market Cap
2008*
Brand Value / Market
Cap 2008 (%)
Brand Rating 2008
476 235 Qatar Islamic Bank Qatar 84 3,758 2% A- 371 5,724 6% A-
477 290 The Student Loan Corporation United States 84 746 11% BB 248 2,200 11% A-
478 n/a Mizuho Securities Japan 84 942 9% BB n/a n/a n/a n/a
479 338 Luzerner Kantonalbank Switzerland 83 1,733 5% A 174 1,992 9% AA-
480 n/a Banco De Oro Unibank Philippines 83 1,084 8% BB n/a n/a n/a n/a
481 340 The Hachijuni Bank Japan 83 2,652 3% BBB 172 3,669 5% A-
482 430 Bank of Queensland Australia 82 1,017 8% A- 91 1,714 5% BBB
483 n/a Henderson Group Britain 82 614 13% BBB n/a n/a n/a n/a
484 364 Fulton Financial Corporation United States 82 1,881 4% A- 146 1,812 8% BBB
485 n/a Commercial Bank International Egypt 81 1,522 5% B n/a n/a n/a n/a
486 n/a Syndicate Bank India 81 554 15% B n/a n/a n/a n/a
487 n/a Kazkommertsbank Kazakhstan 81 2,163 4% BB n/a n/a n/a n/a
488 204 SAIB Saudi Arabia 81 1,883 4% A 487 6,166 8% A-
489 n/aChallenger
Financial Services Group
Australia 81 527 15% BBB n/a n/a n/a n/a
490 n/a ABG Bahrain 81 1,751 5% A- n/a n/a n/a n/a
491 390 Citizens Bank United States 80 277 29% A 131 959 14% BBB
492 n/a Wing Lung Bank Hong Kong 79 4,598 2% BBB n/a n/a n/a n/a
493 n/a Banif SGPS Portugal 78 519 15% B n/a n/a n/a n/a
494 349 Jaccs Japan 78 301 26% B 160 602 27% BBB
495 441 Oberbank Austria 78 1,706 5% A- 83 2,161 4% A-
496 392United
Commercial Bank
United States 78 508 15% A- 128 1,309 10% A
497 n/a Vozrozhdenie Bank Russia 77 285 27% BB n/a n/a n/a n/a
498 n/a State Bank of Bikaner & Jaipur India 77 654 12% A n/a n/a n/a n/a
499 334 Banco de Andalucia Spain 77 949 8% BBB 177 1,932 9% A-
500 n/a Banco PanAmericano Brazil 77 289 27% B n/a n/a n/a n/a
55
Top 500 Table (476-500)
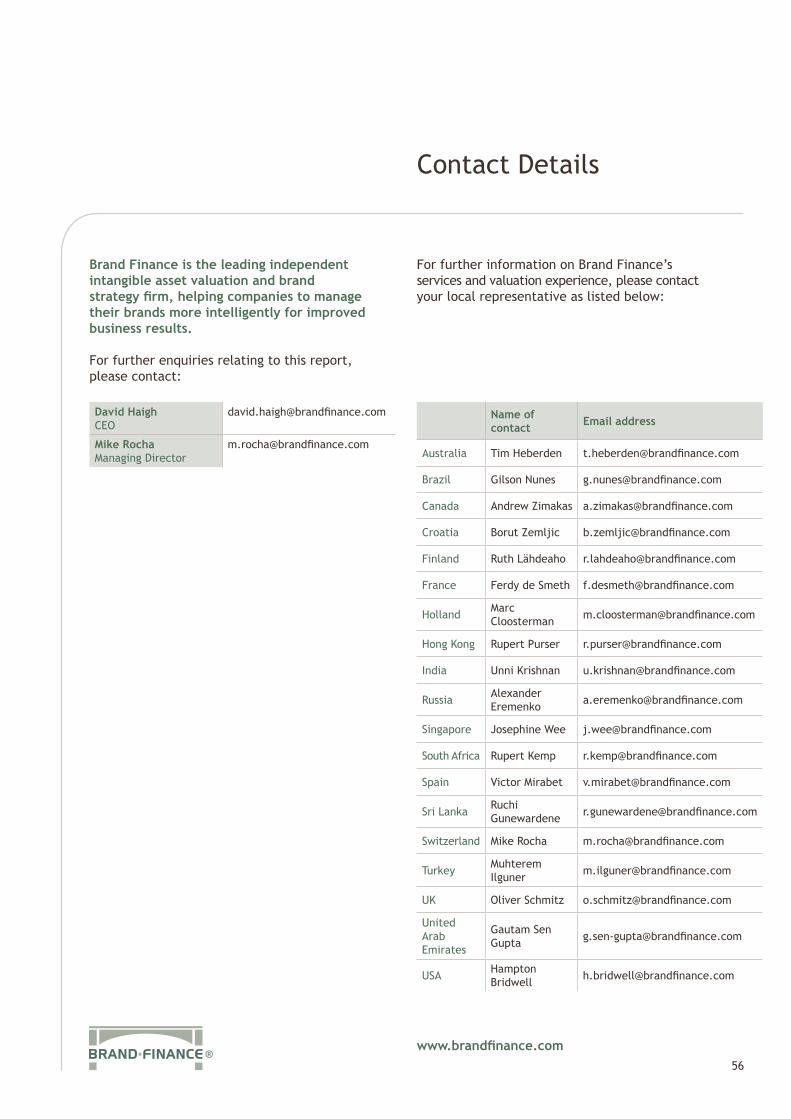
Contact Details
56
Brand Finance is the leading independent intangible asset valuation and brand strategy firm, helping companies to manage their brands more intelligently for improved business results.
For further enquiries relating to this report, please contact:
David Haigh CEO
Mike Rocha Managing Director
For further information on Brand Finance’s services and valuation experience, please contact your local representative as listed below:
Name of contact Email address
Australia Tim Heberden [email protected]
Brazil Gilson Nunes [email protected]
Canada Andrew Zimakas [email protected]
Croatia Borut Zemljic [email protected]
Finland Ruth Lähdeaho [email protected]
France Ferdy de Smeth [email protected]
Holland Marc Cloosterman [email protected]
Hong Kong Rupert Purser [email protected]
India Unni Krishnan [email protected]
Russia Alexander Eremenko [email protected]
Singapore Josephine Wee [email protected]
South Africa Rupert Kemp [email protected]
Spain Victor Mirabet [email protected]
Sri Lanka Ruchi Gunewardene [email protected]
Switzerland Mike Rocha [email protected]
Turkey Muhterem Ilguner [email protected]
UK Oliver Schmitz [email protected]
United Arab Emirates
Gautam Sen Gupta [email protected]
USA Hampton Bridwell [email protected]
www.brandfinance.com