2011 brandfinance banking 500 summary brand valuation...
TRANSCRIPT
2011 BrandFinance® Banking 500Summary Brand Valuation Report
Prepared for:
Brand Finance plc, January 2011
In association with Bridging the gap between marketing and financeTM

1. Introduction to 2011 BrandFinance® Banking 500
2. Global results• Executive Summary• Top 10 most valuable global banking brands• Top 10 most valuable banking brands in [relevant
geographic region]• Top 10 most valuable banking brands in [Country x]• Most valuable banking brand by business segment
3. [name of bank] results• Valuation Results• Valuation Schedule & Assumptions• Brand valuation by region• Brand valuation by business segment• Brand valuation reconciliation• Change in ßrandßeta® Index• Competitor review• Competitor review – historical brand values• Portfolio value• Market cap composition
Table Of Contents2011 BrandFinance® Banking 500 – Summary Brand Valuation Report
4. Brand Valuation Analysis
5. About Brand Finance
Appendix I Valuation Methods
• IVSC – Recognised Valuation Approaches• IVSC – Recognised Valuation Methods• International Brand Valuation Standard (ISO – 10668)• Summary of ‘Royalty Relief’ Method• Overview of the BrandFinance® Methodology• Comparison of other brand valuation approaches
Appendix II2011 BrandFinance® Global Intangibles Financial Tracker (GIFT)
Appendix IIIAdditional Materials
Contents 2

sectiononesectionone
Introduction and valuation methodology
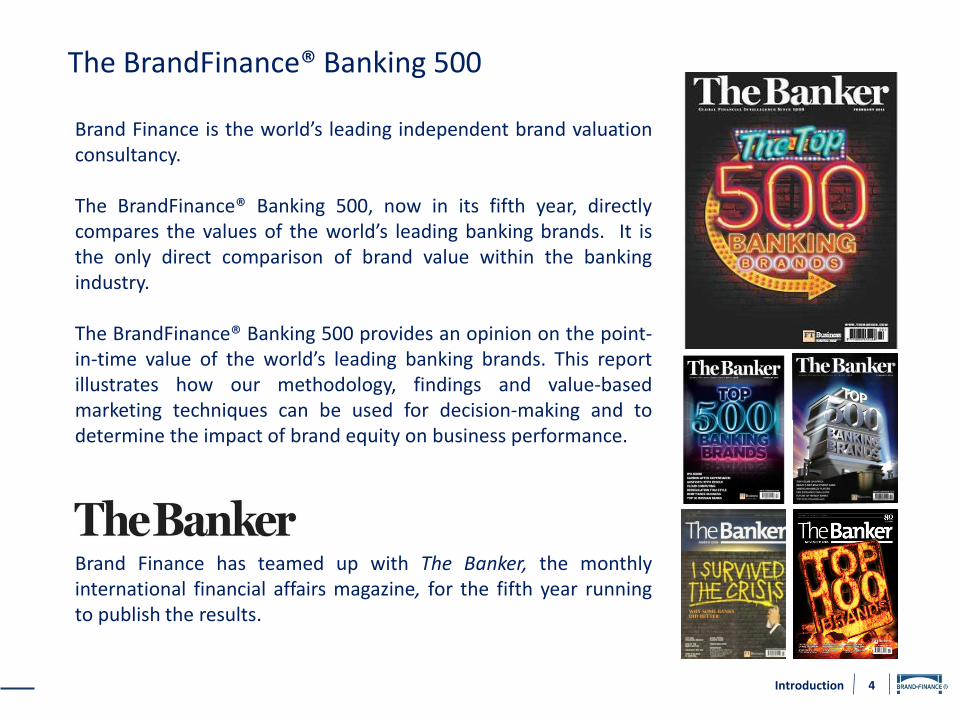
Brand Finance is the world’s leading independent brand valuationconsultancy.
The BrandFinance® Banking 500, now in its fifth year, directlycompares the values of the world’s leading banking brands. It isthe only direct comparison of brand value within the bankingindustry.
The BrandFinance® Banking 500 provides an opinion on the point-in-time value of the world’s leading banking brands. This reportillustrates how our methodology, findings and value-basedmarketing techniques can be used for decision-making and todetermine the impact of brand equity on business performance.
Brand Finance has teamed up with The Banker, the monthlyinternational financial affairs magazine, for the fifth year runningto publish the results.
The BrandFinance® Banking 500
4Introduction
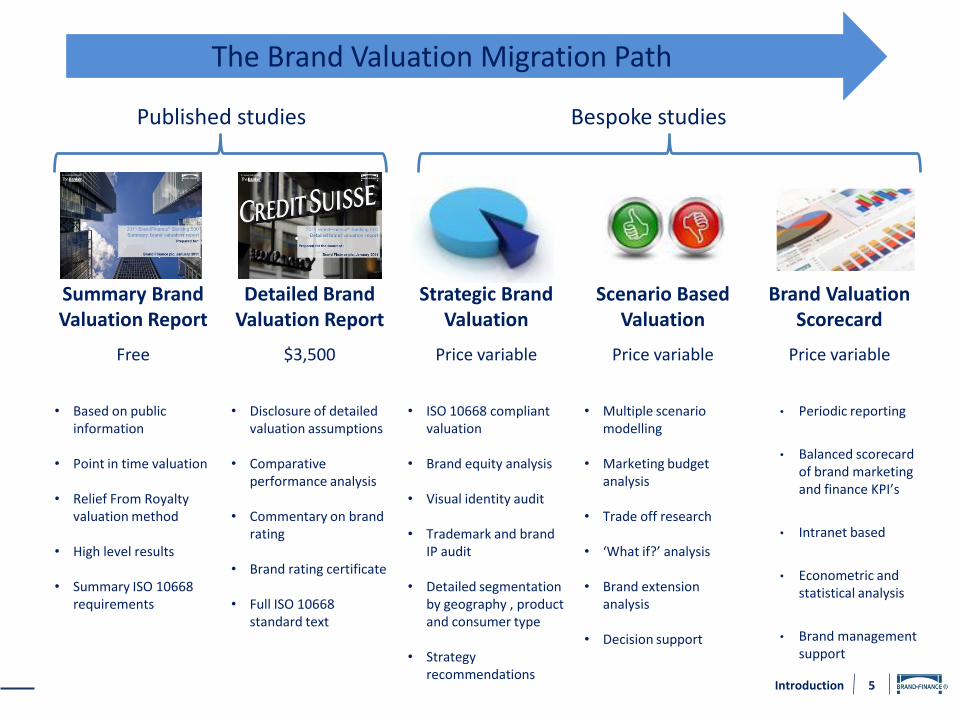
Summary Brand Valuation Report
Detailed Brand Valuation Report
Strategic Brand Valuation
Scenario Based Valuation
Brand Valuation Scorecard
Free $3,500 Price variable Price variable Price variable
• Based on public information
• Point in time valuation
• Relief From Royalty valuation method
• High level results
• Summary ISO 10668 requirements
• Disclosure of detailed valuation assumptions
• Comparative performance analysis
• Commentary on brand rating
• Brand rating certificate
• Full ISO 10668 standard text
• ISO 10668 compliant valuation
• Brand equity analysis
• Visual identity audit
• Trademark and brand IP audit
• Detailed segmentation by geography , product and consumer type
• Strategy recommendations
• Multiple scenario modelling
• Marketing budget analysis
• Trade off research
• ‘What if?’ analysis
• Brand extension analysis
• Decision support
• Periodic reporting
• Balanced scorecard of brand marketing and finance KPI’s
• Intranet based
• Econometric and statistical analysis
• Brand management support
Published studies Bespoke studies
5Introduction
The Brand Valuation Migration Path
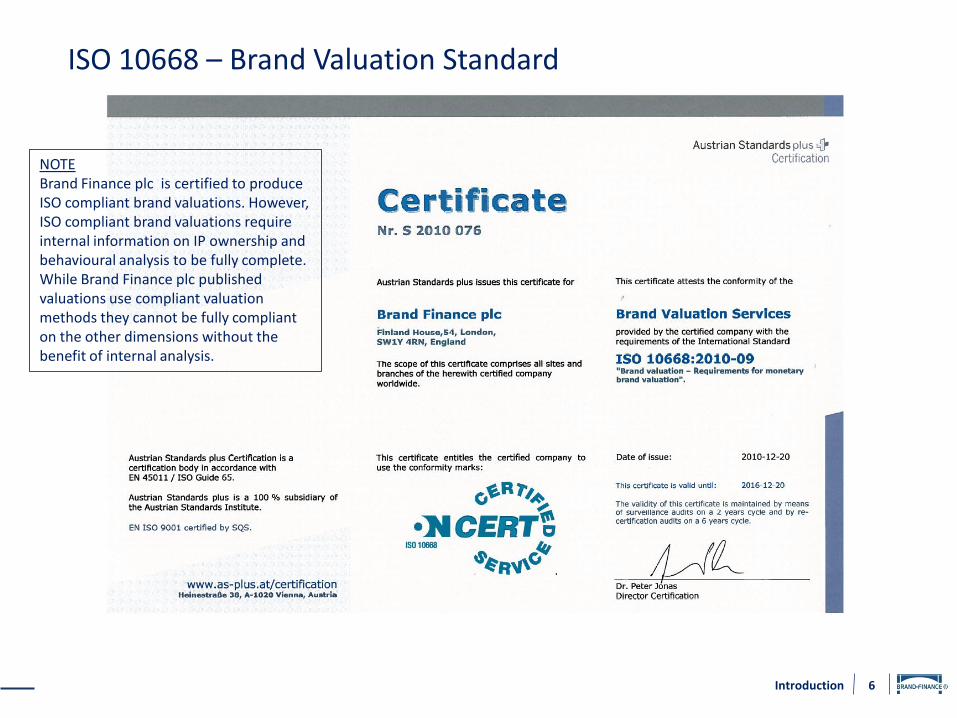
ISO 10668 – Brand Valuation Standard
6Introduction
NOTEBrand Finance plc is certified to produce ISO compliant brand valuations. However,ISO compliant brand valuations require internal information on IP ownership and behavioural analysis to be fully complete. While Brand Finance plc published valuations use compliant valuation methods they cannot be fully compliant on the other dimensions without the benefit of internal analysis.

sectiononesectiontwo
Global Results

8Global results
Executive Summary
(US$ m) 2011 2010%
Change
Total Brand Value
220 184 20%
Total Market Cap
1,267 978 30%
Top 10
1. The total increase in brand value of the Banking 500 is US$139bn.
2. 78% of the total gain in brand value is among the top 100 brands.
3. The best performing brand in the Banking 500 is Itaú with an increase in brand value of $9.7 billion. This can be largely attributed to its acquisition and rebranding of Unibanco.
4. The resurgence of the US banking industry is evidenced by an increase in the number of US banks in the study from 85 banks in 2010 to 90 in 2011. This is in addition to US domiciled banks experiencing a 23% increase in brand value. The number of European banks to fall out of the Banking 500 in 2010 was 5. However, European domiciled banks saw their brand value increase by 6%.
5. Retail remains the largest sector with a contribution of $284 billion, which accounts for 33% of the Banking 500. This year we have split out Wealth Management from the Retail sector and this new segment accounts for $50 billion which makes up 6% of the Banking 500.
* All figures in US$ billions
(US$ m) 2011 2010%
Change
Total Brand Value
654 545 20%
Total Market Cap
4,233 4,133 2%
Top 100 (US$ m) 2011 2010
%Change
Total Brand Value
855 716 19%
Total Market Cap
6,078 5,995 1%
Top 500

9Global results
Top 10 Most Valuable Global Banks
Rank 2011
Rank 2010
Brand Brand Value
2011Brand Value
2010Market Cap
2011Market Cap
2010
BrandValue/Market
Cap 2011
BrandValue/Market
Cap 2010
Brand Rating2011
Brand Rating2010
1 2 30,619 26,047 120,195 111,754 25% 23% AAA- AAA+
2 4 28,944 21,916 136,069 131,225 21% 17% AA+ AA
3 1 27,632 28,472 171,163 193,794 16% 15% AAA AAA+
4 3 26,150 25,576 100,281 128,087 26% 20% AAA AAA+
5 8 19,150 13,400 90,089 69,901 21% 19% AA- AA
6 9 18,678 13,299 69,604 56,583 27% 24% AAA AAA-
7 10 17,358 13,134 50,683 56,155 34% 23% AA AA
8 12 17,194 12,083 218,132 225,368 8% 5% AA AA+
9 5 17,133 14,362 105,323 70,105 16% 20% AA A+
10 13 17,092 12,076 205,564 208,117 8% 6% AA AA+
Your bank here

10Global results
Top 10 Most Valuable banks in relevant region – eg: Europe
Rank 2011
Rank 2010
Brand Brand Value
2011Brand Value
2010Market Cap
2011Market Cap
2010
BrandValue/Market
Cap 2011
BrandValue/Market
Cap 2010
Brand Rating2011
Brand Rating2010
1 1 27,632 28,472 171,163 193,794 16% 15% AAA AAA+
2 2 26,150 25,576 100,281 128,087 26% 20% AAA AAA+
3 4 17,358 13,134 50,683 56,155 34% 23% AA AA
4 3 16,643 14,060 64,882 67,144 26% 21% AAA- AA
5 7 15,169 9,862 52,442 43,273 29% 23% AA+ AA-
6 9 13,497 8,430 46,645 50,468 29% 17% AAA- AA
7 5 12,012 11,729 64,329 51,108 19% 23% AA+ AA+
8 6 10,720 10,727 51,233 69,134 21% 16% AA AA-
9 10 9,915 8,261 67,481 62,240 15% 13% AA AA-
10 8 8,153 8,635 30,080 33,303 27% 26% AA- AA-
Your bank here

11Global results
Top 10 Most Valuable banks in relevant Country – eg: Switzerland
Rank 2011
Rank 2010
Brand Brand Value
2011Brand Value
2010Market Cap
2011Market Cap
2010
BrandValue/Market
Cap 2011
BrandValue/Market
Cap 2010
Brand Rating2011
Brand Rating2010
1 1 13,497 8,430 46,645 50,468 29% 17% AAA- AA
2 2 9,915 8,261 67,481 62,240 15% 13% AA AA-
3 3 1,302 659 7,795 8,284 17% 8% AA+ AA-
4 4 681 644 3,318 11,684 21% 6% A A
5 5 651 525 n/a n/a n/a n/a AA- A
6 n/a 400 n/a 2,334 n/a 17% n/a AA- n/a
7 8 367 225 2,178 2,069 17% 11% AA A+
8 7 343 234 4,469 3,323 8% 7% AA- A+
9 9 340 221 2,280 2,463 15% 9% A A
10 6 333 261 1,760 2,424 19% 11% A A
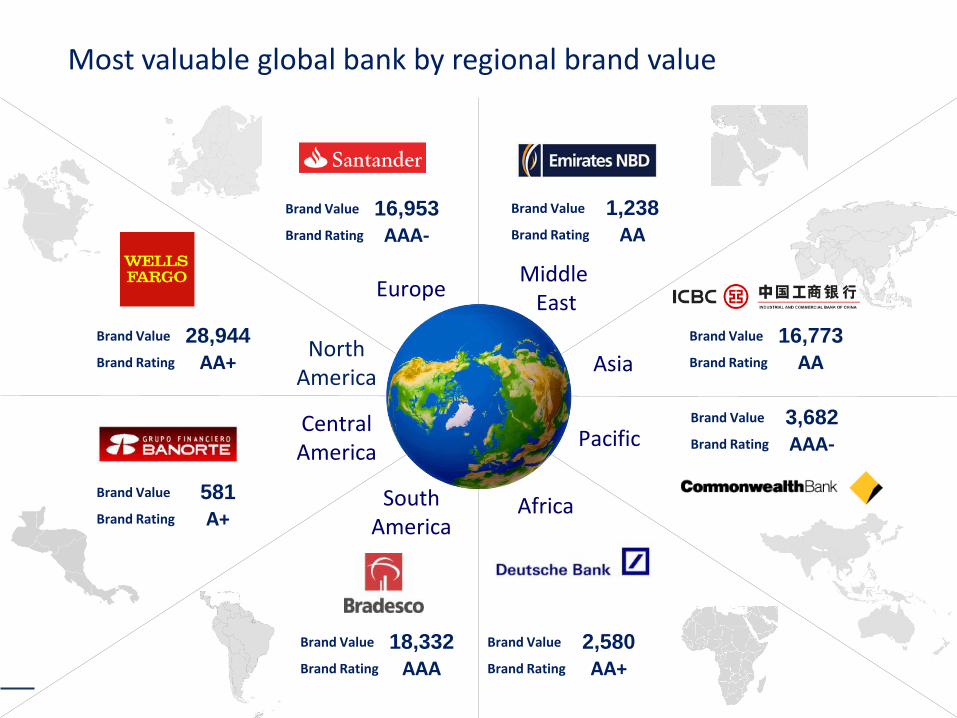
Most valuable global bank by regional brand value
Europe
Africa
MiddleEast
Asia
Pacific
South America
Central America
North America
Brand Value 16,953Brand Rating AAA-
Brand Value 28,944Brand Rating AA+
Brand Value 581Brand Rating A+
Brand Value 18,332Brand Rating AAA
Brand Value 2,580Brand Rating AA+
Brand Value 3,682Brand Rating AAA-
Brand Value 16,773Brand Rating AA
Brand Value 1,238Brand Rating AA

13
Most valuable bank brand by sector
Global results
Brand Value 7,618Brand Rating AA
Credit Cards
Brand Value 14,146Brand Rating AA
Commercial
Brand Value 10,706Brand Rating AA
Investment/Wholesale
Brand Value 11,394Brand Rating AA-
Retail
Brand Value 24,360Brand Rating AAA
Wealth Management

sectiononesectionthree
[Name of bank] results

Market Capitalisation Brand Value
Brand Strength Index
Valuation Results
15Valuation results
0
5000
10000
15000
20000
25000
30000
35000
2008 2009 2010 2011
xxx
xxx
xxx
xxx
Mar
ket
Cap
$ m
illio
ns
0
1000
2000
3000
4000
5000
6000
7000
8000
2007 2008 2009 2010 2011
xxx
xxx
xxx xxx
xxx
Bra
nd
Val
ue
$ m
illio
ns
0
10
20
30
40
50
60
70
2007 2008 2009 2010 2011
xx xx
xx xx xx
Bra
nd
Str
engt
h I
nd
ex
Brand Value $XXXMarket Capitalisation Value $xxxBrand Value/Market Capitalisation xx%Brand Rating xxx
Parent Company: Domicile:

TOTAL BRAND VALUE
XXXX
VALUE IN EXPLICIT PERIOD
VALUE IN PERPETUITY
CORPORATE VALUE
XXXX XXXX XXXXX
DISCOUNT RATE XXXX XXXX REVENUE FORECAST CAGR
TAX RATE XXXX XXXX ROYALTY RATE
PERPETUITY RATE XXXX XXXX BRAND SPLIT
2005 2006 2007 2008 2009 2010 2011 2012 2013 2014 2015
BRAND SPLIT %
REVENUEgrowth %
ROYALTY RATEBRAND CONTRIBUTION
TAX
DISCOUNT FACTOR
NPV
16Valuation results
Valuation Schedule & Assumptions
Brand Value $XXXMarket Capitalisation Value $xxxBrand Value/Market Capitalisation xx%Brand Rating xxx
Parent Company: Domicile:
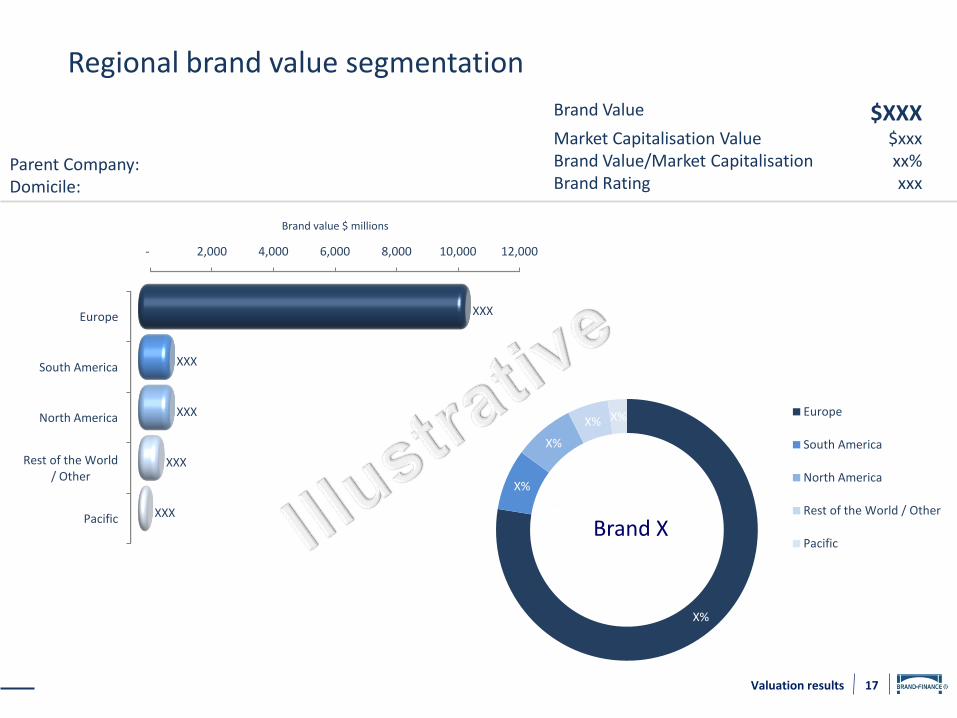
Regional brand value segmentation
17Valuation results
- 2,000 4,000 6,000 8,000 10,000 12,000
Europe
South America
North America
Rest of the World / Other
Pacific
XXX
XXX
XXX
XXX
XXX
Brand value $ millions
X%
X%
X%
X% X% Europe
South America
North America
Rest of the World / Other
PacificBrand X
Brand Value $XXXMarket Capitalisation Value $xxxBrand Value/Market Capitalisation xx%Brand Rating xxx
Parent Company: Domicile:

Product brand value segmentation
18Valuation results
X%
X%
X%X%
Wholesale - Banking / Investment - Banking
Retail - Banking
Asset Management -Banking
Other - Banking
- 1,000 2,000 3,000 4,000 5,000 6,000 7,000
Wholesale - Banking / Investment - Banking
Retail - Banking
Asset Management -Banking
Other - Banking
XXX
XXX
XXX
XXX
Brand value $ millions
Brand X
Brand Value $XXXMarket Capitalisation Value $xxxBrand Value/Market Capitalisation xx%Brand Rating xxx
Parent Company: Domicile:
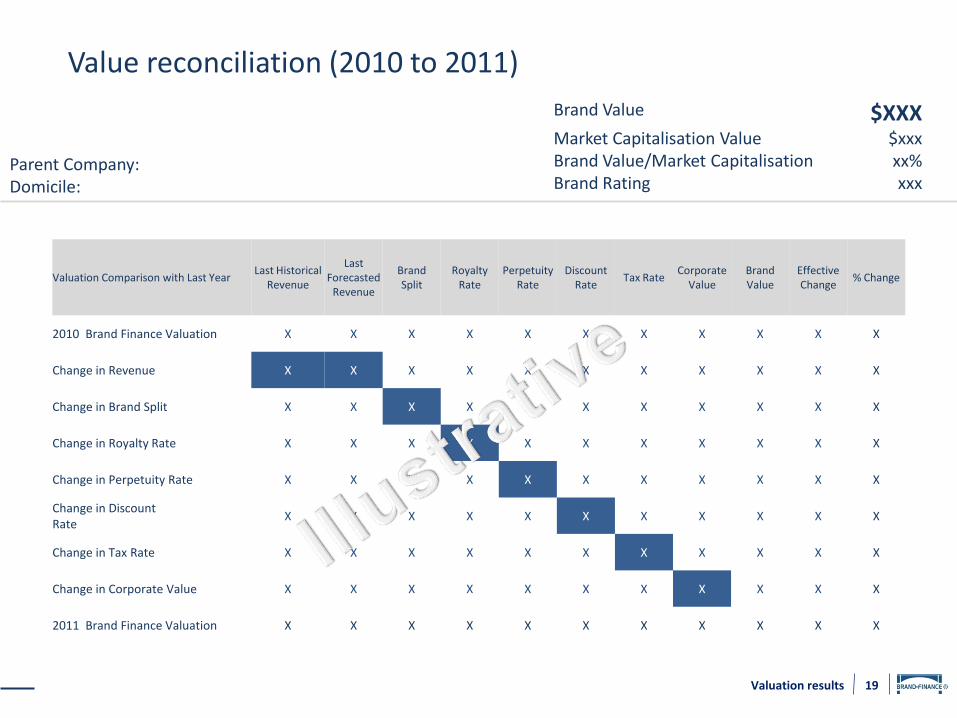
Valuation Comparison with Last YearLast Historical
Revenue
Last Forecasted
Revenue
Brand Split
RoyaltyRate
Perpetuity Rate
Discount Rate
Tax RateCorporate
ValueBrand Value
Effective Change
% Change
2010 Brand Finance Valuation X X X X X X X X X X X
Change in Revenue X X X X X X X X X X X
Change in Brand Split X X X X X X X X X X X
Change in Royalty Rate X X X X X X X X X X X
Change in Perpetuity Rate X X X X X X X X X X X
Change in Discount Rate
X X X X X X X X X X X
Change in Tax Rate X X X X X X X X X X X
Change in Corporate Value X X X X X X X X X X X
2011 Brand Finance Valuation X X X X X X X X X X X
19Valuation results
Value reconciliation (2010 to 2011)
Brand Value $XXXMarket Capitalisation Value $xxxBrand Value/Market Capitalisation xx%Brand Rating xxx
Parent Company: Domicile:
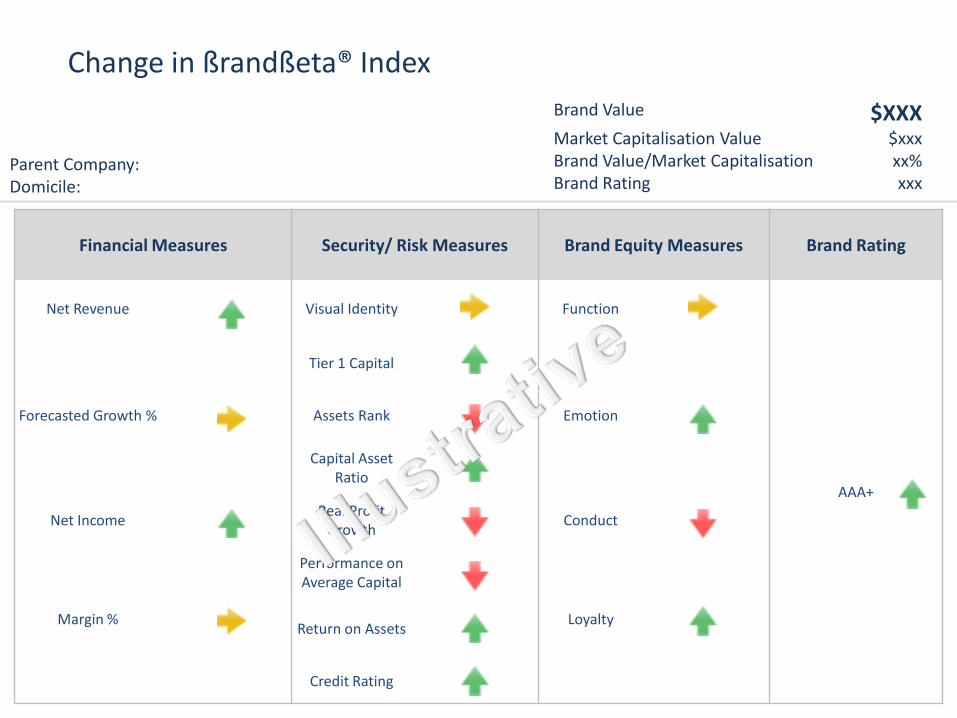
Financial Measures Security/ Risk Measures Brand Equity Measures Brand Rating
Net Revenue Visual Identity Function
AAA+
Tier 1 Capital
Forecasted Growth % Assets Rank Emotion
Capital Asset Ratio
Net IncomeReal Profit
GrowthConduct
Performance on Average Capital
Margin %Return on Assets
Loyalty
Credit Rating
Change in ßrandßeta® Index
Brand Value $XXXMarket Capitalisation Value $xxxBrand Value/Market Capitalisation xx%Brand Rating xxx
Parent Company: Domicile:

Brand Value X X X X X X X
Market Cap X X X X X X X
Global Rank X X X X X X X
BV/MC X% X% X% X% X% X% X%
21Valuation results
XXX XXX
XXX
XXX
XXX
XXX
XXX
XXX XXX XXX XXX XXX XXX XXX
0
50,000
100,000
150,000
200,000
250,000
300,000
350,000
400,000
Bra
nd
val
ue
$ m
illio
ns
Enterprise Value Brand Value
Your Brand Comp 1 Comp 5Comp 4Comp 3Comp 2 Comp 6
Competitor review
Market Cap
Brand Value $XXXMarket Capitalisation Value $xxxBrand Value/Market Capitalisation xx%Brand Rating xxx
Parent Company: Domicile:

22Valuation results
Competitor review – historical brand values
0
5,000
10,000
15,000
20,000
25,000
30,000
35,000
2007 2008 2009 2010 2011
Bra
nd
val
ue
$ m
illio
ns
Year
Your Brand
Comp 1
Comp 2
Comp 3
Comp 4
Comp 5
Comp 6
Brand Value $XXXMarket Capitalisation Value $xxxBrand Value/Market Capitalisation xx%Brand Rating xxx
Parent Company: Domicile:
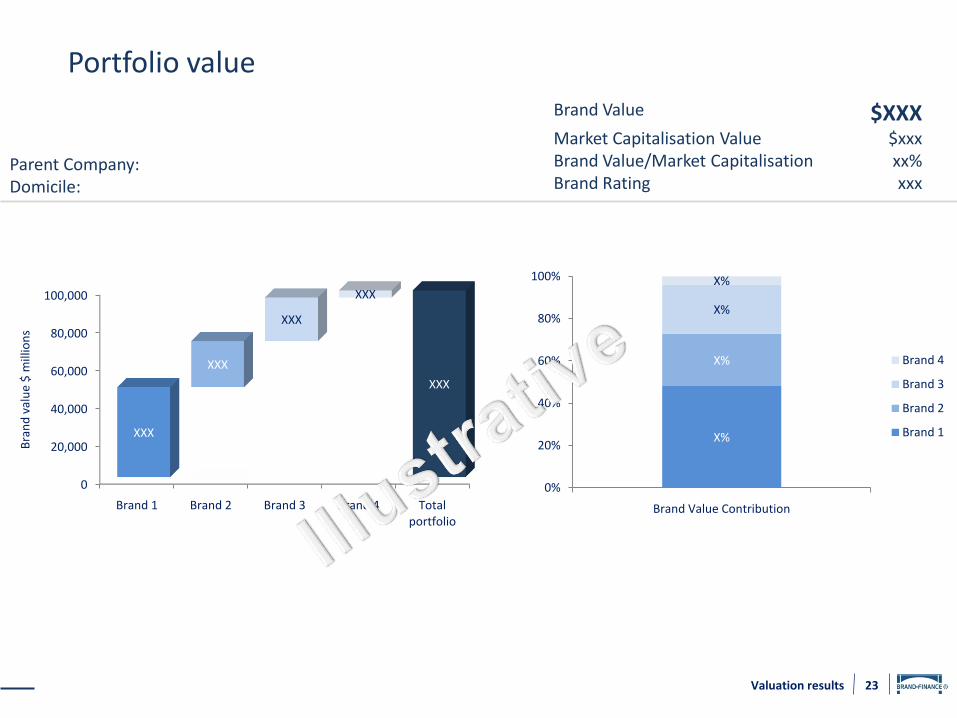
23Valuation results
Portfolio value
0
20,000
40,000
60,000
80,000
100,000
Brand 1 Brand 2 Brand 3 Brand 4 Total portfolio
XXX XXX
XXX
XXX
XXX
XXX
XXX
XXX
Bra
nd
val
ue
$ m
illio
ns
X%
X%
X%
X%
0%
20%
40%
60%
80%
100%
Brand Value Contribution
Brand 4
Brand 3
Brand 2
Brand 1
Brand Value $XXXMarket Capitalisation Value $xxxBrand Value/Market Capitalisation xx%Brand Rating xxx
Parent Company: Domicile:
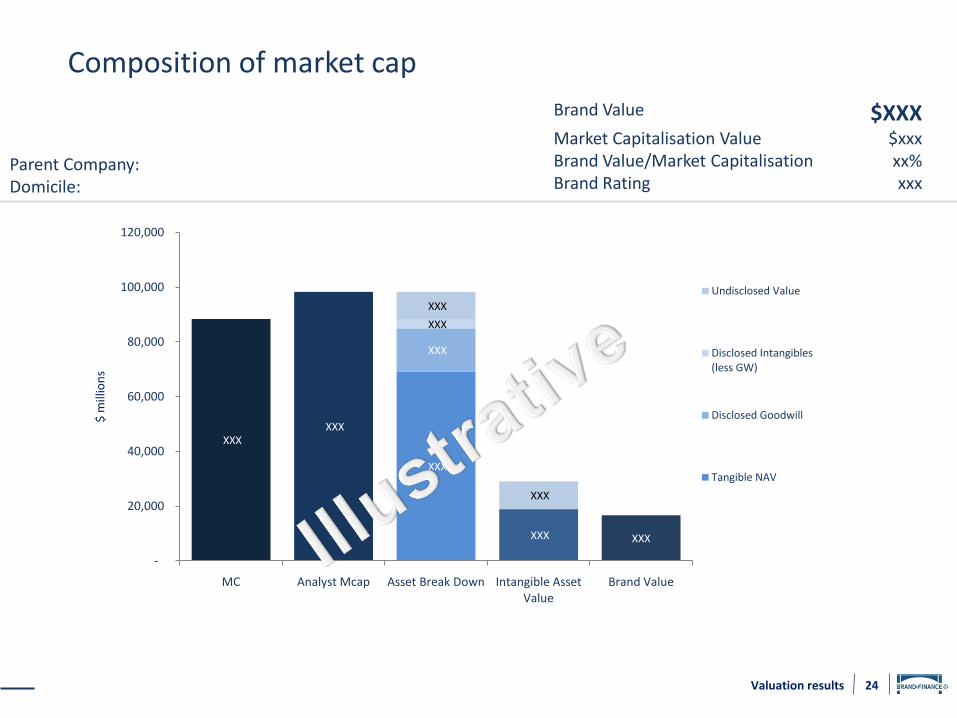
24Valuation results
Composition of market cap
XXXXXX
XXX
XXX XXX
XXX
XXX
XXX
XXX
-
20,000
40,000
60,000
80,000
100,000
120,000
MC Analyst Mcap Asset Break Down Intangible Asset Value
Brand Value
$ m
illio
ns
Undisclosed Value
Disclosed Intangibles (less GW)
Disclosed Goodwill
Tangible NAV
Brand Value $XXXMarket Capitalisation Value $xxxBrand Value/Market Capitalisation xx%Brand Rating xxx
Parent Company: Domicile:

sectiononesectionfour
Brand valuation analysis

26Brand valuation analysis
• How can brand valuation enhance shareholder value?
– Better understand the value of key customer segments (by geography, product, channel and customer type)
– Understand the relationship between brand equity and key value drivers in the business model
– Understand the strengths and weaknesses of the brand compared with key competitors
– Provide a planning framework for long term strategic marketing investment
– Create a framework for marketing mix modelling
– Create the framework for better reporting and managing brand performance (brand scorecard or dashboard)
– Create a body of information about brand performance for use in investor and banking presentations
Why conduct a more detailed brand valuation study

27Brand valuation analysis
Marketing Mix Optimisation
Brand Scorecard
Dynamic Valuation
Model
Brand Equity Measurement
Strategic Brand
Valuation
Market Research
Business Data
Value Mapping
Continuous feedback
Brand Discovery
• Brand Finance’s approach has been designed to allow clients to manage their brands more intelligently and deliver improved business results
• Each step in the process is tailored to the client’s specific needs and the level of sophistication required, from ‘high level’ to ‘highly granular’
Brand Finance approach to marketing-oriented projects

28Brand valuation analysis
Brand Discovery & Value Mapping
Brand Equity Measurement
Strategic Brand Valuation
Marketing Mix Optimisation
Brand Scorecard Dynamic Valuation Model
• What is legal & economic status of the brand?
• What financial, competitor & market data is available?
• What data gaps must be addressed?
• What are key value drivers (and linkages between drivers) within the business?
• What are key drivers of brand equity?
• What is the relative importance of each driver to my customers (by segment)?
• How do I perform versus my competitors on key drivers?
• How strong is my brand relative to its competitors?
• What is the value of my brand and what does it contribute to business value?
• Which segments of my business are generating most value?
• How should I allocate my resources?
• How does brand equity link to business results and branded business value?
• What is the optimal marketing mix to maximise short term sales?
• What is the return on my promotional marketing spend?
• Can we connect marketing investments, drivers, & health indicators to financial KPI’s and shareholder value?
• How can we track performance over time and capture data systematically for improved decision-making and in-depth understanding of value drivers?
• Which markets, customers, brands and channels will generate the highest return and maximise shareholder value?
• How much should we invest and where to maximise that return?
• What value is at risk if we fail to adequately support the brand?
• Market research review
• Data gap analysis
• Value map (via interviews or workshops)
• Brand Equity Driver analysis
• Brand Equity analysis
• Brandβeta® analysis
• Business and brand valuation framework
• Brand Valued Added®
• Brand Evaluation Matrix
• Profit pool analysis
• Demand Driver analysis
• Econometric modelling
• Marketing ROI
• Brand Dashboard (high level snapshot for management)
• Brand Scorecard (in depth diagnostic tool for marketers)
• Strategy selection
• Portfolio management
• Brand architecture
• Resource allocation
• ‘Value at risk’ analysis
Serv
ices
Qu
est
ion
s

sectiononesectionfive
About Brand Finance

We perform valuations for financial reporting, tax planning, M&A activities, joint ventures, IPOs and other transactions. We work closely with auditors, tax authorities and lawyers.
Our analytical services help clients to better understand the drivers of business and brand value. Understanding how value is created, where it is created and the relationship between brand value and business value is a vital input to strategic decision making.
Valuation Analytics
We give marketers the framework to make effective economic decisions. Our value-based marketing service enables companies to focus on the best opportunities, allocate budgets to activities that have the most impact, measure the results and articulate the return on brand investment.
We help private equity companies, venture capitalists and branded businesses to identify and assess the value opportunities through brand and market due diligence and brand licensing.
Strategy Transactions
Our Services
At Brand Finance, we are entirely focussed on quantifying and leveraging intangible asset value. Our services compliment and support each other, resulting in robust valuation methodologies, which are underpinned by an in-depth understanding of revenue drivers and licensing practice.
About Brand Finance 30

Selection of other global clients
32
About Brand Finance 32

Canada
USA
Brazil
South Africa
Spain
Portugal
Turkey
Greece
SwitzerlandCroatia
Holland
U.K. (HQ)
France
Finland
Russia
Dubai
Sri Lanka
India
Singapore
Hong Kong
Australia
About Brand Finance 33
Our international network
East Africa
Belgium

34Brand Finance
Brand Finance plc is the leading independentintangible asset valuation and brand strategyfirm, helping companies to manage theirbrands more intelligently for improvedbusiness results.
For further enquiries relating to this report,please contact:
David Haigh
CEO
Mike Rocha
Managing Director
For further information on Brand Finance’s services and valuation experience, please contact your local representative.
Contact detailsCountry Name of Contact Email address
Australia Tim Heberden [email protected]
Belgium Richard Yoxon [email protected]
Brazil Gilson Nunes [email protected]
Canada Edgar Baum [email protected]
Croatia Borut Zemljic [email protected]
Dubai Gautam Sen Gupta [email protected]
East Africa Jawad Jaffer [email protected]
France Xander Bird [email protected]
Holland Marc Cloosterman [email protected]
Hong Kong Rupert Purser [email protected]
India Unni Krishnan [email protected]
Portugal Pedro Tavares [email protected]
Russia Alexander Eremenko [email protected]
Singapore Samir Dixit [email protected]
South Africa Oliver Schmitz [email protected]
Spain Pedro Tavares [email protected]
Sri Lanka Ruchi Gunewardene [email protected]
Switzerland Mike Rocha [email protected]
Turkey Muhterem Ilguner [email protected]
United Kingdom James Park [email protected]
USA Bill Barker [email protected]
USA Elise Neils [email protected]

sectiononeappendixone
Valuation Methods

In 2006, the IVSC was commissioned to produce a ‘Guidance Note on the valuation ofintangible assets for IFRS financial reports’ by the following bodies:
• The Securities and Exchange Commission (SEC)• American Institute of Certified Public Accountants (AICPA)• International Accounting Standards Board (IASB)
Consultation responses received in 2009 and final guidelines have been published as ofFebruary 2010
The purpose of this Guidance Note was to:
• Address valuation issues not covered by IFRS• Codify existing best practice• Address strengths and weaknesses of different valuation methods• Improve consistency and reliability of results
36Valuation methodology
IVSC
As the established international standard setter for valuation, the IVSC developsand maintains standards for the reporting and disclosure of valuations, especiallythose that will be relied upon by investors and other third party stakeholders.

37Valuation methodology
IVSC – Recognised Valuation Methods
Cashflow or earnings generated by the
intangible asset or expenses saved by the intangible are estimated directly by
reference to market benchmarks
MarketApproach
Valuation Approaches
Cost Approach
Indirect or Residual Methods
Income Split
Income Approach
present value of earnings attributable to the asset or costs avoided as a result of owning the
asset
reproduction/ replacement cost-adjusted for depreciation and obsolescence
based on multiples or prices from market transactions involving the
sale of comparable assets
Recommended by IVSC Guidance Note 4 and 16
as the primary method for valuing brands,
patents, secret formulae, technology
Direct Methods
Price PremiumMethod
Margin or Earnings Uplift Method
Relief-from-RoyaltyMethod
Residual earnings left after deducting from
after-tax operating earnings the fair returns on all other assets employed

In 2006, Deutsches Institut für Normung (DIN) produced a German standard on brand valuation. DIN proposed to ISO to expand this initiative globally and this project was completed in 2010.
The purpose of the ISO Draft Standard 10668 is:
• To create a universal standard for all applications in all territories.
• To create an accepted, transparent methodology which is reproducible.
• To ensure that all important analysis should be included in a brand valuationexercise, namely legal issues, behavioural issues, and financial analysis.
On 20th December 2010, Brand Finance was certified to produce brand valuations incompliance with ISO by Austrian Standards plus
38Valuation methodology
ISO
ISO (International Organization for Standardization) is the world's largest developer and publisher of International Standards. It is a network of the national standards institutes of 162 countries, one member per country, with a Central Secretariat in Geneva that coordinates the system.
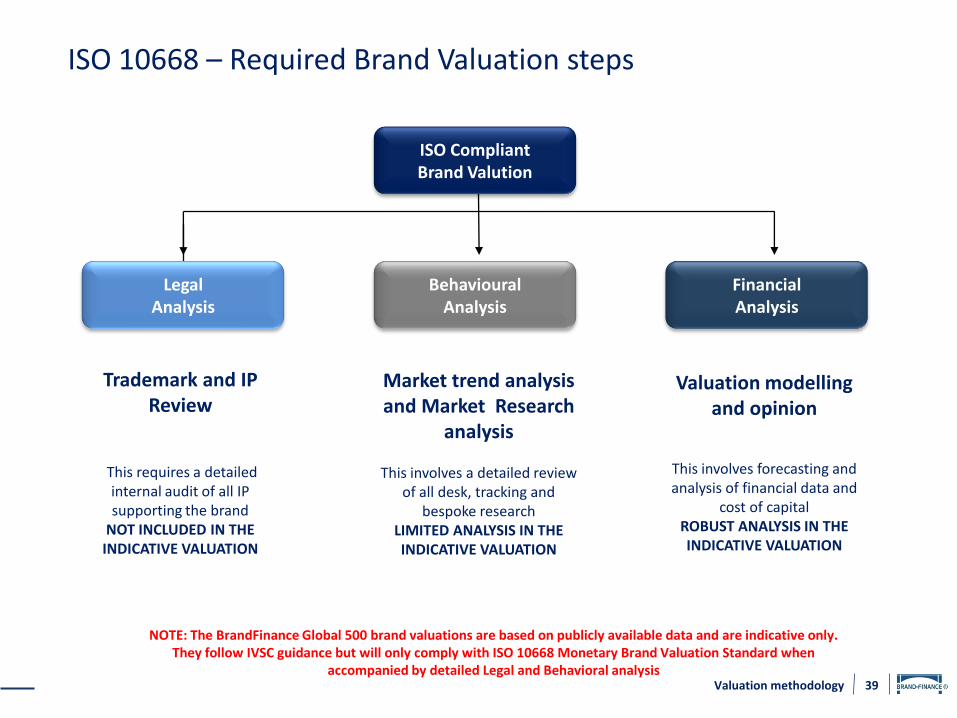
39Valuation methodology
ISO 10668 – Required Brand Valuation steps
Valuation modelling and opinion
This involves forecasting and analysis of financial data and
cost of capitalROBUST ANALYSIS IN THE INDICATIVE VALUATION
Market trend analysis and Market Research
analysis
This involves a detailed review of all desk, tracking and
bespoke researchLIMITED ANALYSIS IN THE INDICATIVE VALUATION
Trademark and IP Review
This requires a detailed internal audit of all IP supporting the brand
NOT INCLUDED IN THE INDICATIVE VALUATION
NOTE: The BrandFinance Global 500 brand valuations are based on publicly available data and are indicative only. They follow IVSC guidance but will only comply with ISO 10668 Monetary Brand Valuation Standard when
accompanied by detailed Legal and Behavioral analysis
ISO CompliantBrand Valution
Legal Analysis
BehaviouralAnalysis
FinancialAnalysis
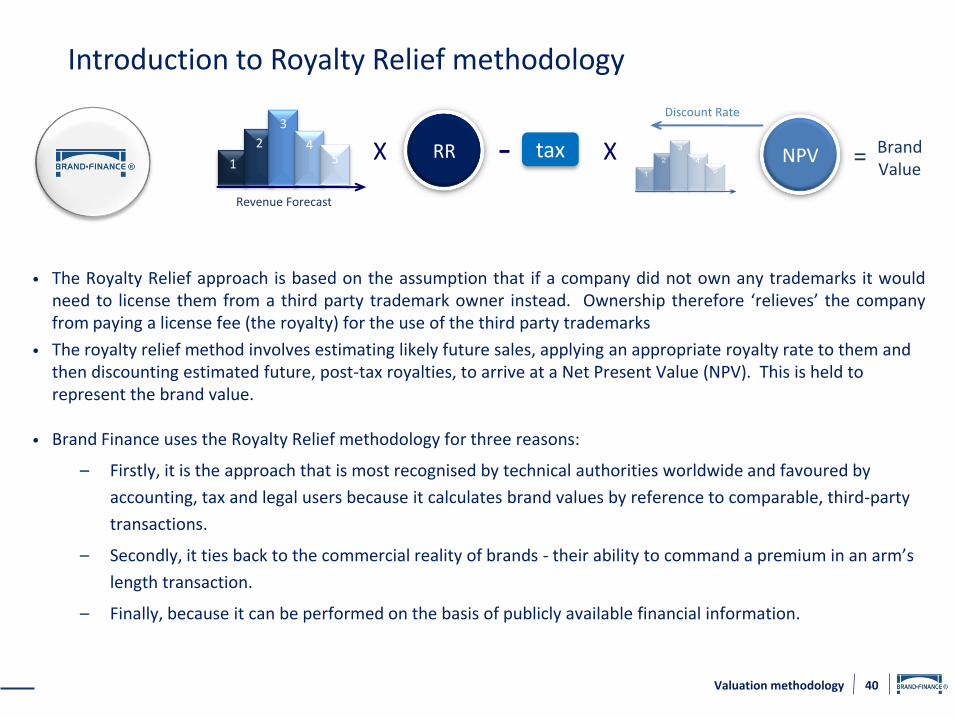
• The Royalty Relief approach is based on the assumption that if a company did not own any trademarks it wouldneed to license them from a third party trademark owner instead. Ownership therefore ‘relieves’ the companyfrom paying a license fee (the royalty) for the use of the third party trademarks
• The royalty relief method involves estimating likely future sales, applying an appropriate royalty rate to them and then discounting estimated future, post-tax royalties, to arrive at a Net Present Value (NPV). This is held to represent the brand value.
• Brand Finance uses the Royalty Relief methodology for three reasons:
– Firstly, it is the approach that is most recognised by technical authorities worldwide and favoured by
accounting, tax and legal users because it calculates brand values by reference to comparable, third-party
transactions.
– Secondly, it ties back to the commercial reality of brands - their ability to command a premium in an arm’s
length transaction.
– Finally, because it can be performed on the basis of publicly available financial information.
40Valuation methodology
Introduction to Royalty Relief methodology
X RR tax1
2
3
45
Revenue Forecast
- X
Discount Rate
NPV = Brand Value

1. Determine forecast revenuesDetermine future revenues attributable to the brand over a five year explicit forecast period. This is done by referencing historic trends, market growth estimates, competitive forces , analyst projections and company forecasts.
2. Assess the Brand Strength Determine the strength of the brand using the ßrandßeta® Index.
3. Establish Royalty Rate Review comparable licensing agreements. Analyse margins and value drivers. Establish average royalty rate range for relevant sector. Apply ßrandßeta® Index to royalty rate range to determine royalty rate for the brand.
4. Determine the Discount RateDetermine discount rate to calculate the net present value (‘NPV’) of future brand earnings (accounting for the time value of money and the associated risk).
5. Brand Valuation Calculation The NPV of post-tax royalties equals the brand value
Five Steps - Royalty Relief Valuation
Introduction to Royalty Relief methodology
X RR tax1
2
3
45
Revenue Forecast
- X
Discount Rate
NPV
41Valuation methodology
= Brand Value
Step 1 – Determine forecast revenue
42Valuation methodology
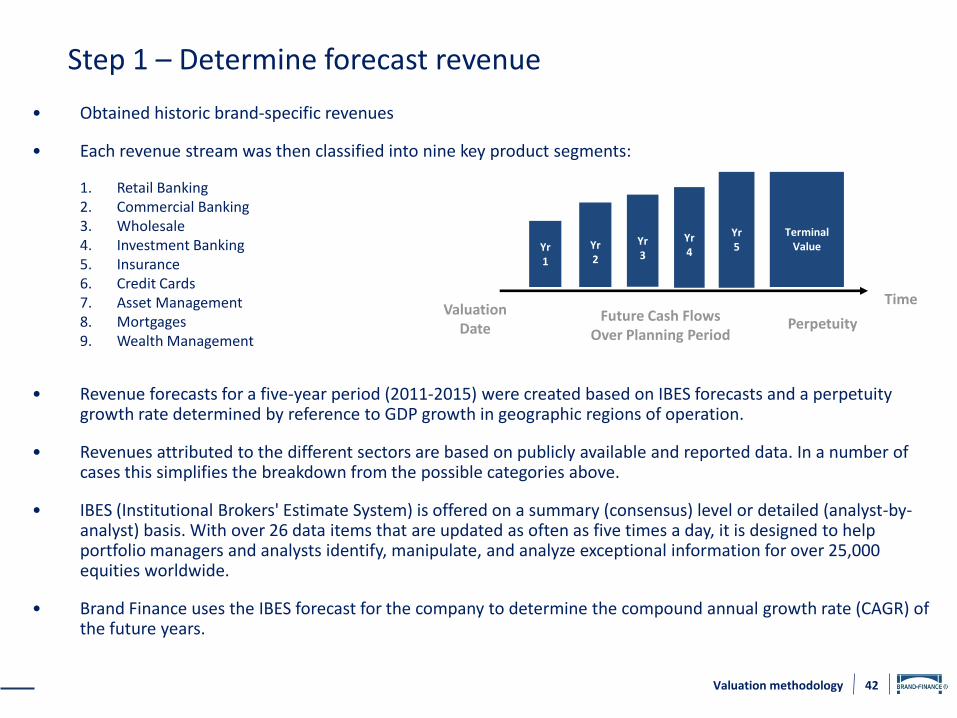
• Obtained historic brand-specific revenues
• Each revenue stream was then classified into nine key product segments:
1. Retail Banking2. Commercial Banking3. Wholesale4. Investment Banking5. Insurance 6. Credit Cards7. Asset Management8. Mortgages9. Wealth Management
• Revenue forecasts for a five-year period (2011-2015) were created based on IBES forecasts and a perpetuity growth rate determined by reference to GDP growth in geographic regions of operation.
• Revenues attributed to the different sectors are based on publicly available and reported data. In a number of cases this simplifies the breakdown from the possible categories above.
• IBES (Institutional Brokers' Estimate System) is offered on a summary (consensus) level or detailed (analyst-by-analyst) basis. With over 26 data items that are updated as often as five times a day, it is designed to help portfolio managers and analysts identify, manipulate, and analyze exceptional information for over 25,000 equities worldwide.
• Brand Finance uses the IBES forecast for the company to determine the compound annual growth rate (CAGR) of the future years.
ValuationDate
Future Cash FlowsOver Planning Period
Perpetuity
Time
Yr4
Yr2
Yr3
TerminalValueYr
1
Yr5
43Valuation methodology
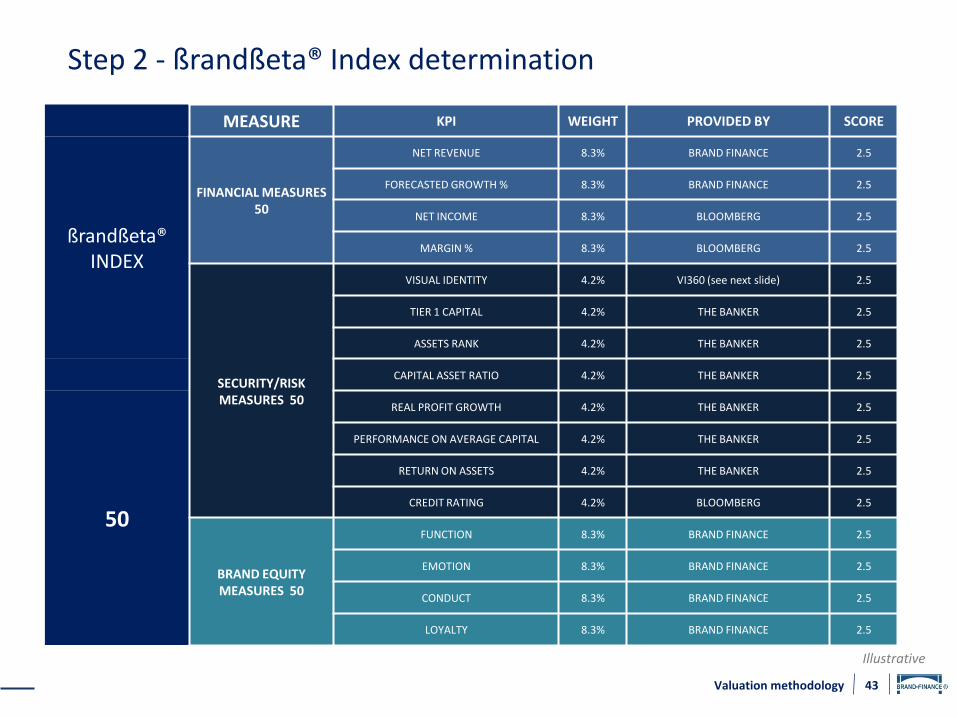
Step 2 - ßrandßeta® Index determination
MEASURE KPI WEIGHT PROVIDED BY SCORE
ßrandßeta® INDEX
FINANCIAL MEASURES 50
NET REVENUE 8.3% BRAND FINANCE 2.5
FORECASTED GROWTH % 8.3% BRAND FINANCE 2.5
NET INCOME 8.3% BLOOMBERG 2.5
MARGIN % 8.3% BLOOMBERG 2.5
SECURITY/RISK MEASURES 50
VISUAL IDENTITY 4.2% VI360 (see next slide) 2.5
TIER 1 CAPITAL 4.2% THE BANKER 2.5
ASSETS RANK 4.2% THE BANKER 2.5
CAPITAL ASSET RATIO 4.2% THE BANKER 2.5
50
REAL PROFIT GROWTH 4.2% THE BANKER 2.5
PERFORMANCE ON AVERAGE CAPITAL 4.2% THE BANKER 2.5
RETURN ON ASSETS 4.2% THE BANKER 2.5
CREDIT RATING 4.2% BLOOMBERG 2.5
BRAND EQUITY MEASURES 50
FUNCTION 8.3% BRAND FINANCE 2.5
EMOTION 8.3% BRAND FINANCE 2.5
CONDUCT 8.3% BRAND FINANCE 2.5
LOYALTY 8.3% BRAND FINANCE 2.5
Illustrative
44Valuation methodology
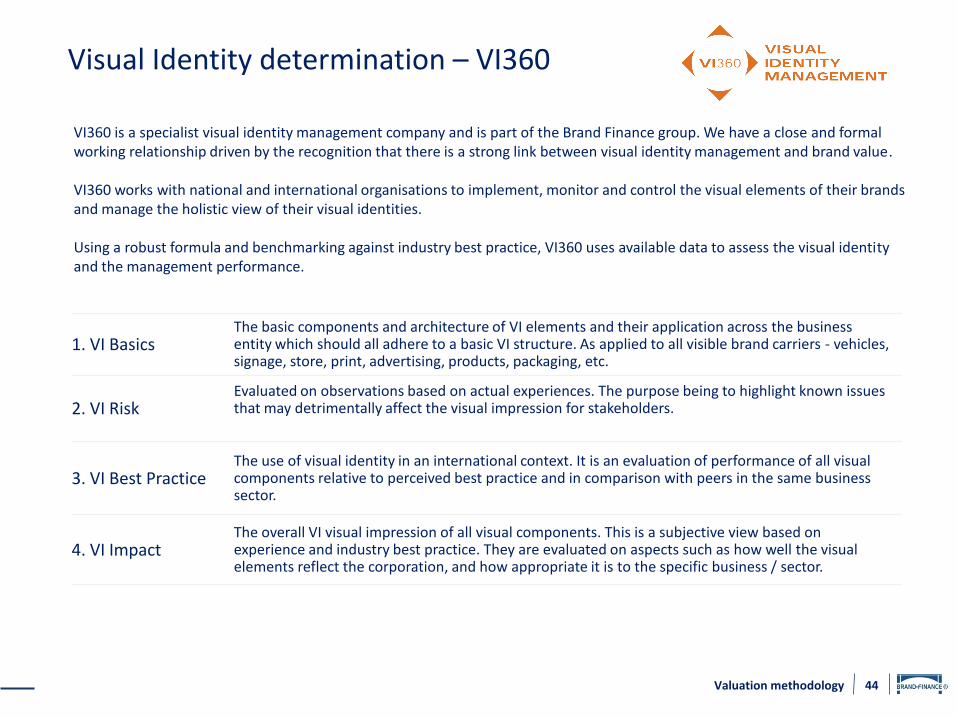
Visual Identity determination – VI360
1. VI BasicsThe basic components and architecture of VI elements and their application across the business entity which should all adhere to a basic VI structure. As applied to all visible brand carriers - vehicles, signage, store, print, advertising, products, packaging, etc.
2. VI Risk Evaluated on observations based on actual experiences. The purpose being to highlight known issues that may detrimentally affect the visual impression for stakeholders.
3. VI Best PracticeThe use of visual identity in an international context. It is an evaluation of performance of all visual components relative to perceived best practice and in comparison with peers in the same business sector.
4. VI ImpactThe overall VI visual impression of all visual components. This is a subjective view based on experience and industry best practice. They are evaluated on aspects such as how well the visual elements reflect the corporation, and how appropriate it is to the specific business / sector.
VI360 is a specialist visual identity management company and is part of the Brand Finance group. We have a close and formal working relationship driven by the recognition that there is a strong link between visual identity management and brand value.
VI360 works with national and international organisations to implement, monitor and control the visual elements of their brands and manage the holistic view of their visual identities.
Using a robust formula and benchmarking against industry best practice, VI360 uses available data to assess the visual identity and the management performance.
45Valuation methodology
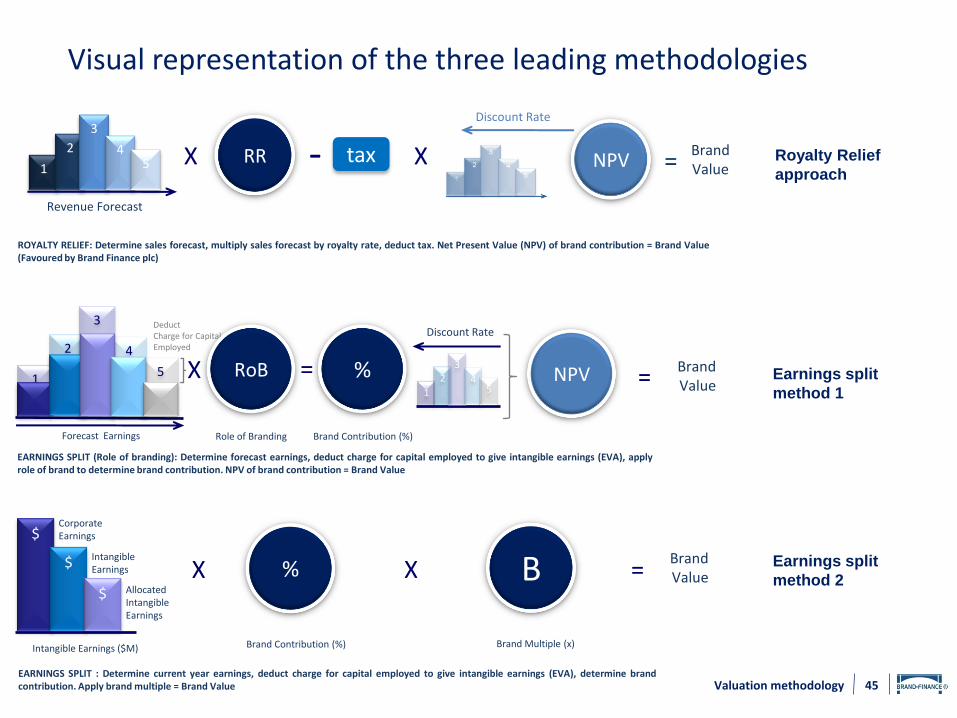
ROYALTY RELIEF: Determine sales forecast, multiply sales forecast by royalty rate, deduct tax. Net Present Value (NPV) of brand contribution = Brand Value(Favoured by Brand Finance plc)
EARNINGS SPLIT (Role of branding): Determine forecast earnings, deduct charge for capital employed to give intangible earnings (EVA), applyrole of brand to determine brand contribution. NPV of brand contribution = Brand Value
3
Forecast Earnings Brand Contribution (%)Role of Branding
Deduct Charge for Capital Employed
1
2 4
5 RoBX = % NPV =Brand Value
1
2
3
45
Discount Rate
X RR tax1
2
3
45
Revenue Forecast
- X
Discount Rate
NPV =Brand Value
Visual representation of the three leading methodologies
X
$
$
$
Corporate Earnings
Intangible Earnings
AllocatedIntangible Earnings
% BX =Brand Value
Intangible Earnings ($M) Brand Contribution (%) Brand Multiple (x)
EARNINGS SPLIT : Determine current year earnings, deduct charge for capital employed to give intangible earnings (EVA), determine brandcontribution. Apply brand multiple = Brand Value
Earnings split
method 1
Earnings split
method 2
Royalty Relief
approach
46Valuation methodology
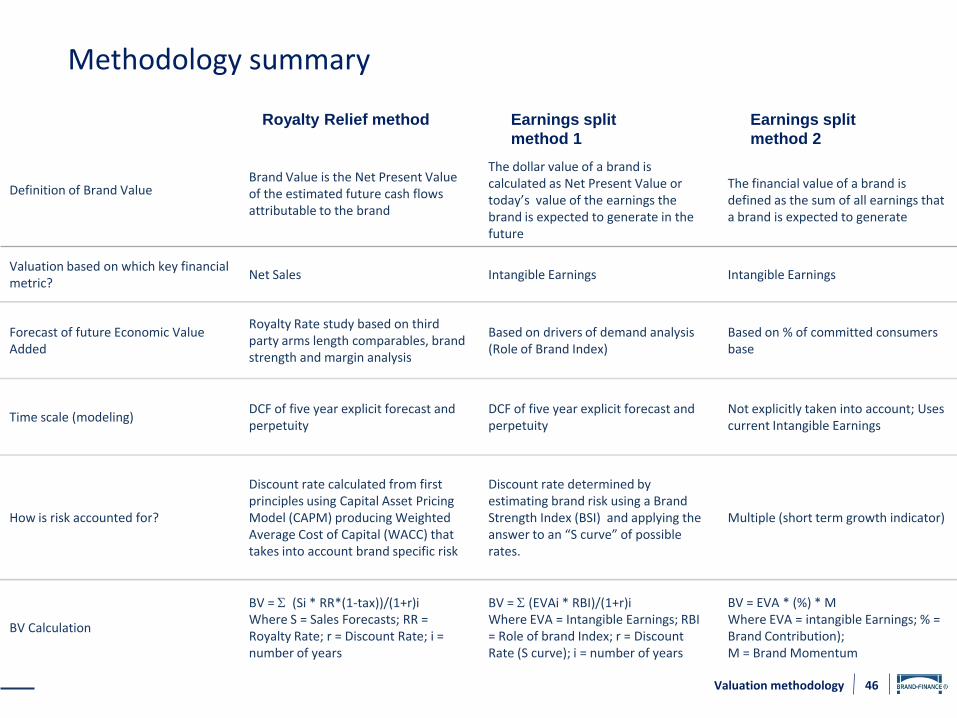
Definition of Brand ValueBrand Value is the Net Present Value of the estimated future cash flows attributable to the brand
The dollar value of a brand is calculated as Net Present Value or today’s value of the earnings the brand is expected to generate in the future
The financial value of a brand is defined as the sum of all earnings that a brand is expected to generate
Valuation based on which key financial metric?
Net Sales Intangible Earnings Intangible Earnings
Forecast of future Economic Value Added
Royalty Rate study based on third party arms length comparables, brand strength and margin analysis
Based on drivers of demand analysis (Role of Brand Index)
Based on % of committed consumers base
Time scale (modeling)DCF of five year explicit forecast and perpetuity
DCF of five year explicit forecast and perpetuity
Not explicitly taken into account; Uses current Intangible Earnings
How is risk accounted for?
Discount rate calculated from first principles using Capital Asset Pricing Model (CAPM) producing Weighted Average Cost of Capital (WACC) that takes into account brand specific risk
Discount rate determined by estimating brand risk using a Brand Strength Index (BSI) and applying the answer to an “S curve” of possible rates.
Multiple (short term growth indicator)
BV Calculation
BV = (Si * RR*(1-tax))/(1+r)iWhere S = Sales Forecasts; RR = Royalty Rate; r = Discount Rate; i = number of years
BV = (EVAi * RBI)/(1+r)iWhere EVA = Intangible Earnings; RBI = Role of brand Index; r = Discount Rate (S curve); i = number of years
BV = EVA * (%) * MWhere EVA = intangible Earnings; % = Brand Contribution); M = Brand Momentum
Methodology summary
Earnings split
method 1
Earnings split
method 2
Royalty Relief method
47Valuation methodology
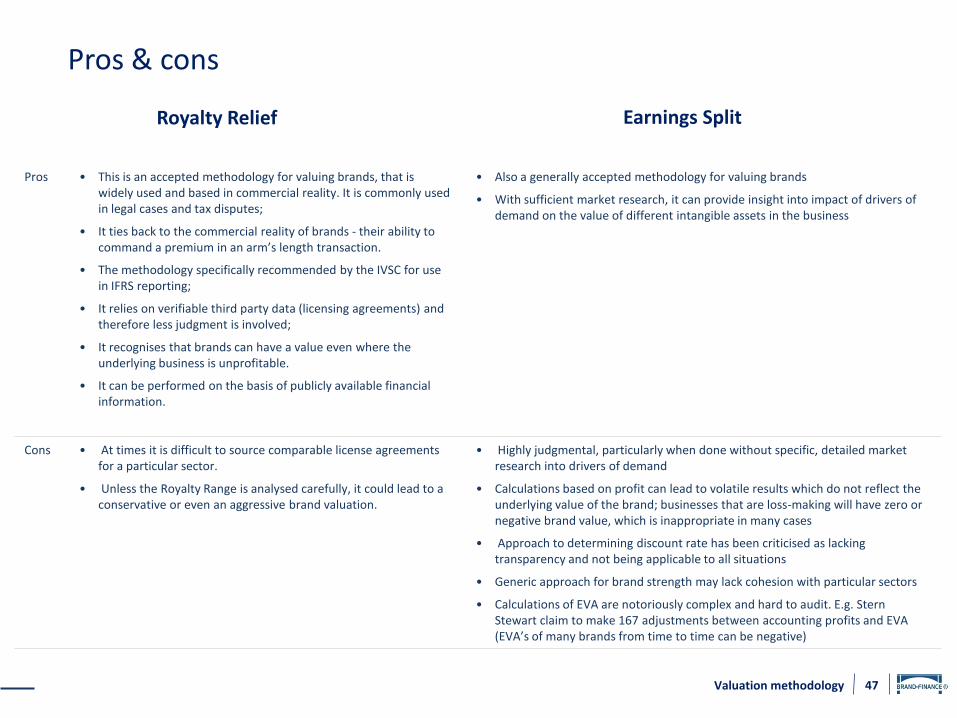
Pros & cons
Pros • This is an accepted methodology for valuing brands, that is widely used and based in commercial reality. It is commonly used in legal cases and tax disputes;
• It ties back to the commercial reality of brands - their ability to command a premium in an arm’s length transaction.
• The methodology specifically recommended by the IVSC for use in IFRS reporting;
• It relies on verifiable third party data (licensing agreements) and therefore less judgment is involved;
• It recognises that brands can have a value even where the underlying business is unprofitable.
• It can be performed on the basis of publicly available financial information.
• Also a generally accepted methodology for valuing brands
• With sufficient market research, it can provide insight into impact of drivers of demand on the value of different intangible assets in the business
Cons • At times it is difficult to source comparable license agreements for a particular sector.
• Unless the Royalty Range is analysed carefully, it could lead to a conservative or even an aggressive brand valuation.
• Highly judgmental, particularly when done without specific, detailed market research into drivers of demand
• Calculations based on profit can lead to volatile results which do not reflect the underlying value of the brand; businesses that are loss-making will have zero or negative brand value, which is inappropriate in many cases
• Approach to determining discount rate has been criticised as lacking transparency and not being applicable to all situations
• Generic approach for brand strength may lack cohesion with particular sectors
• Calculations of EVA are notoriously complex and hard to audit. E.g. Stern Stewart claim to make 167 adjustments between accounting profits and EVA (EVA’s of many brands from time to time can be negative)
Earnings SplitRoyalty Relief
Further details of methodology excluded from sample report
48Valuation methodology

sectiononeappendixtwo
2011 BrandFinance® Global Intangibles Financial Tracker

BrandFinance® Global Intangibles Financial Tracker 2011
(GIFT™ 2011)
Annual review of global intangible value: Banks and Diversified Financial Services
BrandFinance® GIFT 2011 50
- 500 1,000 1,500 2,000
United States
China
Britain
Japan
Brazil
Canada
Australia
France
Spain
Switzerland
$USD billion
Tangible Net Assets
Disclosed Intangible Assets (ex g/w)
Disclosed Goodwilll
Undisclosed Value
-20% 0% 20% 40% 60% 80% 100% 120%
United States
China
Britain
Japan
Brazil
Canada
Australia
France
Spain
Switzerland
Tangible Net Assets
Disclosed Intangible Assets (ex g/w)
Disclosed Goodwilll
Undisclosed Value
Global Banks % DFS Enterprise Value Breakdown by Country

Excluded from sample report
Included in full reportFurther analysis taken from GIFT 2011
51BrandFinance® GIFT 2011

sectiononeappendixthree
Additional Materials

Additional Materials
53Brand Rating Certificate
In addition to the Detailed Brand ValuationSummary, the company will receive:
• A signed certificate which states its brandrating, brand value and rank within theBanking 500 (pictured)
• An electronic copy of the ISO 10668 BrandValuation Standard
54Disclaimer
Disclaimer
Brand Finance has produced this study with an independent and unbiased analysis. The values derived and opinions produced in thisstudy are based only on publicly available information and certain assumptions that Brand Finance used where such data wasdeficient or unclear. No independent verification or audit of such materials was undertaken. Brand Finance accepts no responsibilityand will not be liable in the event that the publicly available information relied upon is subsequently found to be inaccurate.The conclusions expressed are the opinions of Brand Finance and are not intended to be warranties or guarantees that a particularvalue or projection can be achieved in any transaction. The opinions expressed in the report are not to be construed as providinginvestment advice. Brand Finance does not intend the report to be relied upon for technical reasons and excludes all liability to anyorganisation.

55
Brand Finance plc (London) is the world’s leading independent brand valuation consultancy. We have a global footprint with offices in more than 20 countries. For more information please refer to our website: www.brandfinance.com