board of regents strategic goals 07-30-2015
TRANSCRIPT

The Leader of the All business and personal presentation template ever

STRATEGIC DIRECTIONS AND GOALS OVERVIEWUtah System of Higher Education
DAVID L. BUHLER, COMMISSIONER
July 30, 2015

DAVID L. BUHLER, COMMISSIONER
July 30, 2015
Utah’s Eight Public Colleges and Universities

UNIVERSITY OF UTAH (Flagship), UTAH STATE UNIVERSITY (Land Grant, Regional Campuses)Research Universities

WEBER STATE, SOUTHERN UTAH (Arts & Sciences), DIXIE STATE, UTAH VALLEYRegional Universities

SNOW COLLEGE, SALT LAKE COMMUNITY COLLEGECommunity Colleges

7
Utah System of Higher Education
USHE Students
Of Utah high school graduates who enroll in college, attend a USHE institution.
Students in Fall 2014 (headcount)
8 out of 10
167,317
New freshmen in Fall 201421,152
Utah high school students enroll in college within 3 years of graduation
6 out of 10
25% of all students are enrolled in an all-online course
1 in 4

of Higher Education in UtahThe Return on Investment

9
Utah System of Higher Education
The ROI – to Utahns
*Unemployment and Poverty rates for Graduate or Professional Degree are USHE estimates.Source: USHE, US Census (American Communities Survey), Department of Workforce Services, 2013.
Less
Tha
n Hig
h Sc
hool
High
Scho
ol
Som
e Col
lege
or A
ssoc
iate
Deg
ree
Bache
lor's
Deg
ree
Gradu
ate
or P
rofe
ssio
nal D
egre
e*0.0%
5.0%
10.0%
15.0%
20.0%
25.0%
30.0%
$0$10,000$20,000$30,000$40,000$50,000$60,000$70,000
$22,290$27,868 $31,843
$44,668
$61,774
4.2% 4.3%2.4% 2.2%
1.8%
24%
12%8%
5%2%
Median Wages Unemployment Poverty

10
Utah System of Higher Education
The Growing ROI Difference
Source: Pew Research Center, February 2014. “The Rising Cost of Not Going to College” (http://www.pewsocialtrends.org/2014/02/11/the-rising-cost-of-not-going-to-college/)
1965 1979 1986 1995 2013
$7,499
$9,690
$14,245 $15,780
$17,500
A college graduate (bachelor’s) will earn $830,000 more over a lifetime than
someone with only a high school diploma.
Difference in median annual earnings of college and high school graduates ages 25 to 32 in U.S. (in 2012 dollars)

11
Utah System of Higher Education
12%
40%
48%
34%38%
28%
Taxes Paid
The ROI – to the State
Utah Population (25 & over) by education level & state tax contribution

For Higher Education in UtahState Support and Tuition
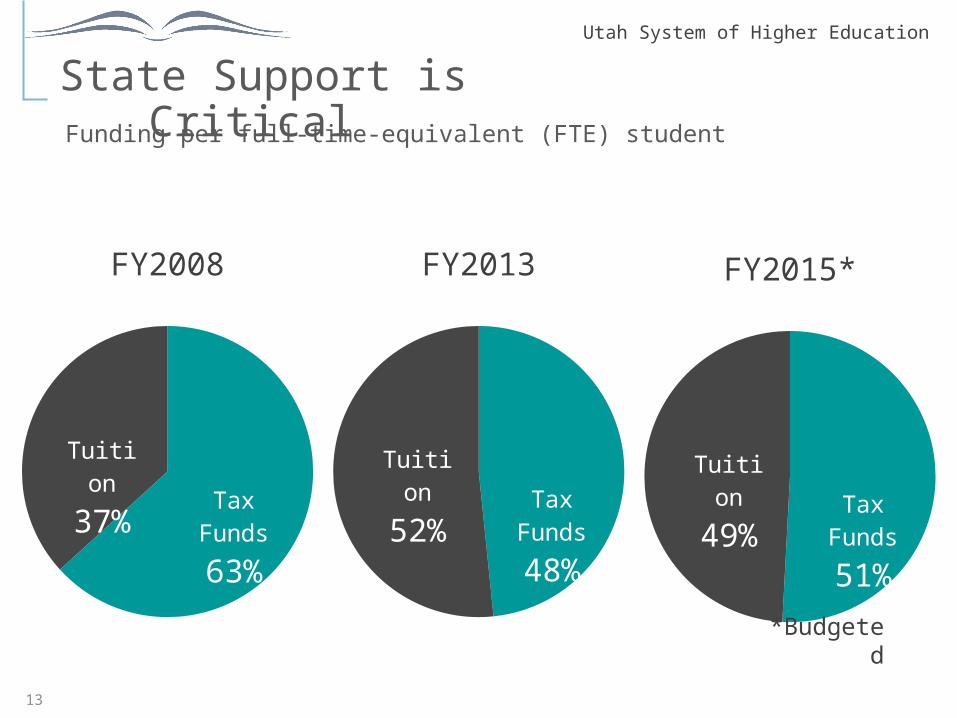
13
Utah System of Higher Education
FY2008
Tax Funds
63%
Tu-ition
37%
FY2013
Tax Funds
48%
Tu-ition
52%
FY2015*
Tax Funds
51%
Tu-ition
49%
*Budgeted
State Support is Critical Funding per full-time-equivalent (FTE) student

14
Utah System of Higher Education
$400,000,000
$500,000,000
$600,000,000
$700,000,000
$800,000,000
$900,000,000
$734,779,000
$831,952,000
$809,710,000
Current Dollars Constant Dollars (2015)
Utah State Tax Funding to Higher Education

15
Utah System of Higher Education
Higher Education in Utah is Efficient
Utah is 2nd most efficient per $100,000 spent
Credentials & Degrees Awarded per $100,000 of Education & Related Expenditures

16
Utah System of Higher Education
Tuition and Fees
Utah is 3rd lowest tuition for 4-year public institutionsCollege Board (http://trends.collegeboard.org/sites/default/files/college-pricing-2014-full-report.pdf)

Of Higher Education in UtahThe Growing Student Population
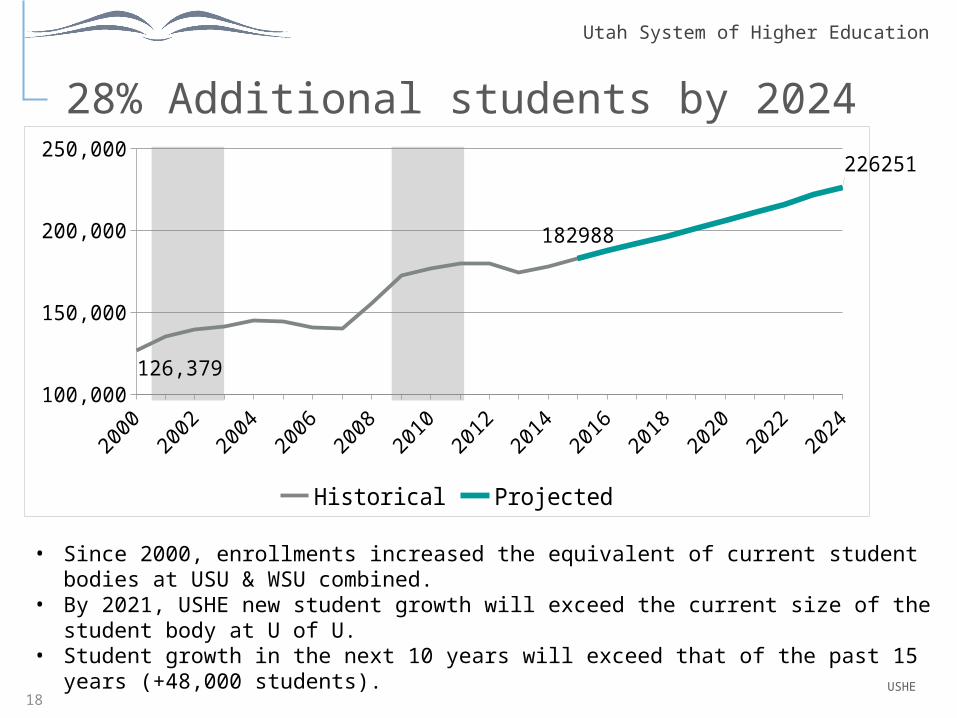
18
Utah System of Higher Education
100,000
150,000
200,000
250,000
126,379
182988
226251
Historical Projected
• Since 2000, enrollments increased the equivalent of current student bodies at USU & WSU combined.
• By 2021, USHE new student growth will exceed the current size of the student body at U of U.
• Student growth in the next 10 years will exceed that of the past 15 years (+48,000 students).
28% Additional students by 2024
USHE

19
Utah System of Higher Education
Outpacing the U.S.
Projected (2010-2021)
+15%
+23%National data: National Center for Education Statistics – Projections of Education Statistics to 2021 (http://nces.ed.gov/pubs2013/2013008.pdf)
Utah: USHE
Historical (1996-2010)+46
%+52%

Utah System of Higher Education
Limited Capacity
20
Academic Infrastruct
ure• Sufficient personnel and faculty to maintain degree quality
• Higher Education competes nationally for quality talent
Physical Infrastruct
ure• Enrollment increases further constrain space
• Significant utilities infrastructure
• Challenge of deferred maintenance
Virtual Infrastruct
ure• Keeping pace with rapid pace of technological change
• Online, “flipped” classrooms, open source, etc.
• Helps with capacity, still carries a cost

of Higher Education students in UtahPreparation, Participation and Completion

22
Utah System of Higher Education
College Participation Rates of Utah H.S. Graduates1st Year After High School, by Gender
USOE/USHE
2007 2008 2009 2010 2011 20120%
10%
20%
30%
40%
50%
60%
70%
80%
90%
100%
58% 55%
43% 42%FemaleMale
Participation rate of females and males increases to 70% after 7 years.
23
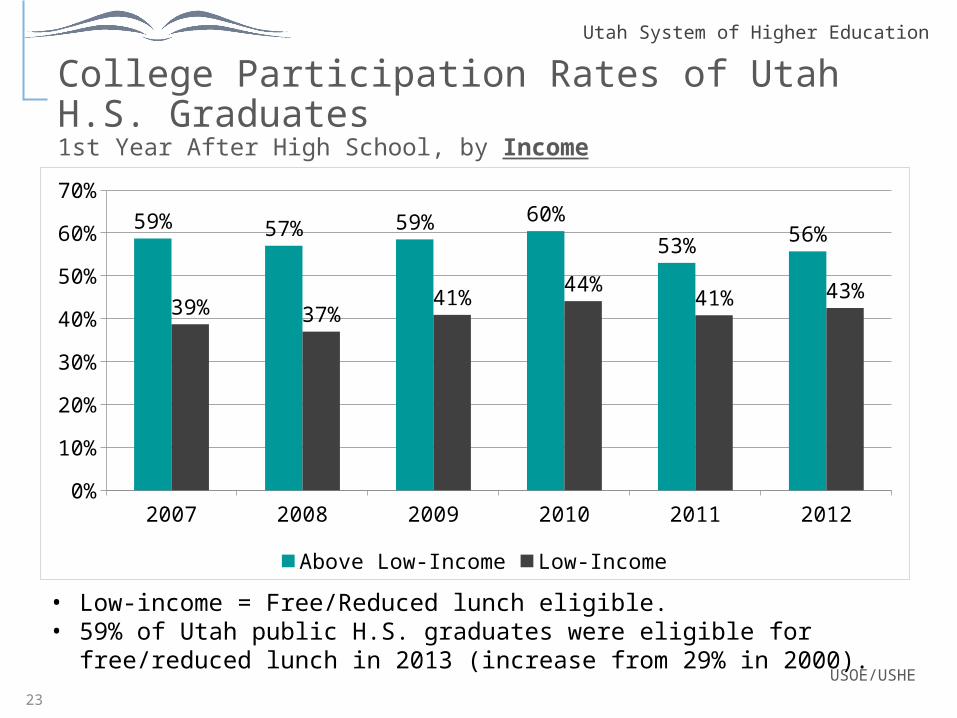
Utah System of Higher Education
College Participation Rates of Utah H.S. Graduates1st Year After High School, by Income
USOE/USHE
2007 2008 2009 2010 2011 20120%
10%
20%
30%
40%
50%
60%
70%
59% 57% 59% 60%
53% 56%
39% 37%41%
44%41% 43%
Above Low-Income Low-Income
• Low-income = Free/Reduced lunch eligible. • 59% of Utah public H.S. graduates were eligible for free/reduced
lunch in 2013 (increase from 29% in 2000).

Utah System of Higher Education
Some college, no degree
Less than high school graduate
High school graduate (includes equivalency)
Some college, no degree
Associate's degree
Bachelor's degree
Graduate or professional degree
0% 10% 20% 30%
9.2%
23.6%
27.6%
9.4%
20.3%
9.9%
Utah ranks 2nd in the nation with the % of adults ages 25-64 with “some college, no degree”.
Utah’s Educational Attainment – 25 yrs. And older
American Communities Survey, 2009-2013Lumina Foundation, A Stronger Nation Through Higher Education

25
Utah System of Higher Education
A More Diverse Nation and StateMinority Share of the Population in Utah and the U.S.
Census Bureau, Perlich (2002), BEBR
1960 20120%
5%
10%
15%
20%
25%
30%
35%
40%
1.9%
20.0%
11.4%
37.0%
Utah U.S.

26
Utah System of Higher Education
Completions (4 year degrees)
63% (6 yr) 39% (6 yr)
51% (8 yr)
National data: National Student Clearinghouse Research Center (http://nscresearchcenter.org/signaturereport4/)http://nscresearchcenter.org/signaturereport6-statesupplement/
USHE
27
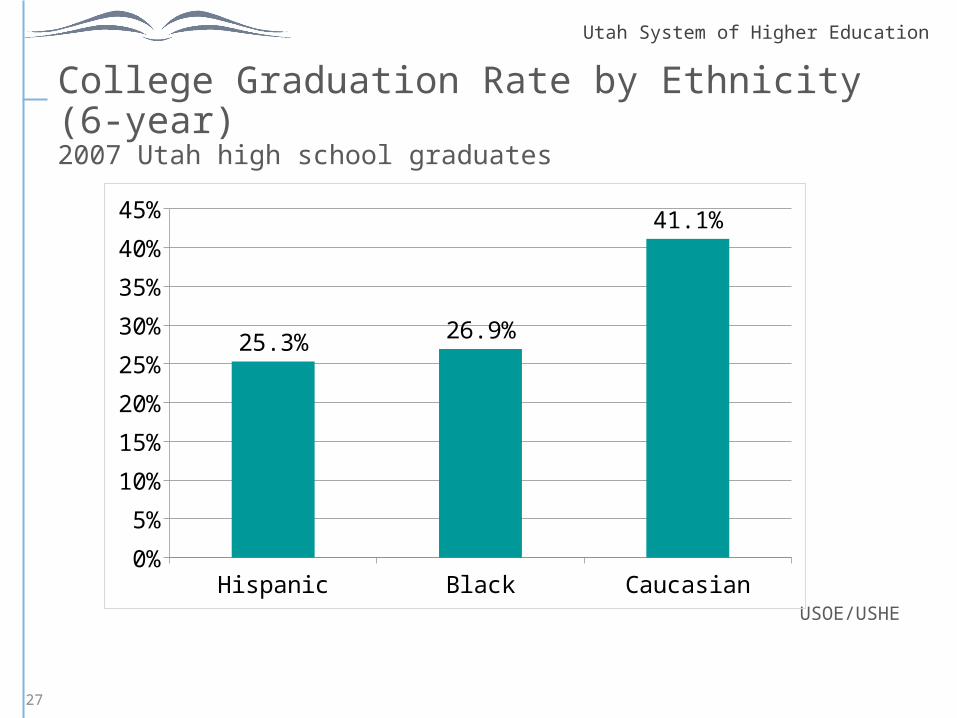
Utah System of Higher Education
College Graduation Rate by Ethnicity (6-year)2007 Utah high school graduates
USOE/USHEHispanic Black Caucasian
0%
5%
10%
15%
20%
25%
30%
35%
40%
45%
25.3% 26.9%
41.1%

in Higher Education in UtahUtilization of Technology

Utah System of Higher Education
Online courses and degrees
• 81 degrees available entirely online.
• 1 in 4 students take an online-only course.
• Utilization of online courses has grown more than 5 fold since 2011.
Despite availability of online courses/degrees, students prefer using online courses to augment a traditional on-campus schedule.
But…• More than 85% of students who enroll in online courses
take a majority of their courses on-campus.
• Less than 3% of full-time students are enrolled totally online
• Most “100%” online students are part-time, over 25 yrs old.

Utah System of Higher Education
available entirely online81 Certificates and Degrees
CertificatesAASAssociateBachelor’sMasters PhD LicensureMinor
18 8 10 20 19 3 2 2

31
Utah System of Higher Education
Hybrid/Blended Course Headcount(split in-class and online experience)
424 972
3,679
9,263
2011
2012
2013
2014

for Higher Education in UtahConclusions and Challenges
33
Utah System of Higher Education
Conclusions
• Economic & social benefits of higher education continue to grow in post-recession economy.
• State support has helped keep Utah one of the most affordable.
• Technology is critical, need to increase utilization.
Challenges
• Continued capacity challenges with projected growth.
• More diverse but persistent achievement gap.
• College readiness an issue.
• Completion needs continued focus.

for Higher Education in UtahStrategic Directions
Adopted by the Board of Regents in January 2015
Utah System of Higher Education
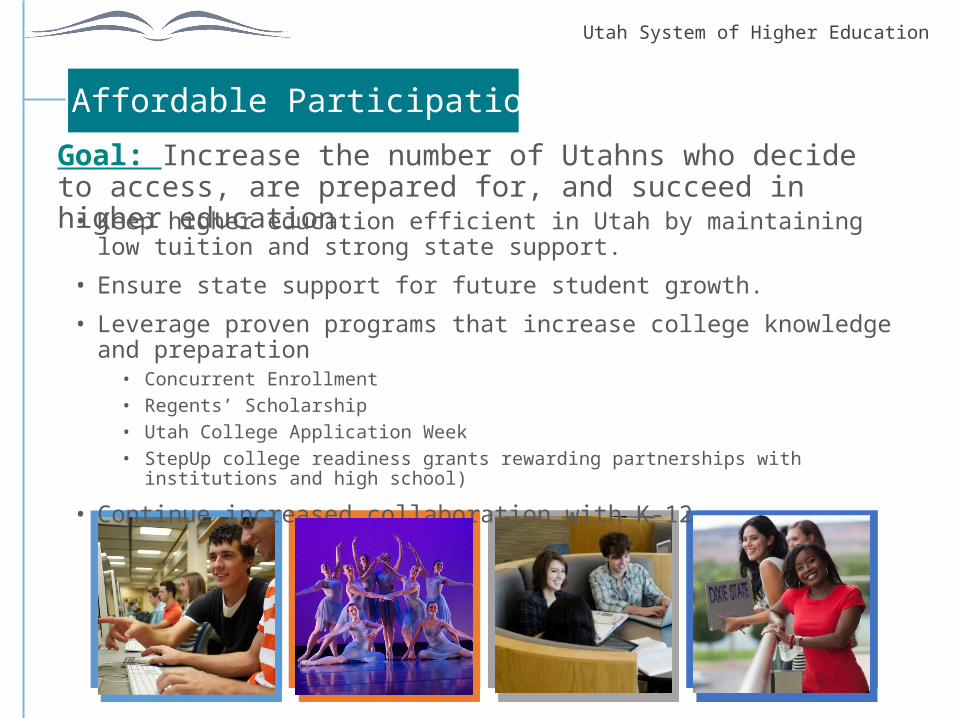
Affordable ParticipationGoal: Increase the number of Utahns who decide to access, are prepared for, and succeed in higher education.• Keep higher education efficient in Utah by maintaining low tuition
and strong state support.
• Ensure state support for future student growth.
• Leverage proven programs that increase college knowledge and preparation• Concurrent Enrollment• Regents’ Scholarship• Utah College Application Week• StepUp college readiness grants rewarding partnerships with institutions and high
school)
• Continue increased collaboration with K-12

Utah System of Higher Education
Goal: Increase the percentage of students who persist and graduate, using USHE institution performance relative to 66by2020 graduation targets.
Timely Completion
• Improve data sharing and reporting to inform parents and students• Wage and industry employment information of USHE
graduates (higheredutah.org)• First-ever high school feedback report – October 2015
• Continued focus on Regents’ Completion Initiative

Utah System of Higher Education
Completion Initiative Overview
15-to-FinishIncrease the percentage of students taking 15 credit hours/semester or 30 credits/year, to help students maximize their dollars and time.
Degree MapsCreate semester-by-semester degree program maps with specific recommended courses each semester.
Plateau TuitionSet plateau tuition levels, focusing on 12-15 credits.
First-year mathIncrease the number of students successfully completing math within the first year through class or prior credit (AP, concurrent enrollment, etc).
3
2
4
5 Reverse Transfer/Stackable CredentialsExplore the feasibility of implementing reverse transfer and stackable credentials USHE-wide.
1
Adopted by the Board of Regents(July 2013)

Utah System of Higher Education
Goal: Encourage innovation as a core value at each USHE institution, in keeping with its distinct mission. USHE is a “knowledge enterprise,” engaged in the creation and dissemination of knowledge.
Innovative Discovery
• Strengthen missions of institutions
• Ensure economic development priorities of state harness potential of research institutions
• Continued research in higher ed helps students in today’s knowledge economy.
• expansion of STEM and high demand programs to meet growing industry demand• Most popular job in Utah (according to US Census)
• 1978-2012: Truck Driver• 2014: Software Developer

Utah System of Higher Education
Guiding objectives for development of a long-range higher education strategic plan during 2015.
In support of Governor’s 10-year education plan.
Previous strategic plans:
• 2010
• 1999
Long-Range Plan
Affordable Participation
Timely Completion
Innovative Discovery
Utah System of Higher Education
Thank you for your support and leadership
40

Utah System of Higher Education
Schedule
41
1:15 – 2:15 PM WORKSHOPS 1 & 2• Workshop 1 (Yankee Meadows):
Student Debt & Impact of Pell Grants – Dave Feitz, Executive Director, UHEAA• Workshop 2 (Vermillion Cliffs):
• USHE’s Role in Career and Technical Education – Dr. Blair Carruth, Asst. Commissioner for Academic Affairs
2:30 – 3:30 PM WORKSHOPS 3 & 4Workshop 3 (Yankee Meadows):
Capital Facility Process and Needs – Dr. Greg Stauffer, Associate Commissioner for Planning, Finance and Facilities
Workshop 4 (Vermillion Cliffs):Helping Concurrent Enrollment Contribute to Student Success – Dr. Elizabeth Hitch, Associate Commissioner for Academic Affairs
5:30 – 7:30 PM DINNER FOR REGENTS & TRUSTEESHunter Conference Center Patio

The Leader of the All business and personal presentation template ever