bitcoin awareness and usage in canada: an update · the 2017 survey took place in an interesting...
TRANSCRIPT

Bank of Canada staff analytical notes are short articles that focus on topical issues relevant to the current economic and financial context, produced independently from the Bank’s Governing Council. This work may support or challenge prevailing policy orthodoxy. Therefore, the views expressed in this note are solely those of the authors and may differ from official Bank of Canada views. No responsibility for them should be attributed to the Bank.
www.bank-banque-canada.ca
Staff Analytical Note/Note analytique du personnel 2018-23
Bitcoin Awareness and Usage in Canada: An Update
by Christopher S. Henry, Kim P. Huynh and Gradon Nicholls
Currency Department Bank of Canada Ottawa, Ontario, Canada K1A 0G9 [email protected] [email protected] [email protected]

ISSN 2369-9639 © 2018 Bank of Canada
Acknowledgements
We thank Shelley Edwards for her tireless efforts in improving the Bitcoin Omnibus Survey. We are grateful to Ben Fung, Scott Hendry, Rod Garratt, Maarten van Oordt, Alex Shcherbakov, and various participants of seminars and workshops for providing comments. The views expressed in this paper are those of the authors. No responsibility for them should be attributed to the Bank of Canada. All remaining errors are the responsibility of the authors.
ii
Abstract
This note provides an update of the results of the 2017 Bitcoin Omnibus Survey (BTCOS) conducted by the Bank of Canada from December 12 to 15, 2017. The BTCOS was previously conducted in November and December 2016 and the results were reported in Henry et al. (2017, forthcoming). The 2017 survey took place in an interesting time, as Bitcoin prices were increasing and reached an all-time high on December 17, 2017. During this period, the level of awareness of Bitcoin increased from 64 per cent in the 2016 BTCOS to 85 per cent in the 2017 BTCOS, while ownership rose from 2.9 to 5.0 per cent, respectively. The main reason cited by survey participants for owning Bitcoin changed from transactional purposes in 2016 to investment purposes in 2017. Further, only about half of Bitcoin owners were found to regularly use Bitcoin to buy goods or services or to send money to other people. Bank topics: Bank notes; Digital currencies; Econometric and statistical methods JEL codes: E4, C12
Résumé
Cette note analytique fait état des résultats de l’enquête-omnibus de 2017 sur le bitcoin (EOB) menée par la Banque du Canada du 12 au 15 décembre 2017. L’enquête EOB précédente s’est déroulée en novembre et en décembre 2016, et ses résultats sont présentés dans une étude de Henry et autres (2017, à paraître). L’enquête de 2017 a été réalisée dans un contexte particulier, à un moment où les prix du bitcoin se sont envolés pour atteindre un niveau record, le 17 décembre 2017. Durant cette période, 85 % des répondants ont dit avoir entendu parler du bitcoin (contre 64 % en 2016) et 5 % (2,9 % en 2016), en détenir. Selon les personnes interrogées, les bitcoins ne sont plus tant détenus pour des motifs transactionnels, comme c’était le cas dans l’enquête de 2016, que comme instrument de placement. En outre, seulement la moitié environ des détenteurs de bitcoins en utilisent régulièrement pour acquérir des biens ou des services ou pour transférer des fonds. Sujets : Billets de banque; Monnaies numériques; Méthodes économétriques et statistiques Codes JEL : E4, C12

1 Introduction
In 2017, the price of Bitcoin rose from about US$1,000 in early January to an all-time high
of US$19,738.21 on December 17.1 Despite the large run-up in prices, the daily volume of
Bitcoin transactions increased by only 32 per cent during this period, from an average of
about 280,000 transactions per day in January to 360,000 transactions per day in December
(Figure 1).2 Increasing prices resulted in a heightened interest in Bitcoin, as evidenced by
Google Trends, where Bitcoin was ranked the second-most searched term in the “Global
News” category.3 The natural question that arises is whether Bitcoin is a currency or an
investment vehicle. Many central banks and pundits offered warnings of Bitcoin, including
Bank of Canada Governor Stephen S. Poloz, who offered the following cautionary advice:
“Actually, there is one more thing keeping me awake at night, which perhaps
I should mention, and that is all the noise I keep hearing about cryptocurrencies,
especially Bitcoin. There is a lot of hype around Bitcoin, and markets are evolv-
ing quickly to allow wider access, including to retail investors. So perhaps you
will allow me to make a couple of points. To begin with basics, the term ‘cryp-
tocurrency’ is a misnomer—‘crypto,’ yes, but ‘currency,’ no. For something to be
considered a currency, it must act as a reliable store of value, and you should be
able to spend it easily. These instruments possess neither of these characteristics,
so they do not constitute ‘money.’ ”
Governor Stephen S. Poloz, December 14, 20174
To assist in monitoring developments in the adoption and usage of Bitcoin, the Bank of
Canada conducted a survey called the Bitcoin Omnibus Survey (BTCOS) in late 2016; see
Henry, Huynh and Nicholls (2017, forthcoming). We focus on Bitcoin as it is the most well-
known private digital currency. Given the increased interest in Bitcoin in 2017, the BTCOS
was repeated to understand whether adoption and usage had increased, and to identify
the driving reasons for ownership during the sudden rise in Bitcoin prices. The Bank of
Canada’s interest in Bitcoin is to understand whether its adoption and usage by Canadians
could affect the financial system. Further, it is important to understand Bitcoin’s potential
impact on how the Bank of Canada undertakes its core functions such as the production and
distribution of currency.
1https://www.coindesk.com/900-20000-bitcoins-historic-2017-price-run-revisited2Reaching an all-time high of 398,327 on December 15, 2017. Source: https://www.blockchain.info/
charts/n-transactions?timespan=2years3Additionally, in Canada “Bitcoin” was ranked number 4 in “International News” and “How to buy
bitcoin in Canada” was ranked number 5 in the “How...” category. Source: https://trends.google.com/trends/yis/2017/GLOBAL
4https://www.bankofcanada.ca/2017/12/three-things-keeping-me-awake-at-night/
2
Overall, results from the BTCOS show that awareness increased from 64 to 85 per cent
while ownership increased from 2.9 to 5.0 per cent. Previously, the 2016 BTCOS found
that most Canadians who owned Bitcoin did so for transactional purposes and because of
an interest in new technology. However, in 2017 we found that investment was the number
one reason. Further, only about half of Bitcoin owners were found to regularly use it to buy
goods or services or to send money to other people.
The structure of this paper is as follows: Section 2 describes the 2017 Bitcoin Omnibus
Survey. Section 3 discusses the awareness and usage of Bitcoin while Section 4 provides a
profile of Bitcoin users in 2017. Finally, Section 5 offers a conclusion.
2 The 2017 Bitcoin Omnibus Survey
In late 2016, the Bank of Canada’s Currency department commissioned a pilot study known
as the Bitcoin Omnibus Survey. The survey was conducted in two waves: the first ran from
November 9 to 13, 2016, and the second from December 14 to 18, 2016. With these two
waves, we obtained a total sample size of N = 1,997, including 58 current Bitcoin owners.
The BTCOS was considered a pilot because we anticipated obtaining only a small sample
of Bitcoin users. In light of this, the survey was kept short and concentrated on the key
metrics of public awareness of Bitcoin, ownership and reasons for ownership, and Bitcoin
holdings. A knowledge test was added in the second wave to objectively measure Bitcoin
literacy among owners and non-owners who had heard of Bitcoin.
The first two waves provided valuable lessons learned and helped to improve future stud-
ies. Meanwhile, as described above, the price of Bitcoin grew exponentially over 2017; see
Figure 1. Against this background, the Bank of Canada decided to conduct a third wave of
the BTCOS, roughly one year after the first two waves. The aim of the new 2017 BTCOS
was to measure how awareness and ownership had changed over time, and to use lessons
learned from the first two waves to gain a deeper understanding of the motivation of Bitcoin
adopters.
The third wave of the BTCOS was put into the field from December 12 to 15, 2017,
right around the time that the price of Bitcoin had reached its peak. Core features from the
first two waves of the survey were maintained and several new questions were added5 (see
Appendix A.1 for a full schematic of the updated survey). The purpose of the new questions
was to measure the extent to which respondents were holding Bitcoin for transactional versus
speculative purposes. Of particular relevance here, we asked owners directly about how often
they use Bitcoin to transact, both for purchasing goods/services and for making person-to-
person transfers.
5Note that many of the new questions are not discussed here as they are not analyzed in this paper.
3

The final sample size for the 2017 BTCOS was N = 2,623 and the sample was post-
stratified by region, age and gender to match the population totals observed in the 2016
Canadian census. Methodology, including sampling, imputatation and post-stratification
was conducted in the same manner as the 2016 BTCOS; see Henry, Huynh and Nicholls
(2017) for full details.
3 Public awareness and knowledge of Bitcoin
3.1 Increased awareness of Bitcoin
Awareness of Bitcoin in the BTCOS is measured by the response to the question, “Have you
heard of Bitcoin?”. The level of awareness in the Canadian population rose 21 percentage
points from 2016 to 2017, from 64 to 85 per cent. Increased awareness was observed across
all demographic groups; see Table 1. In 2017, the highest levels of awareness were observed
among residents of British Columbia (93 per cent), as well as among Canadians with an
income of $70,000 and above (92 per cent).
In terms of changes over time, Quebec saw the largest increase in awareness, as it rose
from 49 per cent in 2016 to 77 per cent in 2017. Awareness among women rose to 80 per cent
in 2017, an increase of 26 percentage points. Awareness also increased across all age groups,
from 62–68 per cent in 2016 to 83–89 per cent in 2017. In general, demographic trends in
awareness remained consistent across years. For example, males were noticeably more aware
than females (91 vs. 80 per cent in 2017; 75 vs. 54 per cent in 2016). Additionally, higher
awareness was associated with higher education and income levels in both 2016 and 2017.
From a geographic perspective, British Columbia had the highest levels of Bitcoin awareness
in both years, whereas Quebec had the lowest.
3.2 Knowledge of Bitcoin in 2017
Updates to the knowledge questions in the BTCOS were made in 2017 to make the true/false
statements more clear and objective, and to test the knowledge of the characteristics of
Bitcoin and other digital currencies. In this section, we analyze results from the knowledge
test and posit implications for awareness and ownership of Bitcoin in Canada. See Figure
2 for the changes to the knowledge questions,6 and Table 2 for detailed results discussed
6Wording for both questions 2 and 3 were kept identical across the two years. Additional wording wasadded to question 1 to make it more clear which property of Bitcoin was being tested (no trusted thirdparty). In contrast, question 4 was shortened considerably. Question 5 was replaced with a relatively moresubjective question designed to test the respondent’s understanding of the economic incentives underlyingthe security of the blockchain. Specifically, to say that the security relies solely on cryptography fails toacknowledge that the incentives align to preserve a single history of transactions.
4
below.
Two scores were calculated to measure objective knowledge of Bitcoin among both owners
and non-owners in 2017: score1 was the sum of all correct answers; score2 was the sum of
correct answers less the number of incorrect answers. The reason for deducting points is
to penalize those survey respondents who guessed, while answering “Don’t know” was not
subject to a point deduction. The scores in both years were calculated using questions 1–
4; the low scores by both Bitcoin owners and non-owners on question 5 suggest that the
question was quite difficult to understand and may benefit from clarification, or may require
a nuanced understanding of the Bitcoin system.
On average, both owners and non-owners scored higher on the knowledge test in 2017
compared with 2016. Owners answered 2.7 questions out of 4 correctly in 2017, whereas
non-owners managed only 1.4. Further, score2 was one point higher on average for owners
(1.9) compared with non-owners (0.9).
For owners, it appears that the increase in the score across time was largely due to the
improved clarity of the statements. The proportion answering the “government-backed”
question correctly rose from 37 to 78 per cent, a dramatic improvement. The change in the
wording for question 1 was also reflected in a nine percentage-point increase among owners.
This suggests that we succeeded in improving the reliability of the test, under the assumption
that owners should outperform non-owners on average.
For non-owners, the results suggest that not only were Canadians more aware of Bitcoin
in 2017, but also objectively more informed. For the questions that were unchanged across
years, non-owners were both more likely to attempt the questions in 2017 compared with
2016 (42 vs. 33 per cent for question 2; 35 vs. 29 per cent for question 3), and more likely to
answer both of these questions correctly (19 vs. 13 percent; 16 vs. 14 percent). Non-owners
were largely aware that Bitcoin is not backed by a government, as this question had the
highest participation rate among non-owners (62 per cent attempted) and was also the best
answered (59 per cent answered correctly).
The new version of question 5 in 2017, concerning the security of Bitcoin, was poorly
answered both by owners (13 per cent correct) and non-owners (3 per cent correct). It was
also the least attempted question among Bitcoin owners, at 80 per cent.
5
4 A profile of Bitcoin users in 2017
4.1 Increased ownership of Bitcoin
Increased awareness of Bitcoin was accompanied by a significant7 increase in ownership, from
2.9 per cent in 2016 to 5.0 per cent in 2017. On the contrary, the difference in ownership
rates among aware respondents between 2016 and 2017 was not significant, suggesting that
much of the increase in ownership was driven by an entrance of newly aware consumers.
The increase in Bitcoin ownership was seen more in certain demographic groups (Table
1). The 18-to-24 age group, already one of the main users of Bitcoin in 2016, grew the most
in ownership, from 6 to 14 per cent in 2017. Most other age groups saw increased ownership
as well, but the differences were usually not significant. The exception was the 45-to-54 age
group, where ownership grew almost four times over from 0.9 to 3.5 per cent.
The gender gap in Bitcoin ownership grew in 2017 compared with 2016. While ownership
among women remained close to 2 per cent in 2017, ownership among men nearly doubled
from 4.2 to 8.1 per cent. Ownership also grew in all provinces (significant only in the Prairies
and Ontario) and among the college- and university-educated populations.
4.2 Bitcoin holdings
The amount of Bitcoin held by users in 2016 and 2017 is shown in Figure 3. In this condensed
grouping, there are no significant differences in the distributions year-over-year. That being
said, there is some evidence of an increase in the proportion of owners with small amounts
of Bitcoin: in 2016, 32 per cent of Bitcoin owners stated they held less than 0.1 BTC ($100
CDN8) while a similar percentage (34 per cent) stated they had less than 0.05 BTC ($1,050
CDN) in 2017. This is consistent with at least two (reinforcing) possibilities: new Bitcoin
users observed in 2017 could predominantly have bought small amounts of Bitcoin; and
existing users could have sold off much of their Bitcoin. Both of these possibilities could be
driven by the skyrocketing prices of late 2017.
As it currently stands, the bins in which Bitcoin holdings are measured are too wide to
compute reliable estimates of mean, median or total Bitcoin owned by Canadians. However,
as a validation exercise, using survey weights and approximations we are able to compute
an upward bound of total Bitcoin holdings in Canada. We find that this approximation
7For this and following sections, differences are deemed statistically significant if the p-value from anon-paired, unequal variance t-test falls below the threshold of 0.05, i.e., a 95 per cent significance level.Detailed results may be provided upon request. Here “significance” and “statistical significance” are usedinterchangeably.
8We use the following exchange rates: 1 BTC = $1,000 CDN for waves 1 and 2 of the BTCOS (Novemberand December 2016), and 1 BTC = $21,000 CDN for wave 3 of the BTCOS (December 2017). These areroughly based on data from www.cbix.ca, but are not perfect given the volatility of Bitcoin prices.
6
yields that Canadians account for 6 and 11 per cent of total Bitcoin holdings in 2016 and
2017, respectively. It is difficult to verify this finding due to a lack of data. One possible
way is to calculate the Canadian share of all Bitcoin trading volume on exchanges. For
example, on December 31, 2017 Canadians accounted for about 0.28 per cent of Bitcoin
trading volume,9 suggesting we overestimate Canadian holdings. A natural reason for this
may be due to exaggeration of mostly young and male respondents. Appendix A.2 contains
an extensive discussion of this result and provides a rationale for it. Future BTCOS surveys
will experiment with finer grids or self-reported continuous value and volume of Bitcoin
holdings.
4.3 Why do people own Bitcoin?
An important question in studying Bitcoin and other digital currencies is why people own
Bitcoin. The answer to this has implications for central banks as issuers of cash and as they
research the costs and benefits of central-bank-issued digital currencies (see, e.g. Engert and
Fung (2017)). The 2017 BTCOS aimed to delve a bit deeper into this question by asking how
often owners used their Bitcoin for two purposes: to pay for goods and services and to send
money to other people. For this section, we make the distinction between transactors—those
who used Bitcoin for one of these purposes at least once per year—and non-transactors—
those who used Bitcoin at most “once or twice, but not on a regular basis.” Bitcoin owners
were split roughly evenly between the two groups, with transactors and non-transactors each
making up about half the population.
If half of Bitcoin owners do not use it to transact, there must be other reasons to hold
it. To investigate this, the BTCOS asked Bitcoin owners to choose their main reason for
owning it from a predetermined list (Table 3a). In 2017, the driving motivation for Bitcoin
owners was to hold it “as an investment,” with 58 per cent of owners choosing this response.
In second place was “My friends own Bitcoin” at 12 per cent, and the other response options
were all below 10 per cent. These reasons provide an explanation for the large number of
non-transactors, who overwhelmingly held Bitcoin as an investment (77 per cent) compared
with transactors (38 per cent). Unsurprisingly, Bitcoin transactors stated that they own
it to buy goods/services on the Internet (12 per cent), but also because their friends own
it (11 per cent) and it is a cost-saving technology (11 per cent). Therefore, a minority of
respondents are using Bitcoin for transactions.
These figures reflect a substantial shift from the motivations of Bitcoin owners in late
9Source: data.bitcoinity.org. Note that it is unclear to what extent this corresponds to holdingsshares, as not all trading activity occurs on exchanges. Further, owning and trading are different concepts;if, for example, trading activity grows exponentially as a function of total Bitcoin owned, the holdings of largercountries would be overestimated using trading shares while smaller countries would be underestimated.
7
2016. Table 3b collapses the reasons from Table 3a into relevant categories. In 2016, the
plurality (39 per cent) of owners gave payment-related reasons as their primary motivation
for ownership, with technology-related reasons close behind (36 per cent). By contrast, only
12 per cent of owners stated they held it as an investment. In 2017, however, the combined
payment-related reasons were cited by only 10 per cent of Bitcoin owners. This finding
provides some empirical support for the conclusion of Bolt and van Oordt (2016) that most
of the fluctuations of the Bitcoin price is due to speculation.
5 Conclusions
The Bank of Canada undertook another Bitcoin Omnibus Survey during the height of the
rise of the Bitcoin price in December 2017. Despite the large price increase, the adoption rate
increased from 2.9 to only 5.0 per cent from 2016 to 2017. Self-reported holdings of Bitcoin
among users did not remarkably change during this period. However, the number one reason
for holding Bitcoin did change from transactional (39 to 10 per cent) to investment purposes
(12 to 58 per cent). The BTCOS serves as a useful monitoring tool to understand the
developments of the diffusion of Bitcoin. Future research may consider other cryptocurrencies
and financial technologies.
References
Bolt W, van Oordt M. 2016. “On the Value of Virtual Currencies.” Bank of Canada Staff
Working Paper No. 2016-42.
Bottazi L, Lusardi A. 2018. “Gender Differences in Financial Literacy: Evidence and Implica-
tions.” 2018 Canadian Economics Association: Canadian Women Economists Committee
Luncheon Lecture (1 June 2018).
Chen H, Dunbar GR, Shen R. 2017. “The Mode is the Message: Using Predata as Exclusion
Restrictions to Evaluate Survey Design.” Bank of Canada Staff Working Paper No. 2017-
43.
Engert W, Fung BS. 2017. “Central Bank Digital Currency: Motivations and Implications.”
Bank of Canada Staff Working Paper No. 2017-16.
Haberman P, Elinson J. 1967. “Family income reported in surveys: Husbands versus wives.”
Journal of Marketing Research 4: 191–194.
8
Henry CS, Huynh KP, Nicholls G. 2017. “Bitcoin Awareness and Usage in Canada.” Bank
of Canada Staff Working Paper No. 2017-56.
Henry CS, Huynh KP, Nicholls G. forthcoming. “Bitcoin Awareness and Usage in Canada.”
Journal of Digital Banking.
Zagorsky J. 2003. “Husbands’ and wives’ view of the family finances.” Journal of Socio-
ecomonics 32: 127–146.
9

Figure 1: Price and number of Bitcoin transactions, 2012–18 (monthly average)
Wave 1/2
Wave 3
05
1015
2025
30Pr
ice
(thou
sand
s C
DN
$)
050
100
150
200
250
300
350
400
Tran
sact
ions
(tho
usan
ds)
Jan 2012 Jan 2014 Jan 2016 Jan 2018Month/Year
Transactions (left scale) Price (right scale)
Note: This graph shows the price of Bitcoin in Canadian dollars and the number of daily transactions
made with Bitcoin, averaged over each month from January 2012 to May 2018. Note that the data series
for price starts at March 12, 2013. The red vertical lines show when the first two waves of the BTCOS were
in the field; the blue vertical line shows when the third wave was in the field. Source: bitcoin.com
(transactions) and ca.finance.yahoo.com (prices).
10

Figure 2: Bitcoin knowledge questions
1a) Bitcoin allows for direct transactions between two parties, without a third party in-volved. [TRUE]
1b) Bitcoin allows for direct transactions between two parties, without the need for atrusted third party involved. [TRUE]
2) The total supply of Bitcoin is fixed. [TRUE]
3) All Bitcoin transactions are recorded on a distributed ledger that is publicly accessible.[TRUE]
4a) Bitcoin is similar to other national currencies, such as the Euro or Peso, that are backedby a government. [FALSE]
4b) Bitcoin is backed by a government. [FALSE]
5a) Bitcoin transations take place instantaneously. [FALSE]
5b) The security (i.e. immutability) of the Bitcoin system relies solely on cryptography.[FALSE]
Note: This figure shows the knowledge questions implemented in Wave 2 (2016) and Wave 3 (2017) of the
BTCOS. The ‘a’ versions are from Wave 2 and the ‘b’ versions are from Wave 3. Questions 2 and 3 remained
unchanged across the two iterations. The order of the features was randomized when presented to each
respondent.
11
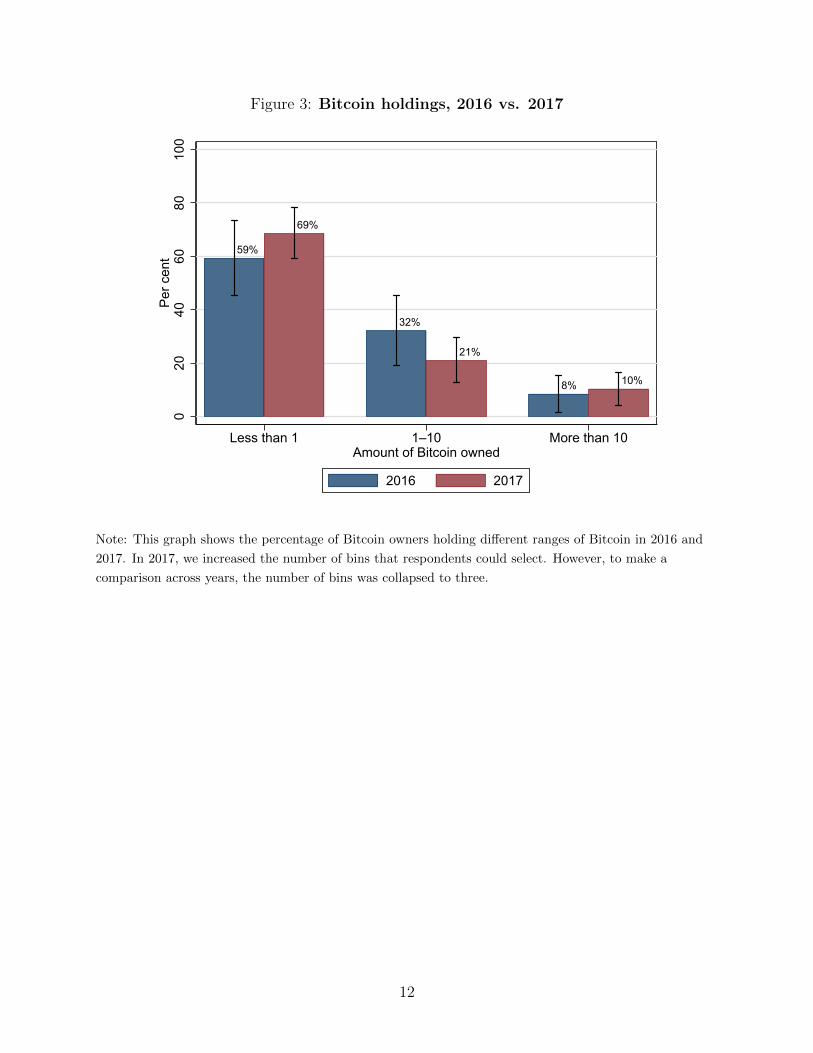
Figure 3: Bitcoin holdings, 2016 vs. 2017
59%
32%
8%
69%
21%
10%
020
4060
8010
0Pe
r cen
t
Less than 1 1–10 More than 10Amount of Bitcoin owned
2016 2017
Note: This graph shows the percentage of Bitcoin owners holding different ranges of Bitcoin in 2016 and
2017. In 2017, we increased the number of bins that respondents could select. However, to make a
comparison across years, the number of bins was collapsed to three.
12
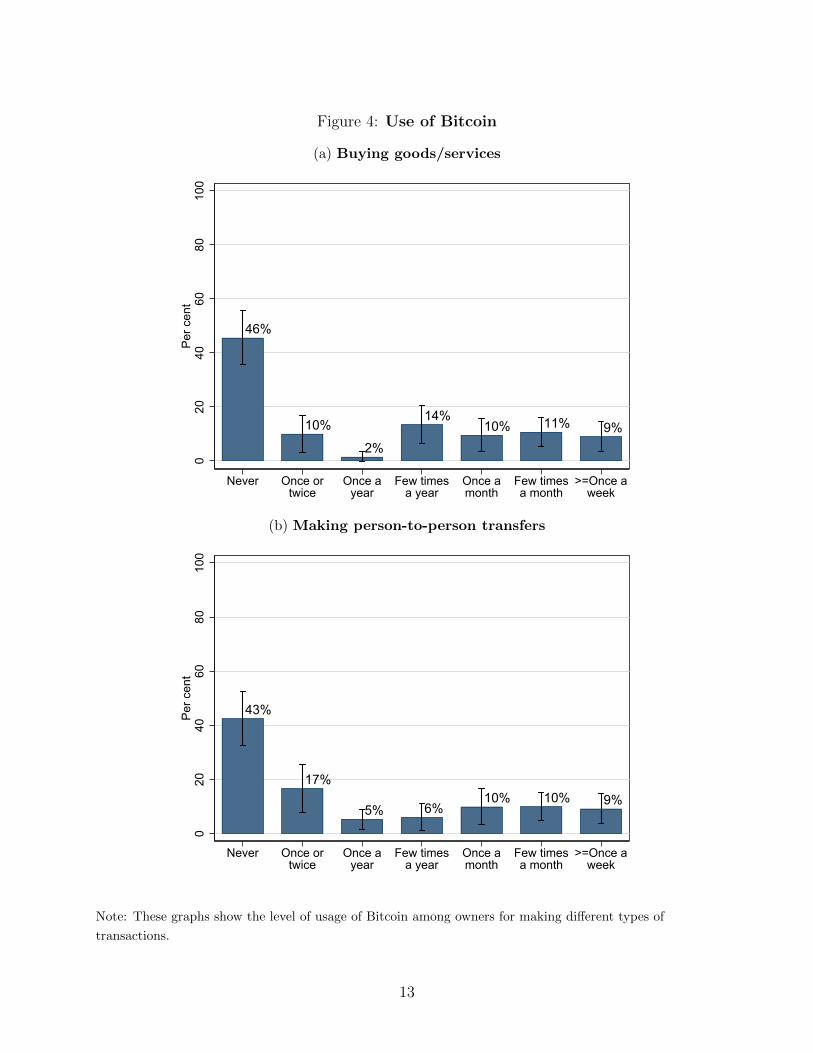
Figure 4: Use of Bitcoin
(a) Buying goods/services
46%
10%
2%
14%10% 11% 9%
020
4060
8010
0Pe
r cen
t
Never Once ortwice
Once ayear
Few timesa year
Once amonth
Few timesa month
>=Once aweek
(b) Making person-to-person transfers
43%
17%
5% 6%10% 10% 9%
020
4060
8010
0Pe
r cen
t
Never Once ortwice
Once ayear
Few timesa year
Once amonth
Few timesa month
>=Once aweek
Note: These graphs show the level of usage of Bitcoin among owners for making different types of
transactions.
13
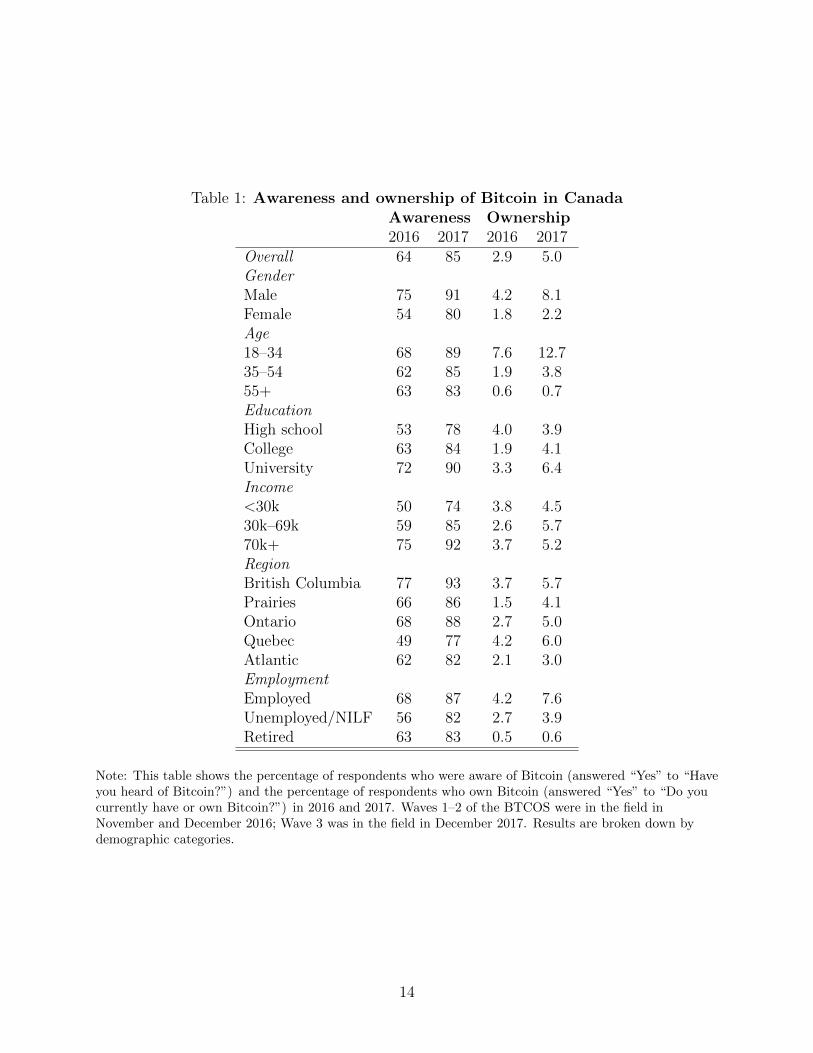
Table 1: Awareness and ownership of Bitcoin in CanadaAwareness Ownership2016 2017 2016 2017
Overall 64 85 2.9 5.0GenderMale 75 91 4.2 8.1Female 54 80 1.8 2.2Age18–34 68 89 7.6 12.735–54 62 85 1.9 3.855+ 63 83 0.6 0.7EducationHigh school 53 78 4.0 3.9College 63 84 1.9 4.1University 72 90 3.3 6.4Income<30k 50 74 3.8 4.530k–69k 59 85 2.6 5.770k+ 75 92 3.7 5.2RegionBritish Columbia 77 93 3.7 5.7Prairies 66 86 1.5 4.1Ontario 68 88 2.7 5.0Quebec 49 77 4.2 6.0Atlantic 62 82 2.1 3.0EmploymentEmployed 68 87 4.2 7.6Unemployed/NILF 56 82 2.7 3.9Retired 63 83 0.5 0.6
Note: This table shows the percentage of respondents who were aware of Bitcoin (answered “Yes” to “Haveyou heard of Bitcoin?”) and the percentage of respondents who own Bitcoin (answered “Yes” to “Do youcurrently have or own Bitcoin?”) in 2016 and 2017. Waves 1–2 of the BTCOS were in the field inNovember and December 2016; Wave 3 was in the field in December 2017. Results are broken down bydemographic categories.
14

Table 2: Knowledge questionsNon-owners Owners
Per cent correct Per cent attempt Per cent correct Per cent attempt2016 2017 2016 2017 2016 2017 2016 2017
1. No third party 52 49 56 54 69 78 96 902. Total supply fixed 13 19 33 42 51 53 92 853. Recorded on public ledger 14 16 29 35 61 57 91 784a. Government backed - 1 50 - 59 - 37 - 75 -4b. Government backed - 2 - 59 - 62 - 78 - 915a. Instantaneous 3 - 48 - 39 - 97 -5b. Security relies on cryptography - 3.5 - 43 - 13 - 80
2016 2017 2016 2017Average score1 0.8 1.4 2.2 2.7Average score2 0.0 0.9 0.7 1.9
Note: This tables summarizes results from the true/false knowledge questions posed to all respondents whowere aware of Bitcoin. There were two scores calculated for each respondent: score1 is the sum of correctresponses; score2 is the number of correct responses minus the number of incorrect responses. The scoreswere calculated based on questions 1–4, given the poor performance by respondents in both versions of thefifth question. Note that respondents had the opportunity to answer “Don’t know,” and we report thepercentage of respondents who attempted the question.
15
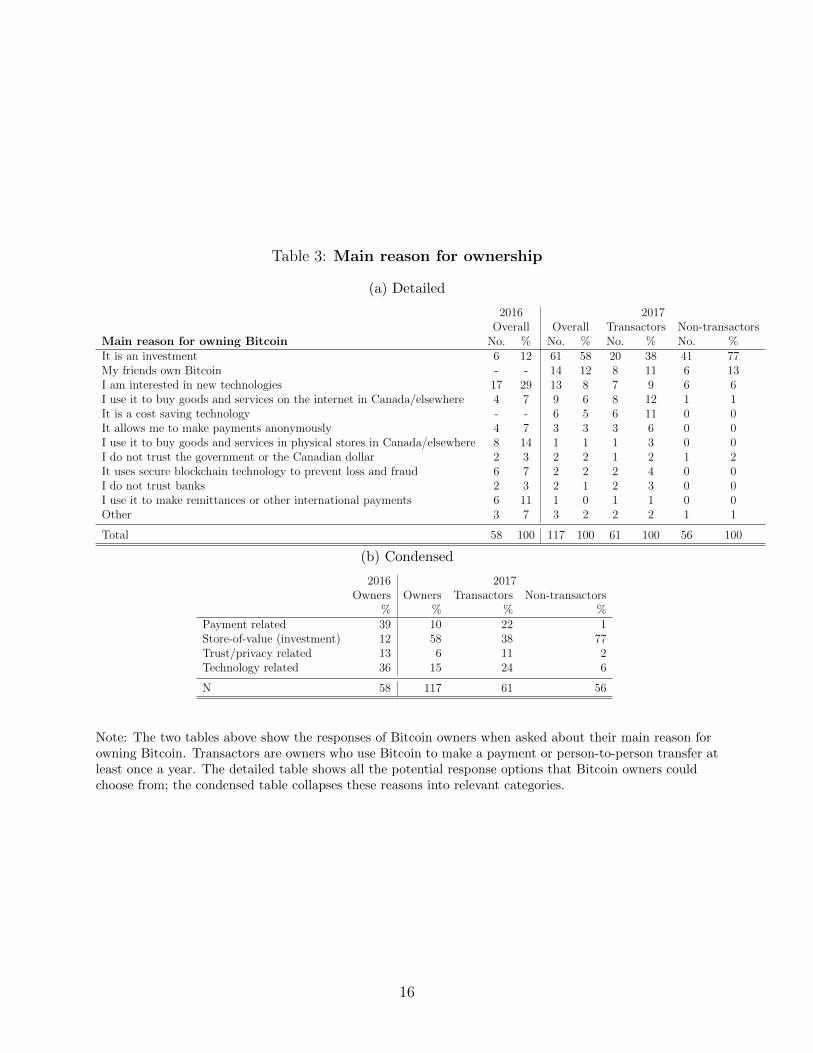
Table 3: Main reason for ownership
(a) Detailed
2016 2017Overall Overall Transactors Non-transactors
Main reason for owning Bitcoin No. % No. % No. % No. %It is an investment 6 12 61 58 20 38 41 77My friends own Bitcoin - - 14 12 8 11 6 13I am interested in new technologies 17 29 13 8 7 9 6 6I use it to buy goods and services on the internet in Canada/elsewhere 4 7 9 6 8 12 1 1It is a cost saving technology - - 6 5 6 11 0 0It allows me to make payments anonymously 4 7 3 3 3 6 0 0I use it to buy goods and services in physical stores in Canada/elsewhere 8 14 1 1 1 3 0 0I do not trust the government or the Canadian dollar 2 3 2 2 1 2 1 2It uses secure blockchain technology to prevent loss and fraud 6 7 2 2 2 4 0 0I do not trust banks 2 3 2 1 2 3 0 0I use it to make remittances or other international payments 6 11 1 0 1 1 0 0Other 3 7 3 2 2 2 1 1
Total 58 100 117 100 61 100 56 100
(b) Condensed
2016 2017Owners Owners Transactors Non-transactors
% % % %Payment related 39 10 22 1Store-of-value (investment) 12 58 38 77Trust/privacy related 13 6 11 2Technology related 36 15 24 6
N 58 117 61 56
Note: The two tables above show the responses of Bitcoin owners when asked about their main reason forowning Bitcoin. Transactors are owners who use Bitcoin to make a payment or person-to-person transfer atleast once a year. The detailed table shows all the potential response options that Bitcoin owners couldchoose from; the condensed table collapses these reasons into relevant categories.
16
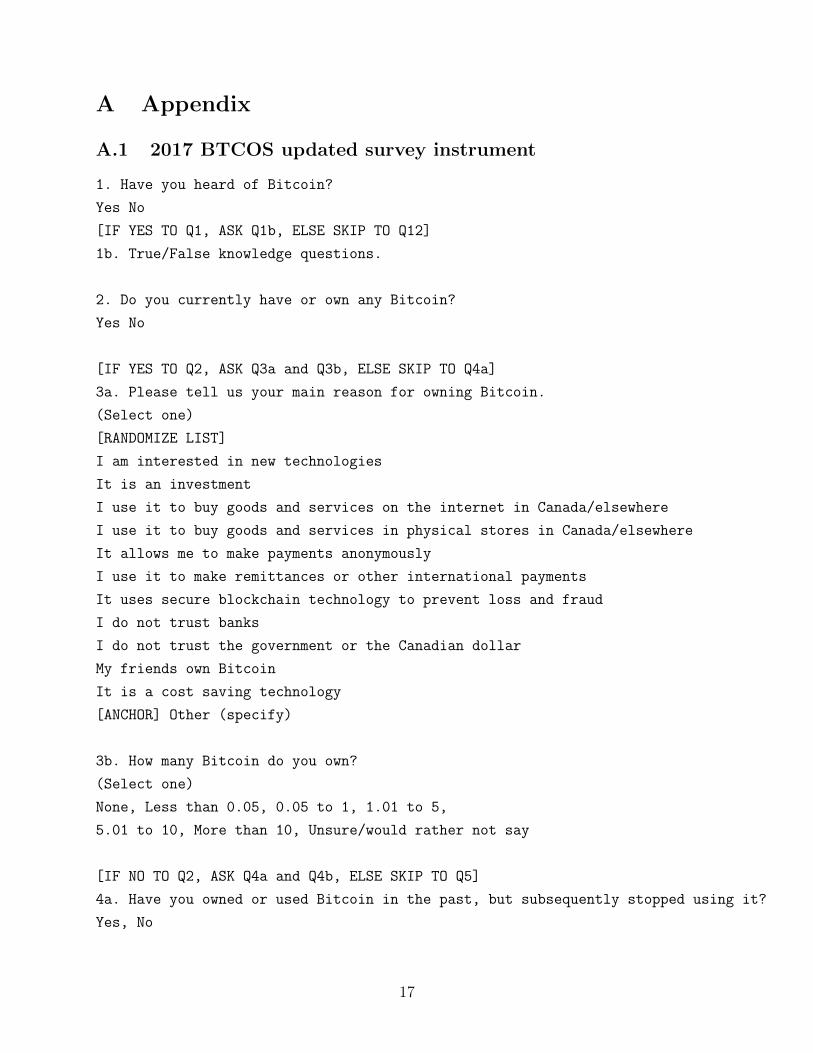
A Appendix
A.1 2017 BTCOS updated survey instrument
1. Have you heard of Bitcoin?
Yes No
[IF YES TO Q1, ASK Q1b, ELSE SKIP TO Q12]
1b. True/False knowledge questions.
2. Do you currently have or own any Bitcoin?
Yes No
[IF YES TO Q2, ASK Q3a and Q3b, ELSE SKIP TO Q4a]
3a. Please tell us your main reason for owning Bitcoin.
(Select one)
[RANDOMIZE LIST]
I am interested in new technologies
It is an investment
I use it to buy goods and services on the internet in Canada/elsewhere
I use it to buy goods and services in physical stores in Canada/elsewhere
It allows me to make payments anonymously
I use it to make remittances or other international payments
It uses secure blockchain technology to prevent loss and fraud
I do not trust banks
I do not trust the government or the Canadian dollar
My friends own Bitcoin
It is a cost saving technology
[ANCHOR] Other (specify)
3b. How many Bitcoin do you own?
(Select one)
None, Less than 0.05, 0.05 to 1, 1.01 to 5,
5.01 to 10, More than 10, Unsure/would rather not say
[IF NO TO Q2, ASK Q4a and Q4b, ELSE SKIP TO Q5]
4a. Have you owned or used Bitcoin in the past, but subsequently stopped using it?
Yes, No
17

4b. Please tell us your main reason for not owning any Bitcoin.
[RANDOMIZE LIST]
I do not understand/know enough about the technology
It is not widely accepted as a method of payment
My current payment methods meet all my needs
The value of Bitcoin varies too much
It is not easy to acquire/use
I do not trust a private currency that is not backed by the central government
I am concerned about cyber theft
I am concerned about lack of oversight from regulatory bodies
I use alternative digital currencies instead (e.g. Dogecoin, Litecoin, Ripple,etc)
I do not believe the Bitcoin system will survive in the future
[ANCHOR] Other (specify)
[ASK Q5 IF YES TO Q2, ELSE SKIP TO INSTRUCTIONS ABOVE Q6a]
5. How concerned are you about malicious attacks to the Bitcoin system
(e.g. miners forking the public ledger, cyber-attacks by hackers, etc)?
Please use a scale of 1 to 5 where 1 is very concerned,
and 5 is not at all concerned.
[ASK Q6a IF YES TO Q1]
6a. How likely do you think it is that the Bitcoin system will fail
or survive in the next 15 years?
Please use the sliding scale where 0 means that the system
will certainly fail and 100 means the system will certainly survive.
[INSERT SLIDING SCALE WITH WORD ANCHORS]
6b. What percentage of Canadians do you predict will be
using Bitcoin 15 years from now?
Please use the sliding scale where 0 means no Canadians will be
using Bitcoin and 100 means all Canadians will be using Bitcoin.
[INSERT SLIDING SCALE WITH WORD ANCHORS]
[ASK Q7a IF Q2=YES, ELSE SKIP TO Q12]
7a. What is the current price of Bitcoin?
Please provide your best estimate in Canadian dollars.
Please round to the nearest dollar.
18
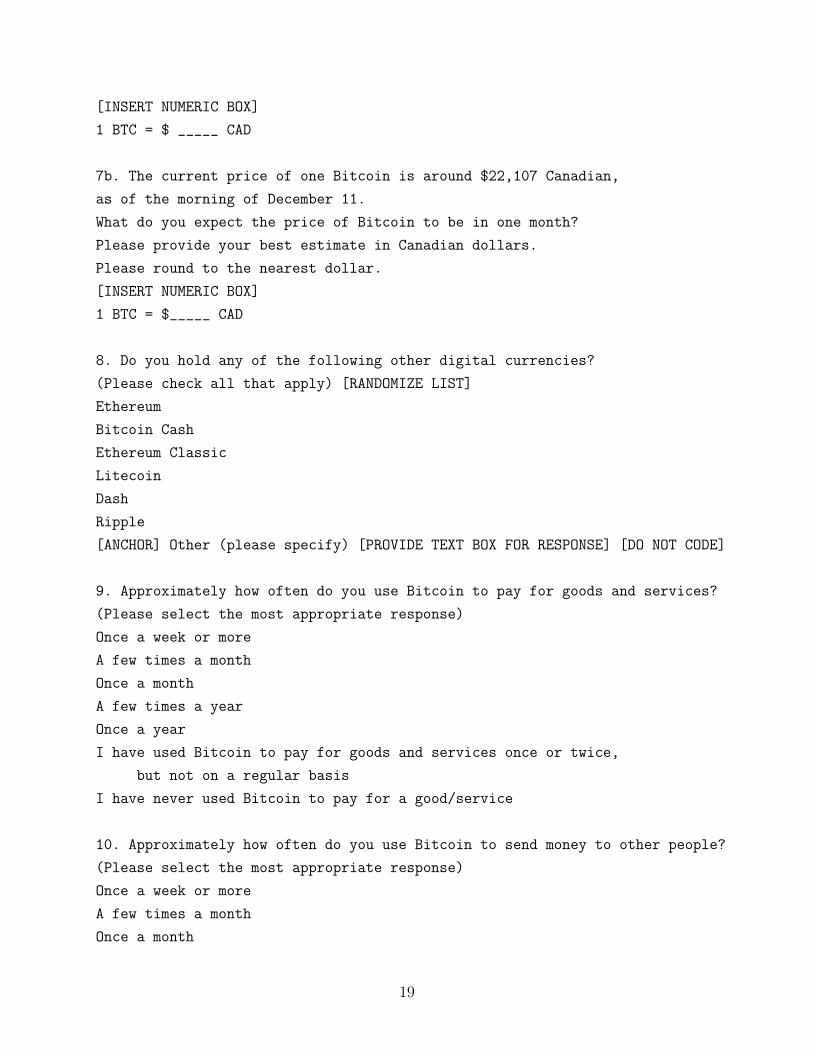
[INSERT NUMERIC BOX]
1 BTC = $ _____ CAD
7b. The current price of one Bitcoin is around $22,107 Canadian,
as of the morning of December 11.
What do you expect the price of Bitcoin to be in one month?
Please provide your best estimate in Canadian dollars.
Please round to the nearest dollar.
[INSERT NUMERIC BOX]
1 BTC = $_____ CAD
8. Do you hold any of the following other digital currencies?
(Please check all that apply) [RANDOMIZE LIST]
Ethereum
Bitcoin Cash
Ethereum Classic
Litecoin
Dash
Ripple
[ANCHOR] Other (please specify) [PROVIDE TEXT BOX FOR RESPONSE] [DO NOT CODE]
9. Approximately how often do you use Bitcoin to pay for goods and services?
(Please select the most appropriate response)
Once a week or more
A few times a month
Once a month
A few times a year
Once a year
I have used Bitcoin to pay for goods and services once or twice,
but not on a regular basis
I have never used Bitcoin to pay for a good/service
10. Approximately how often do you use Bitcoin to send money to other people?
(Please select the most appropriate response)
Once a week or more
A few times a month
Once a month
19

A few times a year
Once a year
I have used Bitcoin to send money to other people once or twice,
but not on a regular basis
I have never used Bitcoin to send money to other people
11. How many people do you know who currently own Bitcoin?
Please include:
- family members, friends, acquaintances and even those individuals you
may have communicated with anonymously via social media or other channels
- only people who currently live in Canada and are 18 years of age or older
__________ # of people
[ASK ALL]
12. Thinking now about regular Canadian currency, how much cash do you
currently have in your purse, wallet, or pockets?
$_______________
A.2 Estimates of total Bitcoin holdings in Canada
Given each individual i’s Bitcoin holdings hi, we can estimate the total amount of Bitcoin,
H, owned by Canadians:
H =∑i
wihi (1)
where wi are survey weights. The BTCOS asked respondents to report their Bitcoin
holdings in ranges, so the best we can do is approximate hi. To do so, we take the lower
bound of each interval. We use the lower bound since the distribution of Bitcoin holdings
is right-skewed and we do not want to introduce bias into the results. For example, the
interval “0.05 to 0.1” would be estimated as h = 0.05. Some Bitcoin owners did not report
the amount of Bitcoin they own, so multiple imputation is used when computing estimates
and standard errors. See Table 4 for all results.
In 2017, we estimate that there were 1.9 million BTC held by Canadians. This marks
an increase over 2016, where it was found that Canadians owned a total of 1.0 million BTC,
but this difference was not statistically significant due to the large standard errors. Given
20

estimates of the total supply of Bitcoin in circulation,10 we can also compute the share of
all Bitcoin owned by Canadians. It was found that 11 per cent of all Bitcoin was owned by
Canadians in 2017, compared with 6 per cent in 2016.
It is important to note that the above results should be viewed as an approximation.
First, our methods are imprecise in measuring a person’s Bitcoin holdings. Second, and
related, standard errors are quite large, resulting in a large range of feasible values. In
particular, the 95 per cent confidence interval for the share of Canadian Bitcoin in 2017
ranges from 5.7 to 16.8. Finally, using multiple imputation requires the assumption that
missing values are missing “at random.”
Further, there are reasons to suspect that we are specifically overestimating total Bitcoin
holdings in Canada. As the BTCOS was conducted online, there may be a mode effect since
respondents to the survey are required to have Internet access in some form, and therefore
may be more likely to own Bitcoin than other Canadians. Chen, Dunbar and Shen (2017)
discuss the difference in outcomes for offline versus online and provide a direction for the
source of the difference; i.e., “there is statistically significant evidence of mode effects in recall
and subjective questions, but not for factual ones.”
Finally, demographic factors associated with Bitcoin ownership are known to also be
associated with inflated reporting of wealth on surveys. For example, Haberman and Elinson
(1967) and Zagorsky (2003) both find that husbands report higher household income and
wealth compared with their wives; Bottazi and Lusardi (2018) find that gender differences
are associated with financial literacy, and that men were more likely to respond confidently
even though they don’t know something while women answer “don’t know.” This result
may explain why a higher number of men (27) report high amounts of Bitcoin (see Table
5). This suggests that their self-reported holdings may contribute to an overestimate of the
total. Further work is required to calibrate survey estimates of Bitcoin holdings to relevant
network data, such as Canadian Bitcoin exchanges, or the blockchain itself.
Table 4: Estimates of total Bitcoin ownership in CanadaWave 1/2 (2016) Wave 3 (2017)
Total 1,015,184 (295,606) 1,891,181 (466,708)Share 6.31% (1.84) 11.28% (2.78)
Note: This table provides estimates of the total amount of Bitcoin owned in Canada, and the share of allBitcoin owned by Canadians. These estimates are calculated using post-stratification weights and multipleimputation of Bitcoin holdings. Standard errors are in parentheses. Share of Bitcoin owned is calculated asthe total Bitcoin owned by Canadians divided by the total amount of Bitcoin in the world (16.1 million asof December 31, 2016 and 16.8 million as of December 31, 2017 (source: blockchain.info)).
1016.1 million as of December 31, 2016 and 16.8 million as of December 31, 2017 (source: blockchain.info).
21
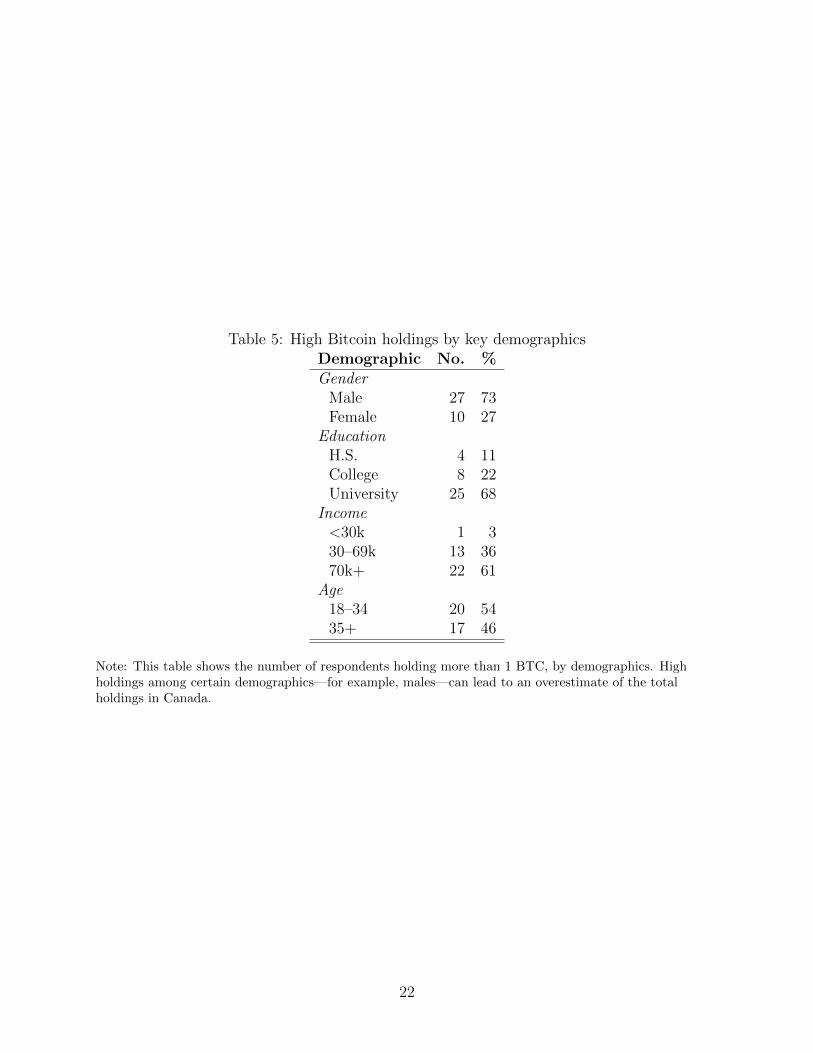
Table 5: High Bitcoin holdings by key demographicsDemographic No. %Gender
Male 27 73Female 10 27
EducationH.S. 4 11College 8 22University 25 68
Income<30k 1 330–69k 13 3670k+ 22 61
Age18–34 20 5435+ 17 46
Note: This table shows the number of respondents holding more than 1 BTC, by demographics. Highholdings among certain demographics—for example, males—can lead to an overestimate of the totalholdings in Canada.
22