bitcoin time & price cycles for jan – mar 2018 - ossoss.cc/library/bitcoin-time-price.pdf ·...
TRANSCRIPT
Bitcoin Time & Price Cycles for Jan – Mar 2018
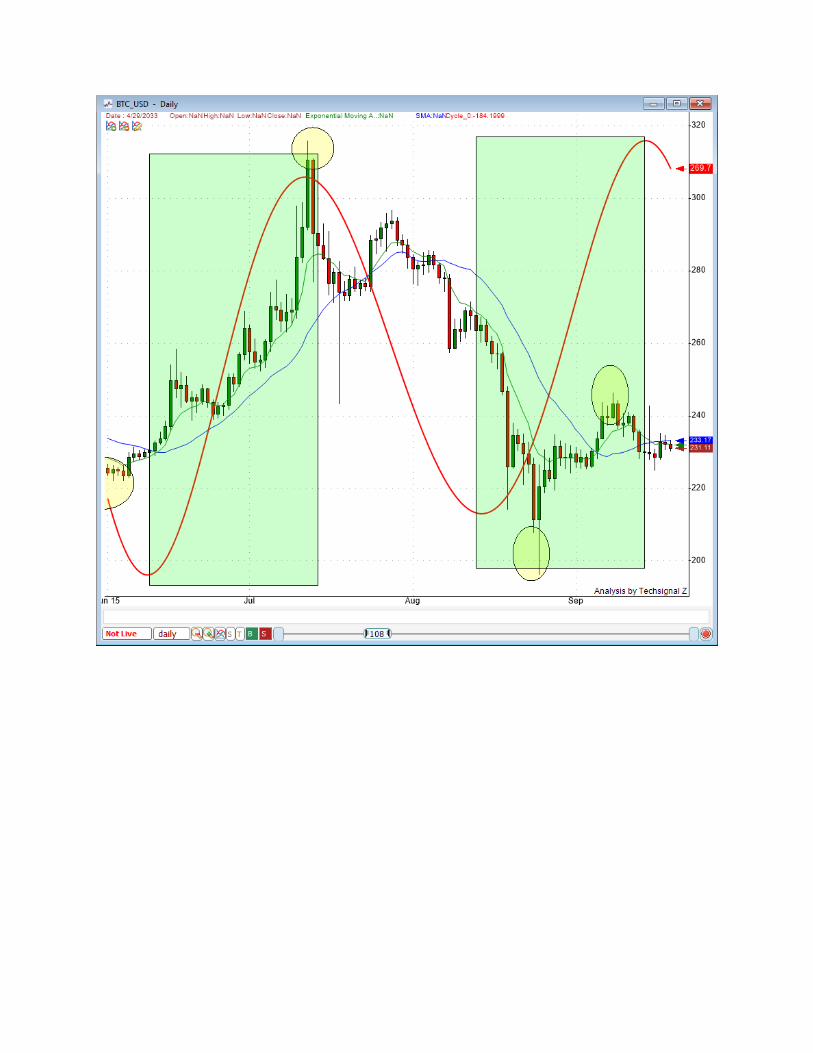
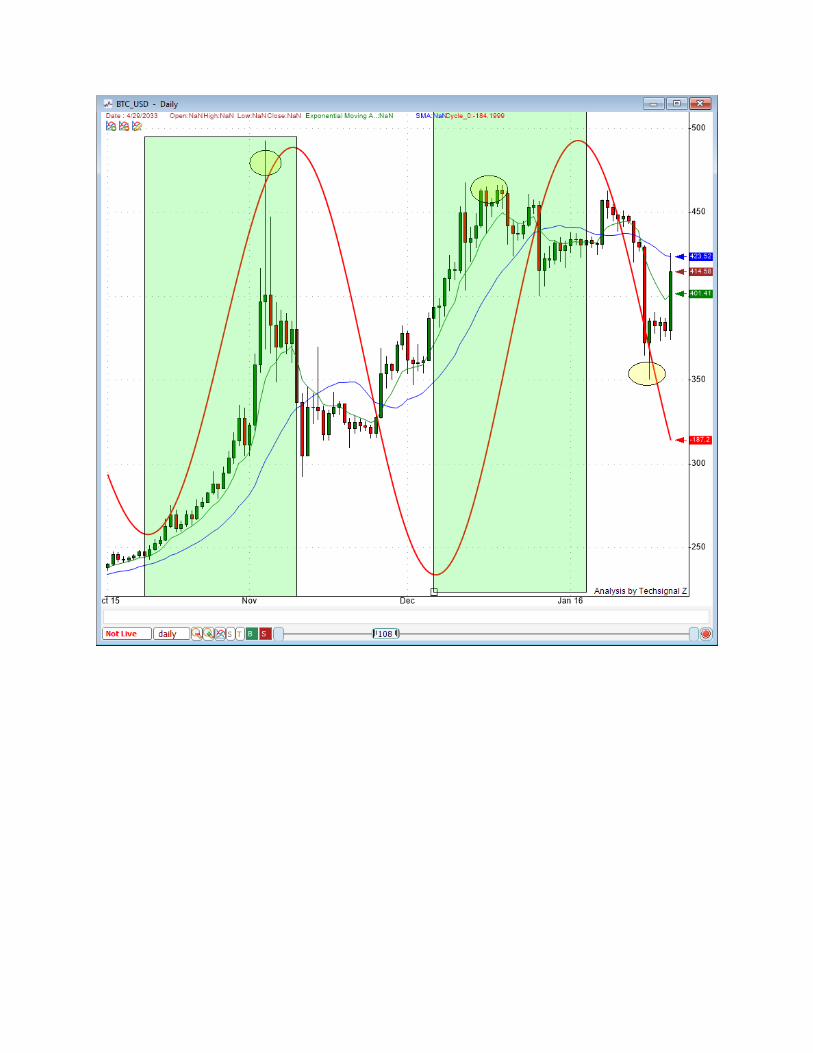
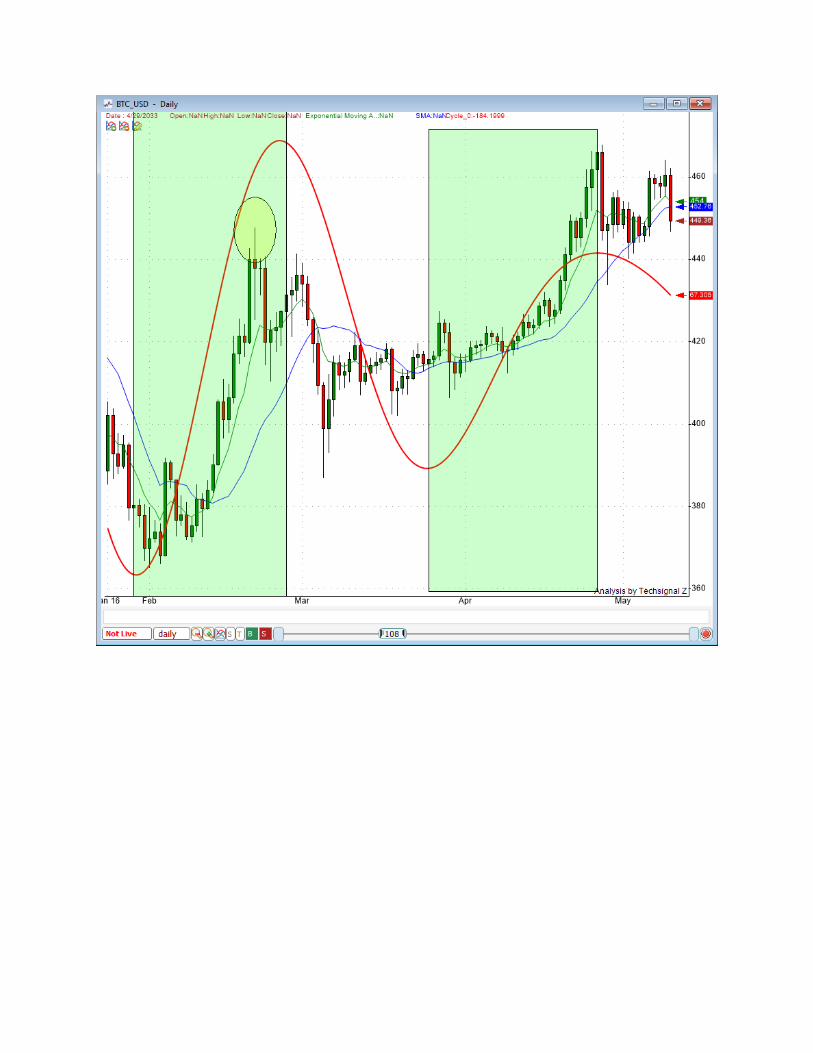
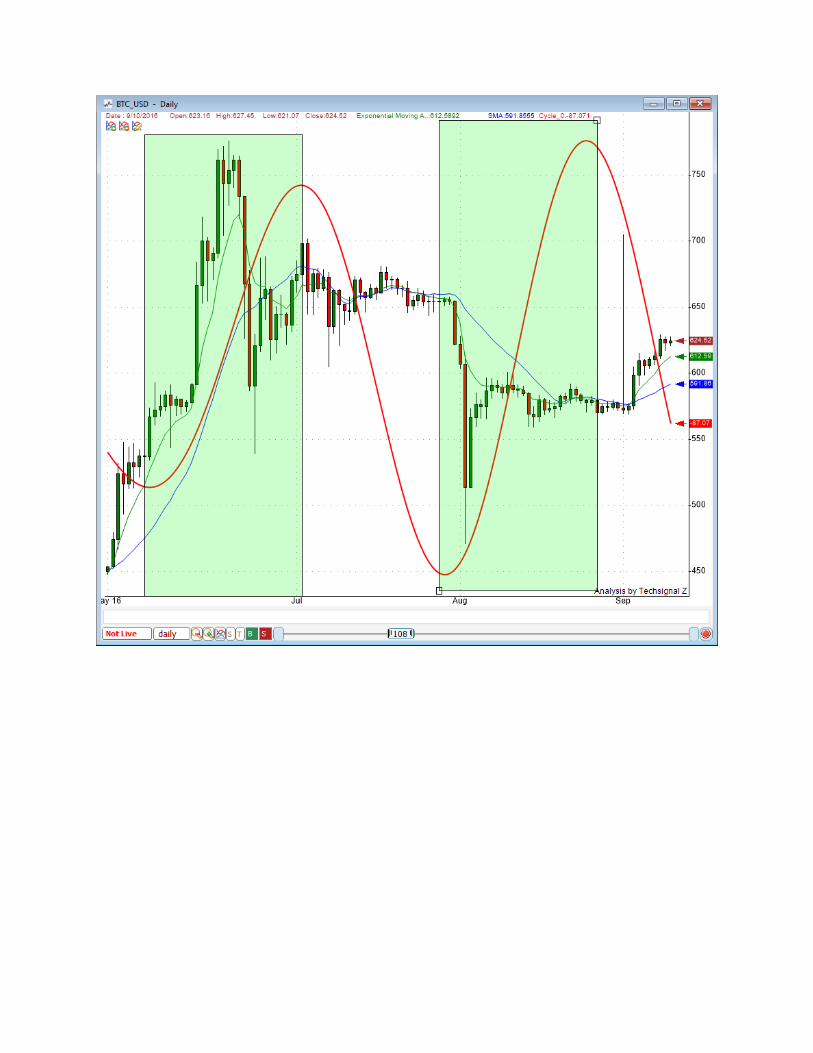
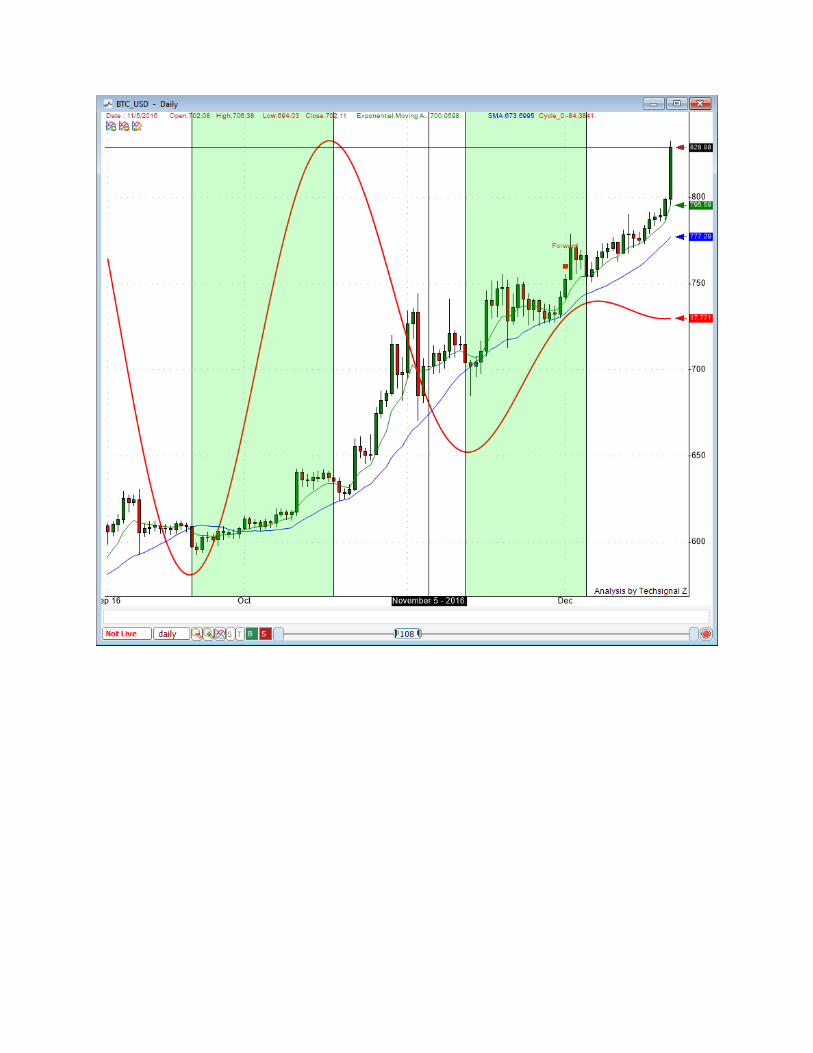
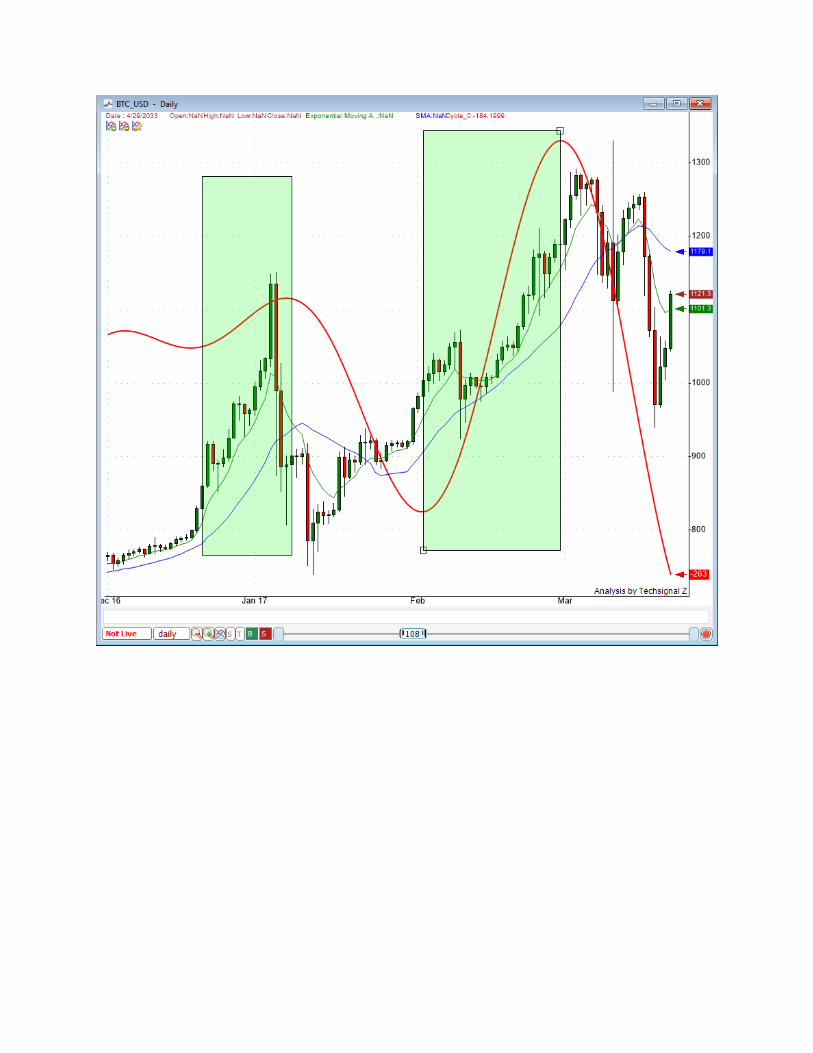
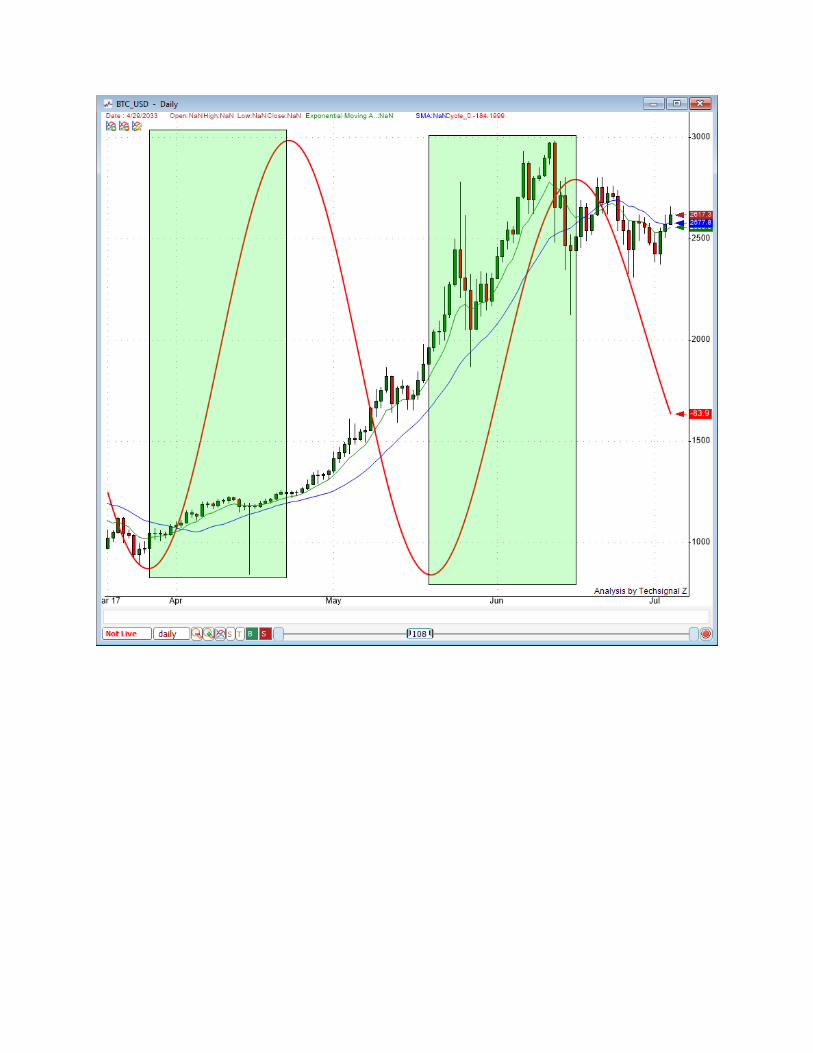
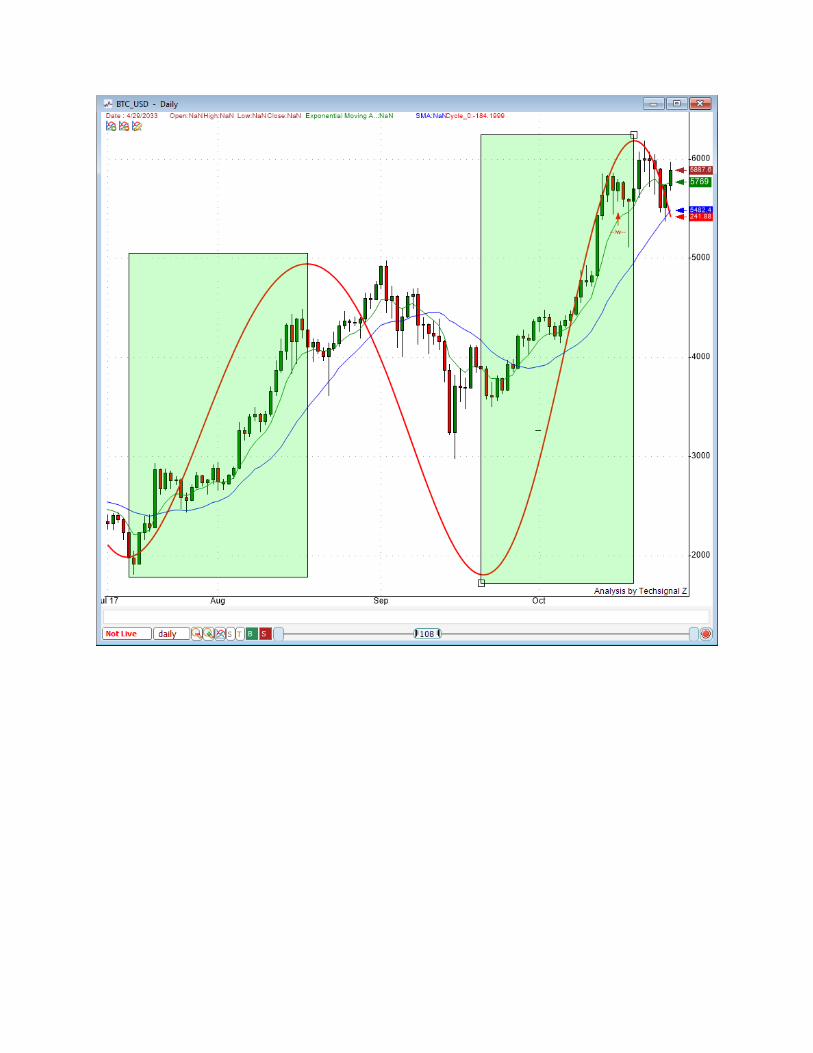
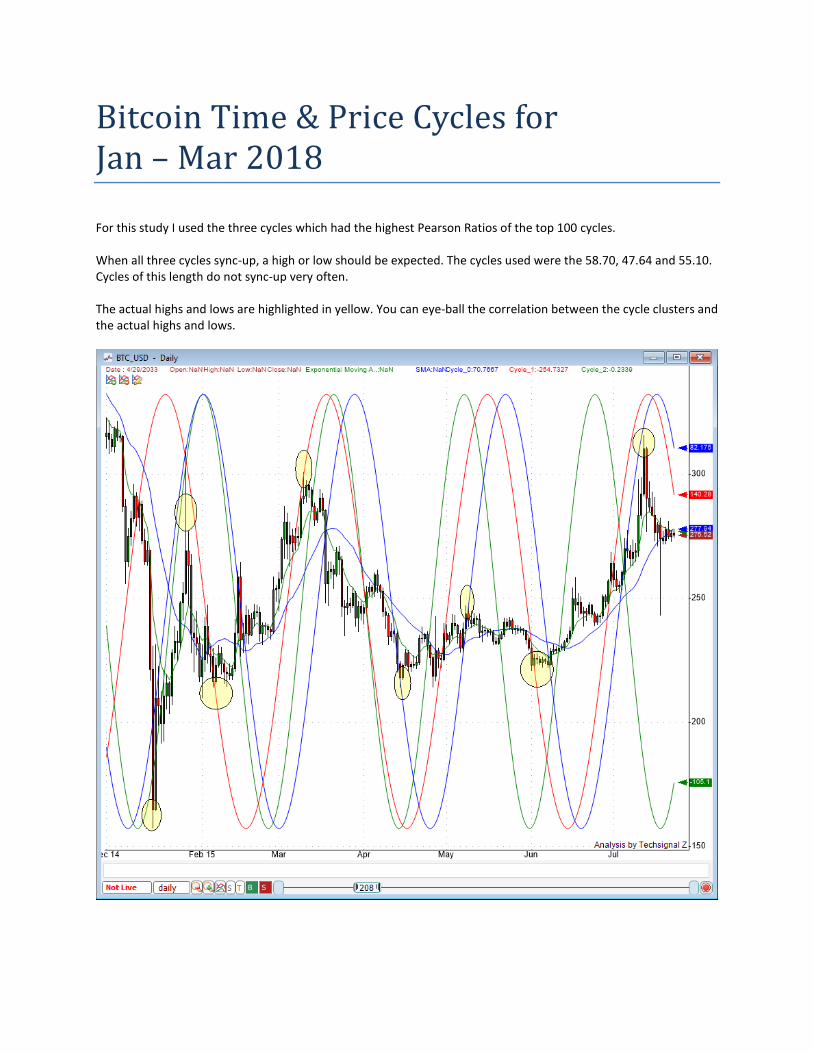
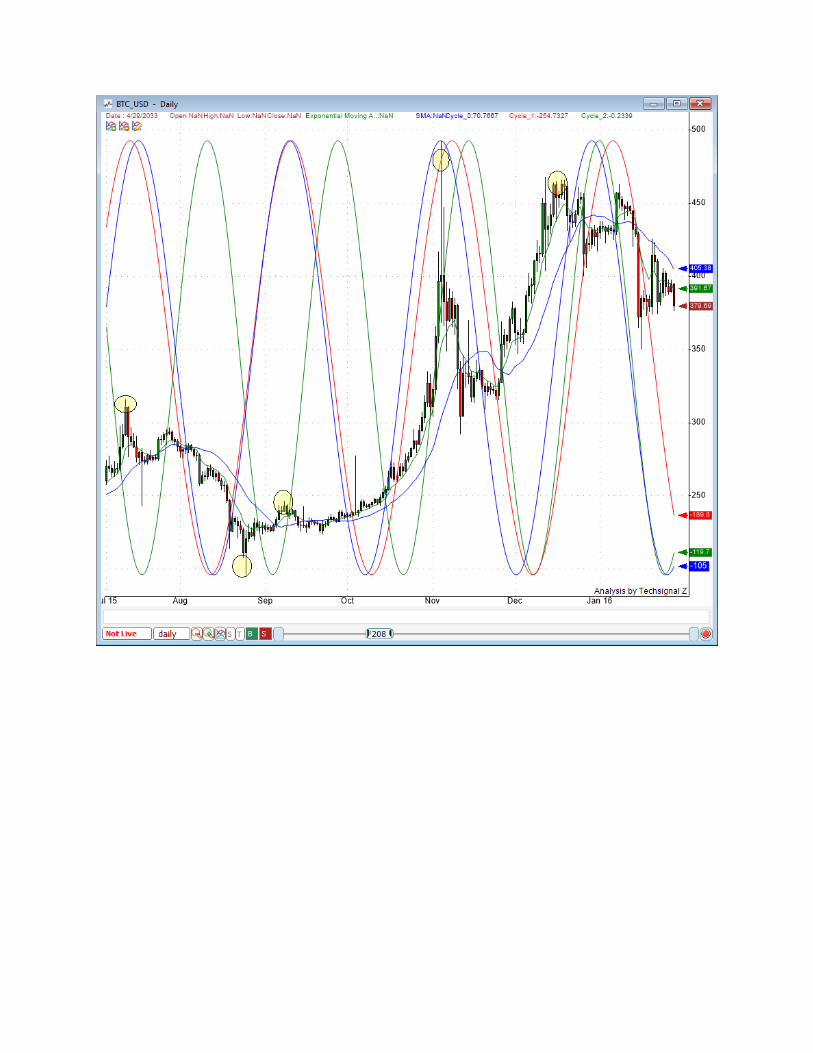
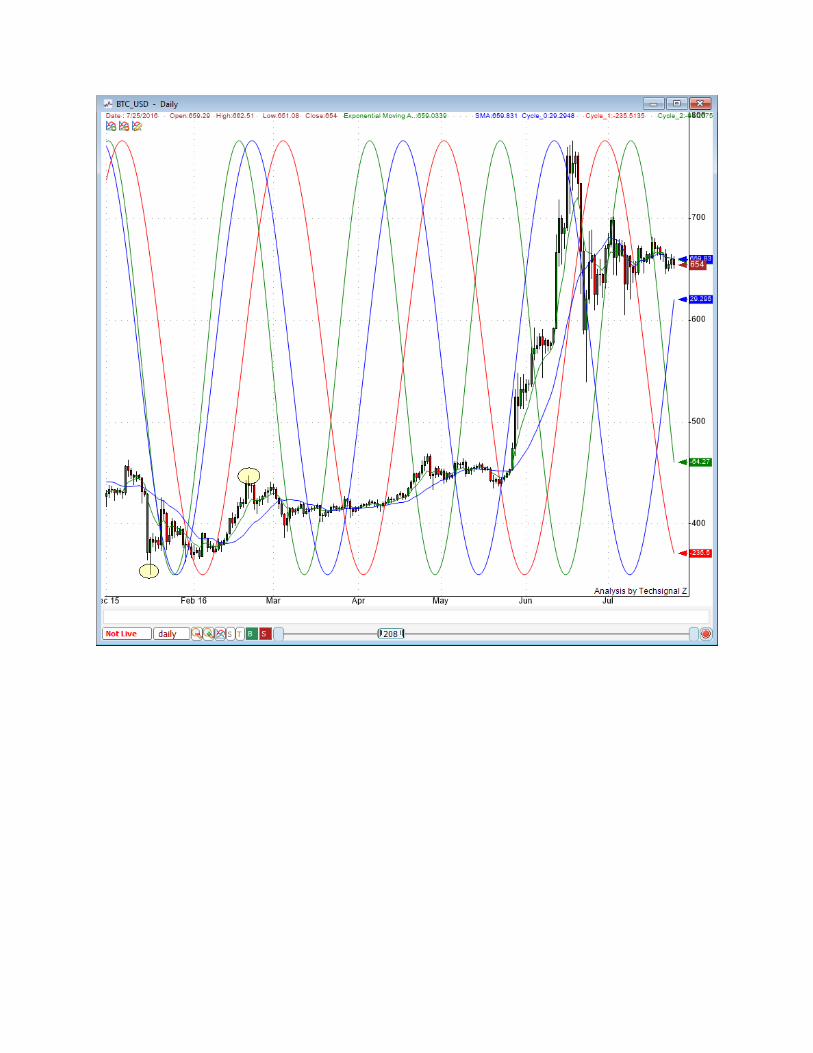
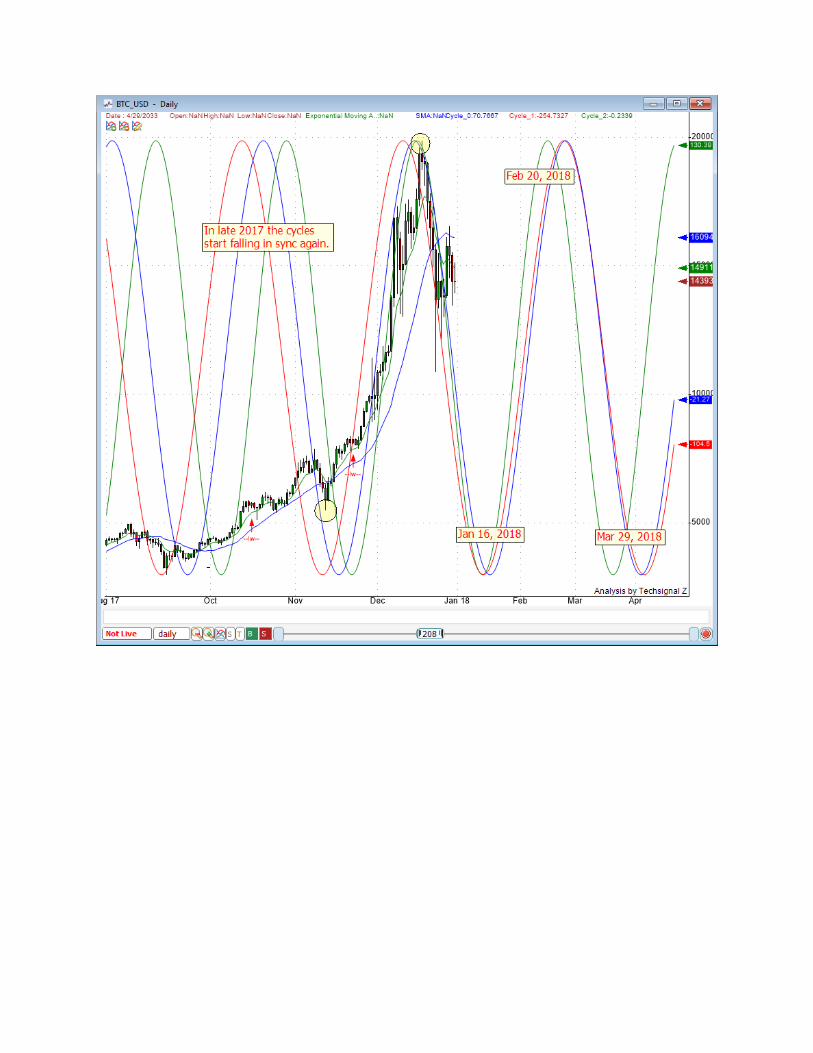
For this study I used the three cycles which had the highest Pearson Ratios of the top 100 cycles. When all three cycles sync-up, a high or low should be expected. The cycles used were the 58.70, 47.64 and 55.10. Cycles of this length do not sync-up very often. The actual highs and lows are highlighted in yellow. You can eye-ball the correlation between the cycle clusters and the actual highs and lows.
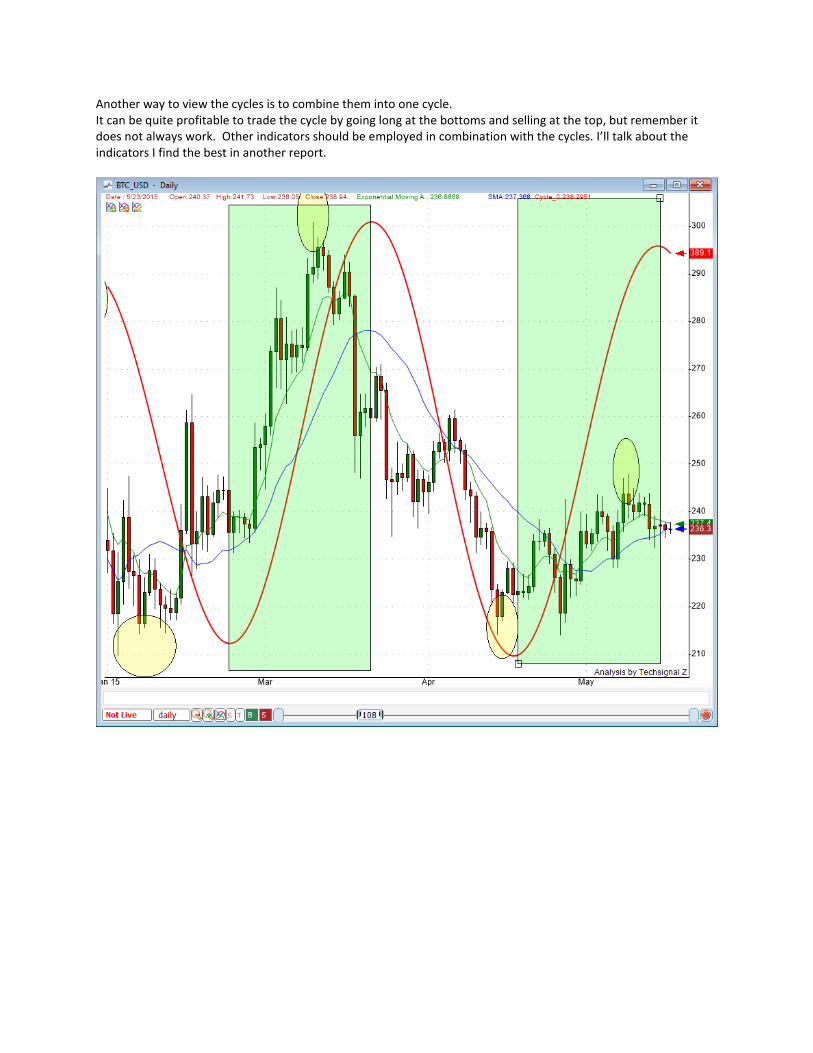
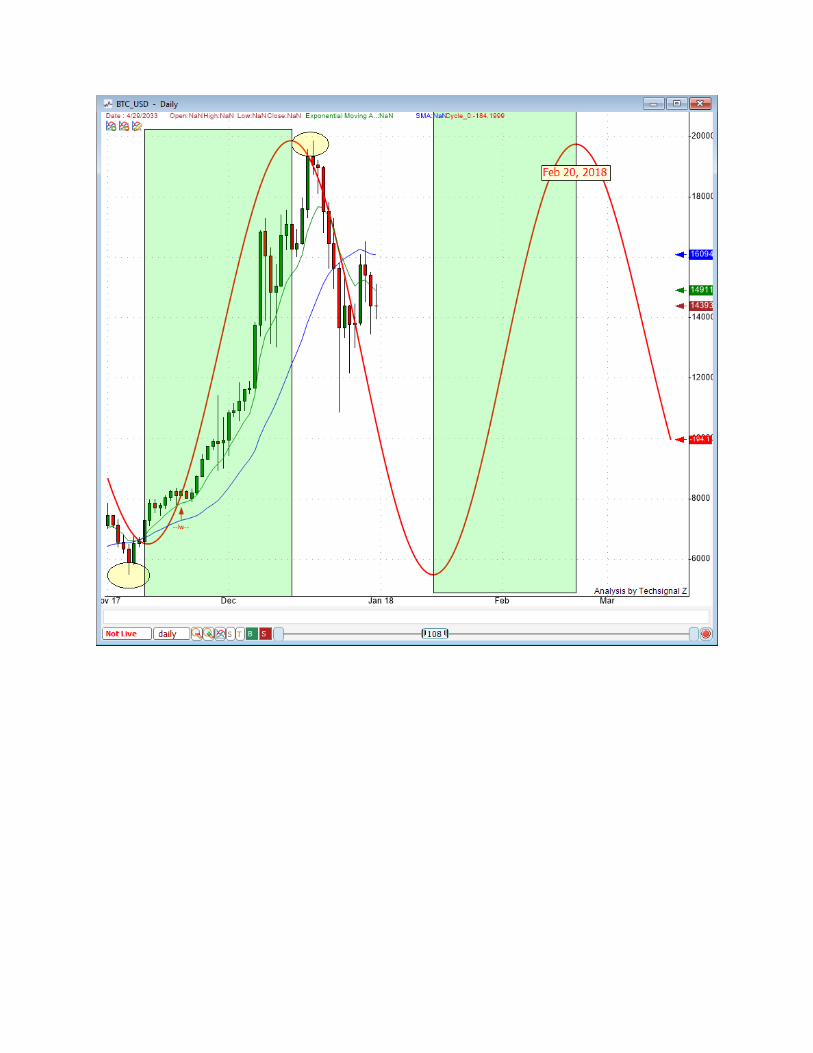
Another way to view the cycles is to combine them into one cycle. It can be quite profitable to trade the cycle by going long at the bottoms and selling at the top, but remember it does not always work. Other indicators should be employed in combination with the cycles. I’ll talk about the indicators I find the best in another report.