birla insurance group april 16 to wait for the next session to come up for discussions in the house....
TRANSCRIPT

April 2016
Index
Secure Fund
Stable Fund
Stable Fund 2
Growth Fund
Growth Fund 2
Money Market Fund
Money Market Fund 2
Income Advantage Fund
Gilt Fund
Bond Fund
Fixed Interest Fund
Fixed Interest Fund 2
Short Term Debt Fund
Short Term Debt Fund 2
Pg 1
Pg 3
Pg 4
Pg 5
Pg 6
Pg 7
Pg 8
Pg 9
Pg 10
Pg 11
Pg 12
Pg 13
Pg 14
Pg 15
Pg 16
Pg 17
Pg 18
Pg 19
as on 29th April 2016
Growth Advantage Fund
Market Outlook
Fund Managers Profile
Fund Performance

Market Update
1
Economy Review
Reserve Bank of India (RBI) in the April policy review meet cut the repo rate by 25 basis points. RBI
announced various measures to increase liquidity in the system. Through the various measures, RBI
mentioned that the liquidity in the system which is currently at negative 1 per cent will be brought close
to neutral. These measures should bring down the interest rates in the economy over medium to long
term.
On the political front, the joint parliament standing committee has cleared the Bankruptcy and
Insolvency code. It is most likely to be discussed in the current parliament session. The GST bill might
have to wait for the next session to come up for discussions in the house.
News on the macro-economic front was good. Index of Industrial Production (IIP) rebounded from 1.5
per cent in January-16 to 2 per cent in February-16 correcting to 0.1 per cent in March-16. Inflation
(CPI) for March-16 was recorded at 4.83 per cent compared to 5.26 per cent in February-16. The
inflation for the month of April-16 was recorded slightly higher at 5.39 per cent. Good set of macro-
economic numbers indicate strength in the economy.
The Indian Met Department (IMD) has forecast above normal monsoons at 106 per cent of the long-
period average for the year. This will be a positive for the rural sector after two consecutive years of
below average monsoons of 88 per cent and 86 per cent rainfall in the year 2014 and 2015
respectively. Monsoons along with government initiatives will boost the rural consumption which is a
key to domestic GDP growth.

Market Update
2
29-Apr-16 31-Mar-16 % ChangeINDEX
Nifty
Sensex
BSE 100
Dow Jones
Hang Seng
Nikkei
Nasdaq
7849.80 7738.40 1.44%
25606.62 25341.86 1.04%
7973.88 7835.45 1.77%
17773.64 17685.09 0.50%
16666.05 16758.67 -0.55%
21067.05 20776.70 1.40%
4775.36 4869.85 -1.94%
NSEBSE
Aug-
15
Apr-
15
May
-15
Jun-
15
Jul-1
5
Sep-
15
Oct
-15
Nov
-15
Dec
-15
Jan-
16
Feb-
16
Mar
-16
Apr-1
6
4000
5000
6000
7000
8000
9000
10000
22000
23000
24000
25000
26000
27000
28000
29000
30000
bps
Perc
enta
ge(%
)
Key Indices
10 year G-Sec
5 Year G-Sec
91 Day T Bill
364 day T-Bill
Call Rates
29-Apr-16 31-Mar-16 % Change
7.44% 7.47% -0.40%
7.44% 7.43% 0.13%
6.81% 7.13% -4.70%
6.88% 7.06% -2.62%
6.48% 6.76% -4.32%
Aug
-15
Apr
-15
Ma
y-15
Jun-
15
Jul-
15
Sep
-15
Oct
-15
Nov
-15
Dec
-15
Jan-
16
Feb
-16
Mar
-16
Apr
-16
15
40
65
90
115
140
4.0
5.0
6.0
7.0
8.0
9.0
5 year AAA Corporate Bond Spread10 Yr G-Sec Yield
Outlook for Equities
Indian equity markets gained around 1.4 per cent in April 2016. FIIs remained net buyers however the net
buying was of much lesser quantum. They bought $556mn in April compared to buying of $3.6bn in
March. Cumulatively, they are net buyers of $1.8bn for the year 2016. Domestic institutions were net
sellers for the month. They sold $351mn in March. Cumulatively, they are net buyers of $731mn for the
year 2016.
Good monsoons along with lower interest rates can provide the much needed boost to the growth in
corporate earnings.
At a 13.8 multiple of FY18 earnings, markets are trading below their 15 year average. With a high
corporate earnings growth, investors in equity funds can expect significant gains in long-term.
Outlook for Debt
The 10 year bond yield moved from 7.47 per cent to 7.44 per cent in the month.
We expect the 10 year G-sec yield to be in the range of 7.3 per cent to 7.5 per cent in near term. The
corporate bond yields are expected to trail the G-sec market with a spread of 40-60 basis points.
Investors in bond funds will gain significantly with bond yields coming down further.

Fund Managers Profile
Mr. Sameer Mistry
Mr. Parin Vora
Mr. Sameer Mistry joined BSLI in January 2009. He has over 17 years of experience in Equity Research and Fund Management. Prior to joining us, he worked as a Fund Manager with Reliance Capital Asset Management, Tata Mutual Fund and SBI Life Insurance. Sameer has done his BE (Electronics & Telecom) as well as an MBA in Finance.
Mr. Sameer Mistry Joint Vice President Investments– -
Mr. Parin S Vora has been with BSLI since October 2007 and is primarily responsible for Fixed Income trading and Fund Management. He has 17 years of experience in Fixed Income Industry and was associated with Birla Sun Life Securities & Mata Securities. Parin has done his MBA in Finance from Welingkar’s Institute of Management and DPMIR from Narsee Monjee Institute of Management studies.
Mr. Parin Vora – Assistant Vice President - Investments
3

Fund Performance as on 29th April 2016
Group Funds Figures in percentage (%)
Disclaimer:This document is issued by BSLI. While all reasonable care has been taken in preparing this document, no responsibility or liability is accepted for errors of fact or for any opinion expressed herein. This document is for information purposes only. It does not constitute any offer, recommendation or solicitation to any person to enter into any transaction or adopt any investment strategy, nor does it constitute any prediction of likely future movements in NAVs. Past performance is not necessarily indicative of future performance. We have reviewed the report, and in so far as it includes current or historical information, it is believed to be reliable though its accuracy or completeness cannot be guaranteed. Neither Birla Sun Life Insurance Company Limited, nor any person connected with it, accepts any liability arising from the use of this document. You are advised to make your own independent judgment with respect to any matter contained herein. The investment risk in investment portfolio is borne by the policyholder. The name of the funds do not in any way indicate their quality, future prospects or returns. The premium paid in unit linked life insurance policies are subject to investment risk associated with capital markets and the unit price of the units may go up or down based on the performance of investment fund and factors influencing the capital market and the policyholder is responsible for his/her decisions Insurance is the subject matter of solicitation.BEWARE OF SPURIOUS PHONE CALLS AND FICTITIOUS/FRAUDULENT OFFERS: IRDA clarifies to public that IRDA or its officials do not involve inactivities like sale of any kind of insurance or financial products nor invest premiums. IRDA does not announce any bonus. Public receiving such phone calls are requested to lodge a police complaint along with details of phone call, number.* Duration for Money Market Instrument and FD’s is considered as "Zero".
4
Secure
Stable
Stable 2
Growth
Growth 2
Growth Advantage
Money Market
Money Market 2
Short Term Debt Fund
Short Term Debt 2
Income Advantage
Gilt Fund
Bond Fund
Fixed Interest
Fixed Interest 2
BSE 100
BSE 100
BSE 100
BSE 100
BSE 100
BSE 100
-
-
-
-
-
-
-
-
-
20%
35%
35%
50%
50%
60%
-
-
-
-
-
-
-
-
-
70%
55%
55%
40%
40%
30%
-
-
100%
100%
85%
-
70%
15%
85%
85%
10%
10%
10%
10%
10%
10%
100%
100%
-
-
15%
-
15%
15%
15%
Crisil Composite Bond Fund Index
Crisil Composite Bond Fund Index
Crisil Composite Bond Fund Index
Crisil Composite Bond Fund Index
Crisil Composite Bond Fund Index
Crisil Composite Bond Fund Index
-
-
Crisil Short Term Bond Fund Index
Crisil Short Term Bond Fund Index
Crisil Composite Bond Fund Index
-
Crisil AAA Long Term Bond Index
Crisil AA Short Term Bond Index
Crisil Composite Bond Fund Index
Crisil Composite Bond Fund Index
Crisil
Crisil Liquid Fund Index
Crisil Liquid Fund Index
Crisil Liquid Fund Index
Crisil Liquid Fund Index
Crisil Liquid Fund Index
Crisil Liquid Fund Index
Crisil Liquid Fund Index
-
-
Crisil Liquid Fund Index
-
Crisil Liquid Fund Index
Crisil Liquid Fund Index
Crisil Liquid Fund Index
Liquid Fund Index ULGF00212/06/01BSLGSECURE109
ULGF00312/06/01BSLGSTABLE109
ULGF02228/11/11BSLGSTABL2109
ULGF00112/06/01BSLGGROWTH109
ULGF01828/11/11BSLGROWTH2109
ULGF01026/11/07BSLIGGRADV109
ULGF00824/08/04BSLIGRMMKT109
ULGF01928/11/11BSLGRMMKT2109
ULGF01322/09/08BSLGSHTDBT109
ULGF02128/11/11BSLGSHTDB2109
ULGF01425/02/10BSLGINCADV109
ULGF00630/05/03BSLIGRGILT109
ULGF00530/05/03BSLIGRBOND109
ULGF00416/07/02BSLGFIXINT109
ULGF01728/11/11BSLGFXINT2109
Absolute
CAGR
Returns Period
Absolute
CAGR
Returns
1 month
3 months
6 months
1 Year
2 Years
3 Years
4 Years
5 Years
Since Inception
1 month
3 months
6 months
1 Year
2 Years
3 Years
4 Years
5 Years
Since Inception
SecureFund
BMStableFund
BMStableFund 2
BMGrowthFund
BMGrowthFund 2
BM
1.18 1.02
3.23 2.92
2.13 2.23
5.00 5.30
10.58 9.35
8.80 7.86
9.59 8.55
8.44 7.79
10.54 8.38
1.35 1.14
3.41 3.13
0.82 1.24
2.99 3.50
10.86 9.15
9.41 8.14
10.13 8.81
8.37 7.49
12.93 9.65
1.48 1.14
3.79 3.13
1.49 1.24
4.31 3.50
11.41 9.15
10.52 8.14
10.72 8.81
- -
11.35 9.24
1.59 1.26
3.42 3.32
-0.46 0.24
1.01 1.68
11.20 8.89
10.08 8.37
10.66 9.04
8.18 7.15
14.23 10.82
1.62 1.26
3.63 3.32
0.12 0.24
2.12 1.68
11.50 8.89
10.74 8.37
11.86 9.04
- -
12.47 9.56
Growth Advantage
BMMoney
Market Fund BM
Money Market Fund 2
BMShort TermDebt Fund
BMShort Term
Debt Fund 2BM
1.68 1.34
3.55 3.44
-1.21 -0.45
-0.29 0.45
11.57 8.69
10.67 8.50
11.28 9.16
8.57 6.89
11.82 5.68
0.59 0.46
1.83 1.76
3.73 3.25
7.86 6.76
8.22 7.24
8.49 7.57
8.79 7.61
8.88 7.72
9.31 6.69
0.60 0.46
1.91 1.76
3.86 3.25
7.97 6.76
8.49 7.24
8.71 7.57
8.85 7.61
- -
8.94 7.72
0.71 0.66
2.15 2.20
3.86 3.50
8.14 7.45
8.60 8.20
8.45 7.85
9.05 8.11
9.13 8.13
8.83 7.45
0.79 0.66
2.40 2.20
4.18 3.50
9.09 7.45
9.68 8.20
9.46 7.85
10.37 8.11
- -
10.34 8.17
Absolute
CAGR
Returns
1 month
3 months
6 months
1 Year
2 Years
3 Years
4 Years
5 Years
Since Inception
Period BMBMGilt Fund
1.05
4.58
3.77
7.62
11.51
7.45
8.91
8.19
7.09
0.93 0.91
2.56 2.59
3.54 3.48
8.11 7.72
9.69 9.30
8.52 7.83
9.63 8.53
9.65 8.47
10.67 8.27
1.01 0.83
3.63 2.56
3.74 3.50
7.78 7.63
10.69 9.55
8.95 7.40
10.14 8.12
10.05 8.10
8.88 6.25
0.94 0.83
3.35 2.56
3.91 3.50
8.20 7.63
10.71 9.55
8.55 7.40
9.58 8.12
10.24 8.10
9.54 7.54
Fixed Interest Fund 2
BM
0.76 0.83
3.16 2.56
4.51 3.50
9.05 7.63
12.49 9.55
11.17 7.40
11.66 8.12
- -
11.66 8.30
Fixed Interest Fund
Bond FundIncome
Advantage Fund BM
Period
Fund NameBenchmark Composition
SFINWeightage Weightage WeightageIndex Index Index

Asset held as on 2 ` 1355.64 cr9th April 2016:
GOVERNMENT SECURITIES: 51.43%
9.2% Government Of India 2030 10.28%
8.6% Government Of India 2028 7.05%
8.83% Government Of India 2023 6.12%
9.23% Government Of India 2043 4.61%
7.16% Government Of India 2023 4.57%
7.88% Government Of India 2030 4.48%
8.17% Government Of India 2044 1.91%
8.4% Government Of India 2024 1.52%
8.13% Government Of India 2022 1.17%
8.13% Government Of India 2045 1.14%
Other Government Securities 8.57%
8.9% Steel Authority Of India Ltd. 2019 1.44%
8.57% Rec Ltd. 2024 1.17%
9.25% PGC. Of India Ltd. 2019 0.88%
9.15% ICICI Bank Ltd. 2022 0.77%
9.25% Reliance Jio Infocomm Ltd 2024 0.76%
9% Tata Capital Fin Services 2017 0.74%
8.39% HDFC Ltd. 2019 0.74%
9.95% Tata Motors Ltd. 2020 0.68%
8.58% Ltd. 2018 0.64%
8.99% Tata Capital Services Ltd 2017 0.63%
Other Corporate Debt 11.41%
Ltd
HDFC
Fin
HDFC Bank Ltd. 1.76%
Infosys Ltd. 1.61%
Reliance Industries Ltd. 1.01%
ITC Ltd. 1.01%
ICICI Bank Ltd. 0.98%
Larsen & Toubro Ltd. 0.89%
HDFC Ltd. 0.67%
Tata Motors Ltd. 0.55%
Sun Pharmaceutical Inds. Ltd. 0.52%
Indusind Bank Ltd. 0.52%
Other Equity 9.90%
RATING PROFILE
Exposure to equities has slightly decreased to 19.42% from 19.58 G-Secs has increased to 51.43% from 50.52% and MMI has slightly decreased to 9.29% from 9.33 on a MOM basis. Over 90% of the debt portfolio remains invested in highest rated instruments.The fund is predominantly invested in large cap stocks and maintains a well diversified equity portfolio.
%
%
Modified Duration: 6.05 years
EQUITY: 19.42%
NAV as on 29th April 2016: 44.36`
CORPORATE DEBT: 19.86%
Maturity Profile
ASSET ALLOCATION
MMI, : 9.29%Deposits, CBLO & Others
Objective:
Strategy:
To build your capital and generate better returns at moderate level of risk, over a medium or long-term period through a balance of investment in equity and debt.
Generate better return with moderate level of risk through active management of fixed income portfolio and focus on creating long term equity portfolio which will enhance yield of composite portfolio with low level of risk appetite.
Fund Snapshot Know the Fund Better
Group Secure FundFund Manager: Sameer Mistry (Equity) & Parin Vora (Debt) | Total Experience: 17 years &17 years
ULGF00212/06/01BSLGSECURE109
Benchmark: BSE 100, Crisil Composite Bond Index & Crisil Liquid Fund IndexFund
SECTORAL ALLOCATION
Portfolio as on Friday, April 29, 2016
Maturity Profile
Date of Inception: 19-Jun-01
AAA
18.16%
72.06%
Sovereign
3.62%AAAA+
5.44%
51.43%G-Secs
MMI, Deposits, CBLO & Others
9.29%
NCD19.86%
Equities19.42%
Secure BM
5
0.52%A+
0.12%A1+
0.08%AA-
0.52%
1.08%
1.19%
1.26%
2.32%
2.63%
3.05%
4.34%
5.14%
6.54%
6.87%
8.41%
8.47%
12.04%
12.84%
23.29%
OTHERS
RETAILING
CONSTRUCTION
DIVERSIFIED
POWER
AGRI RELATED
CEMENT
TELECOMMUNICATION
FINANCIAL SERVICES
PHARMACEUTICALS
AUTOMOBILE
FMCG
CAPITAL GOODS
OIL AND GAS
SOFTWARE / IT
BANKING
7 years & above2 to 7 years
Less than 2years
65.18%
18.12%
16.69%
Apr-
09
Oct
-09
Apr-
10
Oct
-10
Apr-
11
Oct
-11
Apr-
12
Oct
-12
Apr-
13
Oct
-13
Apr-
14
Oct
-14
Apr-
15
Oct
-15
Apr-
16

Asset held as on 2 343.64 cr9th April 2016: `
RATING PROFILE
Over 99% of the debt portfolio remains invested in highest rated instruments.The fund is predominantly invested in large cap stocks and maintains a well diversified equity portfolio.
Modified Duration: 6.21 yearsNAV as on 29th April 2016: ` 59.57
SECTORAL ALLOCATION
Objective:
Strategy:
Helps you to grow your capital through enhanced returns over a medium to long term period through investments in equity and debt instruments, thereby providing a good balance between risk and return.
To earn capital appreciation by maintaining diversified equity portfolio and seek to earn regular return on fixed income portfolio by active management resulting in wealth creation for policyholders.
Fund Snapshot Know the Fund Better
Group Stable FundFund Manager: 17 years
Sameer Mistry (Equity) & Parin Vora (Debt) | Total Experience: 17 years &
ULGF00312/06/01BSLGSTABLE109
Benchmark: BSE 100, Crisil Composite Bond Index & Crisil Liquid Fund IndexFund
Portfolio as on Friday, April 29, 2016
6
Date of Inception: 31-Aug-01
MMI, Deposits, CBLO & Others: 8.62%
NCD14.38%
AAA23.94%
Sovereign74.93%
AA+1.03%
34.02%
Equities
ASSET ALLOCATION
Maturity Profile
Stable BM
42.98%G-Secs
MMI, Deposits, CBLO & Others
8.62%
GOVERNMENT SECURITIES: 42.98%
9.23% Government Of India 2043 9.65%
8.33% Government Of India 2026 7.64%
8.83% Government Of India 2023 6.12%
8.28% Government Of India 2032 3.83%
8.79% Government Of India 2021 3.45%
8.6% Government Of India 2028 3.09%
8.08% Government Of India 2022 1.86%
8.3% Government Of India 2040 1.52%
8.4% Government Of India 2024 1.51%
7.16% Government Of India 2023 1.42%
Other Government Securities 2.88%
8.65% REC Ltd. 2019 2.76%
10.1% PGC Of India Ltd. 2017 1.49%
8.9% LIC Housing Finance Ltd. 2020 1.48%
9.25% Housing Finance Ltd. 2023 1.39%
9.25% Reliance Jio Infocomm Ltd 2024 1.11%
9.4% NABARD 2016 0.88%
9.61% Power Finance Corpn. Ltd. 2021 0.77%
9.33% NABARD 2017 0.74%
8.95% Bajaj Finance Ltd. 2020 0.59%
10.15% Kotak Mahindra Prime Ltd. 2017 0.59%
Other Corporate Debt 2.59%
LIC
HDFC Bank Ltd. 3.11%
Infosys Ltd. 2.84%
Reliance Industries Ltd. 1.79%
ITC Ltd. 1.76%
ICICI Bank Ltd. 1.72%
Larsen & Toubro Ltd. 1.49%
HDFC Ltd. 1.18%
Tata Motors Ltd. 0.96%
Sun Pharmaceutical Inds. Ltd . 0.89%
Indusind Bank Ltd. 0.86%
Other Equity 17.42%
EQUITY: 34.02%CORPORATE DEBT: 14.38%
AA0.11%
0.57%
1.08%
1.13%
1.31%
2.40%
2.62%
3.02%
4.37%
5.22%
6.39%
6.91%
8.24%
8.30%
12.24%
12.94%
23.27%
OTHERS
RETAILING
CONSTRUCTION
DIVERSIFIED
POWER
AGRI RELATED
CEMENT
TELECOMMUNICATION
FINANCIAL SERVICES
PHARMACEUTICALS
AUTOMOBILE
CAPITAL GOODS
FMCG
OIL AND GAS
SOFTWARE / IT
BANKING
7 years & above2 to 7 years
Less than 2years
60.21%
22.21%
17.58%
Apr-
09
Oct
-09
Apr-
10
Oct
-10
Apr-
11
Oct
-11
Apr-
12
Oct
-12
Apr-
13
Oct
-13
Apr-
14
Oct
-14
Apr-
15
Oct
-15
Apr-
16

Asset held as on 2 1.17 cr9th April 2016: `
RATING PROFILE
Over 100% of the debt portfolio remains invested in highest rated instruments.The fund is predominantly invested in large cap stocks and maintains a well diversified equity portfolio.
Modified Duration: 6.73 yearsNAV as on 29th April 2016: ` 16.09
SECTORAL ALLOCATION
Objective:
Strategy:
Helps you to grow your capital through enhanced returns over a medium to long term period through investments in equity and debt instruments, thereby providing a good balance between risk and return.
To earn capital appreciation by maintaining diversified equity portfolio and seek to earn regular return on fixed income portfolio by active management resulting in wealth creation for policyholders.
Fund Snapshot Know the Fund Better
Group Stable Fund 2Fund Manager: 17 years
Sameer Mistry (Equity) & Parin Vora (Debt) | Total Experience: 17 years &
ULGF02228/11/11BSLGSTABL2109
Benchmark: BSE 100, Crisil Composite Bond Index & Crisil Liquid Fund IndexFund
Portfolio as on Friday, April 29, 2016
7
Date of Inception: 28-Nov-11
MMI, Deposits, CBLO & Others: 4.39%
NCD9.90%
33.90%
Equities
ASSET ALLOCATION
Maturity Profile
Stable 2 BM
51.80%G-Secs
GOVERNMENT SECURITIES: 51.80%
9.23% Government Of India 2043 14.69%
8.4% Government Of India 2024 13.37%
9.15% Government Of India 2024 12.06%
7.16% Government Of India 2023 11.68%
10.7% IRFC. Ltd. 2023 9.90% HDFC Bank Ltd. 3.07%
Infosys Ltd. 2.84%
Reliance Industries Ltd. 1.78%
ITC Ltd. 1.72%
ICICI Bank Ltd. 1.72%
Larsen & Toubro Ltd. 1.63%
HDFC Ltd. 1.00%
Tata Motors Ltd. 0.96%
Sun Pharmaceutical Inds. Ltd. 0.92%
Indusind Bank Ltd. 0.90%
Other Equity 17.34%
EQUITY: 33.90%CORPORATE DEBT: 9.90%
MMI, Deposits, CBLO & Others
4.39%
Sovereign83.95%
AAA16.05%
1.05%
1.18%
1.28%
2.18%
2.77%
3.27%
4.61%
4.76%
6.47%
7.25%
8.22%
8.84%
12.49%
13.52%
22.11%
RETAILING
OTHERS
CONSTRUCTION
POWER
AGRI RELATED
CEMENT
TELECOMMUNICATION
FINANCIAL SERVICES
PHARMACEUTICALS
AUTOMOBILE
FMCG
CAPITAL GOODS
OIL AND GAS
SOFTWARE / IT
BANKING
7 years & above
Less than 2 years
97.21%
2.79%
Ap
r-1
2
Oct
-12
Ap
r-1
3
Oct
-13
Ap
r-1
4
Oct
-14
Ap
r-1
5
Oct
-15
Ap
r-1
6

Asset held as on 2 450.37 cr9th April 2016: `
GOVERNMENT SECURITIES: 33.18%
8.83% Government Of India 2023 8.14%
8.33% Government Of India 2026 4.04%
8.6% Government Of India 2028 2.83%
9.53% State Government Of Gujrat 2024 2.41%
9.23% Government Of India 2043 2.03%
8.2% Government Of India 2022 1.94%
8.79% Government Of India 2021 1.88%
8.28% Government Of India 2032 1.38%
8.4% Government Of India 2024 1.16%
8.17% Government Of India 2044 1.15%
Other Government Securities 6.22%
9.34% REC Ltd. 2024 2.20%
8.7% Power Finance Corpn. Ltd. 2020 1.90%
8.55% Power Finance Corpn. Ltd. 2021 1.81%
NABARD 2017 0.85%
9.02% REC Ltd. 2022 0.83%
10.15% Kotak Mahindra Prime Ltd. 2017 0.78%
9.23% LIC Housing Finance Ltd. 2022 0.69%
9.57% Housing Finance Ltd. 2017 0.67%
10.3% Tata Motors Ltd. 2018 0.46%
9.9% Cholamandalam Investment & Finance Co. Ltd. 2016 0.44%
Other Corporate Debt 1.84%
LIC
HDFC Bank Ltd. 4.39%
Infosys Ltd. 4.03%
Reliance Industries Ltd. 2.54%
ITC Ltd. 2.52%
ICICI Bank Ltd. 2.45%
Larsen & Toubro Ltd. 2.06%
HDFC Ltd. 1.67%
Tata Motors Ltd. 1.36%
Sun Pharmaceutical Inds. Ltd. 1.35%
Indusind Bank Ltd. 1.31%
Other Equity 24.88%
RATING PROFILE
Over 97% of the debt portfolio remains invested in highest rated instruments.The fund is predominantly invested in large cap stocks and maintains a well diversified equity portfolio.
Modified Duration: 5.65 years
EQUITY: 48.57%
NAV as on 29th April 2016: ` 70.42
CORPORATE DEBT: 12.50%
Maturity Profile
ASSET ALLOCATION
MMI, Deposits, CBLO & Others: 5.75%
SECTORAL ALLOCATION
Objective:
Strategy:
To achieve optimum balance between growth and stability to provide long-term capital appreciation with balanced level of risk by investing in fixed income securities and high quality equity security.
To ensure capital appreciation by simultaneously investing into fixed income securities and maintaining diversified equity portfolio. Active fund management is carried out to enhance policy holder’s wealth in long run.
Fund Snapshot Know the Fund Better
Benchmark: BSE 100, Crisil Composite Bond Index & Crisil Liquid Fund IndexFund
Group Growth Fund
ULGF00112/06/01BSLGGROWTH109
Portfolio as on Friday, April 29, 2016Date of Inception: 31-Aug-01
Fund Manager: 17 years
Sameer Mistry (Equity) & Parin Vora (Debt) | Total Experience: 17 years &
G-Secs
33.18%
48.57%
Equities
NCD
5.75%
MMI, Deposits, CBLO & Others12.50%
AAA
24.52%
72.64%
Sovereign
AA
0.97%
AA+
1.87%
Gr. Growth BM
Fund Snapshot
8
0.60%
1.06%
1.07%
1.10%
1.97%
2.45%
3.21%
4.54%
5.25%
6.65%
6.87%
8.19%
8.44%
12.22%
13.10%
23.27%
OTHERS
RETAILING
DIVERSIFIED
CONSTRUCTION
POWER
AGRI RELATED
CEMENT
TELECOMMUNICATION
FINANCIAL SERVICES
PHARMACEUTICALS
AUTOMOBILE
CAPITAL GOODS
FMCG
OIL AND GAS
SOFTWARE / IT
BANKING
7 years & above2 to 7 years
Less than 2years
61.12%
24.54%
14.34%
Ap
r-0
9
Oct
-09
Ap
r-1
0
Oct
-10
Ap
r-1
1
Oct
-11
Ap
r-1
2
Oct
-12
Ap
r-1
3
Oct
-13
Ap
r-1
4
Oct
-14
Ap
r-1
5
Oct
-15
Ap
r-1
6
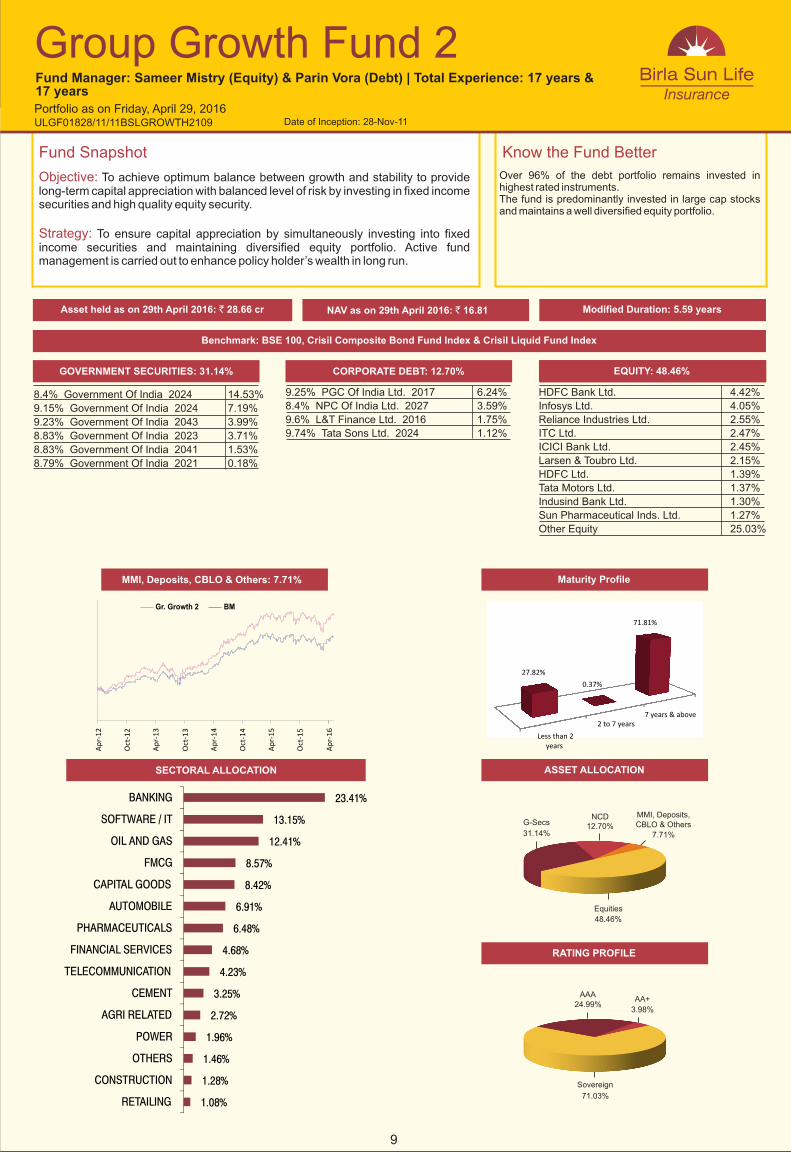
Asset held as on 2 28.66 cr9th April 2016: `
GOVERNMENT SECURITIES: 31.14%
8.4% Government Of India 2024 14.53%
9.15% Government Of India 2024 7.19%
9.23% Government Of India 2043 3.99%
8.83% Government Of India 2023 3.71%
8.83% Government Of India 2041 1.53%
8.79% Government Of India 2021 0.18%
9.25% PGC Of India Ltd. 2017 6.24%
8.4% NPC Of India Ltd. 2027 3.59%
9.6% L&T Finance Ltd. 2016 1.75%
9.74% Tata Sons Ltd. 2024 1.12%
HDFC Bank Ltd. 4.42%
Infosys Ltd. 4.05%
Reliance Industries Ltd. 2.55%
ITC Ltd. 2.47%
ICICI Bank Ltd. 2.45%
Larsen & Toubro Ltd. 2.15%
HDFC Ltd. 1.39%
Tata Motors Ltd. 1.37%
Indusind Bank Ltd. 1.30%
Sun Pharmaceutical Inds. Ltd. 1.27%
Other Equity 25.03%
RATING PROFILE
Over 96% of the debt portfolio remains invested in highest rated instruments.The fund is predominantly invested in large cap stocks and maintains a well diversified equity portfolio.
Modified Duration: 5.59 years
EQUITY: 48.46%
NAV as on 29th April 2016: ` 16.81
CORPORATE DEBT: 12.70%
Maturity Profile
ASSET ALLOCATION
MMI, Deposits, CBLO & Others: 7.71%
SECTORAL ALLOCATION
Objective:
Strategy:
To achieve optimum balance between growth and stability to provide long-term capital appreciation with balanced level of risk by investing in fixed income securities and high quality equity security.
To ensure capital appreciation by simultaneously investing into fixed income securities and maintaining diversified equity portfolio. Active fund management is carried out to enhance policy holder’s wealth in long run.
Fund Snapshot Know the Fund Better
Group Growth Fund 2
ULGF01828/11/11BSLGROWTH2109
Benchmark: BSE 100, Crisil Composite Bond Index & Crisil Liquid Fund IndexFund
Portfolio as on Friday, April 29, 2016
9
Date of Inception: 28-Nov-11
Fund Manager: 17 years
Sameer Mistry (Equity) & Parin Vora (Debt) | Total Experience: 17 years &
G-Secs
31.14%
48.46%
Equities
NCD
7.71%
MMI, Deposits, CBLO & Others12.70%
AAA
24.99%
71.03%
Sovereign
AA+
3.98%
Gr. Growth 2 BM
1.08%
1.28%
1.46%
1.96%
2.72%
3.25%
4.23%
4.68%
6.48%
6.91%
8.42%
8.57%
12.41%
13.15%
23.41%
RETAILING
CONSTRUCTION
OTHERS
POWER
AGRI RELATED
CEMENT
TELECOMMUNICATION
FINANCIAL SERVICES
PHARMACEUTICALS
AUTOMOBILE
CAPITAL GOODS
FMCG
OIL AND GAS
SOFTWARE / IT
BANKING
7 years & above2 to 7 years
Less than 2years
71.81%
0.37%
27.82%
Ap
r-1
2
Oct
-12
Ap
r-1
3
Oct
-13
Ap
r-1
4
Oct
-14
Ap
r-1
5
Oct
-15
Ap
r-1
6

Asset held as on 2 41.09 cr9th April 2016: `
GOVERNMENT SECURITIES: 27.45%
8.33% Government Of India 2026 6.32%
9.23% Government Of India 2043 5.57%
8.83% Government Of India 2023 3.88%
9.2% Government Of India 2030 2.70%
8.6% Government Of India 2028 2.59%
8.83% Government Of India 2041 2.14%
7.8% Government Of India 2021 1.61%
8.2% Government Of India 2022 0.67%
7.49% Government Of India 2017 0.61%
8.15% Government Of India 2022 0.37%
Other Government Securities 0.99%
8.57% REC Ltd. 2024 2.49%
9.05% Petronet LNG Ltd. 2019 2.48%
8.95% HDFC Bank Ltd. 2022 0.74%
9.6% L&T Finance Ltd. 2016 0.61%
8.7% Power Finance Corpn. Ltd. 2020 0.50%
11.95% HDFC Ltd. 2018 0.26%
HDFC Bank Ltd. 5.27%
Infosys Ltd. 4.73%
Reliance Industries Ltd. 3.04%
ICICI Bank Ltd. 2.92%
ITC Ltd. 2.90%
Larsen & Toubro Ltd. 2.47%
HDFC Ltd. 2.00%
Tata Motors Ltd. 1.63%
Sun Pharmaceutical Inds. Ltd. 1.58%
Indusind Bank Ltd. 1.52%
Other Equity 29.84%
RATING PROFILE
91% of the debt portfolio remains invested in highest rated instruments.The fund is predominantly invested in large cap stocks and maintains a well diversified equity portfolio.
Modified Duration: 6.63 years
EQUITY: 57.91%
NAV as on 29th April 2016: ` 25.00
CORPORATE DEBT: 7.08%
Maturity Profile
ASSET ALLOCATION
Gr. Advantage BM
SECTORAL ALLOCATION
Objective:
Strategy:
The Objective of the fund is to provide blend of fixed return by investing in debt & money market instruments and capital appreciation by predominantly investing in equities of fundamentally strong and large blue chip companies.
The Strategy of the fund is to build and actively manage a welldiversified equity portfolio of value & growth driven stocks by following a research-focused investment approach. While appreciating the high risk associated with equities, the fund would attempt to maximize the riskreturnpay-off for the long-term advantage of the policyholders. The nonequity portion of the fund will be invested in high rated debt and money market instruments and fixed deposits.
Fund Snapshot Know the Fund Better
Group Growth Advantage Fund
ULGF01026/11/07BSLIGGRADV109
Benchmark: BSE 100, Crisil Composite Bond Index & Crisil Liquid Fund IndexFund
Portfolio as on Friday, April 29, 2016
10
Date of Inception: 18-Feb-08
Fund Manager: 17 years
Sameer Mistry (Equity) & Parin Vora (Debt) | Total Experience: 17 years &
57.91%
Equities
G-Secs
27.45%
MMI, Deposits, CBLO & Others
7.08
NCD7.55
Sovereign
79.51%
AAA
11.56%AA+
8.93%
MMI, Deposits, CBLO & Others: 7.55%
0.58%
1.06%
1.07%
1.25%
2.12%
2.68%
3.17%
4.50%
5.23%
6.56%
6.89%
8.21%
8.22%
12.31%
12.87%
23.29%
OTHERS
DIVERSIFIED
RETAILING
CONSTRUCTION
POWER
AGRI RELATED
CEMENT
TELECOMMUNICATION
FINANCIAL SERVICES
PHARMACEUTICALS
AUTOMOBILE
CAPITAL GOODS
FMCG
OIL AND GAS
SOFTWARE / IT
BANKING
7 years & above2 to 7 years
Less than 2years
64.14%
17.65% 18.21%
Ap
r-1
1
Oct
-11
Ap
r-1
2
Oct
-12
Ap
r-1
3
Oct
-13
Ap
r-1
4
Oct
-14
Ap
r-1
5
Oct
-15
Ap
r-1
6

Asset held as on 2 116.78 cr9th April 2016: `
100% of the fund is invested in highest rated instruments.The fund continues to maintain very low maturity profile.
NAV as on 29th April 2016: ` 26.83
Objective:
Strategy:
The primary objective of this BSLI Fund Option is to provide reasonable returns, at a high level of safety and liquidity for capital conservation for the Policyholder
The strategy of this BSLI Fund Option is to make judicious investments in high quality debt and money market instruments to protect capital of the Policyholder with very low level of risk.
Fund Snapshot Know the Fund Better
Group Money Market FundFund Manager: Parin Vora | Total Experience: 17 years
ULGF00824/08/04BSLIGRMMKT109
Benchmark: Crisil Liquid Fund Index
Portfolio as on Friday, April 29, 2016
11
Maturity Profile
Less than 2 years
100.00%
ASSET ALLOCATION
Date of Inception: 30-Mar-05
NCD
9.43%
MMI, Deposits, CBLO & Others: 90.57%
MM BM
MMI, Deposits, CBLO & Others
90.57%
RATING PROFILE
AAA
10.84%
A1+
89.16%
9.65% Kotak Mahindra Prime Ltd. 2016 7.71%
10.18% LIC Housing Finance Ltd. 2016 1.72%
CORPORATE DEBT: 9.43%
Ap
r-0
9
Oct
-09
Ap
r-1
0
Oct
-10
Ap
r-1
1
Oct
-11
Ap
r-1
2
Oct
-12
Ap
r-1
3
Oct
-13
Ap
r-1
4
Oct
-14
Ap
r-1
5
Oct
-15
Ap
r-1
6

Asset held as on 2 0.26 cr9th April 2016: `
100% of the fund is invested in highest rated instruments.The fund continues to maintain very low maturity profile.
NAV as on 29th April 2016: ` 14.60
Objective:
Strategy:
The primary objective of this BSLI Fund Option is to provide reasonable returns, at a high level of safety and liquidity for capital conservation for the Policyholder
The strategy of this BSLI Fund Option is to make judicious investments in high quality debt and money market instruments to protect capital of the Policyholder with very low level of risk.
Fund Snapshot Know the Fund Better
Group Money Market Fund 2Fund Manager: Parin Vora | Total Experience: 17 years
ULGF01928/11/11BSLGRMMKT2109
Benchmark: Liquid Fund IndexCrisil
Portfolio as on Friday, April 29, 2016
12
Maturity Profile
Less than 2 years
100.00%
ASSET ALLOCATION
Date of Inception: 28-Nov-11
MMI, Deposits, CBLO & Others: 74.25%
MM BM
MMI, Deposits, CBLO & Others
74.25%
G-Secs
25.75%
RATING PROFILE
GOVERNMENT SECURITIES: 25.75%
Government Of India 2016 25.75%
Sovereign
45.10%
A1+
54.90%
Ap
r-1
2
Oct
-12
Ap
r-1
3
Oct
-13
Ap
r-1
4
Oct
-14
Ap
r-1
5
Oct
-15
Ap
r-1
6

Exposure to corporate debt has increased to 55.54% from 54.25% and MMI has decreased to 44.46% from 45.75% on a MOM basis. Over 80% of the fund is invested in highest rated instruments.
CORPORATE DEBT: 55.54%
10.5% AU Financiers (India) Limited 2019 7.69%
9.15% Larsen & Toubro Ltd. 2019 7.04%
9.7% NABARD 2016 6.09%
9.1% HDFC Bank Ltd. 2022 5.80%
10.05% Can Fin Homes Ltd. 2017 4.98%
10.18% LIC Housing Finance Ltd. 2016 4.57%
9.04% REC Ltd. 2019 3.92%
8.5% IRFC Corpn. Ltd. 2020 2.73%
8.99% Tata Capital Fin Services Ltd 2017 2.67%
8.64% PGC. Of India Ltd. 2025 1.96%
Other Corporate Debt 8.09%
NAV as on 29th April 2016: ` 18.69
MMI, Deposits, CBLO & Others: 44.46%
Benchmark: Short Term Bond Fund IndexCrisil
Objective:
Strategy:
The objective of the fund is to provide capital preservation at a high level of safety & liquidity through judicious investments in high quality short‐term debt instruments.
To actively manage the fund by building a portfolio of fixed income instruments with short term duration. The fund will invest in government securities, high rated corporate bonds, good quality money market instruments and other fixed income securities. The quality & duration of the assets purchased would aim to minimize the credit risk and liquidity risk of the portfolio. The fund will maintain reasonable level of liquidity.
Fund Snapshot Know the Fund Better
Group Short Term Debt Fund
ULGF01322/09/08BSLGSHTDBT109
Asset held as on 2 26.32 cr9th April 2016: ` Modified Duration: 1.45 years
Portfolio as on Friday, April 29, 2016
13
Maturity Profile
ASSET ALLOCATION
Date of Inception: 10-Dec-08
Fund Manager: Parin Vora | Total Experience: 17 years
MMI, Deposits, CBLO & Others
44.46%
NCD
55.54%
RATING PROFILE
AAA
69.71%
BMShort Term Debt
A1+
8.51%A+
12.40%
AA+
7.42%
7 years & above2 to 7 years
Less than 2years
2.15%
38.14%
59.71%
Sovereign
1.96%
Ap
r-0
9
Oct
-09
Ap
r-1
0
Oct
-10
Ap
r-1
1
Oct
-11
Ap
r-1
2
Oct
-12
Ap
r-1
3
Oct
-13
Ap
r-1
4
Oct
-14
Ap
r-1
5
Oct
-15
Ap
r-1
6

Exposure to corporate debt has decreased to 77.64% from 78.13% and MMI has increased to 22.36% from 21.87% on a MOM basis. Over 90% of the fund is invested in highest rated instruments.
CORPORATE DEBT: 77.64%
8.49% NHPC Ltd. 2016 7.44%
9.7% NABARD 2016 7.43%
9.64% PGC. Of India Ltd. 2018 6.40%
9.04% REC Ltd. 2019 6.37%
9.15% Larsen & Toubro Ltd. 2019 6.36%
9.3% HDFC Ltd. 2017 5.83%
10.18% LIC Housing Finance Ltd. 2016 5.37%
9.85% State Bank Of India 2016 5.37%
8.4% NPC Of India Ltd. 2027 3.39%
8.84% PGC. Of India Ltd. 2016 3.11%
Other Corporate Debt 20.56%
NAV as on 29th April 2016: ` 15.45
MMI, Deposits, CBLO & Others: 22.36%
Benchmark: Short Term Bond Fund IndexCrisil
Objective:
Strategy:
The objective of the fund is to provide capital preservation at a high level of safety & liquidity through judicious investments in high quality short‐term debt instruments.
To actively manage the fund by building a portfolio of fixed income instruments with short term duration. The fund will invest in government securities, high rated corporate bonds, good quality money market instruments and other fixed income securities. The quality & duration of the assets purchased would aim to minimize the credit risk and liquidity risk of the portfolio. The fund will maintain reasonable level of liquidity.
Fund Snapshot Know the Fund Better
Group Short Term Debt Fund 2
ULGF02128/11/11BSLGSHTDB2109
Asset held as on 2 24.27 cr9th April 2016: ` Modified Duration: 1.30 years
Portfolio as on Friday, April 29, 2016
14
Maturity Profile
ASSET ALLOCATION
Date of Inception: 28-Nov-11
Fund Manager: Parin Vora | Total Experience: 17 years
RATING PROFILE
AAA
85.45%
BMShort Term Debt 2
AA
2.57%
AA+
5.13%
A1+
4.28%
MMI, Deposits, CBLO & Others
22.36%
NCD
77.64%
A+2.57%
7 years & above2 to 7 years
Less than 2years
5.52%
34.46%
60.03%
Ap
r-1
2
Oct
-12
Ap
r-1
3
Oct
-13
Ap
r-1
4
Oct
-14
Ap
r-1
5
Oct
-15
Ap
r-1
6

Asset held as on 2 67.89 cr9th April 2016: `
97% of the fund remains invested in highest rated instruments.
Modified Duration: 6.08 yearsNAV as on 29th April 2016: ` 17.44
9.34% REC Ltd. 2024 5.50%
9.9% HDFC Ltd. 2021 4.68%
9.37% Power Finance Corpn. Ltd. 2024 3.15%
9.15% Export Import Bank Of India 2022 3.10%
9.25% PGC of India Ltd. 2019 3.07%
8.65% India Infradebt Ltd 2026 2.97%
9.25% Reliance Jio Infocomm Ltd 2024 2.28%
9.02% REC Ltd. 2022 2.15%
9.25% PGC. of India Ltd. 2020 1.93%
9.25% of India Ltd. 2019 1.91%
Other Corporate Debt 8.54%
PGC.
CORPORATE DEBT: 39.28%
Benchmark: Crisil Composite Bond index & Crisil Liquid Fund IndexFund
Objective:
Strategy:
To provide capital preservation and regular income, at a high level of safety over a medium term horizon by investing in high quality debt instruments.
To actively manage the fund by building a portfolio of fixed income instruments with medium term duration. The fund will invest in government securities, high rated corporate bonds, high quality money market instruments and other fixed income securities. The quality of the assets purchased would aim to minimize the credit risk and liquidity risk of the portfolio. The fund will maintain reasonable level of liquidity.
Fund Snapshot Know the Fund Better
Group Income Advantage Fund
ULGF01425/02/10BSLGINCADV109
Portfolio as on Friday, April 29, 2016
Maturity Profile
ASSET ALLOCATIONRATING PROFILE
GOVERNMENT SECURITIES: 54.94%
8.33% Government Of India 2026 17.13%
9.23% Government Of India 2043 16.85%
8.83% Government Of India 2023 7.83%
8.2% Government Of India 2022 3.22%
7.5% Government Of India 2034 3.02%
8.08% Government Of India 2022 1.58%
8.15% Government Of India 2022 1.56%
8.4% Government Of India 2024 1.53%
8.3% Government Of India 2023 0.87%
7.8% Government Of India 2021 0.82%
Other Government Securities 0.52%
MMI, Deposits, CBLO & Others: 5.78%
15
Date of Inception: 23-Mar-10
Fund Manager: Parin Vora | Total Experience: 17 years
NCD
39.28% 5.78%
MMI, Deposits, CBLO & Others
54.94%G-Secs
Gr. Inc Adv BM
58.31%
Sovereign
AAA
38.54% AA+
3.14%
7 years & above2 to 7 years
Less than 2years
66.70%
28.70%
4.60%
Ap
r-1
2
Oct
-12
Ap
r-1
3
Oct
-13
Ap
r-1
4
Oct
-14
Ap
r-1
5
Oct
-15
Ap
r-1
6

Asset held as on 2 12.49 cr9th April 2016: `
Exposure to G-Secs has decreased to 96.84% from 97.48% and MMI has increased to 3.16% from 2.52% on a MOM basis.
Modified Duration: 9.11 yearsNAV as on 29th April 2016: ` 22.77
Objective:
Strategy:
The fund aims to deliver safe and consistent returns over along-term period by investing in Government Securities.
Active fund management at very low level of risk by having entire exposure to government securities & money market instruments, maintaining medium term duration of the portfolio to achieve capital conservation.
Fund Snapshot Know the Fund Better
Group Gilt Fund
ULGF00630/05/03BSLIGRGILT109
MMI, Deposits, CBLO & Others: 3.16%
Maturity Profile
ASSET ALLOCATION
Portfolio as on Friday, April 29, 2016
RATING PROFILE
16
Sovereign100.00%
Date of Inception: 28-Apr-04
Fund Manager: Parin Vora | Total Experience: 17 years
MMI, Deposits, CBLO & Others
3.16%
96.84%G-Secs
GOVERNMENT SECURITIES: 96.84%
9.23% Government Of India 2043 48.08%
8.83% Government Of India 2041 10.99%
9.15% Government Of India 2024 6.94%
9.2% Government Of India 2030 6.23%
8.83% Government Of India 2023 5.96%
8.3% Government Of India 2042 5.08%
8.28% Government Of India 2027 4.15%
8.15% Government Of India 2022 4.10%
8.2% Government Of India 2023 2.69%
8.23% Government Of India 2027 2.62%
7 years & above2 to 7 years
Less than 2years
95.28%
4.22%
0.51%
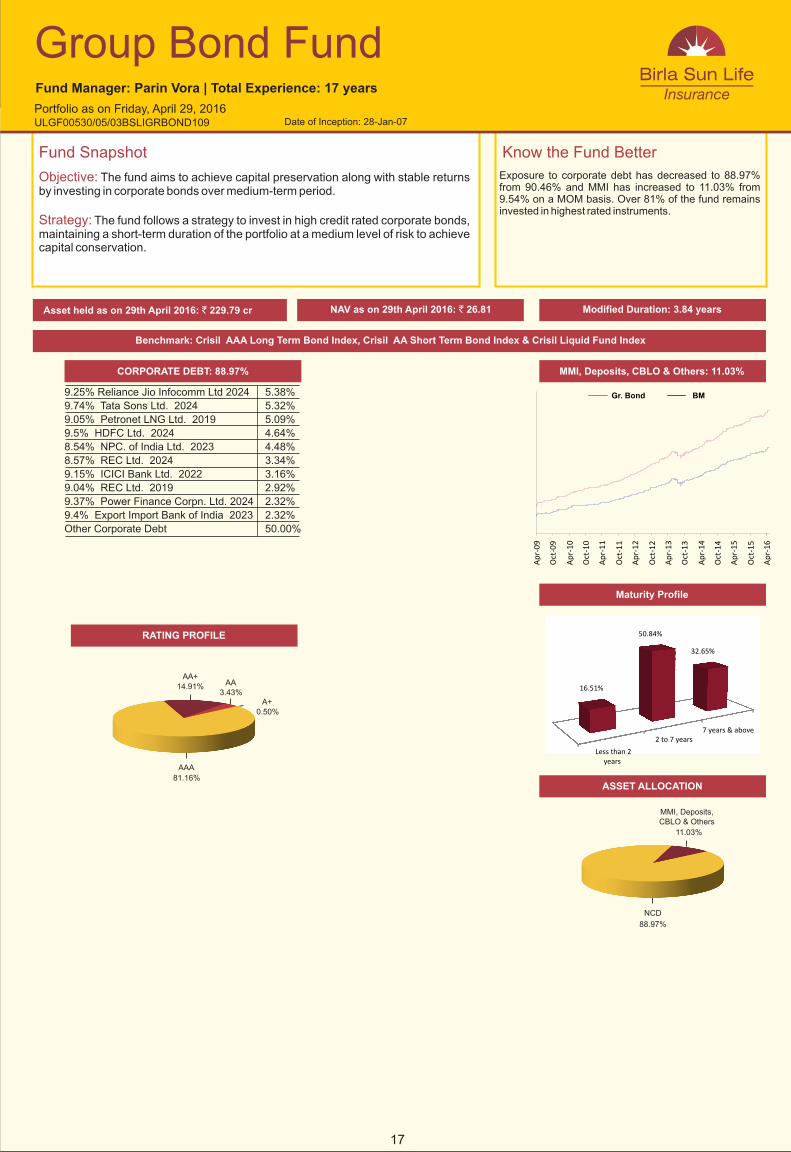
Asset held as on 2 229.79 cr9th April 2016: `
Exposure to corporate debt has decreased to 88.97% from 90.46% and MMI has increased to 11.03% from 9.54% on a MOM basis. Over 81% of the fund remains invested in highest rated instruments.
Modified Duration: 3.84 yearsNAV as on ` 26.8129th April 2016:
Objective:
Strategy:
The fund aims to achieve capital preservation along with stable returns by investing in corporate bonds over medium-term period.
The fund follows a strategy to invest in high credit rated corporate bonds, maintaining a short-term duration of the portfolio at a medium level of risk to achieve capital conservation.
Fund Snapshot Know the Fund Better
Group Bond Fund
ULGF00530/05/03BSLIGRBOND109
CORPORATE DEBT: 88.97%
9.25% Reliance Jio Infocomm Ltd 2024 5.38%
9.74% Tata Sons Ltd. 2024 5.32%
9.05% Petronet LNG Ltd. 2019 5.09%
9.5% HDFC Ltd. 2024 4.64%
8.54% NPC. of India Ltd. 2023 4.48%
8.57% REC Ltd. 2024 3.34%
9.15% ICICI Bank Ltd. 2022 3.16%
9.04% REC Ltd. 2019 2.92%
9.37% Power Finance Corpn. Ltd. 2024 2.32%
9.4% Export Import Bank of India 2023 2.32%
Other Corporate Debt 50.00%
MMI, Deposits, CBLO & Others: 11.03%
Benchmark: AAA Long Term Bond Index, AA Short Term Bond Index & Liquid Fund IndexCrisil Crisil Crisil
Maturity Profile
Portfolio as on Friday, April 29, 2016
17
ASSET ALLOCATION
RATING PROFILE
Date of Inception: 28-Jan-07
Fund Manager: Parin Vora | Total Experience: 17 years
3.43%AA14.91%
AA+
AAA
81.16%
0.50%A+
NCD
88.97%
MMI, Deposits, CBLO & Others
11.03%
Gr. Bond BM
7 years & above2 to 7 years
Less than 2years
32.65%
50.84%
16.51%
Ap
r-0
9
Oct
-09
Ap
r-1
0
Oct
-10
Ap
r-1
1
Oct
-11
Ap
r-1
2
Oct
-12
Ap
r-1
3
Oct
-13
Ap
r-1
4
Oct
-14
Ap
r-1
5
Oct
-15
Ap
r-1
6

Asset held as on 2 914.91 cr9th April 2016: ` Modified Duration: 6.44 yearsNAV as on ` 31.4129th April 2016:
Objective:
Strategy:
The Fixed Interest Fund, with full exposure in debt market instrument, aims to achieve value creation at low risk over a long-term horizon by investing into high quality fixed interest securities.
The strategy is to actively manage the fund at a medium level of risk by having entire exposure to government securities, corporate bonds maintaining medium to long-term duration of the portfolio to achieve capital conservation.
Fund Snapshot Know the Fund Better
Group Fixed Interest Fund
ULGF00416/07/02BSLGFIXINT109
GOVERNMENT SECURITIES: 53.97%
9.2% Government Of India 2030 9.05%
7.88% Government Of India 2030 8.85%
8.6% Government Of India 2028 6.97%
8.4% Government Of India 2024 6.83%
8.17% Government Of India 2044 5.77%
7.72% Government Of India 2025 5.50%
8.13% Government Of India 2045 2.82%
8.83% Government Of India 2041 2.79%
8.33% Government Of India 2026 2.53%
8.96% State Government Of
Maharashtra 2024 1.15%
Other Government Securities 1.70%
8.75% HDFC Ltd. 2021 5.42%
9.24% LIC Housing Finance Ltd. 2024 2.64%
9.55% Hindalco Industries Ltd. 2022 2.51%
9.25% Reliance Jio Infocomm Ltd 2024 1.55%
8.68% LIC Housing Finance Ltd. 2020 1.49%
10.5% AU Financiers (India) Ltd 2019 1.27%
9.55% Hindalco Industries Ltd. 2022 1.26%
9.37% Power Finance Corpn. Ltd. 2024 1.17%
9.4% Export Import Bank Of India 2023 1.17%
8.4% PGC. of India Ltd. 2024 1.11%
Other Corporate Debt 11.19%
CORPORATE DEBT: 30.78%
Maturity Profile
ASSET ALLOCATION
Benchmark: Crisil Composite Bond Fund index & Crisil Liquid Fund Index
MMI, Deposits, CBLO & Others: 15.26%
Portfolio as on Friday, April 29, 2016
18
RATING PROFILE
Date of Inception: 18-Nov-02
Fund Manager: Parin Vora | Total Experience: 17 years
FIF BM
53.97%G-Secs
MMI, Deposits, CBLO & Others
15.26%NCD
30.78%
Exposure to corporate debt has increased to 30.78% from 26.28%, G-Secs has decreased to 53.97% from 65.73% and MMI has increased to 15.26% from 7.99% on a MOM basis. Over 93% of the fund remains invested in highest rated instruments.
A+1.50%
0.47%
4.45%AA-
AA
AAA
29.08%
63.68%
Sovereign
0.82%AA+
7 years & above2 to 7 years
Less than 2years
69.43%
19.69%
10.88%
Ap
r-0
9
Oct
-09
Ap
r-1
0
Oct
-10
Ap
r-1
1
Oct
-11
Ap
r-1
2
Oct
-12
Ap
r-1
3
Oct
-13
Ap
r-1
4
Oct
-14
Ap
r-1
5
Oct
-15
Ap
r-1
6

Asset held as on 2 4.10 cr9th April 2016: ` Modified Duration: 6.17 yearsNAV as on ` 16.2929th April 2016:
Objective:
Strategy:
The Fixed Interest Fund, with full exposure in debt market instrument, aims to achieve value creation at low risk over a long-term horizon by investing into high quality fixed interest securities.
The strategy is to actively manage the fund at a medium level of risk by having entire exposure to government securities, corporate bonds maintaining medium to long-term duration of the portfolio to achieve capital conservation.
Fund Snapshot Know the Fund Better
Group Fixed Interest Fund 2
ULGF01728/11/11BSLGFXINT2109
GOVERNMENT SECURITIES: 87.87%
8.2% Government Of India 2025 81.46%
7.88% Government Of India 2030 6.42%
8.99% Tata Capital Financial Services
Limited 2017 7.34%
CORPORATE DEBT: 7.34%
Maturity Profile
ASSET ALLOCATION
Benchmark: Crisil Composite Bond index & Crisil Liquid Fund IndexFund
MMI, Deposits, CBLO & Others: 4.79%
Portfolio as on Friday, April 29, 2016
19
RATING PROFILE
Date of Inception: 28-Nov-11
Fund Manager: Parin Vora | Total Experience: 17 years
FIF 2 BM
87.87%G-Secs
MMI, Deposits, CBLO & Others
4.79%
NCD7.34%
Exposure to corporate debt has slightly decreased to 7.34% from 7.38%, G-Secs has decreased to 87.87% from 88.40% and MMI has slightly increased to 4.79% from 4.23% on a MOM basis. Over 92% of the fund remains invested in highest rated instruments.
AA+
7.71%
92.29%
Sovereign
7 years & above
Less than 2 years
89.06%
10.94%
Ap
r-1
2
Oct
-12
Ap
r-1
3
Oct
-13
Ap
r-1
4
Oct
-14
Ap
r-1
5
Oct
-15
Ap
r-1
6