biostatistics: a revolutionary approach for optimization
TRANSCRIPT

© 2019 JETIR September 2019, Volume 6, Issue 9 www.jetir.org (ISSN-2349-5162)
JETIR1907D83 Journal of Emerging Technologies and Innovative Research (JETIR) www.jetir.org 588
Biostatistics: A Revolutionary Approach For
Optimization Of New Drug Formulation And
Development 1Patel Shivani P.*, 2Vyas Tulsi H., 3Detholia Krunal K.,
1Research Scholar, 2Assistant Professor (Pharmaceutics), 3Assistant Professor(Pharmaceutics)
1Department of Pharmaceutics
Smt.S.M. Shah Pharmacy College, Mahemdabad, Gujarat -387130.
ABSTRACT: Design of Experiments (DoE) have been widely used to understand the effects of
multidimensional and interactions of input factors on the output responses of pharmaceutical products and
analytical methods. It is always important before beginning experimentation to determine the objective of an
experiment, and this is no different with DoE. Identifying objectives helps focus a team on its specific aims
(scientific understanding of the task/problem in hand) over a period of time. It has been suggested that DoE
can offer returns that are four to eight times greater than the cost of running the experiments in a fraction of
the time that it would take to run one-factor-at-a-time experiments .This review shows about the principles
and applications of the most common screening designs, such as two-level full factorial, fractionate factorial,
and Plackett-Burman designs; and optimization designs, such as three-level full factorial, central composite
designs (CCD), and Box-Behnken designs. DoE studies in support of QbD are often a delicate balance
between delivering defined, high-quality products and meeting predetermined time, labor, and financial
constraints. Statistical terms and procedure were found in nearly all of the research articles published. Thus,
pharmacy education should aim to provide current and future pharmacists with an understanding of the
common statistical terms and procedures identified to facilitate the appropriate appraisal and consequential
utilization of information.
KEYWORDS: Design of Experiments (DoE), Statistics, Biostatistics, Experimental designs., Applications
of Statistics and DoE.
1.INTRODUCTION
In the pharmaceutical industry, the ultimate goal of a pharmaceutical development method is to produce top
quality, safe and efficacious drug products to be used in humans. A pharmaceutical development process
consists of various phases of development, as well as non-clinical development and clinical development. The
pharmaceutical development process, involving drug discovery, formulation, laboratory development, animal
studies and clinical development is a continual, length, and costly process. This protracted and costly process
is necessary to assure the safety and efficacy of the drug product underneath investigation. When the drug is
approved, the USFDA conjointly needs that the drug product be tested for identity, strength (potency), quality,
purity, and stability before are often free for human use. [1]
Statistics:
It is that the science that deals with assortment, classification and tabulation of numerical facts because the
basis for clarification of explanation, description and comparison of phenomenon. The process of
converting data into information requires a special approach known as statistics. ‘Statistic’ means that a
measured or counted fact or piece of the information, stated as a figure such as height of one person, birth
weight of a baby etc.
Biostatistics:
It is the branch of statistics involved with mathematical facts and data related to biological events. It’s the
science that helps in managing medical uncertainties. Biostatistics covers applications and contributions not
solely from health, medicines and, nutrition however additionally from fields such as biological science,
biology, medical specialty, and plenty of others. It’s principally consists of assorted steps like generation of
hypothesis, assortment of information, and application of statistical analysis (applied math). Any science

© 2019 JETIR September 2019, Volume 6, Issue 9 www.jetir.org (ISSN-2349-5162)
JETIR1907D83 Journal of Emerging Technologies and Innovative Research (JETIR) www.jetir.org 589
desires precision for its development. Precision is all the a lot of vital once it involves health sciences. For
precision; facts, observations or measurements need to be expressed in figures.
Medicine is basically an empirical science. It depends on observations and not on theories or theorems. As a
part of clinical practice or research or analysis we have a tendency to upset several observations, that once
consistently organized referred as Data.
1.2 HISTORY: [3]
Historical proof of the growing importance of statistics to the pharmaceutical industry
may be found within the ultimate creation of a Biopharmaceutical Section within the American Statistical
Association (ASA). [2] Sir Francis Galton is known as the Father of Biostatistics.
The first person to apply statistical methods to the study of human variation and inheritance
of intelligence, and introduced the employment of Questionnaires and Surveys for collecting data on human
communities, which he required for clan and biographical works and for his anthropometric studies.
Year Event
1550 W. Edwards Deming was concerned with design of experiment as well as statistical
methods.
1920 Ronald A. Fisher conducted a research in agriculture with the aim of increasing yield
of crop in the UK.
1929 A huge paper on application of statistics was published in physiology journal by DUNN
1935 a book on DOE, in which Ronald A. Fisher explained how valid conclusion could be
drawn from the experiment in presence of nuisance factors. He analyzed presence of
nuisance factors with fluctuation of weather conditions (temperature, rainfall, soil
condition)
1937 15 articles on statistical methods by Austin Bradford Hill were published in book form.
1948 RCT of streptomycin for pulmonary TB., was published in which Bradford Hill has a
key influence .
1952 Growth of statistics in medicine
1982 Growth of statistics in medicine increase by 8 folds. table 1-history of statistics
1.3 WHY USE STATISTICS?
1. "Credibility – the power to talk showing intelligence is extremely valued, use of numbers in a coherent way
is essential. “
2. Enable us to make informed, intelligent and sometimes predictive decisions
e.g. quality testing, predicting diseases, forecasting, prediction, diagnosis, treatment effectiveness
As there are two branches of statistics:
i) Descriptive statistics: Strategies of manufacturing quantitative summaries of information in biological
sciences. Helpful in identifying distinctive patterns and it ends up in hypothesis generation.
ii) Inferential statistics: Strategies of creating generalizations about a few larger group based on information
about a sample of that group in biological sciences. Useful in distinguish true variations from random variation
as well as allows for hypothesis testing.
Difference between Traditional methods and Adaptive statistical methods: [1]
Traditional methods Adaptive statistical methods
Pharmaceutical development is empirical and
univariate experiment can be performed.
Pharmaceutical development is systematic and
multivariate experiments can be performed
Manufacturing process is fixed Manufacturing process is adjustable
In –process testing for go/no-go; offline
analysis with slow response.
PAT utilized for feedback and feed forward at
real time.

© 2019 JETIR September 2019, Volume 6, Issue 9 www.jetir.org (ISSN-2349-5162)
JETIR1907D83 Journal of Emerging Technologies and Innovative Research (JETIR) www.jetir.org 590
Primary means of product quality control is
based on batch data.
Overall quality control strategy is based on
desired product performance (safety and
efficacy)
Control strategy based on intermediate and
end product testing
Control strategy is based on risk of shifted
upstream and real-time release upstream.
Lifecycle management reactive to problems
(SUPAC)
Lifecycle management :continual
improvement enabled within design space.
Requires more no. of trials Less no. of trials required
Doesn’t identify significant and non-
significant variables
Identify significant and non-significant
variables
Wastage of man ,money,materials,time and
still result is not sure.
Full utilization of man ,money ,materials ,time
and thus optimized result is obtained
It doesn’t help in improving quality of product
and process.
It can identifies factors which improves quality
of product and process.
table 2-comparision of methods
1.4APPLICATION OF BIOSTATISTICS [4]
1) AS A SCIENCE
In Physiology and Anatomy
To define what is normal or healthy in a population.
To notice the boundaries of normality in variables like weight and pulse rate etc. in a population to find the
difference between means and proportions of normal at two places or in different periods.
Eg: The mean height of boys in Gujarat is a smaller amount than the mean height in geographic region.
whether this difference is due to chance or a natural variation or because of some other factors such as better
nutrition playing a part, has to be decided.
To find the correlation between two variables X and Y like height and weight.
In pharmacology:
To find the action of drug – a drug is given to animals or humans to see whether the changes produced are
due to the drug or by chance
To compare the action of two different drugs or two successive dosages of the same drug.
To find the relative potency of a new drug with respect to a standard drug.
In medicine:
To compare the effectiveness of a specific drug, operation or line of treatment – for this, the percentage cured,
relieved or died within the experiment and control groups, is compared and difference due to chance or
otherwise is found by applying statistical techniques.
To find an association between two attributes such as cancer and smoking or filariasis and social class –an
appropriate test is applied for this purpose.
To identify signs and symptoms of a disease or syndrome.
Cough in typhoid is found by chance and fever is found in almost every case.
In epidemiological studies:
The role of causative factors is statistically tested.
Deficiency of iodine as an important cause of goiter in a community is confirmed only after comparing the
incidence of goiter cases before and after giving iodized salt.
Modern medicine:
For decades, Biostatistics has played an integral role in modern medicine in everything from analyzing data
to determining if a treatment will work to developing clinical trials.
The University of North Carolina's Gillings School of Global Public Health defines biostatistics as "the
science of obtaining, analyzing and interpreting data in order to understand and improve human health.
2) USES OF STATISTICS IN DENTAL SCIENCE:
To find the statistical difference between means of two groups. Ex: Mean plaque scores of two groups.
To assess the state of oral health in the community and to determine the availability and utilization of dental
care facilities.

© 2019 JETIR September 2019, Volume 6, Issue 9 www.jetir.org (ISSN-2349-5162)
JETIR1907D83 Journal of Emerging Technologies and Innovative Research (JETIR) www.jetir.org 591
To indicate the fundamental factors underlying the state of oral health by diagnosing the community and find
solutions to such problems.
To verify success or failure of specific oral health care programs or to evaluate the program action.
To promote oral health legislation and in creating administrative standards for oral health care delivery.
3) IN GENETICS
Statistics and Human Genetics are twin subjects, having grown with the century together, and there are many
connections between the two.
Some fundamental aspects in particular the concept of Analysis of Variance, first arose in Human Genetics,
while statistical and probabilistic methods are now central to many aspects of analysis of questions is human
genetics.
The most common areas where one can find an extensive applications of statistical methods in human genetics
is
* Human Genome Project
* Linkage Analysis
* Sequencing
4) IN ENVIRONMENTAL SCIENCE
Environmental statistics covers a number of types of study:
Baseline studies to document the present state of an environment to provide background in case of unknown
changes in the future.
Targeted studies to describe the likely impact of changes being planned or of accidental occurrences.
Regular monitoring to attempt to detect changes in the environment
5) IN NUTRITION
Over the past 2 decades, there have been revolutionary developments in life science technologies
characterized by high throughput, high efficiency, and rapid computation.
Nutritionists now have the advanced methodologies for the analysis of DNA, RNA, protein, low molecular-
weight metabolites, as well as access to bioinformatics databases
Biostatistics, which can be defined as the process of making scientific inferences from data that contain
variability, has historically played an integral role in advancing nutritional sciences.
2.DOE - AN EFFECTIVE METHODOLOGY TO IMPROVE THE INFORMATION CONTENT IN
DEVELOPMENT OF NEW FORMULATION: [3]
EXPERIMENT: Attest or Series of tests where the experimenter makes purposeful changes to input
variables of a method or system so that we can observe or identify the reasons for changes within the output
responses.
DESIGN OF EXPERIMENTS: is concerned with the planning and conduct of experiments to analyzes the
resulting data so that we obtain valid and objectives conclusions.
DoE permits for multiple input factors to be manipulated, determining their effect on a desired output
(response). By manipulating multiple inputs at the same time, DOE can identify important interactions that
may be missed when experimenting with one factor at a time. All possible combinations can be investigated
(full factorial) or only a portion of the possible combinations (fractional factorial).
A strategically planned and executed experiment might give an excellent deal of information about the effect
on a response variable due to one or more factors. Several experiments involve holding certain factors constant
and altering the levels of another variable. This "one factor at a time" (OFAT) approach to process knowledge
is, however, inefficient in comparison with changing factor levels simultaneously.
Upward trends in DoE implementation are as below [5]
1) Changing R&D environment
2) Technological advances
3) Changing Drug Substance Regulatory Environment
4) Increased Implementation of Green Chemistry

© 2019 JETIR September 2019, Volume 6, Issue 9 www.jetir.org (ISSN-2349-5162)
JETIR1907D83 Journal of Emerging Technologies and Innovative Research (JETIR) www.jetir.org 592
The DoE approach can be more efficient than that achieved by the traditional approach of varying one
factor/variable at a time. If the OFAT approach was used to investigate the influence of three factors on a
reaction (temperature, concentration, and reagent stoichiometry), eight experiments would be required; but
more information could be generated through four experiments in a half-factorial DoE is possible. While
running a DoE may seem daunting initially, since the number of experiments to be run is defined at the
beginning, unlike the traditional approach.
PRINCIPLE OF DoE [12]
Blocking: When randomizing a factor is impossible or too costly, blocking lets you restrict randomization by
carrying out all of the trials with one setting of the factor and then all the trials with the other setting.
Randomization: Refers to the order in which the trials of an experiment are performed. A randomized
sequence helps eliminate effects of unknown or uncontrolled variables.
Replication: Repetition of a complete experimental treatment, including the setup.
2.1 COMPONENTS OF EXPERIMENTAL DESIGN
There are three aspects of the process that are analyzed by a designed experiment:
Factors, or inputs to the process. Factors can be classified as either controllable or uncontrollable variables.
In this case, the controllable factors are the ingredients for the cake and the oven that the cake is baked in. The
controllable variables will be referred to throughout the material as factors. Note that the ingredients list was
shortened for this example - there could be many other ingredients that have a significant bearing on the end
result (oil, water, flavoring, etc).
Likewise, there could be other types of factors, such as the mixing method or tools, the sequence of mixing,
or even the people involved. People are generally considered a Noise Factor (see the glossary) - an
uncontrollable factor that causes variability under normal operating conditions, but we can control it during
the experiment using blocking and randomization. Potential factors can be categorized using the Fishbone
Chart (Cause & Effect Diagram).
Levels, or settings of each factor in the study. Examples include the oven temperature setting and the particular
amounts of sugar, flour, and eggs chosen for evaluation.
Response, or output of the experiment. In the case of cake baking, the taste, consistency, and appearance of
the cake are measurable outcomes potentially influenced by the factors and their respective levels.
Experimenters often desire to avoid optimizing the process for one response at the expense of another. For
this reason, important outcomes are measured and analyzed to determine the factors and their settings that
will provide the best overall outcome for the critical-to-quality characteristics - both measurable variables and
assessable attributes.
EXAMPLE: Consider the following diagram of a cake-baking process
fig.1- components of experimental design showing example of cake –baking process

© 2019 JETIR September 2019, Volume 6, Issue 9 www.jetir.org (ISSN-2349-5162)
JETIR1907D83 Journal of Emerging Technologies and Innovative Research (JETIR) www.jetir.org 593
2.2 EXPERIMENTAL DESIGNS FOR ANALYSING AND OPTIMIZING PRODUCTS AND
PROCESSES:
In development of new drug formulation various statistical based Methodology is used to get optimized
formula so that one can identify the factors which can improve quality of product as well as process. By using
the optimization techniques variability get reduced in the results and thus it is useful. There are many methods
for determination:
Optimization techniques: [8,12,13]
1) Factorial design
2) Plackett Burman design
3) Box Behnken design
4) Response surface methodology
5) Central composite design
1) Factorial design:
Factorial experiment is an experiment whose design consist of two or more factors each with different possible
values or levels.
Factorial design technique introduced by FISHER in 1926. factors can be quantitative (numerical) or they are
qualitative. they may be names rathers than numbers like method I, site A, present or absent. Factorial design
depends on independent variables for development of new formulation. Also depends on levels as well as
codings.
fig.2-full factorial design and fractional factorial design
There are 3 types of levels
1) low (-1)
2) medium (0)
3) high (+1).
TYPES OF FACTORIAL DESIGN
a) Full factorial design
b) Fractional factorial design
a) FULL FD: A design in which every setting of every factor appear with setting of every other factors is full factorial
design. Advantages – a minimum no. of trials per independent variable is required and they form the basis for
several other design like fractional FD. Study the effect of a lower number of design variables independently from
each other, including interaction terms. The only design that allows for categorical variables with 3 or more levels (no.
of variable: 2-9) Eg. Two level full FD 22: It consist of two independent factors and two levels of each independent factors.
And for this 22 factorial design is an empirical model of mathematics which gives factor response relationship
using equation:
Y=B0+B1X1+B2X2+B12X12
b) FRACTIONAL FACTORIAL DESIGN: In full FD as a number of factors or levels increases the no. of experiments required exceeds to unmanageable
levels. In such cases, the number of experiment can be reduced systemically and resulting design is called
fractional FD. Depending on the number of variables choose the study lower order effects independently from each
other, or create a screening design aimed at finding the most important main effects among many. (no. of variable :3-
13) Types of fractional FD:
homogenous fractional FD

© 2019 JETIR September 2019, Volume 6, Issue 9 www.jetir.org (ISSN-2349-5162)
JETIR1907D83 Journal of Emerging Technologies and Innovative Research (JETIR) www.jetir.org 594
mixed levels fractional FD
Box hunter method.
Fractional FD is useful when no. of factors are 5 or more. it assumes all the higher order interaction which
have negligible effect on the response than main factors so only a fraction of interaction is considered for
optimization. And the disadvantage is large amount of error occurs because of only a fraction is considered
in optimization.
2) Plackett Burman design:
Placket and Burman statistics were developed in early 20 th century. It is also known as screening or hadamard
design. This design represents each factor at 2 levels and no. of experiments is a multiple of 4 when the no.
of factors are >3 it becomes difficult to develop. By using this techniques no. of factors are reduced by
identifying the significant factors affecting the response. This is a design of 2 level for examining parameters
is K runs where K =N+1.
Economical alternative to Fractional factorial design, studies main effects only. Complex interaction effect
(no. of variable 8-35)
table 3- design represents factors and no. of runs
Advantages:
It reduces the no. of experiments in logical monitor.
Selection of significant variables which affect most in design.
Take less time for research
Predict the extension i.e,. can predict what happen if such changes are made within that particular system.
Limitations:
Risky process
Improper conclusion drawn due to confusion
Only 2 levels can be studied
Assumes that the interaction terms are negligible.
3) Box –Behnken design(BBD)
fig.3- box –behnken design(bbd)
BBD was derived by George Box and Donald Behnken in 1960.it is one experimental design or response
surface design. It is one quadratic response surface approach. This is RSM design is independent, rotatable or
nearly rotatable and quadratic design.
In this set of points are lying at the midpoint of each edge of multi-dimensional cube and center point replicates
(n=3). When factors are higher and so complexity at their BBD is ideal for optimization.
RUN A B C D E F G H I J K
1 + - + - - - + + + - +
2 + + - + - - - + + + -
3 - + + - + - - - + + +
4 + - + + - + - - - + +
5 + + - + + - + - - - +
6 + + + - + + - + - - -
7 - + + + - + + - + - -
8 - - + + + - + + - + -
9 - - - + + + - + + - +
10 + - - - + + + - + + -
11 - + - - - + + + - + +
12 - - - - - - - - - - -

© 2019 JETIR September 2019, Volume 6, Issue 9 www.jetir.org (ISSN-2349-5162)
JETIR1907D83 Journal of Emerging Technologies and Innovative Research (JETIR) www.jetir.org 595
An alternative to central composite designs, when the optimum response is not located at the extremes of the
experimental region and when previous results from a factorial design are not available. All design variables
must be continuous (no. of variables =3-6).
Prerequisite of BBD:
Minimum 3 factors for operability
3 levels for each factors.
Advantages: requires fewer experimental runs so less time used. Economical
Example: 33 designing and matrixing express using mathematical model
Y=B0 ……………………………….... Constsant
+B1X1+B2X2+B3X3 ………………………. Main effect
+B12X12 +B13X13 +B23X23+B123X123………Interaction
+ B11X12+ B22 X2
2 +B33X32………………. Quadratic effect
+E …………………………………………Error
4) Response surface methodology (RSM)
RSM is a statistical technique that is useful for developing, improving and optimizing process.
It also establishes robustness of that product or process.it is extension of other statistical approaches, like
regression .it should be applied after screening and can help in finding global optimums when non-linear terms
are used. “RSM is a statistical method that uses quantitative data from appropriate experiments to determine
and simultaneously solve multivariate equations.”
fig-4. response surface with no curvature fig.5 response surface with curvature
Types of response surfaces:
a) 3D response surface
b) Contour response surface.
Use of RSM:
To determine factor levels that will simultaneously satisfy a set of desired specification.
To determine optimum correlation of factors that yields desired response and describe response near optimum.
Also used in finding conditions for process stability –insensitive spot.
Limitation: Critical factors which not always correctly defined. No statistical principles used. Over reliance
on computer.
5) Central Composite Design(CCD)
A Box-Wilson central composite design, commonly called a central composite design.it consist of center
point, star point, factorial points.
fig.6 central composite design(CCD)
Distance from center of design space to factorial points ±1 unit for each factor. Distance from center of design
space to star point is ±α. CCD always contains twice as many star points as there are factors in the design.
star points represent new extremes values factorial point represents intermediate points ±1.
© 2019 JETIR September 2019, Volume 6, Issue 9 www.jetir.org (ISSN-2349-5162)
JETIR1907D83 Journal of Emerging Technologies and Innovative Research (JETIR) www.jetir.org 596
Example:
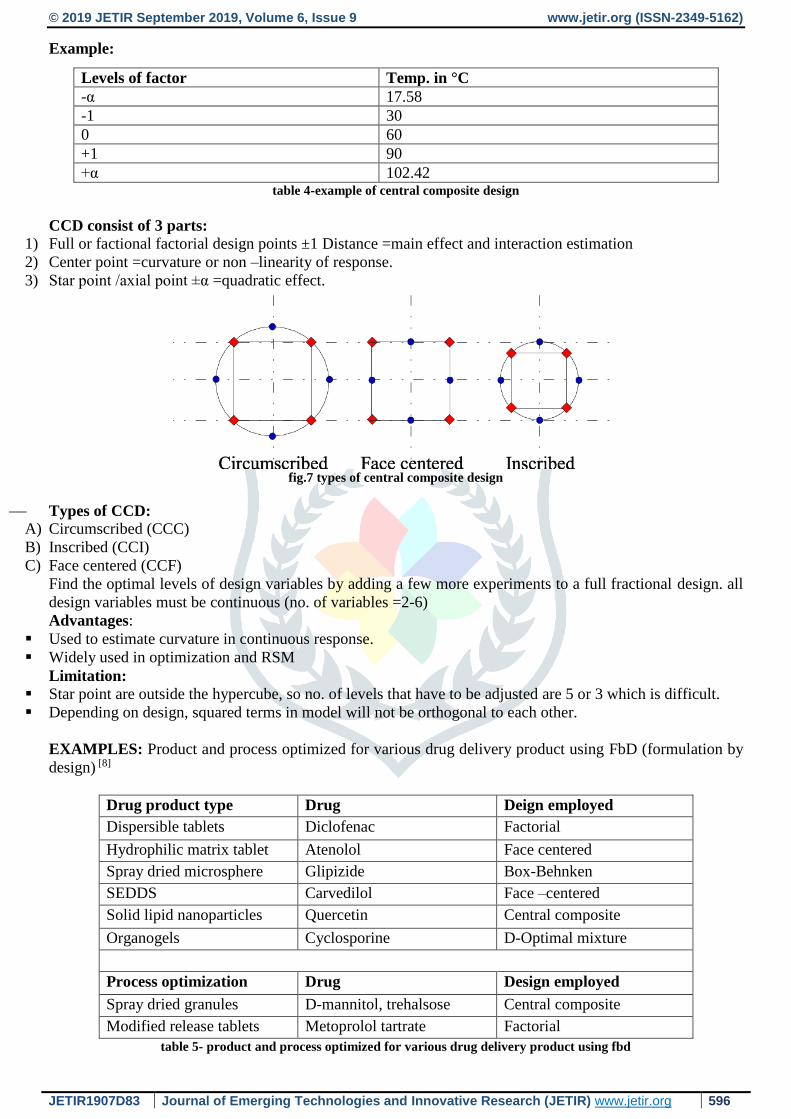
table 4-example of central composite design
CCD consist of 3 parts:
1) Full or factional factorial design points ±1 Distance =main effect and interaction estimation
2) Center point =curvature or non –linearity of response.
3) Star point /axial point ±α =quadratic effect.
fig.7 types of central composite design
Types of CCD: A) Circumscribed (CCC)
B) Inscribed (CCI)
C) Face centered (CCF)
Find the optimal levels of design variables by adding a few more experiments to a full fractional design. all
design variables must be continuous (no. of variables =2-6)
Advantages:
Used to estimate curvature in continuous response.
Widely used in optimization and RSM
Limitation:
Star point are outside the hypercube, so no. of levels that have to be adjusted are 5 or 3 which is difficult.
Depending on design, squared terms in model will not be orthogonal to each other.
EXAMPLES: Product and process optimized for various drug delivery product using FbD (formulation by
design) [8]
Drug product type Drug Deign employed
Dispersible tablets Diclofenac Factorial
Hydrophilic matrix tablet Atenolol Face centered
Spray dried microsphere Glipizide Box-Behnken
SEDDS Carvedilol Face –centered
Solid lipid nanoparticles Quercetin Central composite
Organogels Cyclosporine D-Optimal mixture
Process optimization Drug Design employed
Spray dried granules D-mannitol, trehalsose Central composite
Modified release tablets Metoprolol tartrate Factorial
table 5- product and process optimized for various drug delivery product using fbd
Levels of factor Temp. in °C
-α 17.58
-1 30
0 60
+1 90
+α 102.42

© 2019 JETIR September 2019, Volume 6, Issue 9 www.jetir.org (ISSN-2349-5162)
JETIR1907D83 Journal of Emerging Technologies and Innovative Research (JETIR) www.jetir.org 597
2.3 APPLICATION OF DOE IN QBD
1) Recently, DoE has been used in the rational development and optimization of analytical methods. Culture
media composition, mobile phase composition, flow rate, time of incubation are examples of input factors
(independent variables) that may the screened and optimized using DoE. Several output responses (dependent
variables), such as retention time, resolution between peaks, microbial growth, among other responses were
found in literature.
An advantage of DoE approach over the OFAT experimentation relies on the elucidation of interactions
between input factors. [7]
Experimental design Independent variables (X) Dependent variables (Y)
Fractional factorial design Indomethacin concentration,
stabilizer type,
stabilizer concentration,
processing temperature,
and homogenization pressure
Particle size distribution, zeta
potential, and physical form
(XRD) of Nano suspensions
Fractional factorial design and
central composite design
Inlet air temperature, air flow
rate and binder spray rate
during the sprying phase
Moisture of granules and flow
through an orifice of the
granules obtained by fluid bed
granulation
3-level factorial
design
Span 60: Sodium lauryl sulfate
ratio, organic
: aqueous phase volume ratio,
and polymer
concentration
Emulsion phase stability,
viscosity, and
Conductivity
Box-Behnken
design
Sodium alginate percentage,
chitosan percentage,
and calcium chloride
percentage
Maximum drug encapsulation,
particle size and
drug release of cefpodoxime
proxetil chitosan alginate
beads
2-level factorial
design
Amount of oil (capmul MCM),
amount of surfactant (tween
80), and amount of cosolvent
(Transcutol HP)
Globule size, span, equilibrium
solubility
of cilostazol, zeta potential, and
dissolution efficiency at 30 min
of lipid based
nanoemulsifying cilostazol
Multiple response
optimization
Concentrations of
imidazolidinyl urea,
methyparaben, propyl paraben,
and EDTA in
cosmetic formulations
Slopes from microbial curves of
Burkholderiacepacia,
Pseudomonas aeruginosa,
Staphylococcus aureus,
Candida albicans, and
Aspergillus brasiliensis
Central composite
design
Percentage of HPMC,
percentage of glycerol, and
drying temperature
Thickness, weight, tensile
strength, elongation at
break, young’s modulus, and
disintegration time
of oroldispersible films table 6-varoius experimental designs with independent and dependent factors

© 2019 JETIR September 2019, Volume 6, Issue 9 www.jetir.org (ISSN-2349-5162)
JETIR1907D83 Journal of Emerging Technologies and Innovative Research (JETIR) www.jetir.org 598
2) DoE application in medicinal product development and pharmaceutical processes. [6]
Area
Application Applied DOE TYPE
Oral drug delivery Tablet formulation
development
i) Multivariate design (fractional factorial
design in 14 variables, 214–9 design, 35
experiments)
ii) Multivariate design simplex
optimization by Modde Optimizer
iii) Fractional factorial designs (two
studies) design space definition using a
simplified Bayesian Monte Carlo
simulation
Injection Formulation of parenteral
nutrition (development)
D-Optimal experimental design
Nano pharmaceutics Solid lipid nanoparticles for
inhalation (process
development )
Two-level full factorial design center
points and three repetitions for each level.
Pharmaceutical
process
Freeze drying of injectable Design space calculation
Test methods Adhesion test ( for patches ) Randomized response surface five factors
38 runs .
table 7-applications of doe in field of pharmacy
3. CASE STUDY 1:
PROBLEM: optimize the given liposomal formulation on 2 levels of factors concentration of soya lecithin
and concentration of DPPS find out whether there is interaction impact or not and which of the given lipid is
more entrapment efficiency. [14]
Concentration of soya lecithin = 10,20
DPPS =15,40
Encapsulation efficiency=50%,80%,60%,90%
SOLUTION:
a) Selection of design:
Independent factors =2
Levels =2
Design=22
b) Equation: Y=B0+B1X1+B2X2+B12X12
c) X1=Concentration of soya lecithin
X2= Concentration of DPPS
X12= interactive effect
Where,
B0 =intercept
B1 , B2, B12= coefficient of independent variables
X1, X2=independent variables
Y=response /dependent variable.
d) Design
Runs Y B1 B2 B12 X1 X2 X12
1 50 -50 -50 50 30 10 0
2 80 80 -80 -80
3 60 -60 60 -60
4 90 90 90 90
AVERAGE 70 15 5 0 30 10 0 table 8- factorial design of case study 1

© 2019 JETIR September 2019, Volume 6, Issue 9 www.jetir.org (ISSN-2349-5162)
JETIR1907D83 Journal of Emerging Technologies and Innovative Research (JETIR) www.jetir.org 599
Calculations:
X1= 80+90/2 -50+60/2 = 85-55 =30
X2 =60+90/2 -50+80/2 = 75-65 =10
X12 = 50+90/2 -80+60/2 =70-70 =0
Y=B0 + B1X1 + B2X2 + B12X12 =70+15(30) +5(10) +0(0)
INTERACTIVE EFFECT:
a1 a2 Value
-1 -1 50
+1 -1 80
-1 +1 60
+1 +1 90 table 9-interactive effect of case study 1
Effect of soya lecithin con, = 80-50 =30
Effect of DPPS con. =60 -50 =10
Total effect =30 +10 =40
Practically: 90-50 =40
So, 40=40 makes no interaction.
Conclusion: soya lecithin is influential lipid as its co-efficient is having highest value there is no any
interaction impact on the formulation
3.1 CASE STUDY :2
PROBLEM : Liposomes are colloidal delivery systems used for the encapsulation of various active drugs ,
lipophilic and hydrophilic .The aim was to investigate the influence of individual and combined effects of
three factors (namely phosphatidylcholine to cholesterol ratio, the lipid component to active substance ratio
and sonication time) on the responses of drug encapsulation efficiency (DEE,%) and liposomes size
(diameter) and identify the main formulation in order to produce stable liposomal formulation .[9,15]
Material used: Clodronate monosodium, Phosphatidylcholine from egg yolk, Cholesterol, Chloroform
solution, a solution of 1.5 mM of Cu(NO3)2.
SOLUTION:
Method used: Box-Behnken design
REASON: The application of three-level experimental designs does not appear to have been reported in
development and optimization of bisphosphonates incorporation into liposome. As we know that there are
several methods used for the analysis of the relationship between one or more response variables and a set of
quantitative parameters, such as completely randomized design (CRD), two-level factorial or fractional
factorial design, response surface methodology (RSM) and Taguchi’s method.
Box-Behnken, a form of response surface methodology, which is one of the convenient three-factors three-
coded level design, requiring less runs than Central composite designs.
Considering all these facts, we can apply Box– Behnken experimental design for investigation,
characterization and optimization of formulation parameters, affecting the stability, encapsulation efficiency
and appropriate size for oral administration of clodronate liposomes.
Optimization
From above reason we can optimize the formula using, a three-level three factorial Box–Behnken
experimental design was used to optimize three parameters, i.e. phosphatidylcholine: cholesterol ratio, the
lipid component: active substance ratio and sonication time, affecting the formulation of clodronate into
liposomes.
Below table shows the factors chosen and settings of factor levels, evenly spaced and coded for low, medium
and high settings, as 1.0 and +1. This design is helpful for the optimization of the process by using a smaller
number of experimental runs, based on the construction of second order polynomial models and the
exploration of quadratic response surfaces.

© 2019 JETIR September 2019, Volume 6, Issue 9 www.jetir.org (ISSN-2349-5162)
JETIR1907D83 Journal of Emerging Technologies and Innovative Research (JETIR) www.jetir.org 600
The experimental design, data analysis and quadratic model building, along with the optimum experimental
conditions were generated, by means of Design- Expert 7.0 software.
table 10- factorial design of case study 2
Experiments and results of Box-Behnken design:
The design shows replicated center points and a set of points lying at the midpoints of each edge of the
multidimensional cube that defines the region of interest. Therefore, the three-level three-factorial
experimental design consists 17 total experimental runs, as shown below:
RUN NO. Independent variables Responses
X1 X2 X3 Y1(%DEE) Y2(Size ,nm)
1 5:1 10:1 9 78.11 549.84
2 2:1 7:1 1 80.59 640.26
3 8:1 4:1 5 77.18 552.14
4 8:1 7:1 1 75.48 642.48
5 8:1 10:1 5 70.59 701.97
6 5:1 7:1 5 78.86 633.68
7 5:1 7:1 5 79.37 629.20
8 5:1 10:1 1 69.64 673.27
9 2:1 7:1 9 75.31 458.48
10 5:1 7:1 5 79.83 619.68
11 8:1 7:1 9 81.06 604.64
12 5:1 4:1 1 80.21 370.32
13 2:1 4:1 5 72.82 219.84
14 5:1 4:1 9 70.64 311.32
15 2:1 10:1 5 70.94 658.56
16 5:1 7:1 5 78.94 647.32
17 5:1 7:1 5 78.25 634.32 table 11-no. of runs of box-behnken design
1) ESTIMATED REGRESSION MODEL OF RELATIONSHIP BETWEEN DEE% (Y1) AND
INDEPENDENT VARIABLE
Source SS df MSS F Prob >F
Model 244.36 9 27.15 28.47 0.0001
X1 2.70 1 2.70 2.83 0.1365
X2 16.72 1 16.72 17.53 0.0041
X3 0.08 1 0.08 0.08 0.7796
X1 X2 5.56 1 5.56 5.83 0.0464
X1 X3 29.43 1 29.43 30.86 0.0009
X2 X3 81.36 1 81.36 85.31 ˂0.0001
X12 7.69 1 7.69 8.06 0.0251
X22 97.60 1 97.60 102.33 ˂0.0001
X32 0.71 1 0.71 0.75 0.4158
REISDUAL 6.68 7 0.95
R2 0.9734
Adj R2 0.9392 table 12- relationship between dee% (y1) and independent variable
Factors Code High level(+1) Medium level
(0)
Low level (-1)
Phosphatidylcholine: Cholesterol
ratio(w/w)
X1 8:1 5:1 2:1
Lipid component : active
substance ratio(w/w)
X2 10:1 7:1 4:1
Sonication time(min) X3 9 5 1

© 2019 JETIR September 2019, Volume 6, Issue 9 www.jetir.org (ISSN-2349-5162)
JETIR1907D83 Journal of Emerging Technologies and Innovative Research (JETIR) www.jetir.org 601
2) ESTIMATED REGRESSION MODEL OF RELATIONSHIP BETWEEN
PARTICLE SIZE (Y2) AND INDEPENDENT VARIABLES
Source SS df MSS F Prob >F
Model 301512.0 9 33501.33 32.09 ˂0.0001
X1 34333.8 1 34333.79 32.88 0.0007
X2 159618.2 1 159618.15 152.87 ˂0.0001
X3 20205.5 1 20205.53 19.35 0.0032
X1 X2 20864.4 1 20864.36 19.98 0.0029
X1 X3 5179.7 1 5179.68 4.96 0.0612
X2 X3 1037.8 1 1037.81 0.99 0.3520
X12 117.5 1 117.49 0.11 0.7471
X22 46416.6 1 46416.63 44.46 ˂0.0003
X32 11235.8 1 11235.78 10.76 0.0135
REISDUAL 7308.8 7 1044.12
R2 0.9763
Adj R2 0.9459 table 13- relationship between particle size (y2) and independent variables
1) Response surface plots for effect of formulation parameters (for %DEE)
(X1=Ratio of phosphatidylcholine to cholesterol (w/w), X2=Ratio of lipid to drug (w/w), X3=Sonication time
(min)) on drug encapsulation efficiency (DEE %)
fig.8 response surface plots for effect of formulation parameters (for %dee)
2) Response surface plots for effect of formulation parameters ( For particle size )
(X1=Ratio of phosphatidylcholine to cholesterol (w/w), X2=Ratio of lipid to drug (w/w), X3=Sonication time
(min)) on liposomes mean particle size
fig.9 response surface plots for effect of formulation parameters (for particle size)
Result:
table 14-results of both observed response and predicted response and its residual
Response Observed response Predicted response Residual
%DEE 79.51 80.68 -1.17
Liposomes size
(diameter in nm)
305.68 298.24 +7.44

© 2019 JETIR September 2019, Volume 6, Issue 9 www.jetir.org (ISSN-2349-5162)
JETIR1907D83 Journal of Emerging Technologies and Innovative Research (JETIR) www.jetir.org 602
Conclusion: Using Box-Behnken design the possibility of analyzing different models for drug
delivery system with clodronate, which comes out with the higher entrapment efficacy and theoretical
bioavailability of the active substance than the market products. The results obtained of the study pointed out
that lipid to drug ratio was the predominant factor that influenced drug encapsulation efficiency and liposomes
size distribution were affected by all the experimental conditions and a ratio of phosphatidylcholine to
cholesterol of 2.83:1, a ratio of lipid to drug of 4:1 and 1minute sonication time. By using this design approach,
it is possible to create the appropriate experimental conditions, as an economic way to produce an efficient
and stable formulation for the clodronate liposomes.
4.SOFTWARE AND STATISTICAL AWARENESS:
Good DoE software helps users follow the regressive modelling approach. It should guide them in carefully
choosing model terms on the basis of graphical tools and statistics, and it should verify a model and its
significance based on statistics in addition to verifying unaccounted residuals. Graphical tools play a key part
in understanding and presenting statistical analysis results, so make sure that they deliver a smart way to
diagnose, analyze, predict, and present the results in two and three dimensions. [3]
A systematic application of DoE facilitates the identification of CPPs and their relationship to CQAs, leading
to the development of a design space. In combination with quality risk management (QRM) and process
analytical technologies (PAT), these help companies maintain good manufacturing control and consistency,
ultimately guaranteeing the quality of their drug products. software availability will guide what statisticians
and quality engineers are willing to do with statistics and graphics. [2]
Various software given in below table: [8]
table 15-varoius softwares for experimental designs
5.FUTURE PERSPECTIVE:
An alternative to DOE which is latent variable method it is quite common, especially in the initial phases of
process design and/or material characterization to collect a large number of data without necessarily
understanding their impact on the other quality attributes of the process. Although mechanistic models which
are commonly preferred to provide the basis for QbD, there are many reasons to approach the model
development with the use of latent methods can be the next steps or choice of any pharmaceutical industry.
There are several others adaptive methods are now inforce such as PLSR, ANN, PCR, LVM etc, so among
all the first study was carried out is the LVM analysis is initiated by selecting an adequate data pretreatment
(e.g., auto scale, mean centering) of the data. Pretreatment choices that are usually employed are incorporated
Design Expert
www.statease.com
JMP
www.jmp.com
STATISTICA
www.statoftins.com
MODDE
www.umetrics.com/modde
MINITAB
www.minitab.com
UNSCRAMBLER
www.camo.com
ECHIP
www.echip.com
SPSS
www.spss.com
OPTIMA
www.optimasoftware.co.uk
DOE PRO XL &DOE KISS
www.sigmazone.com
SOLVER
www.solver.com
iSIGHT
www.engenoius.com
MATREX
www.rsd-associates.com
Omega
www.winomega.com

© 2019 JETIR September 2019, Volume 6, Issue 9 www.jetir.org (ISSN-2349-5162)
JETIR1907D83 Journal of Emerging Technologies and Innovative Research (JETIR) www.jetir.org 603
in the software analysis and thus can be applied in generation of various models in each and every field of
science and technology. [10,11]
6.CONCLUSION:
Bio-statistical techniques can assure that the results found in such a study are not merely because of chance.
In every case of our life, Statistics plays a major role for better gaining and accurate results. A well-designed
and properly conducted study is a basic prerequisite to arrive at valid conclusions. Nowadays, much of the
scientific basis is already in place for the implementation of QbD. So,the Statistical optimization for
pharmaceutical scientist is to define the formulation with optimum characteristics. Statistical optimization can
also provide solutions to larger-scale manufacturing problems, which occasionally arise. Importantly,
statistical optimization experimentation and analysis provides strong assurances to Regulatory Agencies
regarding superior product quality.
7.REFERENCES:
1) Chow SC, Pong A. Statistical Designs for Pharmaceutical/Clinical Development. Drug Des.
2014;3(112):2169-0138. Gc 17
2) Peterson JJ, Snee RD, McAllister PR, Schofield TL, Carella AJ. Statistics in pharmaceutical development
and manufacturing. Journal of Quality Technology. 2009 Apr 1;41(2):111-34.
3) Durakovic B. Design of experiments application, concepts, examples: State of the art. Periodicals of
Engineering and Natural Sciences. 2017 Dec 28;5(3).
4) Manager GS. Statistical experimental design and its application to pharmaceutical development problems.
5) Weissman SA, Anderson NG. Design of experiments (DoE) and process optimization. A review of recent
publications. Organic Process Research & Development. 2014 Aug 29;19(11):1605-33.
6) N. Politis S, Colombo P, Colombo G, M. Rekkas D. Design of experiments (DoE) in pharmaceutical
development. Drug development and industrial pharmacy. 2017 Jun 3;43(6):889-901.
7) Fukuda IM, Pinto CF, Moreira CD, Saviano AM, Lourenço FR. Design of Experiments (DoE) applied to
pharmaceutical and analytical Quality by Design (QbD). Brazilian Journal of Pharmaceutical Sciences.
2018;54(SPE).
8) Bhoop BS, Raza K, Beg S. Developing “optimized” drug products employing “Designed” experiments.
Chemical Industry Digest. 2013 Jun.
9) Ailiesei I, Anuta V, Mircioiu C, Cojocaru V, Orbesteanu AM, Cinteza LO. Application of Statistical Design
of Experiments for the Optimization of Clodronate Loaded Liposomes for Oral Administration. REVISTA
DE CHIMIE. 2016 Aug 1;67(8):1566-70.
10) Tabora JE, Domagalski N. Multivariate analysis and statistics in pharmaceutical process research and
development. Annual review of chemical and biomolecular engineering. 2017 Jun 7; 8:403-26.
11) Cruz AG, Faria JA, Walter EH, Andrade RR, Cavalcanti RN, Oliveira CA, Granato D. Processing
optimization of probiotic yogurt containing glucose oxidase using response surface methodology. Journal of
Dairy Science. 2010 Nov 1;93(11):5059-68.
12) Armstrong NA. Pharmaceutical experimental design and interpretation. CRC Press; 2006 Jan 20.
13) Lewis GA, Mathieu D, Phan-Tan-Luu R. Pharmaceutical experimental design. CRC press; 1998 Sep 10.
14) Chowdary KP, Shankar KR. Optimization of Pharmaceutical Product Formulation by Factorial Designs: Case
Studies. Journal of pharmaceutical research. 2016 Dec 1;15(4):105-9.
15) Ghanbarzadeh S, Valizadeh H, Zakeri-Milani P. Application of factorial designs and response surface
methodology in formulation development of sirolimus liposome prepared by thin film hydration technique.
BioImpacts. 2013;3(2):75-81.