biogeographic patterns in small ground-dwellingvertebrates
TRANSCRIPT

I<<'(ord, of th( W<'.,lall /\/1,111//11111 Ivl 11,<'11 III 5uPl11el11('nt No. 67: 109-137 (2004).
Biogeographic patterns in small ground-dwelling vertebratesof the Western Australian wheatbelt
Allan H. Burbidge J, J.K. Rolfe J
, N.t. McKenzie J and J.D. Roberts2
I Department of Conservation and I.and Management, Science DivisionPO Box) I Wanneroo, Western Australia 6946, Australia
School of Animal Biology M092, Universitv of Western Australia, 35 Stirling Highway,Crawley, Wl'stern Australia 6009, Australia
Abstract - Cround-dwelling frogs, reptiles and small mammals were sampledat 252 quad rats chosen to represent the geographical extent and diversity ofuncleared terrestrial environments across the WestE'rn Australian wheatbelt.These sitE's were not overtlv affected by secondarv salinisation, but didinclude sites that were 'natu~ally' saline. We recorde~i a total of 144 speciesfrom 74 genera and 15 families. There was an average of 10.4 species perquadrat with a range from one to 19. Vertebrate species richness was higheston dissection valley floors and sandy depositional surfaces of the 'old plateau'but lowest on saltflats. Total species richness was positively correlated withhigh levels of sand, with low levels of soil nutrients and with good soildrainage. When frogs, reptiles and mammals were considered separately,temperature and rainfall attributes were also shown to exhibit correlationswith species richness. Patterns in species composition could be explained interms of climatic and substrate variables, including salinity. Two distinctfaunas were identified - one concentrated in the semi-arid northern andinland parts of the study area, and one concentrated in the more mesic southand south-east. Further patterning could be discerned within this dichotomy,including the existence of a small group of species that arc associated withsaline areas. Correlations between climatic and substrate variables could bediscerned even at very low levels in the classification analysis, suggestingstrong deterministic patterns in vertebrate species composition across thestudy area. Integrated management programs over entire catchments will benecessary in order to maintain conservation values, but there is doubt that theimpacts ~)f salinisation and fragmentation can be mitigated quickly enough toallow the small, ground-dwelling vertebrate fauna to withstand the effects ofthese processes in the Western Australian wheatbelt.
INTRODUCTIONMuch of the native vegetation in south-western
Australia has been removed in the pursuit ofagricultural enterprises, just as in many other partsof temperate Australia. In parts of the WesternAustralian wheatbelt more than 95% of nativevegetation has been replaced by annual cereals orherbaceous pasture plants. Removal of nativevegeta tion in this area began before 1900 (Sau nders1'/ 17/., 191'\5) and has contimlL'd to the present time.Unfortunately, this has occurred in an area that issusceptible to salinisation. Not surprisingly, therehas also been preferential clearing of the soils moresuited for agriculture, which are primarilv on thevallev floors and lower Such areas arc lesswell repn'sl'nted in the reserve system than, forexample, areas around rock outcrops orbreakawavs.
In south-wesll'rn Australia the regolith, becauseof its antiquity, contains a store of sdlt derived trum
rainfall and dry fallout, and consisting mainly ofsodium chloride (Hingston and Gailitis, 1976). As aresult of this, together with the subduedtopography and hot climate, there are parts of thelandscape that are 'naturally' saline (Salama, 1994).In a terrestrial context, salinisation is a pedogenicprocess that concentrates salts at or near the soilsurface when evapo-transpiration greatly exceedswater inputs from precipitation. This can occur as aresult of natural physical or chemical processes oras a result of human activities, such as clearance ofnative vegetation, in whid1 case it is termed
salinisation (Chasserni cl 17/., 1995). Insou th western Australia, as in some otheragricultural areas in Australia and elsewhere in theworld, replacement of native woody perennialplants with short lived herbaceous plants hasn'sulled in major alterations to the hydrologicalcvcle, with rising water tables bringing d significantsalt load near the land surface. This secondarv
110
salinisation has obvious deleterious consequences,not only for agricultural production, water qualityand infrastructure maintenance, but also forconservation of native plant and animalcommunities in the remaining remnants of theoriginal vegetation (George et al., 1995; ANZECC,2001; Cramer and Hobbs, 2002).
The link between removal of woody plants andincreasing salinity levels in groundwater has beenrecognised in south-western Australia since theearly 1900s (Mann, 1907; Wood, 1924) and is nowrelatively well understood (e.g. Clarke et al., 2002).Clearing of native vegetation has continued,however, and nearly two million hectares (about10% of the wheatbelt) are now affected bysalinisation, with a high likelihood that the extentcould double within the next 20 years (Ferdowsianet al., 1996). The process of secondary salinisation islikely to pose a significant threat to many nativeplants and animals, through its impact on habitat
A. H. Burbidge,]. K. Rolfe, N. L. McKenzie,]. D. Roberts
structure and quality. However, even thoughawareness of the 'salinity crisis' is now widespread(Beresford et al., 2001; Sexton, 2003) little is knownabout the effects of salinisation on the nativeterrestrial biota, particularly on native animals(Cramer and Hobbs, 2002; Briggs and Taws, 2003).
In such an environment, an important first step inconservation management is to document thegeographic distribution of plants and animals in theregion and elucidate diversity patterns (e.g. Cody,1986). The present study was commenced as part ofa broader study to identify biogeographic patternsamongst a range of plant and animal groups in thesouth-western Australian wheatbelt, and to identifyregions of high conservation value. Elsewhere(McKenzie et al., 2003) we investigated the effects ofsalinisation on small ground-dwelling animals inthe Western Australian wheatbelt. In the presentpaper, we explore geographic patterns in thecommunities of small ground-dwelling vertebrates
18RA Regions
o Gel'3ldton Sandplains 2 Be 3
o Pwon \fl.Iheatbelt 1 Be 2
o JarT3h Forest 1 Be 2
o Mallee 1 &2
o Espel'3nce Plains 1 Be 2
KAL8ARRI
2!1
o 100
Kilometres
11 116 118
118
120
120
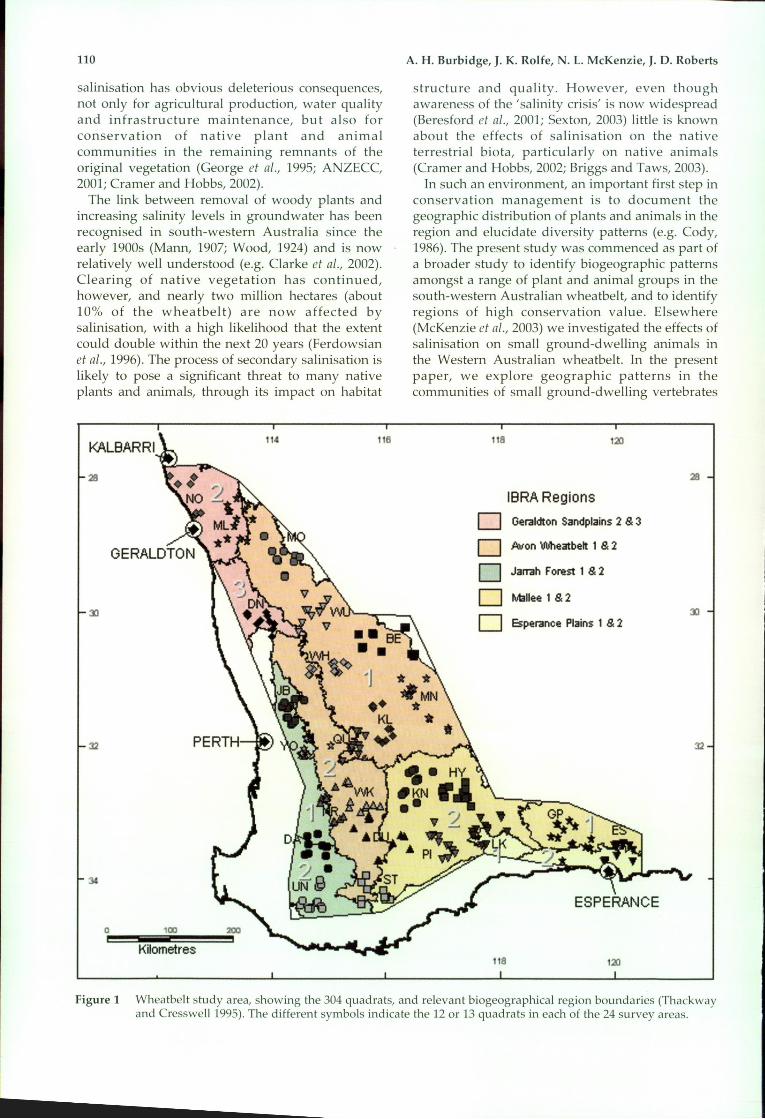
Figure 1 Wheatbelt study area, showing the 304 qlladrats, and relevant biogeographical region boundaries (Thackwayand Cresswell1995). The different symbols indicate the 12 or 13 qlladrats in each of the 24 survey areas.

Small ground-dwelling vertebrates
(frogs, reptiles and small marnrn,lls) at sites notovertly affected by secondarv salinisation.Specifically, we examine patterns of speciesrichness, explore compositional variation amongsample sites (quadrats), provide an overview of thecomposition and distribution of specIesassemblages and document relationships betweenassemblage composition and characteristics of thephysical environment.
STUDY AREA AND METHODS
The study area extended from near Northampton(latitude 28° S) to near the south coast, and fromnear the west coast east to just beyond Esperance(longitude 123 0 E) (Figure 1). The area ischaracterised by a Mediterranean climate with hotdry summers and most rainfall in winter. Annualrainfall ranges from 300 mm in the north-east to 800mm in the south-west, annual average maximumtemperature is between 24 and 37 QC and annualaverage minimum temperature between 4 and 9 QC(Bureau of Meteorology, 2001).
The landscape is an ancient one, dating from thePalaeozoic (McArthur, 1993). It is mantled withsand over lateritic gravel, with dissection anddifferential erosion of the old lateritic plateausurface resulting in a catenary of landforms andsoils of colluvial, alluvial, lacustrine and aeolianorigin and including sands, sandy loams and loams(sometimes over clay) low in the landscape. Soils inancient drainage basins are saline, particularly inthe north-eastern part of the study area (Mulcahyand Hingston, 1962; Bettenay and Hingston, 1964;Salama, 1994). Beard (1990 and references therein)described the sclerophyllous vegetation which ismainly woodlands low in the landscape andwoodlands, shrublands and heath lands high in thelandscape. An overview of the study area in relationto the component Interim l3iogeographicRegionalisation of Australia (IBRA) bioregions(Thackway and Cresswell, 1995) IS provided byMcKenzie et al. (this volume).
As part of a wider survey carried out in thecontext of salinisation in the Western Australianwheatbelt (McKenzie et al., 2003, this volume), the205000 km' study area (Figure 1) was divided into24 survey areas. These were positioned to allowsampling across the extent of the study area, andacross all likely environmental gradients, in anefficient manner. Twelve or 13 quad rats, each of onehectare, were positioned to sample the geomorphicprofile of each survey area. We positioned quadratsin the least-disturbed examples of each habitat typethat we could find although we included pseudoreplicates in landform units that were affected bygroundwater salinity. Sites affected by secondar~salinisation are repo~ted on in McKenzi'e et al. (200.3,this volume); the current paper reports on those 252
111
sites not overtly affected by secondary salinisation.Landform units were numbered from 1 to 12according to their position in the landscape profile(Figure 2). In cases where a unit was particularlyextensive within a survey area, two quadrats weresampled. As well, most quadrats were pseudoreplicated in the other survey areas to allow for theinternal heterogeneity of the stratification units(hypothesised scalars) and to minimise anyanalytical circularity introduced by stratification(Taylor and Friend, 1984; McKenzie et aI., 1989).Further details concerning quadrat selection areprovided in McKenzie et al. (2003). Locations ofquadrats are given in Appendix 1.
Reptiles, frogs and mammals were pit-trapped ateach quadrat for a minimum of seven nights in bothspring and autumn. The minimum of seven nightswas chosen to encompass a full weather cycle, withsampling in two seasons to optimise return fortrapping effort (Moseby and Read, 2001; Read andMoseby, 2001). Quadrats in the first third of surveyareas (central wheatbelt) were sampled fromOctober 1997 to September 1998, while the northernquadrats were sampled from September 1998 toOctober 1999, and the southern ones, plus theDandaragan Plateau, were sampled from October1999 to October 2000.
For the first 101 quadrats surveyed, the minimumeffort was 168 pit trap nights, using two lines of sixpits, 10 m apart, at each quadrat. For the remainingquadrats, this was extended to 210 pit trap nightsper quadrat, with three lines of five pits, 5 m apart.In addition to the extra pits, the extra line wouldhave improved spatial coverage of the site. Thiswould have increased the probability ofencountering a given species at the site, therebyallowing us to have more confidence in ourassumption of complete sampling. In all cases, a 25cm high flywire drift-fence extended the length ofthe line. The pits were PVC pipe 125 mm diameterand 350 mm deep, had a plastic bottom (2 L jar) andincluded a cone-shaped baffle to hinder escapes. Avariable amount of time was spent searching forreptiles by hand on each quadrat, depending on ourassessment of how well the site had been sampledby the pit traps, based on our knowledge of thefauna of the region. The aim of sampling was toprovide reliable presence/absence data for eachquadrat, and any hand searching served to makethis assumption more robust. Additional data camefrom accidental captures in invertebrate traps at thesame quad rats (Harvey et aI., this volume) and at asubset of quad rats from searching for frogs basedon call recognition or sightings. Species wereincluded in the analysis only if they were reliablycaptured by the sampling methods (see Rolfe andMcKenzie, 2000). For example, the Quenda and anumber of snake species are believed to bereasonably common in parts of the study area, but

112
are known to be difficult to trap using our methods,and these were among the species excluded fromthe analyses. A full listing is provided in Table 2.This approach minimised the problems ofunreliable 'absence' data in the presence-absencematrix. Voucher specimens have been lodged in theWestern Australian Museum.
The analytical approach taken was an exploratorydesign based on the assumption that spatialdistribution reflects an underlying correlation withenvironmental factors (Austin, 1991). A range ofclimatic, geomorphic, soil and vegetation attributeswas derived for each quadrat (Table 1, Appendix 1).Eighteen climatic attributes were derived for eachquadrat using ANUCLIM (McMahon et aI., 1995).These comprised annual and seasonal average andrange values for temperature and precipitation.There are varying degrees of correlation betweenthese attributes, and these are reported in Appendix
Spillway deposits
Qe Quailing ErosionalK KauringQd Quailing DepositionalM MonkopenBg BelmungingB BalkulingMg MalebellingY YorkA AvonMo MortlockSf SaltflatSw Swamp (fresh)
A. H. Burbidge, J. K. Rolfe, N. L. McKenzie, J. D. Roberts
2. Fifteen soil chemical and texture values for eachquadrat were derived from sub-samples collected ata depth of 5--10 cm from 20 to 30 points, then bulked.These included nitrogen, phosphorus, potassium,pH, electrical conductivity, organic carbon, clay-siltsand percentages and magnesium (c. f. McKenzie etal., 2000b). Correlations between attributes are shownin Appendix 2. Four landform and several vegetationattributes were also generated, including elevation,soil drainage category, slope, salinity risk, treecanopy, shrub cover, herb cover, litter/log cover andhabitat complexity (modified from Newsome andCatling, 1979). Latitude and longitude were alsoobtained for each quadrat using a GPS unit, andincluded as physical variables in analysisprocedures. Because landform had already been usedto position the quadrats in each survey area, it wasnot used as an attribute in the compositionalanalyses.
PLATEAU,...------_._------------,
Figure 2 Wheatbelt landforms, modified from Mulcahy and Hingston (1961). The landscape's plateau profilecomprises the duricrusted Tertiary laterite plateau and its derived spillway sands, while the dissectionprofile comprises finer textured soils derived from bedrock and pallid-zone clays beneath the duricrust. Thenumbers against each landfonn are used in the text and elsewhere as labels for the landforms.
-------
Small ground-dwelling vertebrates
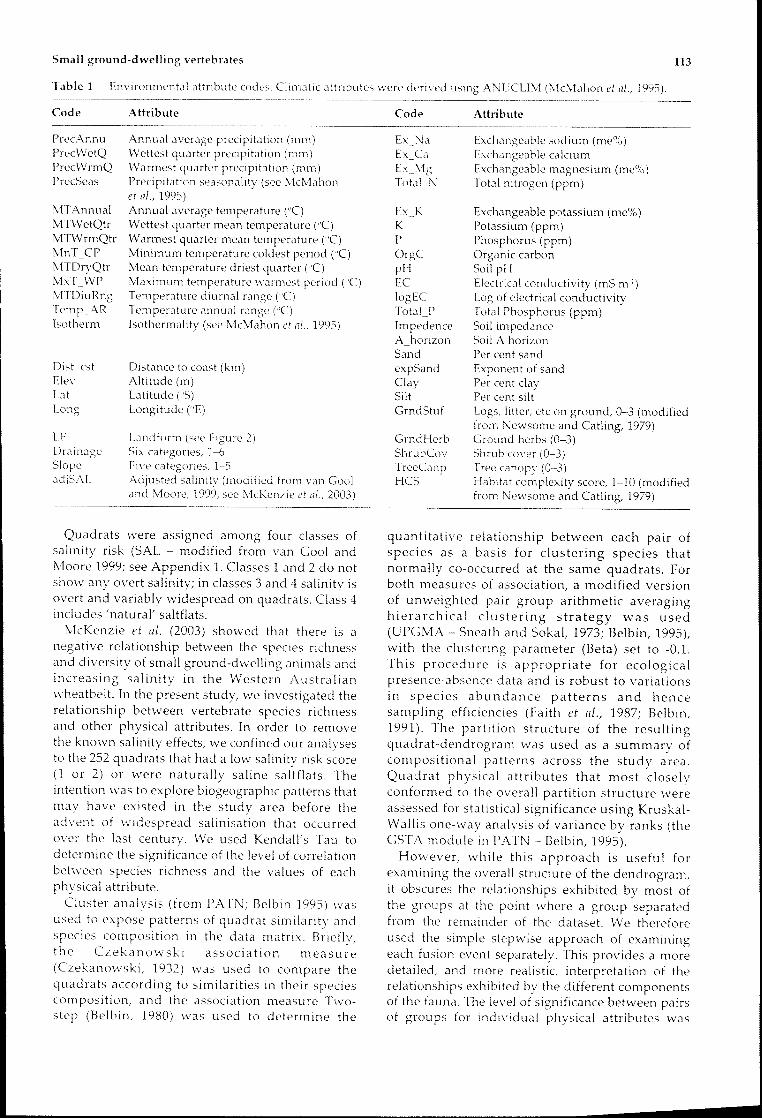
Table 1 Environrnental attnbutc codes. Climatic attributes were derived USlllg ANUCLIM (McMahon et aI., 1995).
113
Code
PrecAnnuPrecWetQPrecWrmQPrecSeas
MTAnnualMTWetQtrMTWrmQtrMnT_CPMTDryQtrMxT WPMTDiuRngTempj\RIsotherm
Dist_cstElevLatLong
Drall1agcSlopead]SAI.
Attribute
Annual average preCipitation (mm)Wettest quarter precipitation (mm)vVarmest quarter precipitation (mm)Precipitation seasonality (sec McMahonet aI., 1995)Annual average temperature (PC)Wettest quarter mean temperature ("C)Warmest quarter mean temperature ("C)Minimum temperature coldest period ("C)Mean temperature driest quarter ("C)Maximum temperature warmest penod ("C)Temperature diurnal rangeTemperature annual range ("C)Isothermality (see McMahon et aI., 1995)
Distance to coast (km)Altitude (m)Latitude ("S)Longitude ("E)
Landform (see Figure 2)Six categories, 1-·6Eive categories, 1-5Adjusted salinitv (modified from van Cooland Moore, 1999; see tv1cKenzie et al., 2003)
Code
Ex_NaEx_CaEx_MgTotal_N
Ex_KKPOrgCprIEC10gECTotal_PImpedenceA_horizonSandexpSandClaySiltGrndStuf
CrndHerbShrubCovTreeCanpHCS
Attribute
Exchangeable sodium (me%)Exchangeable calciumExchangeable magnesium (me°lt,)Total mtrogen (ppm)
Exchangeable potassium (me%)Potassium (ppm)Phosphorus (ppm)Organic carbonSoil pHElectrical conductivity (mS m l )
Log of electrical conductivityTotal Phosphorus (ppm)Soil impedanceSoil A horizonPer cent sandExponent of sandPer cent clayPer cent siltLogs, litter, etc on ground, 0-3 (modifiedfrom Newsome and Catling, 1979)Ground herbs (0-3)Shrub cover (0-3)Tree canopy (0-3)Llabitat complexity score, 1-10 (modifiedfrom Newsome and 1979)
Quadrats were assigned among four classes ofsalinity risk (SAL - modified from van Cool andMoore 1999; see Appendix 1. Classes 1 and 2 do notshow any overt salinity; in classes 3 and 4 salinity isovert and variably widespread on quadrats. Class 4includes 'natural' saltflats.
McKenzie ct al. (2003) showed that there is anegative relationship between the species richnessand diversity of small ground-dwelling animals andincreasing salinity in the Western Australianwheatbelt. In the present study, we investigated therelationship between vertebrate species richnessand other physical attributes. In order to removethe known salinity effects, we confined our analysesto the 252 quadrats that had a low salinity risk score(I or 2) or were naturally saline saltflats. Theintention was to explore biogeographic patterns thatmay have existed in the study area before theadvent of widespread salinisation that occurredover the last century. We used Kendall's Tau todetermine the significance of the level of correlationbetween species richness and the values of eachphysical attribute.
Cluster analysis (from PATN; Belbin 1 wasused to expose patterns of quadrat similarity andspecies composition in the data matrix. Briefly,the Czekanowski association measure(Czekanowski, 1932) was used to compare thequadrats according to similarities in their speciescomposition, and the association measure Twostep (Bel bin, 1980) was used to determine the
quantitative relationship between each pair ofspecies as a basis for clustering species thatnormally co-occurred at the same quadrats. Forboth measures of association, a modified versionof unweighted pair group arithmetic averaginghierarchical clustering strategy was used(UPCMA Sneath and Sokal, 1973; Belbin, 1995),with the clustering parameter (Beta) set to -0.1.This procedure is appropriate for ecologicalpresence-absence data and is robust to variationsin species abundance patterns and hencesampling efficiencies (Faith ct aI., 1987; Belbin,1991). The parti tion structu re of the resu Itingquadrat-dendrogram was used as a summary ofcompositional patterns across the study area.Quadrat physical attributes that most closelyconformed to the overall partition structure wereassessed for statistical significance using KruskalWallis one-way analysis of variance by ranks (theGSTA module in PATN Belbin, 1995).
However, while this approach is useful forexamining the overall structure of the dendrogram,it obscures the relationships exhibited by most ofthe groups at the point where a group separatedfrom the remainder of the dataset. We thereforeused the simple stepwise approach of examiningeach fusion event separately. This provides a moredetailed, and more realistic, interpretation of therelationships exhibited by the different componentsof the fauna. The level of significance between pairsof groups for individual physical attributes was

114 A. H. Burbidge, J. K. Rolfe, N. L. McKenzie, J. D. Roberts
Table 2 Vertebrate species recorded from the survey area in the Western Australian agricultural zone (from McKenzieet aI., 2002; Storr et aI., 1983, 1990, 1999,2002; Tyler et aI., 2000 and our field sampling program). Nomenclatureis based on Aplin and Smith (2001) and How et al. (2001). For undescribed species a Western AustralianMuseum collection number is quoted. * = introduced; e = contemporary occurrence in study area; E = Extinct;Es = extinct in study area; T = could be caught in our traps; Q = recorded on quad rats during our survey; m =
occurs only on margin of our study area (compass direction in brackets)
AMPHIBIANS
Hylidae
Cyclorana plahjcephalaLitoria ade/aidensisLitoria CljclorhynchaLitoria moorei
Myobatrachidae
He/eioponls albopunctatllsHe/eioporus barycragllsHe/eioporus eyreiHe/eioporus inornatllsHe/eioporus psammophilusLimnodynastes dorsalisNeobatrachus albipesNeobatrachus centralisNeobatrachus kunapalariNeobatrachus pe/obatoidesNeobatrachus sutorNeobatrachus wilsmoreiCrinia georgianaCrinia glauertiCrinia pseudinsigniferaCrinia subinsigniferaMetacrinia nichollsiMyobatrachus gouldiiPseudophryne gllentheriPseudophryne occidentalis
REPTILES
eheluidaeChe/odina oblonga
AgamidaeAmphibolurus norrisiCtenophorus cristatusCtenophonls maculatusCtenophorus nllchalisCtenophorus ornatusCtenophorus reticulatusCtenophorus salinanlmCtenophorus scutulatusCtenophorus sp A (R150282)Ctenophorus sp B (R142275)Lophognathus longirostrisMoloch horridusPogona minorRankinia adelaidensis
Gekkonidae
Crenadactylus ocellatusDiplodactylus alboguttatusDiplodactylus granariensisDiplodactylus mainiDiplodactyllls ornatusDiplodactylus polyophthalmusDiplodactylus pulcherDiplodactylus squarrosusDiplodactylus sp. (R136559)
e Tm(NE)eTQeTQeTQ
eTQeTQeTQeTQeTQeTQeTQeTQeTQeTQeTQeTQeTQeTQeTQeTQeTeTQeTQeTQ
eQ
eTQeTQeTQeTQeTQeTeTQeTQeTQeTQe Tm(N)eTQeTQeTQ
eTQeTQeTQeTQeTQeTQeTQeTQeTQ
Nephrurus levisNephrunls vertebralisOedura reticulataStrophunls michae/seniStrophurus spinigerusStrophllrlls strophurusUndenuoodisaurus miliiChristinlls marmoratusGehyra variegataHeteronotia binoei
Pygopodidae
Aclys concinnaAprasia pulchellaAprasia repensAprasia smithiAprasia striolataDelma australisDelma butleriDe/ma fraseriDe/ma grayiiDe/ma tinctaDe/ma sp ? nov (R130297)Lialis burtonisPletllOlax gracilisPygopus lepidopodusPygOpllS nigriceps
ScincidaeAcritoscincus trilineatumCryptoblepharus carnabyiCnjptoblepharus plagiocephalusCnjptoblepharlls virgatusCtenotus alleniCtenotus australisCtenotus cateniferCtenotus delliCtenotus fallensCtenotus gemmulaCtenotus imparCtenotus labillardieriCtenotus leonhardiiCtenotus mimetesCtenotlls pantherinusCtenotus schomburgkiiCtenotus uberCtenotlls ?sp (R142614)eyclodomorphus branchialiseyclodomorphus ce/atusEgernia depressaEgernia inornataEgernia kingiiEgernia multiscutataEgernia napoleonisEgernia pulchraEgernia richardiEgernia stokesiiEremiascincus richardsoniiHemiergis initialisHemiergis peronii
eTQeTeTQeTQeTQeTQeTQeTQeTQeTQ
eTeTQeTQeTeTeTQeTeTQeTeTeTQeTQeTQeTQeTQ
eTQeTQeTQeTeTeTQeTQeTQeTQeTQeTQeTeTQeTQeTQeTQeTQeTQeTQeTQeTeTQeeTQeTQeTQeTQeTQeTQeTQeTQ
--------

Small ground-dwelIing vertebrates
Table 2 (cont.)
Lerista christinaeLerista connivensLerista distingllendaLerista dorsalisLcrista elegansLerista gerrardiiLerista kendrickiLerista lineopllllctlllataLerista macropisthopllsLerista microtisLerista mllel/eriLerista planivwtralisLcrista praepeditaLerista vidllataLerista lflllll1
Menetia greyiiMenetia sllrdaMorethia adelaidensisMorethia blltleriMorethia lineoocellatalvIorethia obscllraTiliqlla occipitalisTitiqlla mgosa
Varanidae
Varmllls breuicaudaVarl1llllS caudolllleatllsVamlllls eremillsVarl1llllS gOllldiiVararllls rosenbergiVaranlls tristis
Typhlopidae
RampllOtyphlops allstralisRamphotyphlops hamatllsRamphotlfphlops leptosomaRamphotyphlopsRamphotljphlops waitii
Boidae
Antaresia nc;!'th"I1,;i,Antaresia stimsoniAspidites ramsaljiMorelia spilota
Elapidae
Acanthophis antarcticlls
Demansia ps/mlme'phlsDn/sdalia mastersiiLCfIlL'!'O," cllrtaLI/1pe'Xn'oti'llIs coronottlsFlnino on/ata
bimaC1llatllscalonotos
Noteellis swtatllSParaslltaParasllta monachllsParasllta Ill,'rlceusParasllta c;1Ji'r/rlhJi'"
Pselldechis allstralisPselldonaja
CTQCTQCTQCTQCTQCTQCTQCTQCTQCTQCTQCTQCTQCTCTCTQCTQCTQCTQCTQCTQCQCQ
CCTQCTQCQCQCQ
CQCQCTCTCQ
CCCCQ
CCCQCQCQCCQCQCCCCCQCQCCCCQ
PSC1ldonaja modestaPSC1ldonaja nllchalisRhinoplocephallls bicolorSimoselaps bertholdiSimoselaps littoralisSlltafasciata
MAMMALS
Tachyglossidae
Tachyglosslls awleatlls
Dasyuridae
Antechinomys lanigerAntechinlls f7auipesDasycerws eristicaudaDasyllnls geoffroiiNingalli yvonneaeParantechinlls apicalisPhascogale cal!naPhascogale sp. (south-west WA)
Sminthopsis crassicalldataSminthopsis doliellllraSminthopsis gilbertiSminthopsis granlllipesSminthopsis griseoventerSminthopsis sp. novo (M53425)
Myrmecobiidae
Myrmecol1illS fasciatlls
Peramelidae
Chaeroplls ecalldatllsIsoodon obeslllllsPermneles bOllgainuille
Thylacomyidae
Macrotis lagotis
Potoroidae
Bettongia lesllellrBettongia penicillataPotorOlls platyops
Macropodidae
Lagorchestes hirslltllsLagostrophlls filsciatllslvIacroplls eugeniiMacroplls fllliginoslls
lrmalvlacroplls robllStllSMacroplls TlIfllSOnlfchogalea IlInataPetrogale lateralisSetonix brachYllnls
Phalangeridae
Trichosllnls vlllVl'clllaPsewlocheirus occidentalis
Burramyidae
Cereartetlls concinnlls
Tarsipedidae
Tostratlls
CCQCCQCC
C
CTQCTQEsCCTm(E)CTm(S)CCCTQCTQCTQCTQCTQCTQ
C
ECEs
Es
EsCE
EsEsCCCCCECC
cC
CTQ
CTQ
115

116 A. H. Burbidge, J. K. Rolfe, N. L. McKenzie, J. D. Roberts
Table 2 (cont.)
Vespertilionidae
Chalinolobus gouldiiChalinolobus morioFalsistrel/us mackenzieiNyctophilus geoffroyiNyctophilus gouldiNyctophilus timoriensisScotorepens balstolliVespadelus regulus
Molossidae
Mormoptems sp. 3Mormopterus sp. 4 Pop 0Tadarida austmlis
Muridae
Hydromys chrysogasterLeporil/us apicalisLeporillus conditorMus domesticus *Notomys alexisNotomys longicaudatusNotomys macrotisNotomys mitchel/iiPseudomys albocinereusPseudomys bolamiPseudomys fteldiPseudomys hermannsburgellsis
CCCm(5W)CCm(5W)CCC
CCC
CEEsCTQCQEECQCTQCTQm(NE)Es TCTQm(N)
Pseudomys llarltlS ETPseudomys occidentalis CTQPseudomys shortridgei Es TRattus fuscipes CTQRattus mttus * CTRattus twzneyi Es T
Leporidae
Oryctolagus cuniculus * C
Canidae
Canis lupus dingo * EsVulpes vulpes * C
Felidae
Felis catus * C
Equidae
Equus cabal/us * C
Suidae
Sus scrofa * C
Bovidae
Bos taUrllS * CCapra hircus * COvis aries * C
tested using Mann-Whitney U tests. At each fusionpoint in the dendrogram's partition structure,starting from the top (two groups), we comparedthe two newly formed groups, provided each grouphad at least five members. For example, at thesecond fusion point there are three groups, but onlyone of the initial groups is divided so the resultanttwo 'new' groups were compared.
Species-groups identified from the speciesclassification were interpreted in terms of theknown habitat preferences of their componentspecies throughout their ranges elsewhere inAustralia (e.g. How et al., 1988; Storr et ai., 1990;Ehmann, 1992; McKenzie et ai., 1993; McKenzie etai., 2000a) and our previous field experience inother parts of Western Australia. The use of suchextrinsic information on habitat preferences anddistribution provides an indication of whether theclassification is biologically meaningful. To aidinterpretation of the species classification analyseswe averaged the values of each physical parameteracross all the quadrats where a given species wasrecorded, for each species.
Two frogs, Crinia pseudinsignifera and C.subinsignifera, could not be reliably differentiatedmorphologically. So, for the purposes of analysis,they were treated as one species and labelled C.pseudinsignifera.
RESULTS
Intensity of sampling and comparison with thehistorical record
During the survey we recorded a total of 144vertebrate species belonging to 74 genera and 15families and obtained a total of 9299 vertebrateanimal by quadrat records (an average of 36.9 perquadrat) (Table 2). For the 252 quadrats sampled,anurans were recorded on 214 quadrats, mammalson 238 quadrats and reptiles on 250 quadrats. From1 to 19 vertebrate species were recorded perquadrat, with an average of 10.4 (s.d. = 3.5). Anadditional two species (the skink Egernia stokesii atone quadrat and the snake Pseudonaja nuchalis attwo quadrats) were caught at quadrats wheresecondary salinisation had commenced.
We recorded 22 (92%) of the 24 anuran speciesknown from the study area (Table 2). The exceptionswere Metacrinia nichollsi and Cyclorana platycephala.From within the study area M. nichollsi is known onlyfrom a disjunct population in the Stirling Range.Cyclorana platycephala is an arid zone frog with ageographic range that extends only slightly into thenorth-east part of the study area; it is an explosivebreeder requiring high rainfall events for activity thatwill generally occur over summer outside oursampling periods (Tyler, Smith and Johnstone, 2000).
Small ground-dwelling vertebrates
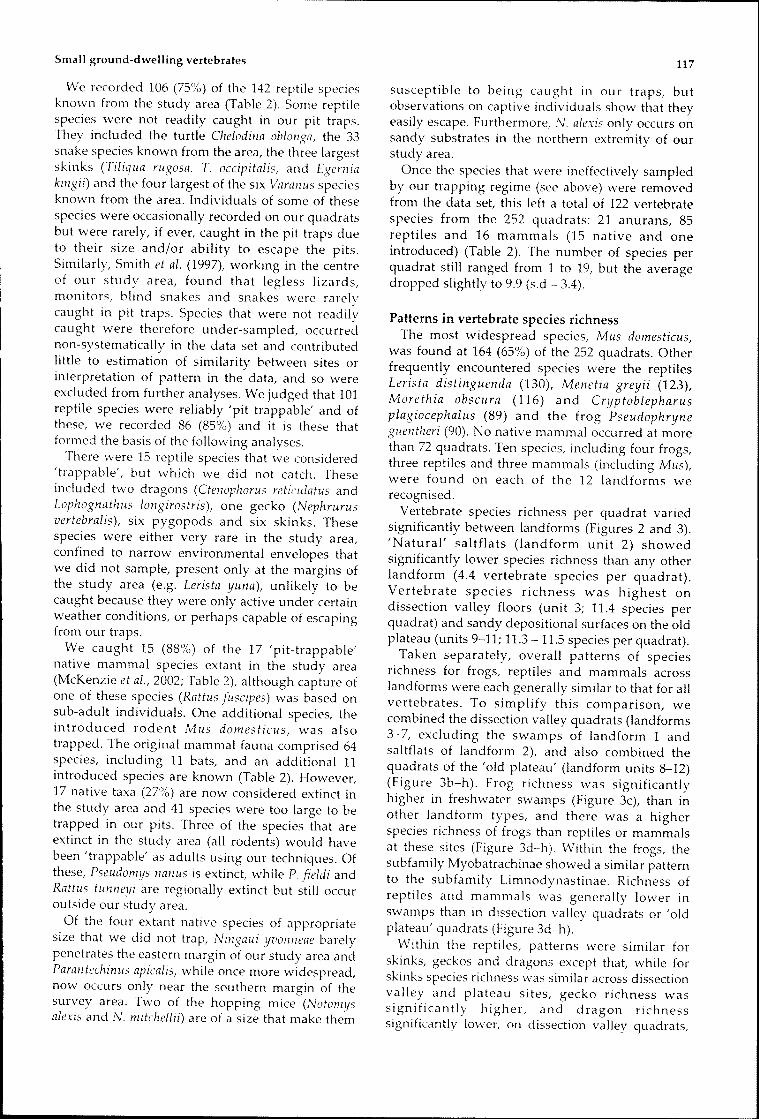
We recorded 106 (75%) of the 142 reptile speciesknown from the study area (Table 2). Some reptilespecies were not readily caught in our pit traps.They included the turtle Chelodina oblonga, the 33snake species known from the area, the three largestskinks (Tiliqua rugosa, T. occipitalis, and Egenziakingii) and the four largest of the six Varanus speciesknown from the area. Individuals of some of thesespecies were occasionally recorded on our quadratsbut were rarely, if ever, caught in the pit traps dueto their size and/or ability to escape the pits.Similarly, Smith et al. (1997), working in the centreof our study area, found that legless lizards,monitors, blind snakes and snakes were rarelycaught in pit traps. Species that were not readilycaught were therefore under-sampled, occurrednon-systematically in the data set and contributedlittle to estimation of similarity between sites orinterpretation of pattern in the data, and so wereexcluded from further analyses. We judged that 101reptile species were reliably 'pit trappable' and ofthese, we recorded 86 (85%) and it is these thatformed the basis of the following analyses.
There were 15 reptile species that we considered'trappable', but which we did not catch. Theseincluded two dragons (Ctenophorus reticulatus andLophognathus longirostris), one gecko (Nephrurusvertebralis), six pygopods and six skinks. Thesespecies were either very rare in the study area,confined to narrow environmental envelopes thatwe did not sample, present only at the margins ofthe study area (e.g. Lerista yuna), unlikely to becaught because they were only active under certainweather conditions, or perhaps capable of escapingfrom our traps.
We caught 15 (88%) of the 17 'pit-trappable'native mammal species extant in the study area(McKenzie et aI., 2002; Table 2), although capture ofone of these species (Rattus juscipes) was based onsub-adult individuals. One additional species, theintroduced rodent Mus domesticus, was alsotrapped. The original mammal fauna comprised 64species, including 11 bats, and an additional 11introduced species are known (Table 2). However,17 native taxa (27%) are now considered extinct inthe study area and 41 species were too large to betrapped in our pits. Three of the species that areextinct in the study area (all rodents) would havebeen 'trappable' as adults using our techniques. Ofthese, Pseudomys nanus is extinct, while P. fieldi andRattus tumleyi are regionally extinct but still occuroutside our study area.
Of the four extant native species of appropriatesize that we did not trap, Ningaui yvonneae barelypenetrates the eastern margin of our study area andParantechinus apicalis, while once more widespread,now occurs only near the southern margin of thesurvey area. Two of the hopping mice (Notomysalexis and N. mitchellii) are of a size that make them
117
susceptible to being caught in our traps, butobservations on captive individuals show that theyeasily escape. Furthermore, N. alexis only occurs onsandy substrates in the northern extremity of ourstudy area.
Once the species that were ineffectively sampledby our trapping regime (see above) were removedfrom the data set, this left a total of 122 vertebratespecies from the 252 quad rats: 21 anurans, 85reptiles and 16 mammals (15 native and oneintroduced) (Table 2). The number of species perquadrat still ranged from 1 to 19, but the averagedropped slightly to 9.9 (s.d = 3.4).
Patterns in vertebrate species richnessThe most widespread species, Mus domesticus,
was found at 164 (65%) of the 252 quadrats. Otherfrequently encountered species were the reptilesLerista distinguenda (130), Menetia greyii (123),Morethia obscura (116) and Cryptoblepharusplagiocephalus (89) and the frog Pseudophryneguentheri (90). No native mammal occurred at morethan 72 quadrats. Ten species, including four frogs,three reptiles and three mammals (including Mus),were found on each of the 12 landforms werecognised.
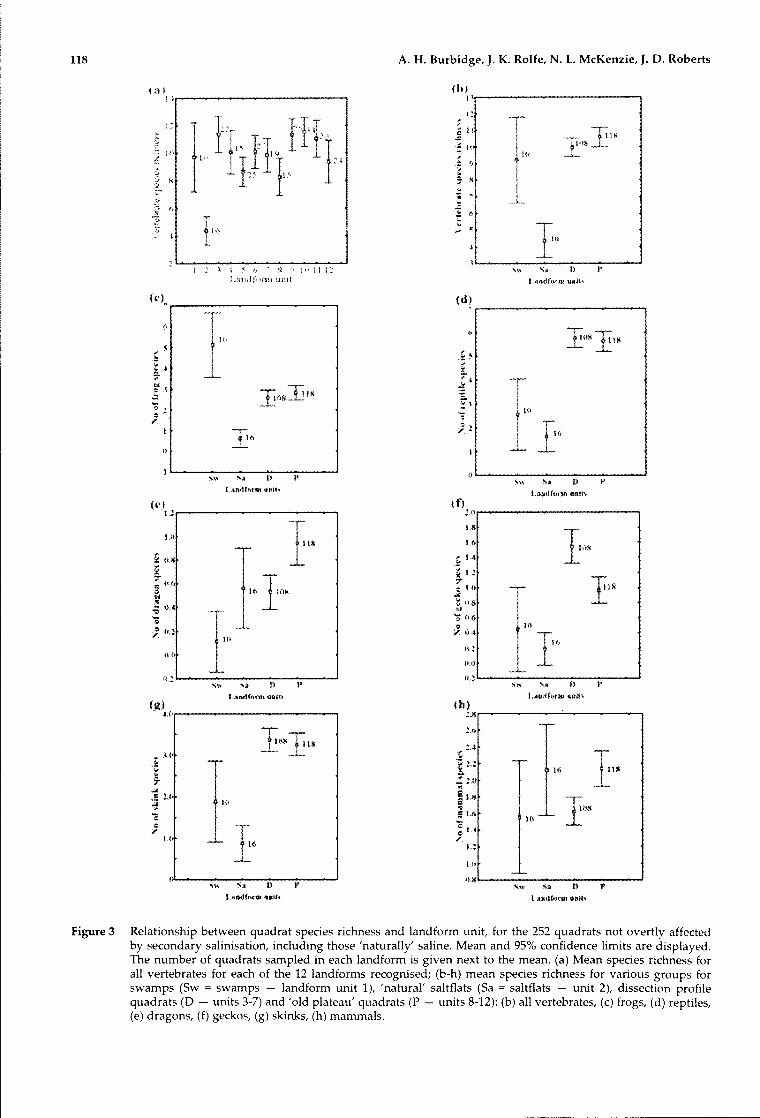
Vertebrate species richness per quadrat variedsignificantly between landforms (Figures 2 and 3).'Natural' saltflats (landform unit 2) showedsignificantly lower species richness than any otherlandform (4.4 vertebrate species per quadrat).Vertebrate species richness was highest ondissection valley floors (unit 3; 11.4 species perquadrat) and sandy depositional surfaces on the oldplateau (units 9-11; 11.3 -11.5 species per quadrat).
Taken separately, overall patterns of speciesrichness for frogs, reptiles and mammals acrosslandforms were each generally similar to that for allvertebrates. To simplify this comparison, wecombined the dissection valley quadrats (land forms3-7, excluding the swamps of land form 1 andsaltflats of landform 2), and also combined thequadrats of the 'old plateau' (landform units 8-12)(Figure 3b-h). Frog richness was significantlyhigher in freshwater swamps (Figure 3c), than inother land form types, and there was a higherspecies richness of frogs than reptiles or mammalsat these sites (Figure 3d-h). Within the frogs, thesubfamily Myobatrachinae showed a similar patternto the subfamily Limnodynastinae. Richness ofreptiles and mammals was generally lower inswamps than in dissection valley quadrats or 'oldplateau' quadrats (Figure 3d-h).
Within the reptiles, patterns were similar forskinks, geckos and dragons except that, while forskinks species richness was similar across dissectionvalley and plateau sites, gecko richness wassignificantly higher, and dragon richnesssignificantly lower, on dissection valley quadrats,
118 A. H. Burbidge, J. K. Rolfe, N. L. McKenzie, J. O. Roberts
(a)! lr--~-----------.,
(ll)l\,...-----~------.......,
, 1 , ,,~ SA n P
tJmdrOrm'tlU1h
-S ijlU tit::L;1Ilill,"lIllJJlI!
( ~.). ,...-.---------...-, (d) .-----------.......,
c ,/ ..
s" s~ I) !'L-an4ff>rm llftlh
I)'------~-~:--:--~-_....s" s. I) P
LtJ~dtonn Uflfh
(lot)4.(1,...-------------,
(t» u,...------------,
O.l'----S-,,--Sl:t--l~)-~I'-~-l
I,aedftnm utJih
11ns
118
0,0
!),! ......--s-,,--S::"~-:--I::--'--!,~----'
Landfl)rm nn1hCb);.8....--------'--------,
Ul
16
t 1,4
-i 1.2
~ 1.0...~ 0.:8'
""3 o.t~
: 0.4
(f)",(1,...-------------,18
I}·--1"(lA
18
It)
I"]
s" s. () I'Ltlidfoftii ••u\
il,S'------:---~-:__:__--...ISW' S:a I> ,-
[ ..Jiltdfot'm "bit,
Figure 3 Relationship between quadrat species richness and landform unit, for the 252 quadrats not overtly affectedby secondary salinisation, including those 'naturally' saline. Mean and 95% confidence limits are displayed.The number of quadrats sampled in each landform is given next to the mean. (a) Mean species richness forall vertebrates for each of the 12 landforms recognised; (b-h) mean species richness for various groups forswamps (Sw = swamps - landform unit 1), 'natural' saltflats (Sa = saltflats - unit 2), dissection profilequadrats (0 - units 3-7) and 'old plateau' quadrats (P - units 8-12): (b) all vertebrates, (c) frogs, (d) reptiles,(e) dragons, (f) geckos, (g) skinks, (h) mammals.

Small ground-dwelling vertebrates
where the best developed woodlands occur (Figure3L'-g).
Mammals were different in that natural saltflats(unit 2) were as rich in species as most other units.
An analysis of the level of correlation betweenspecies richness and the values of each physicalattribute showed that total vertebrate speciesrichness was negatively correlated with salt and soilnutrients, and positively correlated with sand andsoil drainage (Table 3). Taken separately, there weresome differences between anurans, reptiles andmammals. Anuran species richness was
119
significantly, positively correlated with deep sandsand negatively correlated with soil nutrients andsalinity. Rainfall was also significant, but withlower (positive) correlation coefficients. Rainfallattributes showed the highest positive correlationvalues in relation to species richness of frogs in thesubfamily Myobatrachinae, but not for theLimnodynastinae, for which no climatic attributeswere significant. Total reptile species richness waspositively correlated with drainage, and negativelywith salinity and soil nutrients. There were somedifferences between skinks, geckos and dragons.
Table 3 Significant correlatIons between species richness and physical attributes, based on 252 quadrats with nosalinity risk or low probability of risk/only partIally affected or 'natural' saltflats. Attribute codes areexplained in Table 1. Values given are Kendall Tau. Blank cells indicate that correlatIon was not significant;only correlatIons with P<O.OOI are included. Values in bold indicate probability values of 0.000001 or less. Thestrength of correlatIons between variables is shown in 2.
Attribute n Allvertebrates
Anurans Myobfrogs
Limnofrogs
Reptiles Dragons Geckos Skinks Mammals
A_horizon 242adjSAL 252Clay 246Dist_cst 252Drainage 252EC 252Elev 252Ex_Ca 252Ex_K 252Ex_Mg 252Ex_Na 252expSand 246GrndHerb 252GrndStuf 252HCS 252Impedenc 251Isotherm 252K 252Lat 25210gEC 252Long 252MnT_CP 252MTAnnual 252MTDiuRng 252MTDryQtr 252MTWetQtr 252MTWrn,Qtr 252MxT_WP 252OrgC 252P 252pH 252PrecAnnu 252PrecSeas 252PrecWetQ 252PrecWrmQ 252Sand 246ShrubCov 252Silt 246
252Tempj\l\ 252Total_N
0.14-0.18
0.26-0.27
-014-0.25-0.20-0.260.21
-0.23
-0.27
-0.25
0.21
-0.21
-0.15-0.26
0.20-017-020-016016
-0.22-016-016-0.22-0.18-0.190.24015
-0.23
-0.22
014
-016
-013018
015
0.24
-018
-014
-0.24
0.21
-0.17-0180.10
-0.14-0.14
-0.17
0.170.27
0.19
-0.19
-014-016017
-0.220.260170.28
0.17
0.16-017-019
0.17-0.23
-0.20-0.24-0.22-0.230.24
-0.23
-0.23
-0.14
0.23
-0.18
-016-0.26
-0.15
0.21-0.190.17
-0.19
-0.19
-0.20
-0.220.14
-0.25-0.20-0.26-0.220.16
-0.17-0.14-0.21-0.14-0.16-0.18-0.26-0.22
0.240.260.190.160.240.25
-0.29-0.30
-0.22
-0.17
0160.17
-0.12
0.24-0.32-0.20-0.31
0.13
0.10
-0.22
-0.17
0.140.210.18
0.180.20
-0.17
0.23
0.17
-0.15
0.22
-0.15
-0.300.16
-0.24
0.17-0.14-0.16
-0.14-0.22-0.14
-0.19
0.15
-0.16
-0.14
-0.15-0.17
0.21

120 A. H. Burbidge, J. K. Rolfe, N. L. McKenzie, J. D. Roberts
Northern andnorth-ea5tern
South-ea5tern andI 50uth-TJestern
1.5600
1. 5600I
I1.'13'18
I1.3096
1.3096 1.'13'18I Imoderate rainfall
I1.18'1'1
I1.0592
1.0592 1.18'1'1I I
I' Sands lo1ith lOTJ nutrients ,la: 5and over laterite Ib: deep 5and5
II: mostly lo1oodlands, loarns, clays or gritty sandsmoderate nutrients, lOlo1 rain
IandIINot 5aline
III and IVMostly 5aline
V:TJoodlands, more lo1esterly,more nutrient5, higher temp extremes,higher rain
ubland5, more ea5ter ly,ts, lO1Jer temp extremes, Moderate temperatures,
lOlo1er rainfall lOTJ habitat complexity,mostly sandy surface5
VII: LOTJ temp max ima,higher habitat complexity,lOTJ in land5cape
(3 )
(20)I
0.93'10
0.93'10
I(32)
V (73)
VI: Shrle5!!! nutrien
I
IV
VI (5'1)
II (57)
VII
III (13)
Figure 4 Dendrogram resulting from the classification of the 252 sample quadrats that were unaffected by secondarysalinisation (see text for details), classified on the basis of vertebrate species composition.
Skinks and geckos both showed significant positivecorrelations with the presence of a tree canopy,whereas dragons showed a negative correlation.Skinks showed negative correlations withtemperature attributes and positive correlationswith rainfall attributes, whereas geckos anddragons showed positive correlations withtemperature attributes and negative correlationswith rainfall attributes. Mammal species richnesswas negatively correlated with habitat complexityscores and soil nutrient levels, and positivelycorrelated with sand.
Compositional variation among sample sitesIn this analysis, the 252 quadrats that had no overt
signs of secondary salinity were classified on thebasis of vertebrate species presence/absence, i.e.classified in terms of their species composition.Seven major quadrat groups (I-VII; Figure 4) couldbe recognised, and further structuring in thedendrogram was evident below this point. At theseven group level, the quadrat groups could bedistinguished on the basis of maximumtemperature of the warmest period, and salinity(Figure 5).
The final fusion in the dendrogram (point 2 inFigure 4) was between Groups I to IV (105 quadratsprimarily from the semi-arid inland northern andnorth-eastern parts of the study area) and Groups Vto VII (147 quadrats from the mesic southern andsouth-western parts of the study area) (Figure 6),
associated with a northern and southern faunarespectively. Species with high levels of fidelitywith the northern group included Lerista muelleri,Ctenotus mimetes, Gehyra variegata and Sminthopsisdolichura, and with the southern group, L.distinguenda, Morethia obscura and Cercartetusconcinnus (Figure 10). Physical attributes thatshowed significant differences between these twogroups were primarily climatic (Table 4), withmaximum temperature of the warmest period(Figure 7) having the highest significance.
The last fusion within the northern group (point 3in Figure 4) was between 16 quadrats withcomparatively high salt levels (Groups III and IV)and 89 quadrats with lower salt levels (Groups Iand II) (Table 4). Most of the 16 quadrats with highsalt levels were in the inland parts of the study area,and 13 of them were on 'natural' saltflats.Ctenophorus salinarum and Sminthopsis crassicaudatawere encountered at most of these saline quadrats,but many species, e.g. Gehyra variegata andSminthopsis dolichura, were absent (Figure 10). Twoof the quadrats in this set (MU1 and WHI0) werenot saline, but were very hard surfaces, and speciespoor. Within the set of quadrats with lower saltlevels, the last fusion was between 32 quadrats(Group I) having relatively high rainfall and lownutrient levels, with 57 quadrats (Group II) havinglow rainfall and higher nutrient levels. Group Iquadrats were predominantly on sands, with orwithout laterite present in the soil profile, with

Small ground-dwelling vertebrates 121
Ca) Cb)42 35
-,.-
40 -~ 30 13
2.5 @38
2036
57 13 ,-cJ
32=®~15
~I34
® Dv 32 57 D 73 54 20UJ 100- D Cl
~~:][±J)(
32 73 Q
®~::t'-~ t:%J '-_
54 os30 I
c±J 20 0.0
28 r±J -os26
-'- -10 -'-
24-1.52 3 4 5 6 7
2 3 4 5 6 7252 sites 7 groups
252 $~e$ 7 groups
Figure 5 Comparison of (a) the maXlmum temperature of the warmest period (MxT_WP; QC) and (b) log EC for theseven major groups in the dendrogram from the classification of 252 sites not overtly affected by secondarysalinisation, including those naturally saline.. Mean and 95% confidence limIts are shown; means are labelledINith the number of quad rats in that partition. Results of Kruskall-Wallis tests are as follows: MxT_WP H ;158.6, P<O.OOOOl; 10gEC H 49.3, P<O.OOOOl. Other significant variables are also listed in Table 4.
shrublands or low woodlands, while Group IIquadrats were predominantly on loams and clays,or gritty sands associated with granites, oftensupporting woodlands. The higher rainfall groupcomprised two SUbgroups: an inland subgroup (la,16 quadrats), where quadrats occurred mostly on
sands over laterite and had significantly lowerrainfall than the coastal subgroup (Ib, 16 quadrats)of sites that were mostly deep sands, with someclays or loams (Figure 4, Table 4).
The last fusion within the southern set of 147quadrats (point 4 in Figure 4) was between 20
Table 4 Differences in physical attributes between the two groups at each higher order fusion point in the dendrogramresulting from the classification of 252 quadrats that had no overt signs of secondary salinisation, or werenaturally saline, on the basis of vertebrate species composition, using Mann-Whitney U tests. Other significantattributes are listed in order of decreasing significance. Fusions involving a group with five or less quadratsare omitted from the table.
Total Physical z value pnumber of attribute withgroups at highestthis point significance
2 MxT- WP 11.52 <0.0001
3 logEC -5.29 <000014 MTWrmQtr 5.43 <0.0001
5 Long -7.56 <0.0001
7 PrecAnnu 505 <0.00018 Exjvlg -4.4 <0.000110 PrecWetQ -4.75 <0.000112 PrecWrmQ -3.94 <0.000116 Ex- Ca 45 <0000120 MHVrmQtr -4.26 <0.000124 MnT_CP -395 <0.0001
Other significant attributes, in decreasing order(only attributes with significance <0.0001 are listed)
MTWrmQtr, MTAnnual, Temp_AR, MTWetQtr, Lat, PrecAnnu,MTDiuRng, Isotherm, MTDryQtr, OrgC, Dist_cst, PrecWrmQPrecWetQ TreeCanp, GrndStuf, LongEC, Ex_Na, adjSAL, Drainage, pH, Ex_MgLat, PrecAnnu, MTDiuRng, Temp_AR, MTDryQtr, MxT_WP,MTAnnual, HCS, PrecWm,Q GrndHerbPrecWrmQ PrecSeas, PrecWetQ, Isotherm, Total_P, MxT_WP,OrgC, Total_N, Temp_AR, PrecAnnu, MTDryQtr, MTWrmQtr,MTDiuRng, Lat, SlopeTotal_P, K, PrecWetQ Temp_ARTotal_N, Ee, logEC, Ex_NaPrecAnnu, Dist_cst, Long, PrecSeas, MnT_CP, Isotherm, Elev
Ex_MgMTAnnual, MxT_WP, Lat

122 A. H. Burbidge, J. K. Rolfe, N. L. McKenzie, J. D. Roberts
."
'1"o ",, .
I.. ,
'. ' .. _..
100 200 Kilometers~iiiiiiiiiiiiiii~~iiiiiiiiiiiii_
oQ)o
*If
~t~W( °**'t:r *
*~ fJr
*~#
100 0
°4;
0 * ** 'l:r
'tl 1tr*r tr*
<%,0* ~*~
*~
*o~'Ct*
~ trIt, ~
Figure 6 Geographic distribution of quad rats in the first two partitions of the quadrat classification.. Stars are quadratsin groups I to IV, circles are quadrats in groups V to VII.
quadrats located near lakes or gullies, or otherwiselow in the landscape and relatively close to thecoast (Group VII), and 127 quadrats (Groups V andVI) generally on sandy surfaces higher in thelandscape and generally further inland. Thephysical attributes with highest significance wereprimarily climatic (Table 4), with maximumtemperature of the warmest quarter having thehighest significance (Figure 7). Habitat complexitywas also higher in Group VII.
The 128 quadrats comprised a south-western set,mostly supporting woodlands, (Group V, 73quadrats) and a southern set, mostly supportingshrublands (Group VI, 54 quadrats). Again, thephysical attributes with highest significance wereprimarily climatic, or were correlated with rainfall(organic carbon). Within Group V, the 57 quadratsin sub-group Va often supported eucalyptwoodlands, sometimes near granites, and hadsignificantly higher values of exchangeable calciumthan the 16 quadrats of sub-group Vb, which wereprimarily shrublands or Banksia woodlands, GroupVI, which was distributed throughout thelandscape, could also be divided into SUb-groups,with the 20 quadrats of VIa mostly being on creamy,yellow or grey sands having significantly higher
values of exchangeable magnesium than the 34quadrats of Vlb, which were mostly brown or greyloams and clays,
Species assemblagesThe classification of the 122 species, according to
their co-occurrence at the same quadrats, resultedin a dendrogram in which 12 groups could berecognised (Figure 8). The final fusion in thisdendrogram was between a set (Groups 1 to 5) withpredominantly south-western (mesic or semi-arid)distributions (67 species) and another (Groups 6 to12) with predominantly arid or northerndistributions (55 species) (Figure 8). Species thatcommonly occurred in the first set (Figure 10)included Morethia obscura and Lerista distinguenda,both of which have southern distributions ongenerally sandy or loamy soils in shrublands andwoodlands. Some species in the first set (e.g,Menetia greyii), were very widespread within andbeyond the study area. Species that werewidespread in the second group included Gehyravariegata and Sminthopsis dolichura, both inhabitantsof semi-arid woodlands. When physical attributeswere compared between these two groups, theattribute with the highest level of significance was
r.. _

Small ground-dwelling vertebrates
In\' 'n(ftt:adfiiU tl'tfUP
(c)
I'll L \-'~\.,..'I.,..--\'~'I_I---......J
QtliHtl~l gflHtl}
I n(>Uiuh',,~ i,l;T~)iUV
(R)l&iI,.--------.-----,
.....1: 240
".....f 110
t~; 21JO
"~ ISO
:-t 160
:...
14..'l-~---~-----~--lt. Ib
Q1la:dnlt V(JliJP
(b)"'8.--------.----.......
1.1
(L41-.----'-n--I-n-'.,-'-----'Q••d'.t It,••v
(d)
.. 119
""..'&...:3 118
117
\ \lQu..draf atosp
(),ol-.---- ....I
(h) __- ____._-__--.&.-
V. VbQall<lul ~f""P
123
Figure 7 Comparison of attributes with the highest significance for the major fusion points in the dendrogram fromthe classification of 252 sites not overtly affected by secondary salinisation, including those naturally saline(see Figure 4), (a) Maximum temperature of the warmest quarter for the two final partitions (joining GroupsI-IV with V-Vll; point 2 in Figure 4), (b) EC at the next fusion point (joining Groups I-II with Ill-IV), (c)maximum temperature of the warmest quarter (Groups V-VI with VII), (d) longitude for Groups V with VI,(e) annual precipitation for Groups I with II, (f) exchangeable Magnesium for Groups VIa and Vlb, (g)precipitation in the wettest quarter for Groups la and Ib, and (h) exchangeable Calcium for Groups Va andVb. Mean and 95% confidence limits are shown; means are labelled with the number of quadrats in thatpartition. Results of Mann-Whitney tests on these comparisons are given in Table 4. Other significantvariables are also listed in Table 4.

....N...
Species groups derived by classifying the 122 vertebrate species on the basis of their presence/absence at the 252 quad rats not overtly affected by secondary salinity.Dendrogram structure shown to the 12 group level is displayed. Numbers of species for a given partition are shown in brackets. The text on the dendrogramdescribes the species in that part of the dendrogram, based on extrinsic information on these species (see Methods).
Mesic distributions, inhabiting llDist, usually sandy !lites
?'::::l£.""!tI
~r~I"l
"I1l:::N~.
':-
--
;.;:t
'"l:...0"P.:
OQ!tI
Predominantly Sfl (megic or semi-arid)distributions; 9pp Ii9sociated withlower temperatureg and higher rainfall
(67 gpecies)
Predominantly arid or N distributions;3pp associated with higher terxperaturesand lower rainfall (55 gpecie9)
I0.29
VarioU9 partsof landscape
I0.27
General.ly lowin landscape
I0.24
semi-arid sites
Me!lic or semi-arid distribution9
sandy sites
I0.20 0.22
Dig9imilarity measure
Spp favouring woodlands on fine textured soil!!
Arid woodlandsArid/semi-arid 3pp aS90ciated
with loamY or harder soils
Sal.inehabitats
I0.17
1 (14 )
2 (B)
3 (33)
4 (5 )
5 (7)
6 (12)
7 (7 )
B (2)
9 (2 )
10 (5)
11 (4 )
12 (23)
Figure 8
~::::lo0"I1l~'Jl
Small ground-dwelling vertebrates
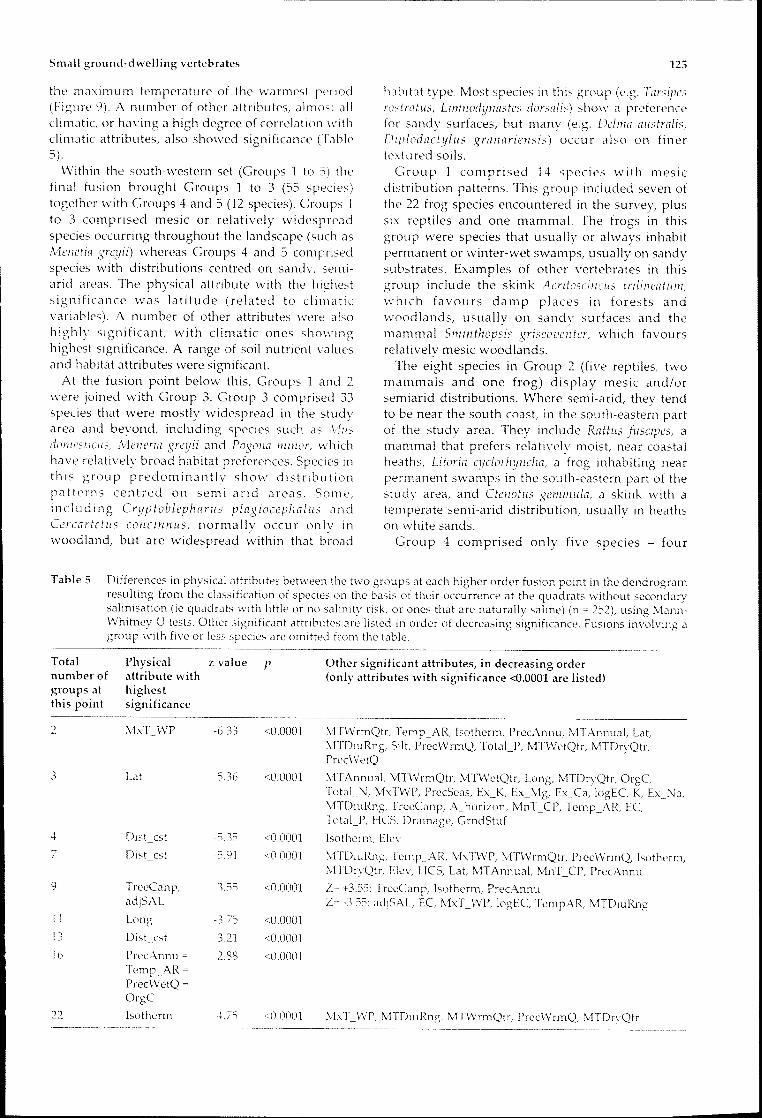
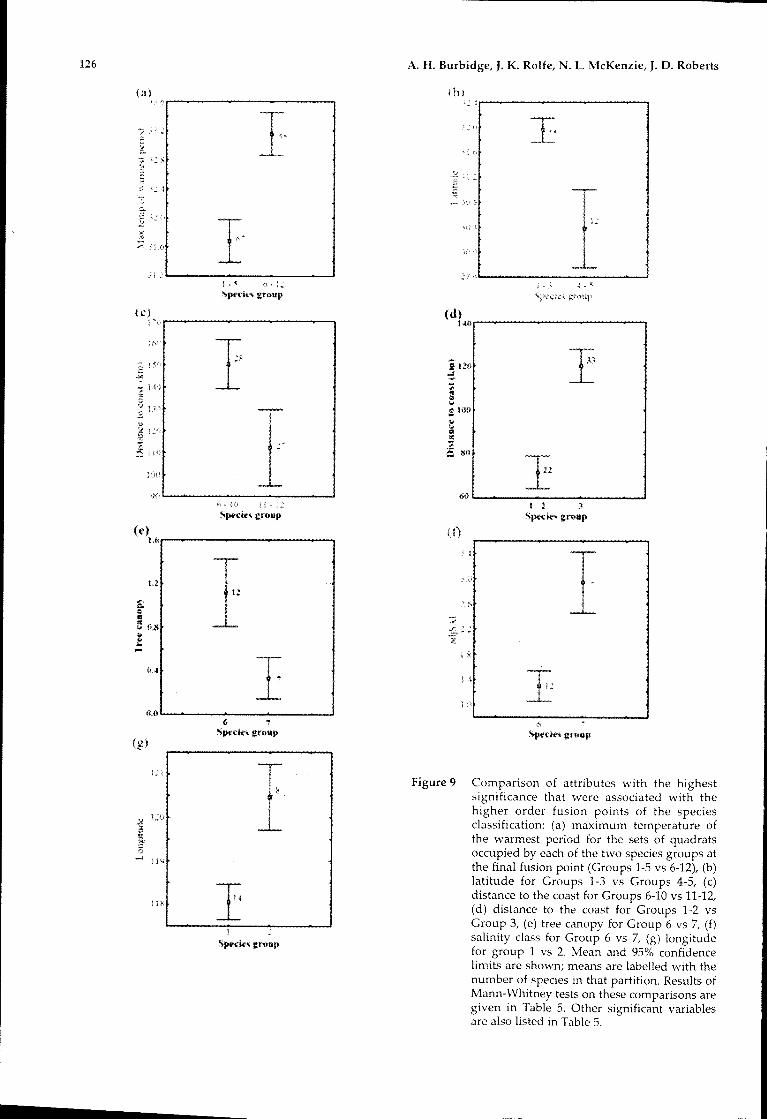
the maximum temperature of the warmest period(Figure 9). A number of other attributes, almost allclimatic, or having a high degree of correlation withclimatic attributes, also showed significance (Table5).
Within the south-western set (Groups 1 to 5) thefinal fusion brought Groups 1 to 3 (55 species)together with Groups 4 and 5 (12 species). Groups 1to 3 comprised mesic or relatively Widespreadspecies occurring throughout the landscape (such asMcnetia grcIjii) whereas Groups 4 and 5 comprisedspecies with distributions centred on sandy, semiarid areas. The physical attribute with the highestsignificance was latitude (related to climaticvariables). A number of other attributes were alsohighly significant, with climatic ones showinghighest significance. A range of soil nutrient valuesand habitat attributes were significant.
At the fusion point below this, Groups 1 and 2were joined with Group 3. Group 3 comprised 33species that were mostly Widespread in the studyarea and beyond, including species such as ivrll~
Menctia greYli and PogOlIa minor, whichhave relatively broad habitat preferences. Species inthis group predominantly show distributionpatterns centred on semi-arid areas. Some,including Cryptoblepharll~ plagiocephali{~ andCcrcartetll~ concinnll~, normally occur only inwoodland, but are Widespread within that broad
125
habitat type. Most species in this group (e.g. Tar~ipe~
ro.,tratll~, LimnodIjna~tcs dor~1111') show a preferencefor sandy surfaces, but many (e.g. Dclma all~tralis,
DlplodactIjllls grl1naricnsi~) occur also on finertextured soils.
Group 1 comprised 14 species with mesicdistribution patterns. This group included seven ofthe 22 frog species encountered in the survey, plussix reptiles and one mammal. The frogs in thisgroup were species that usually or always inhabitpermanent or winter-wet swamps, usually on sandysubstrates. Examples of other vertebrates in thisgroup include the skink Acrito~cincll~ trilineatum.which favours damp places in forests andwoodlands, usually on sandy surfaces and themammal Sminthopsis griseovcntcr. which favoursrelatively mesic woodlands.
The eight species in Group 2 (five reptiles, twomammals and one frog) display mesic and/orsemiarid distributions. Where semi-arid, they tendto be near the south coast, in the south-eastern partof the study area. They include Rattus fusclpcs, amammal that prefers relatively moist, near coastalheaths, Litoril1 cljclorhyncllll, a frog inhabiting nearpermanent swamps in the south-eastern part of thestudy area, and Ctcnotlls gcmmllla, a skink with atemperate semi-arid distribution, usually in heathson white sands.
Group 4 comprised only five species - four
Table 5 Differences in physical attributes between the two groups at each higher order fusion point in the dendrogramresulting from the classification of species on the basis of their occurrence at the quad rats without secondarysalinisation (ie quad rats with little or no salinIty nsk, or ones that are naturally saline) (n 252), using MannWhitney U tests. Other significant attributes are listed in order of decreasing significance. Fusions involving agroup with five or less species are omitted from the table.
Total Physical z value ]Inumber of attribute withgroups at highestthis point significance
2 MxT- WP -633 <0.0001
3 Lat 536 <0.0001
- ~- <0.0001-:).,J:J
-591 <O.OODI
355 <0.0001
-375 <0.0001
321 <00001
288 <00001
7
9
11
13
16
22
Dist cst
Dist cst
TreeCanp,adjSAL
Long
Dist_cst
PrecAnnu =
Temp_ARPrecWetQ =
OrgC
Isotherm -t75 «)OOOI
Other significant attributes, in decreasing order(only attributes with significance <0.0001 are listed)
MTWrmQtr, Temp_AR, Isotherm, PrecAnnu, MTAnnual, Lat,MTDiuRng. Silt, PrecWrmQ Total_P, MTWetQtr, MTDryQtr,PrecWetQ
MTAnnual, MTWrmQtr, MTWetQtr, Long, MTDryQtr, OrgCTotal_N. MxTWP, PrecSeas. Ex_K, Ex_Mg, Ex_Ca, 10gEC K. Ex_Na,MTDiuRng, TreeCanp, A_horizon. MnT_CP, Temp_AR, ECTotaU). I-lCS. Drainage, GrndStuf
Isotherm. Elev
MTDluRng. TempJ\R. t\1xTWP, MTWrmQtr. PrecWrmQ, Isotherm,MTDryQtr, Elev, HCS, Lat, MTAnnual, MnT_CP, PrecAnnu
Z= +3.55: 'rreeCanp, Isotherm. PrecAnnuZ= -355 adjSAL, EC MxT_WP, 10gEC TempAR, MTDluRng
MxT_WP. MTDluRng. MTWrmQtr, PrecWrmQ MTDrvQtr
126 A. H. Burbidge, J. K. Rolfe, N. L. McKenzie, J. D. Roberts
I _,L----------'---l
(d) ,...........__.....-__-_............144\
11.4
601- --1
I 2 Jst>4"(~ grollll
I • 12Sp..~il!\ grollp
<> 'l'
SPt'dol'1i ltrullp
(c)Uir-......--........---...----........
Figure 9 Comparison of attributes with the highestsignificance that were associated with thehigher order fusion points of the speciesclassification: (a) maximum temperature ofthe warmest period for the sets of quadratsoccupied by each of the two species groups atthe final fusion point (Groups 1-5 vs 6-12), (b)latitude for Groups 1-3 vs Groups 4-5, (c)distance to the coast for Groups 6-10 vs 11-12,(d) distance to the coast for Groups 1-2 vsGroup 3, (e) tree canopy for Group 6 vs 7, (f)salinity class for Group 6 vs 7, (g) longitudefor group 1 vs 2. Mean and 95% confidencelimits are shown; means are labelled with thenumber of species in that partition. Results ofMann-Whitney tests on these comparisons aregiven in Table 5. Other significant variablesare also listed in Table 5.

Small ground-dwelling vertebrates
reptiles and one frog, all of which occurredinfrequently in the data set. The reptiles were allspecies that occur on sandy Quaternary surfacesnear the west coast. The frog (Pscudophryncoccidcntalis) occurred at only one site in this dataset, but is otherwise known mostly fromQuaternary sands and aggregates in semi-aridenvironments (e.g. McKenzie ct aI., 1993). Group 5consisted of seven species, comprising six reptilesand one mal1lmal, Pscudomys albocil1crcus. All arespecies inhabiting semi-arid areas and all areusually found on sandplains, although sometimesalso on lateritic uplands. None of the physicalattributes we measured showed significantdifferences at this fusion point.
Within the other side of the dendrogram (Groups6 to 12) the final fusion was between Groups 6 to10, and Groups 11 and 12. The 28 species in Groups6 to 10 tended to occur relativelv low in thelandscape, with one subgroup consisting of speciesthat show mesic distribution patterns, while the 27species in Groups 11 and 12 comprise species thatoccur in various parts of the landscape. Distance tothe coast was the attribute with the highestsignificance at this fusion point, with isothermalityand elevation also being significant.
At most fusion points below this, there were fewif any attributes with significance. Where there wassignificance (points 9, 13, 16 and 22; Table 5),significant attributes were climatic ones, orcorrelated with climatic gradients, except at fusionpoint 9, where salinity related attributes werepredominant.
At fusion point 9 (joining Groups 6 and 7), bothgroups of species tend to occur relatively low in thelandscape. Group 6 comprised 12 species includingreptiles such as Ctcnotus ?dclli and Egcmia richardithat prefer woodlands. Most species in this groupprefer finer textured soils and at least two (tvforcthiaadclaidcl1sis and M. lincooccllata) sometimes occur insamphire or saltbush. Group 7 includes threemammals and four reptiles, most of which preferfiner textured soils. Ctcnophorus salil1arum and5mil1tJlOpsis crassicaudata prefer or tolerate salineareas. In our data set, the mammalS. crasslWlIdataoccurred at 14 of the 16 naturally saline quad rats,plus at another 18 sites spread through thelandscape, although more commonly in saline siteslow in the landscape. The reptile Ct~ salmarllm wasfound at six of the 16 naturally saline quadrats, plusat three other salinised sites, all on dissection valleyfloors. -
Groups 8 and 9 included four species thatoccurred at only one or two quadrats. Three of thesewere l.cnsta species that only occur on the extrememargins of the study area. Group 10 consists of fivereptile species, and Group 11 four reptile specieswith predominantly arid zone distributions. Thespecies in Group 10 occur in our study area only in
127
the northern extremity, and those in Group 11 onlyon the inland margin.
Croup 12 comprises 23 species, most with broadhabitat preferences, but with a preference for loamyor harder soils. Almost all have geographic rangesthat are centred on the arid zone (e.g. LcristanIucllcn, Varallus wudolil1catus), or are Widespreadin arid and semi-arid areas (e.g. Morcthia butlcri,Ercmiasclnclls richardsonii).
DISCUSSION
Patterns of vertebrate species richnessIt is well known that species richness of small
vertebrates (and other animals) is correlated witharea sampled (e.g. Kitchener et aI., 1980a, b;Kitchener and How, 1982; MacNally and Brown,2001). However, where sampling area and effort iskept constant, and sampling is throughout thelandscape at a regional scale as in the current study,a number of other attributes emerge as correlates ofspecies richness. Interestingly, even though thereare distinct temperature and rainfall gradientsextending generally south-west to north-eastthrough the study area, vertebrate species richnesswas correlated more highly with high levels of sandwith low soil nutrient levels and good drainage.This may be partly for historical reasons - thelandscape is an ancient one with low nutrient levels,and most species in the study area are presumablyadapted to such conditions. In addition, many frogs,reptiles and mammals in the study area useburrows, and these would be easier to dig in sandysubstrates.
However, when mammals, reptiles and frogswere considered separately, climatic attributes arealso significant. In addition, species richness in eachof these groups showed correlations with differentphysical attributes, presumably because theirdifferent physiological attributes and shelterrequirements result in different responses toenvironmental gradients.
Taken separately, overall anuran species richnesswas correlated with deep, nutrient poor sands. Norainfall attributes showed significant correlationswith species richness in the Limnodynastinae. Allthese species burrow, so they may escape thevagaries of irregular water supply. However,rainfall attribu tes did show significant correlationswith species richness for the Myobatrachinae. Thesefindings are slightly different from the patternreported by Roberts (1993) who provided a mapindicating a correlation between frog speciesrichness and rainfall gradients in south-westernAustralia. However, this map was derived frombroad species distribution patterns, based primarilyon museum records, often sampled from breedingchoruses, usually focussed on discrete wetlands,

128 A. H. Burbidge, J. K. Rolfe, N. L. McKenzie, J. D. Roberts
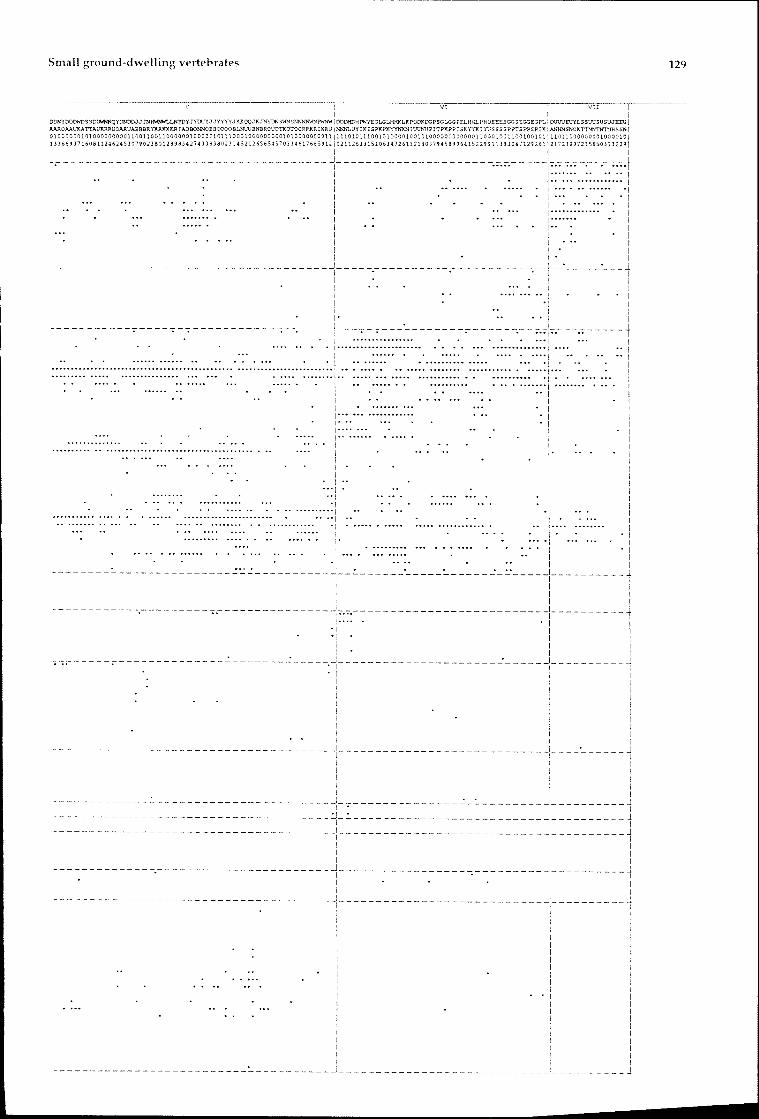
Figure 10 Data matrix re-ordered according to dendrograms (see text). Site codes printed vertically.
I I Il III I IVII I I I IIBQ1OCWQJOCMXQQQBWWDD~IBBBBa~~HJOQ"fNDMI8MGMSDHLJQo!ofWHIKPWI
IEULl..HULLNNUWEHHNNNNl(OOONHLLLOON I~UNLLLNNUUEOEOHOt1NHNNLOOOBOHtiLOOI,JHHUUt.LOt.NUYL.NNONL IDfPLTUYKLOLiJO 1LIH I10001000100011000000000000000111110001 0001 00000000100100001001 01 OOOCl 00011 0100000100101010011001000000001110111146193905)2012841 52622898]233023 134531852475871411912165205319276611363007369579039030619811952852 3144811140 II I I I I
-LAcrit;Scinc~s-tririneat~- - - t ------ --- -- ---- t-- --------------------- -1- ---- -r-~crinia /Jlau_rti I I I I Icrinia georgiana I I 1 ! 1Kerniergis peronii I I ! I ILitoria a.delaiden.Jis I I 1 IChristinus marmoratus I 1 I ICrinia pseudinsignHera I .... , 1 IHehioporus eyrei I I 1 IHeleioporus pSaMllOphilu.J I I I IEgemia. napolaonis I I I Ismlnthopsi. griseoventer I I I ICtenotutl ?tlp (Rl42614) I I I ILerista microtis I I I I I
-~~~~~~;-ekorrrsT-----+----- - - --- - - - - -=- t ------- -- ------ ------ --------[- - ----r-tCtenophorus sp A (R1S0282) I I I I Ietenotus qenmula I I I I ILitoria cyclorhyncna I I I ! ILerista dorsalis 1 I I I ICtenatus eateni ter I I I ! IRAtt.us tu.eipe. I I I I I
_rl;~~G~~~;-·_n5LV.;...LM2.)~22.)_+ ---- -- - -- t -------- --- -- --- ---- ------ -";" -1- ------~-tetenotus impar I·· 1 I I ITarsipes rostratus I I I I INeobatraehus. albipes I I , I 1Cereart.etus concinnus I I , I 1Leri,ta distinguenda I I ! I IMonthia obscura I I I I ILimnodyna.st•• dorsalis I I I I Ismlnt"hop.is gil~rti I 1 ! I IHemiargi. initialis I I I , ICtenophorus maculatus 1 I ·1 I Ism.inthopsia qranulip.. I I I I IRankinia adelaidensi5 1 I • 1 I Ist.rophurus spinigerus ,. I I I IMyobatrachus gouldii I I •• 1 I Ierenadactylu.s ocellatus I I· • ·1 1 Ieryptoblepharus plagiocephalus 1 I ••••• .. 1 1 Iunderwoodisaurus nU liill· I I IEgemill ~ltiscutata I I , I IHeleioporus barycragus I I ! I ICtanatus pantherinus I 1 I I 1Moloch horridus I··· ...., I 1 Ietenotus schomburgkii I·· .. ·• .•• I I I IDiplodactylus granariensis I· . I I j···1Heleioporus albopunctatus I • I"· I I IMenetia greyii j"... I·" •••••••• """.. I I !MUS musculus j"" • , .. "... •••• •••• I 1 INeobatrachus pelobatoides I ••••• 1 I , IP.eudophryne quentherl I . •.•. I·············· I . 1 INeobatrachus kunapalari !... .... ••• •• •• I········· I"· I ·1Pagona minor ,..... • ..... I ••••••••• ••••• ··1 .,. IoeIItlA australis I I· j 1 ,
-~~~~~~Hrali:; - -----+ ----~-------t------.-------------- -::- --- ----1- ---- --r-tPseudophryne occidentalis j • I I I I01plodactyIus orn.tus I 1 .. 1 I ILerlsta elagans I 1 ... I I I
-~-;~~!t:I1;-:;-tf~~;~ - - - -+--------~---=- - - ;- t---------------------------~ -1- ---- ~r-rPseudomy. albocinereus I ... 1 I I Isnophurus micha.lseni 1 I 1 1 Ipletholax I1racllit I I I 1 IOipIodactyIus alboguttatus I I I I ILeriata praepedit. I I I I I
-~~nt~t~~T~;:- -----f -.- -- - ~-- ------ =- - t ---- ---- --------- --- -- --- --~ -[- -- ----r-rAprasia pulcheUa 1 I I I ICtenotu. i'd.lll I I I I 1Eg'ernia pUlchra 1 I I I 1Oiplodactylu. polyophthalmus 1 J I 1 1HelaioporU5 inornatus I I I 1 1Antechinomy. laniqer I I 1 I IHorethla a.delaidensis I I I I 1OellM sp ? nov (RIJ0297) I I I I 1Pseudomys occidentalis I I 1 I IMonthia linaeoe.llata I I I 1 I
-rl~~~~~~~~lis - - - --+----------------t --- - ------------ -- -------- -- -1- ----- -=r-rPseudomys bolanu. I 1 1 "I IPseudomys herma.nnsburl1eM1s I I I ··1 ICt.notus leonha.rdii I I I ··1 ICtenophorus sa.linarum I 1 I··· • • I ICiplodActylus squa.rr05U5 I I 1 1 1
-8C~~~~~BcT:nt~t~r~a- --t-----~ ----------t.: -.-.- ---.:..- --------------------l,:·,:·-=,·,=,·,:·,:·,:r,:r-ri~~H{~~Hi-~!.- - - - --+----------------t---------------------------";" -j- - - - - - -r-r~~~~~;-~~~;~~:E-;T - - -+----------------t---------------------------.:. 7:- ------r-r
Cyclodomorphu5 cela.tus 1 I ·1 I 1VarlUU15 erUl.iu. 1 I ·1 I IMenetia surda I 1 ·l I 1
__~N!lIlL",-ruJ.J!Y~ 1 ..:~_1 .:.1- L_l11 Ctenophorus cristatu. I I • I 1 I
Diplodactylus maini I· I .. • I I 1OlplodActyluo sp. (R136SS9) I" I I I
~<c.!!!l~.J!2?;:P!..t!. 1· 1 1 L_l12 etenotu.s lIl1metes I I ... • ......o.. . . . I . I'
Horethia butler~ I 1 ••• • •.o.. 1 1 1Ler1sta gurardli I 1 I 1 1Ctenophorus seutulatus I· I I I 1~iat.~.ll.rl I 1 I I ICtenotua uber I 1 I I ICtenophoru. ornatus I I· 1 I ILerista macropisthopus I ,...... I I INeobatraehua centralis I ,. • I I IDiplodactylua puleher 1 I •.o 1 , IGehyra vari"'Jata I I •••• •••••• •••••• •••• ••••••••••••••• ., I Isminthopais dol ichura ,........ I •.••• ····1 I· INeobatrachua autor 1 I I I ILialis burtonis I 1• ·1 I 1Oedura retieulata I 1 I I IEr8llliuc1n.cua r ichardJIonii 1 1 1 1 1Cyelodomorphus branchialis 1 1 I 1 1Varanus caudolineatu5 I I 1 I INeohatrachus ...Usmorei I I I 1 1Strophuru.s .trophurus 1 I IIILerista connivens 1 I ·1 I IPyQopua nigriceps I 1 • I I I
__~H4ll!!ez!!2E!!,-p!-n.£...l. 1 L 1 L_l
7 _
Small ground-dwelling vertebrates
0100000010100000000011 00 11 0011000000 10 000 0 10111 00 01 0000000001 0 1 0000000011 111 0 1Q11100 101 0000 1 001 01 0000000 0000011000 10011 00 1QC 10 1
- - - - - - - - - -- _.- -:-
129

130
rather than from the whole landscape. It isinteresting to note that, in the present study, frogswere found in many parts of the landscape, not justin wetlands. Nevertheless, the high concentrationsof individual frogs at freshwater wetland sites,which tend to be low in the landscape and hencesusceptible to secondary salinisation, is of someconcern in conservation management.
The high significance levels associated with soilsandiness is likely to be a reflection of the highproportion of frog species that burrow. The landsurface in south-western Australia is predominantlysandy or sandy loam (McArthur, 1993) and theregion is particularly rich in burrowing frogs with62% of the anuran fauna being burrowers (Tyler etal., 2000). Similar studies to ours appear not to havebeen done in temperate areas. However, this patternof increasing species richness in relation to sandsrather than rainfall is in contrast to the margin ofthe tropical savannas, where frog species richnessincreases with rainfall and is higher on clay thansandy quadrats, presumably because the clayquadrats have higher water availability (Woinarskiet al., 1999), and/or because of the lower proportionof burrowers.
Reptile species richness was correlated with hightemperatures, at high, well-drained positions in thelandscape. Again, this is in contrast to the tropicalsavannas, where species richness is correlatedprimarily with rainfall (Woinarski et al., 1999).However, in temperate areas, ectothermic animalsthe size of most reptiles are likely to be moreabundant at sites with higher annual amounts ofsunshine, which occur at lower latitudes and/orhigh in the landscape. Mammal species richnesswas highest at quadrats with low habitatcomplexity scores and low nutrient levels, lowwinter rainfall and low winter temperatures, andhigh levels of sand. Reasons for this pattern are notclear.
Our results differ to some degree from those ofstudies where sampling is at a much coarser scale.For example, Pianka and Schall (1981), sampling in240 x 240 km grid squares and, with a reduced setof environmental attributes, found that, in Australiagenerally, the most important variable associatedwith frog species richness was annual precipitation,and for lizards and marsupials was annual hours ofsunshine. Examination of the maps presented byPianka and Schall (1981) suggests that theserelationships would also hold for south-westernAustralia, except for marsupials. Similarly, frombroad scale sampling, the species richness ofagamid lizards (dragons) (Witten, 1982) andvaranids (King and Green, 1993) increases along agradient from south-western Australia into the aridzone, showing a negative correlation with rainfall.In our data set, species richness of dragons andgeckos was positively correlated with temperature
-------
A. H. Burbidge, J. K. Rolfe, N. L. McKenzie, J. D. Roberts
variables and negatively with rainfalL while skinksshowed the opposite trend. Nevertheless, the scaleand extent of sampling, as well as the nature of thevariables measured, influence the conclusions thatare drawn, and the uses to which the data can beput. For example, if we had extended the samplingof skinks further into the high rainfall areas of thesouth-west, it is likely that a more complex patternwould have emerged, including a declining speciesrichness in some skink genera (e.g. Ctenotlls). Ourresults are most appropriate for predicting likelyspecies richness at a quadrat scale across thewheatbelt study area, and are therefore appropriateat a management scale, but may not hold at acoarser scale, or in the adjacent high rainfall zone tothe south-west.
Patterns of species compositionThese analyses revealed the presence of two
distinct faunas in the Western Australian wheatbelt- one in the northern and north-western part of thestudy area, the other in the south and south-east.This division is associated with differences inclimatic (temperature and rainfall) variables.Although we have not reported the details here, thisis also the case when secondary saline quadrats areincluded in the analysis. Within each of thesefaunas, major divisions are associated withsubstrate type and vegetation attributes as well asclimatic attributes. The second last fusion point inthe dendrogram was between a set of sites with lowsalinity and another set, mostly from inland areas,that had high salinity. This suggests that salinityhas been an important factor influencingbiogeographic patterns, pre-dating Europeanimpacts on these systems. This is not surprisinggiven that some of the saltflats in the study areadate from about the Miocene (Salama, 1994). Inaddition to the age factor, it is likely that there havebeen multiple periods of salinisation in response toprevious fluctuations in climate (Harper and Gilkes,2004). Salinisation therefore may have had longstanding effects not only on biogeographic patterns,but also on the nature of the biota in the WesternAustralian wheatbelt.
At the scale of the study area, rainfall andtemperature attributes were highly significant incomparisons between dendrogram partition groupsresulting from the classification analysis of quadratsor species. Substrate attributes were important at alocal scale, but examination of the physicalattributes showing significance at higher levels inthe dendrograms (Figure 4, Table 4; Figure 8, Table5) showed that some substrate attributes were alsoimportant at a relatively broad scale. Other featuresof the environment, not measured by us, may alsobe associated with the patterns we discerned. Forexample, the western zone of our study area has arejuvenated drainage system that flows westwards,

Small ground-dwelling vertebrates
while the eastern zone's ancient drainage systemcomprises chains of salt lakes and follows Tertiarypaleodrainage lines that are orientated northwardsand/or eastwards (e.g. Beard, 2000). Such featuresof the landscape might also have significantbiogeographical significance, but more detailedsampling would be needed to test such hypotheses.
Correlations between climatic and substratevariables could be discerned at low levels in theclassification analysis, suggesting strongdeterministic patterns in vertebrate speciescomposition across the study area. This suggeststhat population and community processes operateacross a broad scale, similar to the situation in somebird communities (Bennett et a!., 2004). However, atfiner scales, relationships with substrate are harderto characterise. This was also noted for vegetationin our study area by Dirnbock et a!. (2002) whodemonstrated that vegetation distribution showedsignificant responses to rainfall and subsequenttopographically mediated water re-distribution, butthese variables were insufficient to explainvegetation distribution effectively at the local scale.
Consideration of mammals, reptiles or anuransseparately would be expected to reveal differencesin patterning between these three groups(McKenzie et al., 2000b). However, for both quadratand species classifications, interpretation was moredifficult when mammals, reptiles or anurans wereconsidered separately, and these analyses have notbeen reported here. The lack of clarity in theseclassifications could be because the number ofspecies per quadrat for each of these groups wastoo low to allow meaningful patterning to bediscerned, or because guild boundaries do notnecessarily conform to taxonomic boundaries(Adams, 1985) and consideration of mammals,reptiles or frogs on their own provides aninadequate sample of the guilds occupied by thesespecies. For frogs, there were only 2.7 species perquadrat. For mammals, there were only 16 speciesin the analysis, and an average of only 1.9 speciesper quadrat (or 1.3 ignoring the introduced M1Is).The absence from the data set of those mammals(15% of the 'trappable' species) that are regionallyextinct might also complicate interpretation of thissubset. In addition, the introduced Mus was thedominant mammal in terms of the number ofquadrats at which it occurred (164), and this mightalso complicate interpretation. Patterns shown byreptiles on their own were more similar to thecombined vertebrate data set, presumably becausereptiles constituted 70'10 of the species in thecombined analysis. Cross taxon congruence isdiscussed further in McKenzie et a!. (this volume).
Our interpretation of broad scale biogeographicpatterns is broadly consistent with that of Kitcheneret a!. (1980a) who identified five groups of reptilesin the wheatbelt on the basis of common features in
131
their geographic ranges. They identified two majorgroups, a widespread one and an inland one, plusthree smaller groups with west coast, south-westcoast or south-western distributions. Similarly,Storr (1964) and Chapman and Dell (1985), usingknowledge of the geographic ranges of thecomponent species of the wheatbelt herpetofauna,identified an arid zone element and a smaller mesotemperate element. With the benefit of finer scalesampling at many more sites, we have been able toconfirm these general patterns, but show that thereis a considerable degree of patterning within eachof the two major groups. Earlier interpretationshave been based on current distributional range andhistorical biogeographical analyses. The presentstudy indicates that much of the patterning that canbe discerned is related to physical attributes of thestudy area.
FaunaI change in the wheatbeItBy selecting sites that were almost all on Crown
reserves, with as little evidence of disturbance aspossible, we attempted to discern assemblagepatterns that may have been in place at the time ofEuropean colonisation. However, it is well knownthat many changes have occurred since that time.At the regional scale, there have been significantchanges in the mammal fauna (Table 2; McKenzie eta!', 2002) - there are 11 introduced species in thestudy area and 17 species of the pre-European totalof 64 species are now extinct. While the losses arewell known, the exact reasons for the onset of theobserved declines are less clear (Kitchener et al.,1980b; Burbidge and McKenzie, 1989). Given thatso many mammals have been lost from thewheatbelt as a whole, it is likely that there havebeen many local mammal extinctions, and suchlosses must have had an impact on our analyses. Itis unclear what this impact may have been, butassuming that such losses have been relativelyuniform or random across the study area, theimpact on our conclusions has probably not beenvery great. Birds of the wheatbelt have also sufferedto some degree - Saunders (1989) found that twoout of 148 species of landbirds were regionallyextinct, while varying numbers have become extinctat the level of district or remnant. In addition, thereare at least seven introduced bird species in theAvon Wheatbelt bioregion alone (Barrett et a!.,2003). On the other hand, there are no introducedfrogs or reptiles in the area, and none of the original24 frogs or 142 reptiles is extinct, suggesting thatthese faunas may be intact, at least at a regionalscale, although it is likely that declines and somelocal extinctions have occurred in a variety ofreptile groups including snakes (e.g. Aspiditesramsayi) and skinks (e.g. Egernia stokesii).
The number of reptile species per unit area in thewheatbelt may have declined already. The mean

-
132 A. H. Burbidge, J. K. RoIfe, N. L. McKenzie, J. D. Roberts
Table 6 Herpetofauna and mammal species richness from pitfall trap sampling at quad rats in various parts ofsouthern Western Australia. Figures are mean numbers of species per quadrat with standard deviation, n (inbrackets) is the number of quad rats. Data are only included for studies using similar sized quadrats withsimilar sampling intensity. All surveys covered a full range of landscape units and all quadrats were nonecotonal.
Region
Carnarvon BasinMurchison/Coolgardie
WheatbeltYanchep National ParkFitzgerald River National ParkCape Arid National Park
Herpetofauna
16.3 ± 5.6 (63)12.2 ± 4.5 (109)
8.4 ± 3.3 (252)13.0 ± 2.7 (10)3.7 ± 2.6 (63)9.4 ± 2.7 (15)
Mammals
2.8 (63)3.5 ± 1.5 (61)
1.9 ± 1.1 (252)1.7 ± 0.5 (10)3.1 ± 1.3 (63)2.8 ± 0.9 (15)
Data source
McKenzie et al. (2000a)Burbidge et al. (1995); McKenzie et al. (1992,1993, 1994, 2000a); McKenzie and Rolfe (1995)This studyA.H. Burbidge and ].K. Rolfe unpubl. dataChapman and Newbey (1995)A.H. Burbidge,]-K. Rolfe andN.L. McKenzie unpubl. data
number of 'trappable' reptile species per quadraton non-saline quadrats in the dissection valleys(SAL = 1 or 2, landforms 3 to 7) was 5.8 (s.d. = 2.3)and on the 'old plateau' 5.62 (s.d. = 2.2) but thereare no pre-existing data to compare with. When allherpetofauna species are considered, we recordedan average of 8.4 (s.d = 3.3) species per quadrat.This is lower than that reported from adjacent areas(Table 6), particularly in the nearby arid areas(Carnarvon, Murchison and Coolgardie bioregions).It is higher than in the 330000 ha Fitzgerald RiverNational Park to the south of our study area (Table6), but this park is coastal, cooler and wetter thanany of the other areas and is mostly heathland, andhas a limited range of habitats for reptiles. Thenumber of mammal species we trapped per quadratwas within the range of richness figures reportedfor nearby areas. While quadrats in arid areas mightbe expected to have higher species richness ofreptiles, it does seem that richness levels in thewheatbelt are low.
Much of the native vegetation in the wheatbelthas been cleared for agriculture (Saunders et al.,1985) and the resultant fragmentation of habitatsmay have impacted negatively on the levels ofreptile species richness within our sample sites.Species of reptile may be lost from small remnantsin agricultural areas (Smith et al., 1996, 1997;Driscoll, 2004). Sarre (1995) and Sarre et al. (1995)found that, amongst two similar sized geckos in thecentral wheatbelt, the habitat genera list Gehyravariegata showed a much higher persistence in smallremnants than did the specialist Oedura reticula ta,and 0. reticulata appeared to have a lower dispersalability. Sarre et al. (1995) predicted that thepopulation genetic structure of 0. reticulata wouldbecome fragmented and that populations would belost from remnants more quickly than in G.variegata. Recent work by M. Hoehn (personalcommunication) has produced data consistent withthis hypothesis. In this context, it should also benoted that presence in a remnant does notnecessarily equate with persistence, as both these
~------~
species are known to have a longevity in excess of16 years in the Western Australian wheatbelt (R.How and J. Dell, personal communication) and socurrent measures of presence might be overestimates of persistence (the 'storage effect'discussed by Warner and Chesson (1985». Similareffects may be occurring in other reptiles. Forexample, the skinks Egernia richardi (preferringwoodlands with hollows or decorticating bark) andE. stokesii (preferring scrubs and woodlands withlogs and bark) have distinct habitat preferences but,despite being relatively widespread, are poorlyrepresented in our data set, and so may alreadyhave been lost from some sites through similarprocesses to those operating in Oedura. Similarly,How and Dell (1994) found that, on the nearbySwan Coastal Plain, some species such as Leristaelegans and Menetia greyii are relatively resistant toland use change while others such asCyclodomorphus branchialis seem to be relativelysusceptible to the effects of fragmentation.Nevertheless, they concluded that there was arelatively large group of lizards that can persist onsmall and modified patches of native vegetation,suggesting that the patches sampled in our data setmight be relatively intact still. Even if the reptilefauna is currently relatively intact, it seems likelythat fragmentation effects will erode the speciesrichness of at least the smaller patches (Driscoll,2004), although the actual process may be difficultto predict for individual species and patches (e.g.Englund and Hamback, 2004).
Another factor that may impact negatively onpopulations, or even persistence, of smallerreptiles is the introduced House Mouse. Mus waswidespread at the time of our sampling, beingfound in 205 of the 304 quadrats sampled. It isknown to occur in plagues, especially inagricultural areas. Mus is omnivorous and will eatinvertebrates, sometimes in significant numbers(Watts and Aslin, 1981; Singleton and Krebs, inpress; G. Singleton, personal communication).Newman (1993, 1994) and Pickard (1984, cited in

Small ground-dwelling vertebrates
Newman, 1994) recorded Mus eating skinks, anddeclines in populations of the skink Cyclodlllllmacgrcgori and the gecko Hoplodactylus maculatuscoincided with an increase in mouse numbers onMana Island, New Zealand, following changes inagricultural practices. After the Mana mice wereeradicated in 1989, the numbers of C macgrcgonrecovered to the same levels, and H. maculatusincreased to higher levels than previouslyrecorded. This suggests that MlIs could havesignificant impacts on assemblages of smallground-dwelling vertebrates and invertebrates inagricultural areas across southern Australia, bothas a competitor and a predator, particularly whenfood sources in wheat paddocks decline and thesurviving mice move into nearby native vegetationin search of food. They are potential competitorsfor both granivores and insectivores, as well asbeing potential predators (Cuthbert and Hilton,2004). The possible impact of MlIs on smallground-dwelling vertebrate assemblages deservesfurther investigation. In the wheatbelt, this mightinvolve an analysis in which population sizes ofMus and other small vertebrates, patch size,distance to nearest paddock and time sinceclearing are investigated. Given that any effects ofMus on small vertebrates will occur in the contextof additional predation by the introduced fox andcat, any analysis will also need to consider sucheffects. Impacts of MlIS are likely to be less inlarger reserves, but it is unknown how big areserve would need to be to protect the smallground-dwelling vertebrate fauna from invadingmice. This suggests that, when considering CAR(com-prehensiveness, adequacy andrepresentativeness) characteristics of the wheatbeltreserve system, small reserves, with no bufferingeffects, are not likely to contribute to adequacyconsiderations in relation to small vertebrates.
In the face of the above known and suspectedchanges, it is relevant to ask whether changes in thevertebrate fauna caused through salinisation can bereversed. Views on whether salinisation can bereversed are generally pessimistic (see liatton andNulsen, 1999) although Harper and Gilkes (2004)suggest that salinisation is reversible, albeit overmillennia. It remains to be seen whether the processof desalinisation can be accelerated with newagricultural systems that use more water. The issuefor conservation is that the rapid process ofsalinisation in a fragmented landscape is not likelyto allow the current flora and fauna to adapt ormigrate. Although the biota appears to haveevolved in relation to cvcles of salinisation andsubsequent recovery of the valley floors throughgeological time (Harper and Gilkes, 2004), it isunlikely to be able to withstand current processesunless they are reversed more rapidly thancurrently seems feasible.
133
ConclusionsThere are two major vertebrate faunas in the
wheatbelt: a northern fauna concentrated in thesemi-arid northern and inland parts of the studyarea, and a southern/south-eastern faunaconcentrated in the more mesic south and southeast. There are a number of recognisable groupswithin this overall dichotomy, including a smallset of species centred on saline sites. These speciesclusters showed patterns consistent with thephysical and climatic attributes of the quadratswhere they occurred. Effects of salinity aresuperimposed on broad-scale patterning that isrelated to climate and, at a finer scale, to substrate.Salinisation appears to have had long standingeffects on biogeographic patterns in the WesternAustralian wheatbelt. Relationships betweenspecies composition and climate and substratecould be discerned at low levels in theclassification, suggesting strong deterministicrelationships across the study area. Overall speciesrichness was related to substrate, but whenmammals, reptiles and frogs were consideredseparately, climatic attributes also emerged asbeing significant.
Results of this study have several implicationsfor conservation management. For example, whenit comes to management decisions at a local scale,it is important to consider management of eachsite, location or reserve in its biogeographiccontext. At the species level, our conclusions areconsistent with those of McKenzie et af. (2003),who concluded that a few species are restrictedto saline sites, but a diverse array of speciesoccu pIes non-saline sites. Those speciespreferring valley floors and lower slopes will bedisadvantaged by extensive salinisation infragmented habitat, and these species may requireparticular attention in relation to reserveacquisition and management. Results of thepresent study suggest that some species may alsobe negatively impacted on during MlIs invasions,perhaps to the extent that small reserves cannotprovide them with an adequate level ofprotection. A further interesting finding was thatfrogs were found throughout the landscape, notjust in wetlands, suggesting that connectivitybetween remnants may be more important forthese species than previously recognised. Theseconsiderations lead us to agree with Ceorge ct {If.
(1995) that integrated management programsover entire catchments will be necessarv in orderto maintain agricultural productivity as well asconservation values. Nevertheless, there is doubtthat the impacts of salinisation and fragmentationcan be mitigated quickly enough to allow thesmall, ground-dwelling vertebrate fauna towithstand the effects of these processes in theWestern Australian wheatbelt.

134
ACKNOWLEDGEMENTS
We thank M.A. Cowan, N. Hall, P.F. van Heurck,W.P. Muir and L.A. Smith for assistance inestablishing trap lines and/or field sampling, P. deTares and M. Hillier for advice on calculation ofdistance to the coast, T.e. Stoneman for the soilsalinity assignments, L.A. Smith for assistance withspecimen identification, P. Gioia who generated theclimatic data-set using the computer packageANUCLIM, and the Chemistry Centre (WesternAustralia) for carrying out soil chemical analyses.Thanks also to G. Singleton, e. Krebs, G. Saundersand E. Murphy for alerting us to critical referencesin relation to Mus biology, and M. and L. Brookerfor bringing pertinent literature references to ourattention. Useful and constructive comments onearlier drafts of this manuscript were provided byP. Doughty, A. Fisher, L. Gibson, D. Pearson and J.Richardson. Funding for this study was provided aspart of the State Salinity Strategy.
REFERENCES
Adams, J. (1985). The definition and interpretation ofguild structure in ecological communities. Journal ofAnimal Ecology 54: 43-59.
ANZECC (2001). Implications of salinity for biodiversityconservation and management. Australian and NewZealand Environment and Conservation Council,Canberra.
Aplin, K.P. and Smith, L.A (2001). Checklist of the frogsand reptiles of Western Australia. Records of the WesternAustralian Museum Supplement 63: 51-74.
Austin, M.P. (1991). Vegetation theory in relation to costefficient survey. In CR Margules and M.P. Austin(eds), Nature conservation: cost effective biological surveysand data analysis: 17-22. CSIRO, Canberra.
Austin, M.P. and McKenzie, N.J. (1988). Data analysis. InRH. Gunn, J.A Beattie, RE. Reid and R.H.M. van derGraaff (eds), Australian soil and land survey handbook:guidelines for conducting surveys: 210-232. Inkata Press,Melbourne.
Barrett, G., Silcocks, A, Barry, S., Cunningham, R. andPoulter, R. (2003). The new atlas of australian birds.Royal Australasian Ornithologists Union, Melbourne.
Beard, J.5. (1990). Plant life of Western Australia. KangarooPress, Kenhurst, NSW.
Beard, J.5. (2000). Drainage evolution in the Moore Monger system, Western Australia. Journal of the RoyalSociety of Western Australia 83: 29-38.
Belbin, L. (1980). TWOSTEP: a program incorporatingasymmetric comparisons that uses two steps toproduce a dissimilarity matrix. Division of Land UseResearch Technical Memorandum 80/9. CSIRO,Canberra.
Belbin, L. (1991). The analysis of pattern in bio-surveydata. In C R Margules and M. P. Austin (eds), Natureconservation: cost effective biological surveys and dataanalysis: 176-190. CSIRO, Melbourne.
-------
A. H. Burbidge, J. K. Rolfe, N. L. McKenzie, J. D. Roberts
Belbin, L. (1995). PATN technical reference. CSIRO,Canberra
Bennett, A.F., Hinsley, S.A, Bellamy, P.E., Swetnam, RD.and MacNally, R. (2004) Do regional gradients inland-use influence richness, composition andturnover of bird assemblages in small woods?Biological Conservation 119: 191-206.
Beresford, Q., Bekle, H., Phillips, H. and Mulcock, J.(2001). The salinity crisis. Landscape, communities andpolitics. University of Western Australia Press, Perth.
Bettenay, E. and Hingston, F.J. (1964). Development anddistribution of soils of the Merredin area, WesternAustralia. Australian Journal of Soil Research 2: 173186.
Briggs, S.V. and Taws, N. (2003). Impacts of salinity onbiodiversity clear understanding or muddyconfusion? Australian Journal of Botany 51: 609-617.
Burbidge, AA and McKenzie, N.L. (1989). Patterns inthe modern decline of Western Australia's vertebratefauna: causes and conservation implications. BiologicalConservation 50: 143-198.
Burbidge, AA, Fuller, P.J. and McKenzie, N.L. (1995).Vertebrate fauna. Records of the Western AustralianMuseum Supplement 49: 208-245.
Bureau of Meteorology (2001). What is the weather usuallylike? Climate averages for Australian sites: averages forWestern Australian sites. Bureau of Meteorology, Perth
Chapman, A. and Dell, J. (1985). Biology andzoogeography of the amphibians and reptiles of theWestern Australian wheatbelt. Records of the WesternAustralian Museum 12: 1--46.
Chapman, A and Newbey, K. (1995). A biological surveyof the Fitzgerald area, Western Australia.CALMScience Supplement 3: 1-258.
Clarke, CJ., George, RJ., Bell, R.W. and Hatton, TJ.(2002). Dryland salinity in south-western Australia:its origins, remedies, and future research directions.Australian Journal of Soil Research 40: 93-113.
Cody, M.L. (1986). Diversity, rarity, and conservation inMediterranean-climate regions. In M.E. Soule (ed.),Conservation Biology. The science of scarcin) and diversity:122-152. Sinauer, Massachusetts.
Cramer, V. and Hobbs, R.J. (2002). Ecologicalconsequences of altered hydrological regimes infragmented ecosystems in southern Australia:impacts and possible management responses. AustralEeolo!;'y 27: 546-564.
Cuthbert, Rand Hilton, G. (2004). Introduced housemice Mus musculus: a significant predator ofthreatened and endemic birds on Gough Island,South Atlantic Ocean? Biological Conservation 117: 483489.
Czekanowski, J. (1932). Coefficient of racial likeness, unddurchschnittliche differenz. Anthropologischer Anzeiger9: 227-249.
Driscoll, D.A. (2004). Extinction and outbreaksaccompany fragmentation of a reptile community.Ecological Applications 14: 220-240.
Ehmann, H. (1992). Encyclopedia of Australian animals.Reptiles. Angus and Robertson, Sydney.

Small ground-dwelling vertebrates
Englund, C. ,md Hamback, P.A. (2004). Scale dependenceof emigration rates. 85: 320 327.
Faith, D.P., Minchin, PR. and Belbin, L (1987).Compositional dissimilarity as a robust measure ofecological distance. Vegetatio 69: 57-68.
Ferdowsian, R., Ceorge, R., Lewis, F., McFarlane, D.,Short, K and Speed, K (1996). The extent of drylandsalinity in Western Australia. [n 4/h National Conft'renceand W;Jrkshop on the Productive Use and Rehabilitation ofSaline Lands. Albany Western Austrnlia 25-30 March1996: 89-97. Promaco Conventions, Perth.
Ceorge, KJ., McFarlane, DJ and Speed, KJ. (1995). Theconsequences of a changing hydrologic environmentfor native vegetation in southwestern Australia. [n
D.A. Saunders, ]1 CraIg and E.M. Mattiske (eds),Nature Conservation 4: The Role of Networks: 9-22.Surrey Beatty, Sydney.
Ghassemi, F., Jakeman, A. J. and Nix, H. A. (1995).Salinisation of land and water resources. Human causes,extent, management mId case studies. University of NewSouth Wales Press, Sydney.
Harper, KJ. and Gilkes, KJ. (2004). Aeolian influences onthe soils and land forms of the southern YilgarnCraton of seIT\i-arid, southwestern Australia.Geomorphology 59: 215-235.
Hatton, I] and Nulsen, KA. (1999). Towards achievingfunctional ecosystem Il1lmicry with respect to watercycling In southern Australian agriculture.Agroforestry Systems 45: 203-214.
Hingston, F.J. and Gailitis, V. (1976). The geographicvariation of salt precipitated over Western Australia.Austrnlian JOIlrnal of Soil Research 14: 319-335.
How, R.A., Cooper, N.K. and Bannister, J.L (2001).Checklist of the mammals of Western Australia.Records of the Western Austrnlian MusCllm SIlpplement63: 91-98.
How, R.A. and Dell, J. (1994). The zoogeographicsignificance of urban bushland remnants to reptilesin the Perth region, Western Australia. PacificConservation Biology 1: 132-140.
How, KA, Dell, J. and Muir, B.G. (1988). Vertebratefauna. In KA. How and K.R. Newbey (eds), Thebiological survey of the eastern goldfields of WesternAustralia. Part 4: Lake Johnston-Hyden study area.Records of the Western Austrnlian MIlsCllm Supplement30: 44-83.
King, D. and Green, B. (1993). Family Varanidae. In CJ.Glasby, G.J.B. Ross and P.L. Beesley (eds), Fauna ofAllstralia. Vo/. 2A. Amphibia and Reptilia: 253-260.Australian Government Publishing SerVIce, Canberra.
Kitchener, DJ., Chapman, A, Dell, J. Muir, B.G. andPalmer, M. (1980a). Lizard assemblage and reservesize and structure in the Western AustralIanwheatbelt some implications for conservation.BIOlogical Conservation 17: 25-62.
KItchener, D.J., Chapman, A., MUIr, B.G. and Palmer, M.(1980b). The conservation value for mammals ofreserves in the Western Australian wheatbelt.Biological Conservation 18: 179-207.
Kitchener, D.J. and How, KA (1982). Lizard species in
135
small mamland habitat isolates and islands off southwestern Western Australia. Australian WildlifeResearch 9: 357-363.
MacNallv, R. and Brown, G.W. (2001). Reptiles andhabit;t fragmentation in the box-ironbark forests ofcentral Victoria, Australia: predictions, compositionalchange and faunal nestedness. Oecologia 128: 116-125.
Mann, E.A. (1907). Does clearing increase salt in ground.Journal of Agriwlture Western Austrnlia 15: 193.
McArthur, W.M. (1993). History of landscapedevelopment. In KJ. Hobbs and D.A Saunders (eds),Reintegrntingfragmented landscapes: towards sustainableproduction and nature conservation: 10-22. SpringerVerlag, New York.
McKenzie, N.t., Belbin, L, Margules, CK and Keighery,G.J. (1989). Selecting representative reserve systemsin remote areas: a case study in the Nullarbor region,Australia. Biological Conservation 50: 239-261.
McKenzie, N.L., Rolfe, J.K. and Youngson, W.K. (1992).Vertebrate fauna. Records of the Western AIlstrnlianMIlsCllm SIlpplement 41: 37-64.
McKenzie, N.L., Rolfe, ].K. and Youngson, W.K. (1995).Vertebrate fauna. Records of the Western AustrnlimIL'vIIlsCllm SIlpplement 47: 51-85.
McKenzie, N.L. Rolfe, ]K., Hall, N.J. and Youngson,W.K. (1993). Vertebrate fauna. Records of the WesternAIlstralian AJuseIlm Supplement 42: 33-54.
McKenzie, N.L. and Rolfe, J.K. (1995). Vertebrate fauna.Records of the Western Austrnlian MIlseum Supplement49: 31-65.
McKenzie, N.t., Rolfe, J.K., Aplin, K.P., Cowan, M.A andSmith, L.A. (2000a). Herpetofauna of the southernCarnarvon Basin, Western Australia. Records of theWestern AIlstrnlian MIlSCllm Supplement 61: 335-360.
McKenzie, N.t., Keighery, G.J., Gibson, N. and Rolfe, J.K.(2000b). Patterns in the biodiversity of terrestrialenvironments in the southern Carnarvon Basin,Western Australia. Records of the Western AIlstrnlianMuseIlm SIlpplement 61: 511-546.
McKenzie, N.L. (2000c). Non-volant mammals of thesouthern Carnarvon Basin, Western Australia. Recordsof the Western /llIstrnlimI MIlsCllm SIlpplement 61: 479510.
McKenzie, N.L., Burbidge, AA., Baynes, A, Brereton, K,Gordon, G., Menkhorst, P., Metcalfe, J., Robinson,A.C and Woinarski, J.CZ. (2002). Mammals. In P.Sattler, C Creighton, K Lawson and J. Tait (eds),AIlstralian terrestrial biodiversity assessment 2002.National Land and Water Resources Audit, Canberra.
McKenzie, N.L., Burbidge, A.H. and Rolfe, J.K. (2003).Effect of salinity on small, ground-dwelling animalsin the Wester~ Australian wheatbelt. AustrnlianJormznl of Botam; 51: 725-740.
McKenzie, N.L., Gibson, N., KeIghery, G.J. and Rolfe, J.K.(this volume). Patterns in the biodiversity ofterrestrial environments in the Western Australianwheatbelt. Records of the Western Austrnlian MusCllmSupplement 67: 293-335.
McMahon, J.P., Hutchinson, M.F., Nix, H.A. and Ord,KD. (1995). ANUCLIM users guide, version 1. Centre

136
for Resource and Environmental Studies, AustralianNational University, Canberra.
Moseby, K.E. and Read, J.L. (2001). Factors affectingpitfall capture rates of small ground vertebrates inarid South Australia. II. Optimum pitfall trappingeffort. Wildlife Research 28: 61-71.
Mulcahy, M.J. and Hingston, F.H. (1962). Thedevelopment and distribution of the soils of the YorkQuairading area, Western Australia, in relation tolandscape evaluation. Soil Publication 17. CSIRO,Melbourne.
Newman, D. (1993). Species as indicators: the fall andrise of McGregor's Skink, Mana Island. EcologicalManagement 1: 35-38.
Newman, D.G. (1994). Effects of a mouse, Mus musCllllls,eradication programme and habitat change on lizardpopulations of Mana Island, New Zealand, withspecial reference to McGregor's Skink, Cyclodinamacgregori. New Zealand Journal of Zoology 21: 443-456.
Newsome, A.E. and Catling, P.e. (1979). Habitatpreferences of mammals inhabiting heathlands ofwarm temperate coastal, montane and alpine regionsof southeastern Australia. In R.L. Specht (ed.),Ecosystems of the world. Vo/. 9A. Heathlands and relatedshrublands of the world: 301-316. Elsevier, Amsterdam.
Pianka, E.R. and Schall, J.J. (1981). Species densities ofAustralian vertebrates. In A. Keast (ed.), Ecologicalbiogeography of Australia: 1675-1694. Dr W. Junk, TheHague.
Pickard, CR. (1984). The population ecology of the housemouse (Mus musculus) on Mana Island. UnpublishedM.5c. thesis, Victoria University, Wellington, N.Z.
Read, J.L. and Moseby, K.E. (2001). Factors affectingpitfall capture rates of small ground vertebrates inarid South Australia. I. The influence of weather andmoon phase on capture rates of reptiles. WildlifeResearch 28: 53-60.
Roberts, J.D. (1993). Natural history of the Anura. In CJ.Glasby, G.J.B. Ross and P.L. Beesley (eds), Fauna ofAustralia. Vo/. 2A. Amphibia and Reptilia: 28-34.Australian Government Publishing Service, Canberra.
Rolfe, J.K. and McKenzie, N.L. (2000). Comparison ofmethods used to capture herpetofauna: an examplefrom the Carnarvon Basin. Records of the WesternAustralian Museum Supplement 61: 361-370.
Salama, R.B. (1994) The evolution of saline lakes in therelict drainage of the Yilgarn River, WesternAustralia. In R.W. Renaut and W.M. Last (eds),Sedimentology and Geochemistry of Modern and AncientSaline Lakes. SEPM Special Publication 50: 189-199.Society for Sedimentary Geology, Tulsa, Oklahoma.
Sarre, S. (1995). Size and structure of populations ofOedura reticulata (Reptilia: Gekkonidae) in woodlandremnants: implications for the future regionaldistribution of a currently common species. AustralianJournal of Ecology 20: 288-298.
Sarre, S., Smith, G.T. and Meyers, J.A. (1995) Persistenceof two species of gecko (Oedura retieulata and Gehyravariegata) in remnant habitat. Biological Conservation71: 25-33.
Saunders, D.A. (1989). Changes in the avifauna of a
A. H. Burbidge, J. K. Rolfe, N. L. McKenzie, J. D. Roberts
region, district and remnant as a result offragmentation of native vegetation: the wheatbelt ofWestern Australia. A case study. BiologicalConservation 50: 99-135.
Saunders, D.A., Rowley, I. and Smith, G.T. (1985). Theeffects of clearing for agriculture on the distributionof cockatoos in the southwest of Western Australia. InA. Keast et a/. (eds), Birds of eucalypt forests andwoodlands: ecolo::,'Y' conservation, management: 309-321.Surrey Beatty, Sydney.
Sexton, M. (2003). Silent flood - Australia's salinity crisis.ABC Books, Sydney.
Singleton, G.R. and Krebs, CJ. (in press) The secret worldof wild mice. In The mouse in biomedical research.
Smith, G.T., Arnold, G.W., Sarre, S., Abensperg-Traun,M. and Steven, D.E. (1996). The effect of habitatfragmentation and livestock grazing on animalcommunities in remnants of Gimlet Eucalyptus salubriswoodland in the Western Australian wheatbelt. II.Lizards. Journal of Applied Ecology 33: 1302-1310.
Smith, G.T., Leone, J. and Dickman, CR. (1997). Smallterrestrial vertebrate communities in remnantvegetation in the central wheatbelt of WesternAustralia. Western Australian Naturalist 21: 235-249.
Sneath, P.H.A. and Sokal, R.R. (1973). Numericaltaxonomy. The principals and practice of numericalclassification. W.H. Freeman, San Francisco.
Storr, G.M. (1964). Some aspects of the geography ofAustralian reptiles. Senckenbergiana Biologica 45: 577589.
Storr, G.M., Smith, L.A. and Johnstone, R.E. (1983).Lizards of Western Australia. If. Dragons and monitors.Western Australian Museum, Perth.
Storr, G.M., Smith, L.A. and Johnstone, R.E. (1990).Lizards of Western Australia. Ill. Geckos and pygopods.Western Australian Museum, Perth.
Storr, G.M., Smith, L.A. and Johnstone, R.E. (1999).Lizards of Western Australia. I. Skinks. WesternAustralian Museum, Perth.
Storr, G.M., Smith, L.A. and Johnstone, R.E. (2002). Snakesof Western Australia. Western Australian Museum,Perth.
Taylor, J.A. and Friend, G.R. (1984). Sampling strategiesfor fauna surveys. In K. Myers, e.R. Margules and LMusto (eds), Survey methods for nature conservation:179-192. CSIRO, Canberra.
Thackway, R. and Creswell, LD. (Eds) (1995). An interimbiogeographic regionalisation for Australia: a frameworkfor setting priorities in the National Reserves SystemCooperative Program, version 4.0. Australian NatureConservation Agency, Canberra.
Tyler, M.J., Smith, L.A. and Johnstone, R.E. (2000). Frogsof Western Australia. Western Australian Museum,Perth.
van Gool, D. and Moore, G. (1999). Land evaluationstandards for land resource mapping, 2nd edn.Resource Management Technical Report 181.Agriculture Western Australia, Perth.
Watts, e.H.5. and Aslin, H.J. (1981). The Rodents ofAustralia. Angus and Robertson, Sydney.

Small ground-dwelling vertebrates
Warner, KR. and Chesson, !)L. (1 Coexistencemediated recruitment fluctuations: a field guide tothe storage effect. American Natumlist 125: 769-787.
Witten, G.J. (1982) Phyletic groups within the familyAgamidae (Reptilia: Lacertilia) in Australia. In W.KBarker and P.J.M. Greenslade Evolution of the
and fauna of arid Australia: 225-228. PeacockPublications, Frewville, South Australia.
137
Woinarski, feZ. Fisher, A. and Milne, D. (1999).Distribution patterns of vertebrates in relation to anextensive ratnfall gradient and variation in soiltexture in the tropical savannas of the NorthernTerritory, Australia. Journal of Tropical Ecology 15: 381398.
Wood, W.E. (1924) Increase of salt in soil and streamsfollowing the destruction of the native vegetation.Journal of the Royal Society of Western Australia 10: 3547.
Electronic appendices are on CD inside the back cover