spatial patterns of plant diversity below-ground as ...labs.eeb.utoronto.ca/barrett/pdf/kesankurti...
TRANSCRIPT
Molecular Ecology (2011) 20, 1289–1302 doi: 10.1111/j.1365-294X.2010.04989.x
Spatial patterns of plant diversity below-ground asrevealed by DNA barcoding
PRASAD R. KESANAKURTI , * ARON J. FAZEKAS,* KEVIN S. BURGESS,†1 DIANA M. PERCY,‡§
STEVEN G. NEWMASTER,* SEAN W. GRAHAM,‡§ SPENCER C. H. BARRETT,† MEHRDAD
HAJIBABAEI– and BRIAN C. HUSBAND*
*Department of Integrative Biology, University of Guelph, Guelph, Ontario, Canada N1G 2W1, †Department of Ecology &
Evolutionary Biology, University of Toronto, 25 Willcocks Street, Toronto, Ontario, Canada M5S 3B2, ‡UBC Botanical Garden
& Centre for Plant Research, University of British Columbia, Vancouver, British Columbia, Canada V6T 1Z4, §Department of
Botany, University of British Columbia, Vancouver, British Columbia, Canada V6T 1Z4, –Biodiversity Institute of Ontario,
Department of Integrative Biology, University of Guelph, Guelph, Ontario, Canada N1G 2W1
Corresponde
E-mail: vkesa1Current add
University, C
� 2011 Black
Abstract
Our understanding of the spatial organization of root diversity in plant communities and
of the mechanisms of community assembly has been limited by our ability to identify
plants based on root tissue, especially in diverse communities. Here, we test the
effectiveness of the plastid gene rbcL, a core plant DNA barcoding marker, for investigating
spatial patterns of root diversity, and relate observed patterns to above-ground community
structure. We collected 3800 root fragments from four randomly positioned, 1-m-deep
soil profiles (two vertical transects per plot), located in an old-field community in
southern Ontario, Canada, and extracted and sequenced DNA from 1531 subsampled
fragments. We identified species by comparing sequences with a DNA barcode
reference library developed previously for the local flora. Nearly 85% of sampled root
fragments were successfully sequenced and identified as belonging to 29 plant species
or species groups. Root abundance and species richness varied in horizontal space and
were negatively correlated with soil depth. The relative abundance of taxa below-
ground was correlated with their frequency above-ground (r = 0.73, P = 0.0001), but
several species detected in root tissue were not observed in above-ground quadrats.
Multivariate analyses indicated that diversity was highly structured below-ground, and
associated with depth, root morphology, soil chemistry and soil texture, whereas little
structure was evident above-ground. Furthermore, analyses of species co-occurrence
indicates strong species segregation overall but random co-occurrence among confa-
milials. Our results provide insights into the role of environmental filtering and
competitive interactions in the organization of plant diversity below-ground, and also
demonstrate the utility of barcoding for the identification of plant roots.
Keywords: barcoding, checkerboard sampling, competitive interactions, roots, species co-occurrence,
species diversity
Received 12 August 2010; revision received 14 November 2010; accepted 22 November 2010
Introduction
The spatial and temporal organization of biological
diversity within communities has long interested ecolo-
nce: Prasad R. Kesanakurti, Fax: 519-767-1656;
ress: Department of Biology, Columbus State
olumbus, GA 31907-5645, USA
well Publishing Ltd
gists because of its relation to assembly processes (Cody
& Diamond 1975), community dynamics and ecosystem
function (Tilman et al. 1997; Webb et al. 2002; Silver-
town 2004; Hooper et al. 2005). The magnitude and dis-
tribution of species diversity is the product of two
nonmutually exclusive mechanisms: environmental fil-
tering (Cody & Diamond 1975; Weiher et al. 1998; Wei-
her & Keddy 1999) and interspecific competition for
limiting resources (Tilman 1982, 1988). In the first case,
1290 P. R . KE SANAKURTI ET AL.
the distribution of species within communities reflects
spatial heterogeneity in the environment, coupled with
differences in the establishment and persistence of spe-
cies because of niche differentiation (Weiher & Keddy
1999; Cornwell et al. 2006). Species tend to sort accord-
ing to the scale and grain of the abiotic environment,
and therefore tend to coexist with ecologically and phy-
logenetically similar species compared with the regional
species pool (Losos 2008). In the second case, commu-
nity structure reflects the past history of interspecific
interactions (e.g. competition; Tilman 1988). These inter-
actions cause exclusion of similar species and coexis-
tence of dissimilar species relative to the regional pool
(MacArthur & Levins 1967; Abrams 1983; Tofts & Sil-
vertown 2000).
The analysis of plant communities has played a cen-
tral role in the study of community structure, commu-
nity assembly and coexistence. Researchers have
examined patterns of species coexistence, ecomorpho-
logical dispersion of coexisting species (Armbruster
et al. 1994; Weiher et al. 1998), phylogenetic relations of
co-occurring species (Webb et al. 2002; Cadotte et al.
2009), and factors governing the distribution and mag-
nitude of diversity, such as extrinsic disturbance (e.g.
fire, soil erosion; Reice 1994) and interspecific interac-
tions (Hartnett & Wilson 1999; Reynolds et al. 2003). In
most cases, these factors are related to patterns of spe-
cies or trait diversity observed in the vegetative com-
munities above-ground. Attention to community
structure below-ground, consisting of roots, seeds and
rhizomes, and its relation to above-ground patterns is
poorly understood (Casper & Jackson 1997). This is sur-
prising given that the primary organs of nutrient acqui-
sition exist below-ground (Jackson et al. 2008), and that
strong abiotic gradients in water, nutrients, and soil tex-
ture exist in vertical and horizontal space. Some studies
(Wilson 1988; Casper & Jackson 1997) suggest that
below-ground interactions may, in fact, be more impor-
tant than above-ground interactions for organizing
diversity.
The general lack of information on root community
structure reflects the practical difficulties in identifying
roots to the level of species, quantifying diversity and
mapping root distributions (Mommer et al. 2008). Vari-
ous methods have been used in the past, with mixed
success. Researchers have attempted to map roots
through detailed excavation of soil profiles (Kummerow
et al. 1977; Brisson & Reynolds 1994), but roots are
often entangled and difficult to trace back to individual
plants. Identification of roots based on morphology
may be possible to a limited extent (Cutler et al. 1987)
but is generally not possible at a community scale,
given similarities in root architecture, colour and struc-
ture among species. As a result, biologists have tended
to focus on the relation between above-ground plant
diversity and abundance, and below-ground properties,
such as root biomass and density (Hook et al. 1994;
Mou et al. 1995). More recently, ecologists have used
chemical composition as a species marker when diver-
sity is limited (Caldwell et al. 1996; Roumet et al. 2006).
Similarly, the extent of root systems has been inferred
using radioactive tracers or stable isotopes to determine
from where resources are being drawn (Caldwell &
Eissenstat 1987; Mamolos et al. 1995).
DNA-based methods offer a potentially powerful set
of tools for exploring fine-scale patterns of species
diversity below-ground through the analysis of roots.
They allow taxa to be identified by comparing DNA
sequences (Linder et al. 2000) or restriction-fragment
lengths (Bobowski et al. 1999; Ridgway et al. 2003)
against reference databases. The efficacy of DNA-based
methods, including DNA barcoding, in the study of
root organization in plant communities has not been
evaluated in detail. Jackson et al. (1999) and Linder
et al. (2000) used variability at the nuclear ribosomal
internal transcribed spacer region, ITS-1, for studying
root distributions, although in these studies relatively
few species were investigated. More recently, Brunner
et al. (2001) mapped fine roots of a community of 30
tree species using restriction-fragments derived from a
plastid intron, and Taggart et al. (2010) used the size of
labelled amplification products for three noncoding
plastid loci to identify single and mixed root samples in
a grassland.
The various DNA-based approaches have different
strengths and limitations. Restriction-fragment analyses
are simpler and may offer a cost-effective method in
some situations. Plant DNA barcoding as currently
implemented (e.g., CBOL Plant Working Group, 2009)
formalizes the use of standardized sequence-based
markers from the plastid genome, whose homology is
clear-cut. The homology of fragment length-based
markers is generally inherently harder to determine,
especially for distantly related taxa (Olmstead & Palmer
1994), and the nuclear ribosomal ITS sequences used in
some studies (Linder et al. 2000) may be problematic in
some plant groups, due to concerns about paralogy,
pseudogenes, contamination and other sequencing arte-
facts (e.g. Alvarez & Wendel 2003; Feliner & Rossello
2007). For animals, barcode researchers have reported
high rates of species discrimination using a portion of
the mitochondrial region cytochrome c oxidase 1 (COI
or cox1) (Hebert et al. 2003). In plants, two plastid
genes, rbcL and matK, have been identified as suitable
core barcode markers and endorsed by the international
plant barcoding community (CBOL Plant Working
Group 2009), although it is also recognized that rates of
species resolution are generally lower than in animals
� 2011 Blackwell Publishing Ltd

BARCODING OF PLANT ROOTS 1291
(CBOL Plant Working Group 2009; Fazekas et al. 2009).
Despite the promise of DNA-based approaches, DNA
barcoding has yet to be applied to an analysis of spatial
variation in root diversity in plant communities.
Here, we use plant DNA barcoding to identify spe-
cies in the root flora of an old-field in southern Ontario,
Canada, and to quantify the diversity and spatial orga-
nization of species in relation to each other and to abi-
otic gradients in the soil. We address the following
specific questions: (i) How effective is the plant plastid
barcode rbcL for discriminating species based on root
fragments? (ii) How diverse is the local root community
and is there a relation between frequencies of species
below- vs. above-ground? (iii) Is there heterogeneity in
the taxonomic diversity of roots in vertical and horizon-
tal space? and (iv) To what extent does under-ground
community structure reflect interactions among species
or with the abiotic environment?
Materials and methods
Sampling design
We sampled plant diversity above- and below-ground
within a 30 · 30 m plot in an old-field at the Koffler Sci-
entific Reserve (44� 03¢ N, 79� 29¢ W), a University of
Toronto field site near Newmarket, Ontario (hereafter
KSR). Within this area, we randomly located four
5 · 5 m plots (Fig. 1a) and subdivided them into 25,
1 m · 1 m quadrats. We documented the above-ground
flora in each plot by recording the presence ⁄ absence of
all seed-plant species in each quadrat monthly, from
June to September (plots were checked more frequently
to ensure no short-lived plants were missed). Plants
were identified to species, when possible, based on
morphological keys; some individuals lacking reproduc-
tive parts could only be identified to genus. The relative
Study area, 30 m x 30 m (a)
(b)
Plot, 5 m x 5 m
Soil profile
0 cm51015
100
202530...
Soil profile
Fig. 1 Sampling design: (a) overview; (b) vertical section of
soil profile.
� 2011 Blackwell Publishing Ltd
frequency of each taxon was estimated as the propor-
tion of the quadrats occupied, to the nearest 1%.
To sample root diversity, we exposed a 1 m
(height) · 1 m (width) soil profile in the centre of each
sampling plot (Fig. 1b). The vertical face of each profile
faced one of the four cardinal directions (randomly
assigned) and was accessed by a soil pit dug from one
side of the sampling plot. We subdivided two 1-m-tall
vertical transects (columns), 80 cm apart, into
5 · 5 · 5 cm soil cubes (20 contiguous cubes per col-
umn, 40 per sampling plot). A total of 160 soil cubes
were sampled across all four plots and eight columns.
We collected all root fragments from each soil cube
(a total of 3800 fragments), placed them in envelopes
and then in sealable plastic bags with silica gel to dry
them rapidly at room temperature for storage prior to
DNA extraction.
Soil nutrient and texture analysis
In each plot, we sampled a third vertical soil column
for soil nutrient and texture analysis, located between
the two root sampling columns. Soil samples were col-
lected from five depths: 0–10; 20–30; 40–50; 60–70 and
80–90 cm. For each sample, we estimated total nitrogen
(% dry), phosphorus (mg ⁄ L soil dry), potassium (mg ⁄ Lsoil dry), magnesium (mg ⁄ L soil dry) and pH at the
University of Guelph, Lab Services, Soil and Nutrient
Laboratory. We used a soil texture analysis kit (LaMotte
Co.) to estimate the proportions of sand, silt and clay in
each soil sample.
DNA barcoding of root fragments
We identified root fragments using the core DNA bar-
code rbcL (CBOL Plant Working Group 2009) at the
Canadian Centre for DNA Barcoding (CCDB), Univer-
sity of Guelph, Canada. We focused on this DNA
region as it has a high rate of recoverability using
currently available standard primers: rbcLaF and
rbcLajf634R (Fazekas et al. 2008; CBOL Plant Working
Group 2009) and we therefore expected it to provide a
satisfactory level of species identification in the context
of a local flora without adding additional loci (Fazekas
et al. 2008). We did not attempt the other officially sanc-
tioned barcoding region, matK (CBOL Plant Working
Group 2009), because future workers may wish to use
environmental samples of pooled under-ground mate-
rial, for which multilocus species assignment may be
impractical (in pooled samples, there may be no
straightforward way of deciding which sets of loci com-
prise those from any single species). A main goal of our
study was therefore to see how well a single locus can
perform in identifying plants to species in this context.

1292 P. R . KE SANAKURTI ET AL.
We extracted DNA from root fragments ‡2 cm in
length using a semi-automated, membrane-based proto-
col (Ivanova et al. 2008). We focussed on this size range
based on a preliminary experiment to determine the
minimum root length necessary for routine recovery of
adequate DNA. We extracted DNA from fine root frag-
ments of 1, 2, 3 and 4 cm in length from five test spe-
cies, Erigeron spp., Plantago lanceolata, Poa pratense,
Populus tremuloides and Vitis riparia, and verified that
samples at least 2 cm in length amplified best for the
rbcL primers used here, probably because some shorter
fragments were dead or degraded. From the 3800 root
fragments collected, we randomly sampled up to 10
fragments, each at least 2 cm in length per soil cube for
a total of 1531 fragments.
We amplified DNA with a modified protocol from
the Canadian Centre for DNA Barcoding (http://
www.ccdb.ca/pa/ge/research/protocols/amplification).
In each reaction, we included 6.25 lL of 10% trehalose,
2 lL of dd H2O, 1.25 lL of 10· buffer (Sigma-Aldrich),
0.625 lL of 50 mM MgCl2, 0.188 lL of 10 lM of each pri-
mer (Sigma-Aldrich), 0.0625 lL of 10 mM dNTPs
(Sigma-Aldrich), 0.09 lL of Taq polymerase (5 U ⁄ lL;
Sigma-Aldrich) and 2 lL of DNA template (�20 ng ⁄ lL).
All PCR reagents except primers and Taq polymerase
were added in volumes specified in the protocol. We
found that increasing the volume of rbcL primers and
Taq polymerase 1.5 times (0.188 and 0.09 lL, respec-
tively) the amounts in the original protocol facilitated
amplification of root DNA. Conditions for amplification
of rbcL include initial denaturation at 95 �C for 1 min
followed by 35 cycles of denaturation at 95 �C for 30 s,
annealing at 55 �C for 40 s and extension at 72 �C for
1 min, with a final extension at 72 �C for 10 min. Con-
centrations of the amplified product were determined
for a subset of samples using a Nanodrop spectropho-
tometer (NanoDrop� Technologies, Wilmington, DE,
USA), and ranged from 100 to 120 ng ⁄ lL. We per-
formed sequencing reactions on both strands. In each
sequencing reaction, we added 0.25 lL of dye termina-
tor mix v3.1, 1.9 lL of 5· sequencing buffer, 5 lL of
10% trehalose, 1 lL of 10 mM primer, 0.9 lL of dd H2O
and 0.5–1.2 lL of the unpurified PCR reaction. Sequenc-
ing reactions were performed in a thermocycler under
the following conditions: initial denaturation at 96 �C
for 2 min, followed by 30 cycles of denaturation at
96 �C for 30 s, annealing at 55 �C for 15 s and extension
at 60 �C for 4 min. (http://www.ccdb.ca/pa/ge/
research/protocols/sequencing). Sephadex-purified cycle
sequencing products were run on an ABI 3730XL
sequencer (Applied Biosystems). We edited DNA
sequences using Sequencher (Gene Codes Corp., Ann
Arbor, MI) for base-calling and contig preparation. Bidi-
rectional contigs were produced for all but 11 samples.
We identified each root fragment by comparing its
rbcL sequence to a reference database of sequences for
>400 vouchered species collected previously at KSR
and identified using morphological characters (K. S.
Burgess,unpublisheddata,http://www.boldsystems.org/
views/idrequest_plants.php). We searched the database
with each root sequence using the stand-alone BLAST
algorithm (Altschul et al. 1990) (Version 2.2.22). When
the query sequence had a bit score of >1000 and 99%
identity with a single sequence in our reference library,
it was assigned that species name as the best match.
Poorer matches were treated as unresolved given the
current information. We identified all unresolved taxa to
family by searching the GenBank database.
Analysis
We examined variation in number of root fragments
and species richness per soil cube using ANOVA as
implemented in JMP (v8.0, SAS Institute Inc. 2009) with
depth, plot and column nested within plot (random
effect) as sources of variation. We compared means
using Tukey’s HSD. Variation in all soil nutrient and
texture variables was tested with respect to plot and
depth. We also compared their relative frequency of
each species in the eight soil columns to the relative fre-
quency in the 100 above-ground quadrats using a Pear-
son correlation coefficient.
We examined patterns of species co-occurrence
within soil cubes using EcoSim v7.72 (Gotelli & Entsm-
inger 2004). We compared these patterns with a null
expectation using 50 000 Monte Carlo randomizations
of the data, in which species frequency and cube spe-
cies diversity were held constant. Data for all taxa that
were present in at least 5% of soil cubes were included
(N = 10 taxa). We measured species co-occurrence using
two different indices: (i) Stone & Roberts (1990) c-score:
the c-score measures the average number of ‘checker-
board units (CU)’ between all possible pairs of species
that occur at least once in the matrix. The number
of CU for each species pair is calculated as:
CU = (ri ) S) (rj ) S), where S is the number of sites
containing both species; and ri and rj are the row totals
for species i and j; and (ii) the number of checkerboard
species pairs; this index follows directly from Diamond’s
(1975) assembly rules analysis. For this index, EcoSim
scans the rows of the matrix and tabulates the number of
species pairs that never co-occur in any site. Any c-score
or checkerboard number that is higher than the random
expectation reflects a high degree of segregation of spe-
cies, whereas a low score or number reflects a high
degree of species co-occurrence. We conducted co-occur-
rence analysis on root fragments collected from all soil
cubes sampled. To further understand the role of spatial
� 2011 Blackwell Publishing Ltd

Table 1 Analysis of variance of number of fragments and
number of plant species per 5 cm3 soil cube
Source of variation d.f.
Sum of
squares F-ratio P
(a) Number of fragments
Depth 19 186 614.50 92.92 <0.0001*
Plot 3 3561.05 1.78 0.2900
Column (plot) 4 2667.55 6.31 0.0002*
Plot · depth 57 17 205.45 2.86 <0.0001*
Error 76 8033.45
(b) Number of species
Depth 19 628.32 26.67 <0.0001*
Plot 3 17.12 1.13 0.4383
Column (plot) 4 20.28 4.09 0.0047*
Plot · depth 57 67.51 0.96 0.5683
Error 76 94.22
* Indicates significant value.
Cubes were sampled from two vertical columns in each of four
sampling plots in an old-field community in Ontario, Canada.
129.8
93
64.5
51.8
30.1
18.3 18 16.111 8.8 11.4 8 6.6 4.9 1.4 0.3 0.4 0.5 0.4 0
0
20
40
60
80
100
120
140
160
Nu
mb
er o
f ro
ot
frag
men
ts
5 10 15 20 25 30 35 40 45 50 55 60 65 70 75 80 85 90 95 100Soil depth (cm)
Fig. 2 Mean number (±SE) of root fragments present as a
function of depth in the soil column. Each mean is the result of
observations from eight vertical soil columns, distributed
among four sampling plots in an old-field community in
Ontario, Canada.
BARCODING OF PLANT ROOTS 1293
variation in the environment and phylogeny in relation
to species co-occurrence, we repeated the analysis on
shallow (<20 cm) and deep (>20 cm) soil cubes sepa-
rately, and also individually for two plant families (Poa-
ceae, Asteraceae).
We used multivariate ordination methods imple-
mented in CANOCO 4.5 (ter Braak & Smilauer 2002) to
test for spatial community structure below- and above-
ground. For root diversity, we used the species pres-
ence ⁄ absence data with soil cube as the experimental
unit (N = 160). For above-ground structure, we used the
presence ⁄ absence of species within the 100 quadrats. A
detrended correspondence analysis (DCA; ter Braak
1986) was first used to identify the length of the ordina-
tion axis (i.e. the extent of variation in species scores)
and determine the need for either a linear or unimodal
ordination model. The length of the above-ground gra-
dient (3.04 SD) and below-ground gradient (5.35 SD)
justified the use of a canonical correspondence analysis
(CCA) in both cases to characterize variation among
experimental units using species data and a suite of
environmental variables. The CCA of above-ground
diversity was based on 100 above-ground quadrats
comprising 39 taxa and eight environmental variables
[nitrogen (N); phosphorus (P); potassium (K); magne-
sium (Mg); pH; sand; silt; clay] and one covariable
(habitat type: forest or old-field based on proximity to
adjacent forest). The CCA of below-ground diversity
was based on 160 below-ground soil cubes and 29 taxa
(identified using DNA barcoding) constrained by nine
environmental variables (those listed above, plus the
depth of sample) and two covariables (column position
and habitat type). We controlled for non-independence
among soil cubes within columns by including column
as a covariate in the CCA and transforming variables
with a generalized least squares (PGLS) transformation.
We used a discriminant function analysis (DFA;
Ramsey & Schafer 1997) to separate clusters initially
identified in the CCA (i.e. below-ground community)
with respect to six functional traits [life form (grass,
sedge, forb, shrub, tree), life cycle (perennial, annual
and biennial), root morphology (fibrous, tap), growth
strategy (r vs. k strategy) seed type (direct seed banker,
direct on site, windborne on site), shade tolerance
(shade tolerant, shade intolerant)]. We scored all spe-
cies for these traits using a database reported in the
FOIBIS database (Flora of Ontario Integrated Botanical
Information Service; http://www.uoguelph.ca/foibis/).
Using the CCA clusters as a priori groups and the six
traits, the DFA tests whether the groups can be dis-
criminated and indicates the relative contribution of
traits in separating the groups. The analysis was
repeated with each trait separately to detect the effects
of collinearity.
� 2011 Blackwell Publishing Ltd
Results
Root fragment abundance
In total, we collected 3800 root fragments from 160 soil
cubes from eight vertical columns in four sampling
plots. The mean number of fragments per soil cube dif-
fered among columns within plots but not among plots
(Table 1a). In addition, mean fragment number
declined significantly with depth (Fig. 2). Mean frag-
ment number dropped sharply from 130 at 5 cm to 18.3
at 30 cm and then more gradually to 0.0 at 100 cm.
Mean values at 45 cm depth or greater were different

1294 P. R . KE SANAKURTI ET AL.
from cubes at or above 25 cm. Values at depths of 5
through 25 cm were significantly different from each
other, except between 15 and 20 cm (Fig. 2).
Root taxonomic diversity
We amplified rbcL in 96% of 1531 samples and obtained
high-quality contigs for 1285 root fragments and unidi-
rectional sequences for 11 fragments (total 84.6%
sequencing success); a success rate that was relatively
constant with soil depth (Fig. 3). We submitted these
1296 sequences to GenBank (Accession nos: HQ623676-
HQ624971). The remaining 16% of samples produced
chromatograms of lower quality, making base-calling
unreliable.
Using the stand-alone BLAST algorithm and an rbcL
reference database for KSR, we identified 26 taxa from
11 families among the root fragments (Table S1, Sup-
porting information). All root sequences that have a
BLAST score value less than 1000 and percent similarity
less than 99% were designated as unresolved taxa. We
found three such taxa, which were then identified to
family (two to Pinaceae, one to Fabaceae) using a search
of GenBank. In total, we identified 29 taxa. Seventeen
taxa (58.6%) were identified to species; nine taxa were
identified to genus and three to family. Of all the 29
taxa identified, more than 55% (N = 16) belong to two
families: Asteraceae and Poaceae. The remaining 13 taxa
comprised 10 genera from 10 families. The genera
Agrostis, Cirsium, Hieracium, Lolium, Poa, Prunus, Solidago
and Symphyotrichum contain multiple species at KSR,
but these could not be distinguished by their roots
using the rbcL barcode. Only one species was identified
for each of the remaining genera.
The taxa identified ranged in abundance from 1 frag-
ment (Clinopodium vulgare, Hieracium spp., Leucanthemum
0
200
400
600
800
1000
1200
5 10 15 20 25 30 35 40 45 50 55 60 65 70 75 80 85 90 95 100
Nu
mb
er o
f ro
ot
frag
men
ts
Soil depth (cm)
Fig. 3 Number of root fragments observed (circle), sampled
(square) and successfully sequenced (triangle) as a function of
depth in the soil column. Each value is the sum of samples in
eight vertical soil columns.
vulgare, Lolium spp., Medicago lupulina, Prunus spp., Quer-
cus macrocarpa) to 365 fragments (Solidago spp.). Root
fragment abundance was related to root architecture.
Species with fibrous roots were more abundant in the soil
samples than those with tap roots (F1,24 = 3.8, P = 0.06;
�xfibrous ¼ 79:07 fragments, �xtaproot ¼ 9:5 fragments).
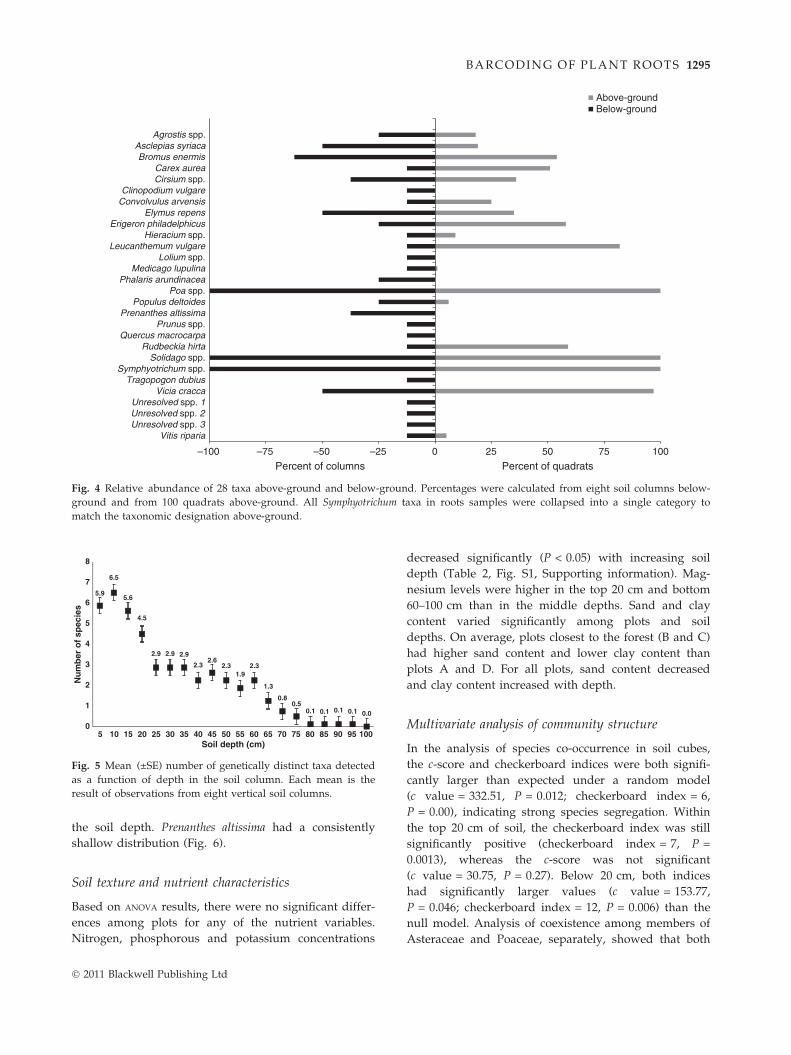
The relative frequency of taxa in root samples was
positively correlated with their relative frequency in
quadrats above-ground (r = 0.73; N = 29, P < 0.0001;
Fig. 4). Nineteen taxa were detected in both above- and
below-ground samples although not always in the same
proportions (Fig. 4). Some taxa, such as Poa spp., Soli-
dago spp. and Symphyotrichum spp. were frequent both
below- and above-ground, whereas Hieracium spp., Pop-
ulus deltoides and Vitis riparia were infrequent above-
and below-ground. However, asymmetries in frequency
were common. Six species, Carex aurea, Convolvulus
arvensis, Erigeron philadelphicus, Leucanthemum vulgare,
Rudbeckia hirta and Vicia cracca were more common
above-ground than below; whereas species, such as
Populus deltoides, Medicago lupulina and Vitis riparia were
more frequent below-ground. Ten taxa (Clinopodium
vulgare, Lolium spp., Phalaris arundinacea, Prenanthes
altissima, Prunus spp., Quercus macrocarpa, Tragapogon
dubius and the three unresolved taxa) were only found
in the root samples but not in the above-ground vegeta-
tion of the sampling plots.
Spatial organization of root diversity
The mean number of species that we detected ranged
from 0 to 11 per cube. Mean species richness per cube
differed among vertical columns within plots but not
between plots (Table 1b). It also decreased significantly
with soil depth. In contrast to the patterns for root frag-
ment abundance, the decline in species richness
occurred in a stepwise fashion with significant reduc-
tions at 15–20 and 60–65 cm (Fig. 5). Based on a
Tukey’s means comparison, there are no significant
differences among cubes within the 5–15 cm range,
from 20 to 60 cm and from 80 to 100 cm (Fig. 5).
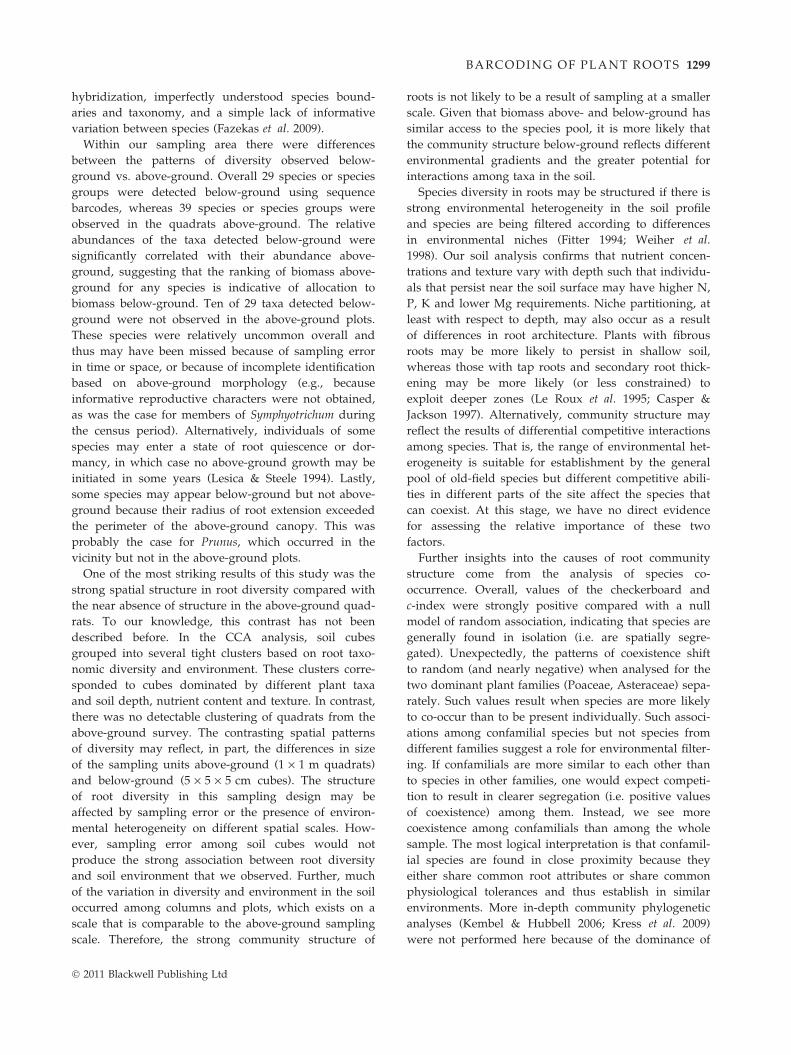
Root distribution profiles for 10 taxa present in at
least eight (5%) of the 160 soil cubes illustrate the taxo-
nomic variation in the maximum depth and abundance
of roots through the soil column (Fig. 6). Two of the
most abundant taxonomic groups, Poa spp. and Solidago
spp. were present in all columns at 5–15 cm depth.
These species declined with increasing depth and
occurred up to 75 and 80 cm depth. Other taxa, such as
Bromus inermis and Symphotrichum spp. also declined
markedly with depth but had only moderate abun-
dance. In contrast, species such as Elymus repens and
Phalaris arundinacea, although present to 65–75 cm
depth, have relatively uniform low frequencies through
� 2011 Blackwell Publishing Ltd
5.9
6.5
5.6
4.5
2.9 2.9 2.9
2.32.6
2.31.9
2.3
1.3
0.80.5
0.1 0.10.1 0.1 0.0
0
1
2
3
4
5
6
7
8
Nu
mb
er o
f sp
ecie
s
5 10 15 20 25 30 35 40 45 50 55 60 65 70 75 80 85 90 95 100Soil depth (cm)
Fig. 5 Mean (±SE) number of genetically distinct taxa detected
as a function of depth in the soil column. Each mean is the
result of observations from eight vertical soil columns.
–100 –75 –50 –25 0 25 50 75 100
Vitis ripariaUnresolved spp. 3Unresolved spp. 2Unresolved spp. 1
Vicia craccaTragopogon dubius
Symphyotrichum spp.Solidago spp.
Rudbeckia hirtaQuercus macrocarpa
Prunus spp.Prenanthes altissima
Populus deltoidesPoa spp.
Phalaris arundinaceaMedicago lupulina
Lolium spp.Leucanthemum vulgare
Hieracium spp.Erigeron philadelphicus
Elymus repensConvolvulus arvensisClinopodium vulgare
Cirsium spp.Carex aurea
Bromus enermisAsclepias syriaca
Agrostis spp.
Percent of columns Percent of quadrats
Above-groundBelow-ground
Fig. 4 Relative abundance of 28 taxa above-ground and below-ground. Percentages were calculated from eight soil columns below-
ground and from 100 quadrats above-ground. All Symphyotrichum taxa in roots samples were collapsed into a single category to
match the taxonomic designation above-ground.
BARCODING OF PLANT ROOTS 1295
the soil depth. Prenanthes altissima had a consistently
shallow distribution (Fig. 6).
Soil texture and nutrient characteristics
Based on ANOVA results, there were no significant differ-
ences among plots for any of the nutrient variables.
Nitrogen, phosphorous and potassium concentrations
� 2011 Blackwell Publishing Ltd
decreased significantly (P < 0.05) with increasing soil
depth (Table 2, Fig. S1, Supporting information). Mag-
nesium levels were higher in the top 20 cm and bottom
60–100 cm than in the middle depths. Sand and clay
content varied significantly among plots and soil
depths. On average, plots closest to the forest (B and C)
had higher sand content and lower clay content than
plots A and D. For all plots, sand content decreased
and clay content increased with depth.
Multivariate analysis of community structure
In the analysis of species co-occurrence in soil cubes,
the c-score and checkerboard indices were both signifi-
cantly larger than expected under a random model
(c value = 332.51, P = 0.012; checkerboard index = 6,
P = 0.00), indicating strong species segregation. Within
the top 20 cm of soil, the checkerboard index was still
significantly positive (checkerboard index = 7, P =
0.0013), whereas the c-score was not significant
(c value = 30.75, P = 0.27). Below 20 cm, both indices
had significantly larger values (c value = 153.77,
P = 0.046; checkerboard index = 12, P = 0.006) than the
null model. Analysis of coexistence among members of
Asteraceae and Poaceae, separately, showed that both

012345678 Asclepias syriaca
012345678
Bromus inermis
012345678
Elymus repens
0
1
2
3
4
5
6
7
8
Poa spp.
012345678
Phalaris arundinacea
012345678
Solidago spp.
012345678
Symphyotrichum/Conyza
012345678
Symphyotrichum spp.
012345678
Prenanthes altissima
Soil depth (cm)
Nu
mb
er o
f so
il cu
bes
012345678
5 10 15 20 25 30 35 40 45 50 55 60 65 70 75 80 85 90 95 100 5 10 15 20 25 30 35 40 45 50 55 60 65 70 75 80 85 90 95 100
5 10 15 20 25 30 35 40 45 50 55 60 65 70 75 80 85 90 95 100
5 10 15 20 25 30 35 40 45 50 55 60 65 70 75 80 85 90 95 100
5 10 15 20 25 30 35 40 45 50 55 60 65 70 75 80 85 90 95 100
5 10 15 20 25 30 35 40 45 50 55 60 65 70 75 80 85 90 95 100
5 10 15 20 25 30 35 40 45 50 55 60 65 70 75 80 85 90 95 100
5 10 15 20 25 30 35 40 45 50 55 60 65 70 75 80 85 90 95 100
5 10 15 20 25 30 35 40 45 50 55 60 65 70 75 80 85 90 95 100 5 10 15 20 25 30 35 40 45 50 55 60 65 70 75 80 85 90 95100
Populus deltoides
Fig. 6 Root profiles of 10 taxa identified by DNA barcoding for taxa occupying at least eight cubes. Symphyotrichum and Conyza have
identical score and similarity index.
1296 P. R . KE SANAKURTI ET AL.
indices of coexistence were not significantly different
from random expectations (c value = 89.9, P = 0.158;
checkerboard index = 43, P = 0.239), suggesting no
strong segregation among members of these two fami-
lies.
The ordination of above-ground variation in diver-
sity revealed no apparent spatial structure. Most
variation was explained by the first two axes;
however, low eigenvalues (Table 3) and intermixed
quadrats from different plots (Fig. 7) indicate a lack
of structure. Although correlations between species
scores and environment were moderate (Table 3), they
are not biologically meaningful because of the small
degree of variation represented on the first four axes.
In contrast to the results for above-ground diversity,
below-ground diversity exhibited considerable commu-
nity structure. The CCA resulted in ordinations with
clusters of experimental units (based on species counts)
associated with depth, position relative to adjacent
forest, dominant species and minerals (Fig. 8). The first
� 2011 Blackwell Publishing Ltd

Table 2 Summary of analysis of variance for eight soil nutri-
ent, pH and texture variables
Soil variable
Plot Depth
F P F P
Total nitrogen (N) 1.86 0.190 65.34 <0.0001
Phosphorus (P) 0.62 0.615 39.88 <0.0001
Potassium (K) 1.04 0.410 15.14 0.0001
Magnesium (Mg) 0.65 0.600 5.83 0.0076
pH 2.29 0.130 6.01 0.0068
Sand (%) 4.46 0.025 23.68 <0.0001
Silt (%) 1.88 0.187 9.82 0.0009
Clay (%) 5.51 0.013 23.74 <0.0001
For all variables the effects of plot and soil depth had 3 and 4
d.f., respectively (error d.f. = 12).
Table 3 Summary of multivariate ordinations (canonical cor-
respondence analysis) of above-ground and below-ground
plant diversity in an old-field community in Ontario, Canada
Summary variables Sampling
Axis
1 2 3 4
Eigenvalues Above-ground 0.058 0.025 0.015 0.011
Below-ground 0.351 0.174 0.013 0.090
Species ⁄ environment
correlations
Above-ground 0.518 0.515 0.510 0.515
Below-ground 0.821 0.572 0.557 0.501
Cumulative %
variance of
species data
explained
Above-ground 40.1 60.2 71.1 79.3
Below-ground 71.9 88.1 89.1 92.2
The majority of variation is explained by the first and second
axes (shaded). Low eigenvalues indicate no apparent structure
above-ground.
–0.5
–0.4
–0.3
–0.2
–0.1
0
0.1
0.2
0.3
0.4
0.5
–0.5 –0.3 –0.1 0.1 0.3 0.5
Block A - Old Field
Block B - Forest
Block C - Forest
Block D - Old Field
Fig. 7 Canonical correspondence analysis of 100 above-ground
vegetation quadrats from four sampling plots (block). Plots are
located in an old field and are classified according to their
proximity to an adjacent forest. Quadrat scores are plotted
with respect to two CCA axes, which reflect relationships to
eight environmental variables (N, P, K, Mg, Sand, Silt, Clay
and pH) and one covariable (habitat type: soil plots near forest
and away from it).
BARCODING OF PLANT ROOTS 1297
CCA axis explained 71.9% of the variation in the spe-
cies composition data along a gradient of considerable
length (Table 3). This axis had significant (P < 0.01)
canonical correlations with depth of sample, that is,
strong separation of shallow (5–35 cm) experimental
units from deeper ones, and potassium concentration
(Table 4). The second CCA axis explained an additional
16.2% of the variation in the data along a shorter, yet
considerable gradient (Table 3). This axis is signifi-
cantly (P < 0.01) correlated with N, P, Mg, pH and soil
texture variables, sand, silt and clay (Table 4). Experi-
mental units from plots that are closest to the forest are
most clearly separated in shallow soils but less so in
deep soils (Fig. 8).
The DFA was able to distinguish the multivariate
clusters from the CCA based on a suite of plant life-
� 2011 Blackwell Publishing Ltd
history traits. There were significant differences among
groups (P < 0.01), confirming the strong community
structure below-ground. There were significant differ-
ences (P = 0.026) based on the first two canonical func-
tions. The first discriminant function accounted for 69%
of the differences between groups (variability in the dis-
criminant scores). The second function accounted for an
additional 1% of the between-group variance. Root
architecture (fibrous vs. tap) was significantly correlated
with the species score in the CCA (P = 0.003; r = 0.987).
The other traits (life form, lifecycle, r ⁄ k strategist, seed
type, shade tolerance) were not significantly (P > 0.05)
correlated with the CCA species scores whether analy-
sed together or separately. Eighty-seven percent of the
groups (representing 29 taxa) were correctly classified
using the DFA.
Discussion
The DNA barcoding locus rbcL was effective at charac-
terizing the taxonomic diversity of roots in an old-field
plant community at the Koffler Scientific Reserve, Can-
ada. We amplified 96% of samples (amplification fail-
ures may be due to senescence, but there were no
differences in amplification success by depth), and
successfully sequenced nearly 85%. This sequencing

–0.8
–0.6
–0.4
–0.2
0
0.2
0.4
0.6
0.8
–1 –0.5 0 0.5 1 1.5 2
Depth
5–35 cm
40–65 cm
70–100 cm
NSand
PK
pH
Mg
SiltClay
CC
A 2
sco
res
Pinus spp.Vicia spp.
Taraxacum spp.
Erigeron spp.Carex spp.
Poa spp.
Solidago spp.
Populus spp.
CCA 1 scores
Fig. 8 Canonical correspondence analysis of root samples from 160 cubes representing 29 taxa identified using DNA barcoding.
Cube scores are presented in relation to two CCA axes and nine environmental variables (N, P, K, Mg, sand, silt, clay, pH and soil
depth) and one covariable (habitat type: soil plots near forest and away from it in old field). CCA1 axis has significant (P < 0.01)
canonical correlations with soil depth and potassium, and CCA2 axis has significant (P < 0.01) canonical correlations with N, P, Mg,
pH, sand, silt and clay.
Table 4 Correlations and canonical coefficients for environmental variables used in canonical correspondence analysis of 160 cubes
and 29 taxa (identified using DNA barcoding)
Variable
Interset correlation Canonical coefficient t-Value
Axis 1 Axis 2 Axis 1 Axis 2 Axis 1 Axis 2
Nitrogen (N) 0.7892 )0.1124 )0.3121 )2.8523 )1.3975 )5.5487
Phosphorus (P) 0.7462 )0.0251 0.0173 1.6165 0.1148 4.8731
Potassium (K) )0.6821 )0.1075 0.8921 0.1452 4.3812 0.3312
Magnesium (Mg) )0.1528 0.0109 0.1986 0.7332 1.5347 2.6412
pH )0.6318 )0.0376 0.3315 0.6823 1.7745 1.7176
Sand 0.6411 0.0734 5.1571 )39.519 0.7511 )2.7188
Silt )0.5615 )0.0109 2.3387 )19.5792 0.7026 )2.7734
Clay )0.6345 )0.1319 2.8851 )24.3628 0.7429 )2.9337
Depth of sample 0.7316 )0.1022 )0.7631 )0.3272 )4.8412 )0.9617
Bold values indicate significant correlations.
1298 P. R . KE SANAKURTI ET AL.
success rate was lower than rates reported for rbcL in a
previous study conducted on plant diversity of south-
ern Ontario (100%, Fazekas et al. 2008). Lower sequenc-
ing success may reflect, in part, lower quantity of DNA
yield per extraction in root tissue compared with leaves
and the heterogeneity in tissue quality that results from
selecting root fragments randomly (within the >2 cm
length criterion). Of the 29 unique sequences that we
obtained, 17 (58.6%) were identified to species, 9 were
identified to genus and 3 to family. This old-field com-
munity is dominated by a small number of plant fami-
lies (10 and 6 species in Asteraceae and Poaceae,
respectively). Several genera at the site (e.g., Solidago,
Symphyotrichum, Poa) are represented by multiple
species (based on above-ground morphology) that
were not distinguishable genetically using rbcL
(Fazekas et al. 2008). This may be owing to a variety of
different reasons, including incomplete lineage sorting,
� 2011 Blackwell Publishing Ltd
BARCODING OF PLANT ROOTS 1299
hybridization, imperfectly understood species bound-
aries and taxonomy, and a simple lack of informative
variation between species (Fazekas et al. 2009).
Within our sampling area there were differences
between the patterns of diversity observed below-
ground vs. above-ground. Overall 29 species or species
groups were detected below-ground using sequence
barcodes, whereas 39 species or species groups were
observed in the quadrats above-ground. The relative
abundances of the taxa detected below-ground were
significantly correlated with their abundance above-
ground, suggesting that the ranking of biomass above-
ground for any species is indicative of allocation to
biomass below-ground. Ten of 29 taxa detected below-
ground were not observed in the above-ground plots.
These species were relatively uncommon overall and
thus may have been missed because of sampling error
in time or space, or because of incomplete identification
based on above-ground morphology (e.g., because
informative reproductive characters were not obtained,
as was the case for members of Symphyotrichum during
the census period). Alternatively, individuals of some
species may enter a state of root quiescence or dor-
mancy, in which case no above-ground growth may be
initiated in some years (Lesica & Steele 1994). Lastly,
some species may appear below-ground but not above-
ground because their radius of root extension exceeded
the perimeter of the above-ground canopy. This was
probably the case for Prunus, which occurred in the
vicinity but not in the above-ground plots.
One of the most striking results of this study was the
strong spatial structure in root diversity compared with
the near absence of structure in the above-ground quad-
rats. To our knowledge, this contrast has not been
described before. In the CCA analysis, soil cubes
grouped into several tight clusters based on root taxo-
nomic diversity and environment. These clusters corre-
sponded to cubes dominated by different plant taxa
and soil depth, nutrient content and texture. In contrast,
there was no detectable clustering of quadrats from the
above-ground survey. The contrasting spatial patterns
of diversity may reflect, in part, the differences in size
of the sampling units above-ground (1 · 1 m quadrats)
and below-ground (5 · 5 · 5 cm cubes). The structure
of root diversity in this sampling design may be
affected by sampling error or the presence of environ-
mental heterogeneity on different spatial scales. How-
ever, sampling error among soil cubes would not
produce the strong association between root diversity
and soil environment that we observed. Further, much
of the variation in diversity and environment in the soil
occurred among columns and plots, which exists on a
scale that is comparable to the above-ground sampling
scale. Therefore, the strong community structure of
� 2011 Blackwell Publishing Ltd
roots is not likely to be a result of sampling at a smaller
scale. Given that biomass above- and below-ground has
similar access to the species pool, it is more likely that
the community structure below-ground reflects different
environmental gradients and the greater potential for
interactions among taxa in the soil.
Species diversity in roots may be structured if there is
strong environmental heterogeneity in the soil profile
and species are being filtered according to differences
in environmental niches (Fitter 1994; Weiher et al.
1998). Our soil analysis confirms that nutrient concen-
trations and texture vary with depth such that individu-
als that persist near the soil surface may have higher N,
P, K and lower Mg requirements. Niche partitioning, at
least with respect to depth, may also occur as a result
of differences in root architecture. Plants with fibrous
roots may be more likely to persist in shallow soil,
whereas those with tap roots and secondary root thick-
ening may be more likely (or less constrained) to
exploit deeper zones (Le Roux et al. 1995; Casper &
Jackson 1997). Alternatively, community structure may
reflect the results of differential competitive interactions
among species. That is, the range of environmental het-
erogeneity is suitable for establishment by the general
pool of old-field species but different competitive abili-
ties in different parts of the site affect the species that
can coexist. At this stage, we have no direct evidence
for assessing the relative importance of these two
factors.
Further insights into the causes of root community
structure come from the analysis of species co-
occurrence. Overall, values of the checkerboard and
c-index were strongly positive compared with a null
model of random association, indicating that species are
generally found in isolation (i.e. are spatially segre-
gated). Unexpectedly, the patterns of coexistence shift
to random (and nearly negative) when analysed for the
two dominant plant families (Poaceae, Asteraceae) sepa-
rately. Such values result when species are more likely
to co-occur than to be present individually. Such associ-
ations among confamilial species but not species from
different families suggest a role for environmental filter-
ing. If confamilials are more similar to each other than
to species in other families, one would expect competi-
tion to result in clearer segregation (i.e. positive values
of coexistence) among them. Instead, we see more
coexistence among confamilials than among the whole
sample. The most logical interpretation is that confamil-
ial species are found in close proximity because they
either share common root attributes or share common
physiological tolerances and thus establish in similar
environments. More in-depth community phylogenetic
analyses (Kembel & Hubbell 2006; Kress et al. 2009)
were not performed here because of the dominance of

1300 P. R . KE SANAKURTI ET AL.
two large families, but may be feasible at other, richer
sites.
Several studies have identified competition as an
important factor in the organization of plant diversity
below-ground (Fowler 1986; Wilson 1988; De Kroon
et al. 2003), and such interactions may account for some
of the patterns in community structure that we
observed. Although this cannot completely explain the
spatial proximity of congeners as revealed in the coexis-
tence analysis, it may reinforce some of the structure
initially formed through environmental filtering. This is
consistent with the observation that some of the most
abundant taxa have fibrous root systems, a root system
that is able to rapidly proliferate in resource-rich vol-
umes of soil, depleting the resources before competing
plants do (Grime 1979; Casper & Jackson 1997). This
root architecture may allow these taxa to proliferate in
top layers of soil, where N, P and K are more abundant,
before other species do. Previous studies have also
demonstrated that species with fibrous root systems
have a disproportionate competitive advantage over
species less able to proliferate in nutrient-rich areas of
soil (Fransen et al. 2001). Another below-ground trait
that may provide a competitive advantage is the ability
to occupy soil space. Species whose roots can occupy
more space than others are likely to be more successful
in competition (Casper & Jackson 1997).
Our study has two results with broad ecological
implications. First, this is the first attempt to apply
DNA barcoding to describe the patterns of below-
ground community structure in a complex community.
This molecular tool was effective in terms of success-
fully amplifying root fragments. Species identification
was successful in that only three taxa could not be
resolved from the local reference database. This success
rate will probably vary in future applications depend-
ing on the nature of the taxonomic diversity in a given
region. Some sequences were identified to genus, not
species. This is partly because of the incomplete nature
of the reference database but also because of the taxo-
nomically complex nature of several of the important
species groups in this particular flora and upper limits
on species resolution possible using plastid-based DNA
barcoding markers (Fazekas et al. 2008). Nevertheless,
identification of species or species groups at this level
still represents a powerful advance in the ecological
analysis of roots and below-ground processes. Other
DNA-based approaches, such as restriction-fragment
based methods (Bobowski et al. 1999; Brunner et al.
2001; Ridgway et al. 2003) have been used successfully
to identify roots. However, sequence-based approaches
are likely to be increasingly used in future applications,
and the development of DNA barcoding references will
provide a powerful tool-box for ecologists interested in
studying below-ground floras. Next-generation sequenc-
ing technologies, including 454 technology (Roche
Group), may reduce the time and cost of sequencing
enormously and may also facilitate single-locus envi-
ronmental PCR-style studies (De Koning et al. 2008).
An additional noteworthy result is that we detected
an asymmetry in patterns of diversity below-ground vs.
above-ground in the same community. Community
structure was more evident below-ground compared
with the same horizontal area above-ground. The mech-
anisms driving this difference are unclear; however,
previous studies have demonstrated that species below-
ground segregate their root systems in response to com-
petition and allelopathy (Schenk et al. 1999). Future
work using DNA barcoding in other communities and
along successional gradients should help advance our
understanding of the environments and community
processes operating among roots in the soil. This has
the potential to provide fine-scale insights into the
development of plant communities underground, and
the mechanisms by which diversity arises and is orga-
nized over time.
Acknowledgements
We thank J. Gerrath and N. Webster for assistance in the field
and with sorting roots, the Koffler Scientific Reserve for per-
mission to work on the old-field site and Genome Canada for
financial support through the Ontario Genomics Institute to
the Canadian Barcode of Life Network.
References
Abrams P (1983) The theory of limiting similarity. Annual
Review of Ecology and Systematics, 14, 359–376.
Altschul SF, Gish W, Miller W et al. (1990) Basic local alignment
search tool. Journal of Molecular Biology, 215, 403–410.
Alvarez I, Wendel JF (2003) Ribosomal ITS sequences and
plant phylogenetic inference. Molecular Phylogenetics and
Evolution, 29, 417–434.
Armbruster WS, Edwards ME, Debevec EM (1994) Floral
character displacement generates assemblage structure of
western Australian triggerplants (Stylidium). Ecology, 75, 315–
329.
Bobowski BR, Hole D, Wolfs PG et al. (1999) Identification of
roots of woody species using polymerase chain reaction
(PCR) and restriction fragment length polymorphism (RFLP)
analysis. Molecular Ecology, 8, 485–491.
Brisson J, Reynolds JF (1994) The effect of neighbors on root
distribution in a creosotebush (Larrea tridentata) population.
Ecology, 75, 1693–1702.
Brunner I, Brodbeck S, Buchler U et al. (2001) Molecular
identification of fine roots of trees from the Alps: reliable
and fast DNA extraction and PCR-RFLP analyses of plastid
DNA. Molecular Ecology, 10, 2079–2087.
Cadotte MW, Cavender-Bares J, Tilman D et al. (2009) Using
phylogenetic, functional and trait diversity to understand
� 2011 Blackwell Publishing Ltd

BARCODING OF PLANT ROOTS 1301
patterns of plant community productivity. PLoS ONE, 4,
e5695.
Caldwell MM, Eissenstat DM (1987) Coping with variability:
examples of tracer use in root function studies. In: Plant
Response to Stress-Functional Analysis in Mediterranean
Ecosystems (eds Tenhunen JD, Catarino FM, Lange OL,
Oechel WC), pp. 95–106. Springer-Verlag, Berlin.
Caldwell MM, Manwaring JH, Durham SL (1996) Species
interactions at the level of fine roots in the field: influence of
soil nutrient heterogeneity and plant size. Oecologia, 106,
440–447.
Casper BB, Jackson RB (1997) Plant competition underground.
Annual Review of Ecology and Systematics, 28, 545–570.
CBOL Plant Working Group (2009) A DNA barcode for land
plants. Proceedings of the National Academy of Sciences of the
United States of America, 106, 12794–12797.
Cody ML, Diamond JM (1975) Ecology and evolution of
communities. Ecology and Evolution of Communities. Harvard
University Press, Cambridge, pp. 342–444.
Cornwell WK, Schwilk DW, Ackerly DD (2006) A trait-based
test for habitat filtering: convex hull volume. Ecology, 87,
1465–1471.
Cutler DF, Rudall PJ, Gasson PE et al. (1987) Root Identification
Manual of Trees and Shrubs. A Guide to the Anatomy of Roots of
Trees and Shrubs Hardy in Britain and Northern Europe.
Chapman and Hall, London.
De Koning AP, Noble GP, Heiss AA et al. (2008)
Environmental PCR survey to determine the distribution of a
non-canonical genetic code in uncultivable oxymonads.
Environmental Microbiology, 10, 65–74.
De Kroon H, Mommer L, Nishiwaki A (2003) Root
competition: towards a mechanistic understanding. In: Root
Ecology (eds de Kroon H, Visser EJW), pp. 215–234. Springer-
Verlag, New York.
Diamond JM (1975) Assembly of species communities. In:
Ecology and Evolution of Communities (eds Cody ML,
Diamond JM), pp. 342–444. Harvard University Press,
Cambridge, Massachusetts.
Fazekas AJ, Burgess KS, Kesanakurti PR et al. (2008) Multiple
multilocus DNA barcodes from the plastid genome
discriminate plant species equally well. PLoS ONE, 3, e2802.
Fazekas AJ, Kesanakurti PR, Burgess KS et al. (2009) Are plant
species inherently harder to discriminate than animal species
using DNA barcoding markers? Molecular Ecology Resources,
9, 130–139.
Feliner GN, Rossello JA (2007) Better the devil you know?
Guidelines for insightful utilization of nr DNA ITS in
species-level evolutionary studies in plants. Molecular
Phylogenetics and Evolution, 44, 911–919.
Fitter AH (1994) Architecture and biomass allocation as
components of the plastic response of root systems to soil
heterogeneity. In: Exploitation of Environmental Heterogeneity
by Plants. Ecophysiological Processes Above- and Below Ground
(eds Caldwell MM, Pearcy RW), pp. 305–323. Academic
Press, San Diego, California.
Fowler N (1986) The role of competition in plant communities
in arid and semiarid regions. Annual Review of Ecology and
Systematics, 17, 89–110.
Fransen B, de Kroon H, Berendse F (2001) Soil nutrient
heterogeneity alters competition between perennial grass
species. Ecology, 82, 2534–2546.
� 2011 Blackwell Publishing Ltd
Gotelli NJ, Entsminger GL (2004) EcoSim: Null Models Software
for Ecology. Version 7. Acquired Intelligence Inc. & Kesey-
Bear, Jericho, Vermont (http://garyentsminger.com/ecosim/
index.htm.)
Grime JP (1979) Plant Strategies and Vegetation Processes. Wiley,
London.
Hartnett DC, Wilson GWT (1999) Mycorrhizae influence plant
community structure and diversity in tallgrass prairie.
Ecology, 80, 1187–1195.
Hebert PDN, Ratnasingham S, deWaard JR (2003) Barcoding
animal life: cytochrome c oxidase subunit 1 divergences
among closely related species. Proceedings of the Royal Society
of London Series B-Biological Sciences, 270, S96–S99.
Hook PB, Lauenroth WK, Burke IC (1994) Spatial patterns of
roots in a semiarid grassland – abundance of canopy
openings and regeneration gaps. Journal of Ecology, 82, 485–
494.
Hooper DU, Chapin FS, Ewel JJ et al. (2005) Effects of
biodiversity on ecosystem functioning: a consensus of
current knowledge. Ecological Monographs, 75, 3–35.
Ivanova NV, Fazekas AJ, Hebert PDN (2008) Semi-automated,
membrane-based protocol for DNA isolation from plants.
Plant Molecular Biology Reporter, 26, 186–198.
Jackson RB, Moore LA, Hoffmann WA et al. (1999) Ecosystem
rooting depth determined with caves and DNA. Proceedings
of the National Academy of Sciences of the United States of
America, 96, 11387–11392.
Jackson LE, Burger M, Cavagnaro TR (2008) Roots, nitrogen
transformations, and ecosystem services. Annual Review of
Plant Biology, 59, 341–363.
Kembel SW, Hubbell SP (2006) The phylogenetic structure of a
neotropical forest tree community. Ecology, 87, S86–S99.
Kress WJ, Erickson DL, Jones FA et al. (2009) Plant DNA
barcodes and a community phylogeny of a tropical forest
dynamics plot in Panama. Proceedings of the National Academy
of Sciences of the United States of America, 106, 18621–18626.
Kummerow J, Krause D, Jow W (1977) Root systems of
chaparral shrubs. Oecologia, 29, 163–177.
Le Roux X, Bariac T, Mariotti A (1995) Spatial partitioning of
the soil-water resource between grass and shrub components
in a west-African humid savanna. Oecologia, 104, 147–155.
Lesica P, Steele MB (1994) Prolonged dormancy in vascular
plants and implications for monitoring studies. Natural Areas
Journal, 14, 209–212.
Linder CR, Moore LA, Jackson RB (2000) A universal
molecular method for identifying underground plant parts
to species. Molecular Ecology, 9, 1549–1559.
Losos JB (2008) Phylogenetic niche conservatism, phylogenetic
signal and the relationship between phylogenetic relatedness
and ecological similarity among species. Ecology Letters, 11,
995–1007.
MacArthur R, Levins R (1967) The limiting similarity
convergence and divergence of coexisting species. American
Naturalist, 101, 377–385.
Mamolos AP, Elisseou GK, Veresoglou DS (1995) Depth of root
activity of coexisting grassland species in relation to N and P
additions, measured using nonradioactive tracers. Journal of
Ecology, 83, 643–652.
Mommer L, Wagemaker CAM, De Kroon H et al. (2008)
Unravelling below-ground plant distributions: a real-time
polymerase chain reaction method for quantifying species
1302 P. R . KE SANAKURTI ET AL.
proportions in mixed root samples. Molecular Ecology
Resources, 8, 947–953.
Mou P, Jones RH, Mitchell RJ et al. (1995) Spatial-distribution
of roots in sweetgum and loblolly-pine monocultures and
relations with aboveground biomass and soil nutrients.
Functional Ecology, 9, 689–699.
Olmstead RG, Palmer JD (1994) Chloroplast DNA systematics:
a review of methods and data analysis. American Journal of
Botany, 81, 1205–1224.
Ramsey FL, Schafer DW (1997) The Statistical Sleuth: A Course
in Methods of Data Analysis. Duxbury Press, Belmont,
California.
Reice SR (1994) Nonequilibrium determinants of biological
community structure – biological communities are always
recovering from the last disturbance – disturbance and
heterogeneity, not equilibrium, generate biodiversity.
American Scientist, 82, 424–435.
Reynolds HL, Packer A, Bever JD et al. (2003) Grassroots
ecology: plant-microbe-soil interactions as drivers of
plant community structure and dynamics. Ecology, 84, 2281–
2291.
Ridgway KP, Duck JM, Young JPW (2003) Identification of
roots from grass swards using PCR-RFLP and FFLP of the
plastid trnL (UAA) intron. BMC Ecology, 3, 8.
Roumet C, Picon-Cochard C, Dawson LA et al. (2006)
Quantifying species composition in root mixtures using two
methods: near-infrared reflectance spectroscopy and plant
wax markers. New Phytologist, 170, 631–638.
Schenk HJ, Callaway RM, Mahall BE (1999) Spatial root
segregation: are plants territorial? Advances in Ecological
Research, 28, 145–180.
Silvertown J (2004) Plant coexistence and the niche. Trends in
Ecology & Evolution, 19, 605–611.
Stone L, Roberts A (1990) The checkerboard score and species
distributions. Oecologia, 85, 74–79.
Taggart JM, Cahill JF Jr, McNickle GG et al. (2010) Molecular
identification of roots from a grassland community using
size differences in fluorescently labelled PCR amplicons of
three cpDNA regions. Molecular Ecology Resources, doi:
10.1111/j.1755-0998.2010.02893.x
ter Braak CJF (1986) Canonical correspondence analysis: a new
eigenvector technique for multivariate direct gradient
analysis. Ecology, 67, 1167–1179.
ter Braak CJF, Smilauer P (2002) CANOCO Reference Manual
and CanoDraw for Windows User’s Guide: Software for Canonical
Community Ordination (Version 4.5). Section on Permutation
Methods. Microcomputer Power, Ithaca, New York.
Tilman D (1982) Resource competition and community
structure. Monographs in Population Biology, 17, 1–296.
Tilman D (1988) Plant strategies and the dynamics and
structure of plant communities. In: Monographs in Population
Biology, No. 26 (eds Tilman D), Princeton University Press,
Princeton, New Jersey, pp. 360.
Tilman D, Knops J, Wedin D et al. (1997) The influence of
functional diversity and composition on ecosystem
processes. Science, 277, 1300–1302.
Tofts R, Silvertown J (2000) A phylogenetic approach to
community assembly from a local species pool. Proceedings of
the Royal Society of London Series B-Biological Sciences, 267,
363–369.
Webb CO, Ackerly DD, McPeek MA et al. (2002) Phylogenies
and community ecology. Annual Review of Ecology and
Systematics, 33, 475–505.
Weiher E, Clarke GDP, Keddy PA (1998) Community assembly
rules, morphological dispersion, and the coexistence of plant
species. Oikos, 81, 309–322.
Weiher E, Keddy P (1999) Assembly rules as general constraints
on community composition. In: Ecological Assembly Rules:
Perspectives, Advances, Retreats (eds Weiher E, Keddy P), pp.
251–271. Cambridge University Press, Cambridge.
Wilson JB (1988) Shoot competition and root competition.
Journal of Applied Ecology, 25, 279–296.
Authors of this article represent the Canadian Plant Barcoding
Working Group (CPBWG). Mandatory of the group has been
to develop suitable barcoding markers and study their applica-
tion in plants. CPBWG has been part of the plant working
group of Consortium for the Barcode of Life (CBOL) which
was responsible for the determination of official plant barcode
regions. This research article is one of the examples of its
applications.
Supporting information
Additional supporting information may be found in the online
version of this article.
Table S1 Summary of species or species groups and their root
attributes that were identified in an old field using the rbcL
DNA barcode.
Fig. S1 Mean (±SE) concentration of total nitrogen, phospho-
rus, potassium, and magnesium and pH as function of depth
in four soil plots at Koffler Scientific Reserve (KSR), Ontario,
Canada.
Please note: Wiley-Blackwell are not responsible for the content
or functionality of any supporting information supplied by the
authors. Any queries (other than missing material) should be
directed to the corresponding author for the article.
� 2011 Blackwell Publishing Ltd