biofuels team presentation 050611 - energy institute ... for... · lab test plants theoretical...
TRANSCRIPT

Low-Lignin FeedstockImproving Yields of Biofuels and ChemicalsImproving Yields of Biofuels and Chemicals
David GoetzPhuong NguyenPhuong NguyenPeter ThompsonDarren Woulfe

Investment Highlight
Situation• The biofuels industry is a rapidly-growing, multi-billion dollar
market• Margins are currently very low
Securing long term profitability requires:• Securing long-term profitability requires: • Maximizing yields• Minimizing costs
Value PropositionOur innovation can significantly increase yields by reducing the amount of undesirable lignin for cellulosic processesamount of undesirable lignin for cellulosic processes

Contents
T h l O iTechnology Overview
Market AssessmentMarket Assessment
Feedstock Industry Dynamicsy y
Recommendations

What is Cellulosic Biofuel
• Target of 36bn gallons of biofuels by 2022• Minimum 12bn gallons of cellulosic biofuels
Cellulosic• Non-food feedstock material• Break down plant cellulose into sugars• e g corn stover switchgrass miscanthus• e.g. corn stover, switchgrass, miscanthus
Advanced Fuels and BiodieselAdvanced Fuels and Biodiesel• Alternative pathways involving plant oils• High potential but unproven at scale• e.g. algae
Conventional• Crops with high sugar and starch contents• Technically easiest to produce and lowest-cost
Source: Ceres
Technically easiest to produce and lowest cost• e.g. Corn in US, Sugar Cane in Brazil

Technology Introduction
Tunable Location of Important bio‐Products

TuLIP 1.0 – Low Lignin
Traditional Lignin Plant Reduced Lignin Plant
Hemicellulose
Cellulose
Sugars
WildtypeYield Improvement
d (%
)
Wildtype
TuLIP 1.0Our Innovation
• A genetic modification that tunes the location and amount of lignin produced
90
75
Sugar y
ield• Potential applications for tuning the
location and amount of other bioproducts including hemicellulose, and cellulose
60
45
30
15
24hr 48hr0

Value Proposition of our Technology
Value of Reduced Lignin for Cellulosic Crops
Hi h i ld f l bl l i l
Normal Lignin
• Higher yields of more valuable plant materials
• Easier to deconstruct plants and extract cellulose
F i hibiti b d t ft d t ti• Fewer enzyme‐inhibiting byproducts after deconstructionReduced Lignin
Value Specific to this Innovation
• Maintains Plant Strength
• Potentially Feedstock Agnostic
• Product Agnostic

Quantifying the value of our technology
• Our innovation can improve yields by 42% over base-case cellulosic ethanol• This could lead to a cost reduction of $1/gallon for cellulosic ethanol
$1 / gallon Potential cost reductionx12bn gallons 2022 US Cellulosic Target
~$4.50
~$3.50Price($) x12bn gallons 2022 US Cellulosic Target
$12 billion Rough Potential Annual Value
Basic TuLIP
($)
1. Greater revenue per ton of feedstock• More biofuel per ton of biomass and per acre
Cellulosic 1.0
p p
2. Reduces feedstock transportation costs• More cellulose per truckload of feedstock
3. Reduces refining costs in the biorefinery
JBEI: Technoeconomic Model
g y• Deconstruction easier, lowering input costs

Status of Current Technology
Our technology is still not in a commercial crop but inventors are patenting IP discovery
Theoretical Incubator First Commercial Unit Commercialization
Crop Innovation Development Process
Current Status
Source: Ceres

Contents
T h l O iTechnology Overview
Market AssessmentMarket Assessment
Feedstock Industry Dynamicsy y
Recommendations

Identifying End Markets
Biomass Addressable Lignin Adjustment Market PenetrationSufficient Added
Assessment Criteria
Biomass Products
Addressable Market Size
Lignin Adjustment Enhances Value?
Market Penetration Feasible
Sufficient Added Value Potential
Paper
LumberBiodiesel
Adhesives Ethanol
Animal Feedstock
ButanolGlucose
Glycerin
Paints Combustible Biomass
Lactic Acid
Fertilizer
LubricantsMulch

End Product Markets
There are a number of end products which could potentially benefit from low‐lignin
Biofuels Animal Feed
• Growth industry with government support• Reduced lignin will improve yields and costs
Biofuels Animal Feed
• Feed with a lower lignin yield will provide more energy per kg for animals
Price for Protein
Biomass‐Derived Synthetic Chemicals• High‐growth industry• Reduced lignin will improve yields and costs
• Paper industry uses cellulose to make paper• Higher cellulose yields may be attractive
Paper
g p y g y y
Value Insufficient

Biofuels Market
Market demand for biofuels is essentially unbounded in the near future – Khosla
150Biofuel Market Size
100
150
$ (billion)
US Market SizeWorld Market Size 2022
• US - $90bn biofuels market• 12bn of 36bn gallons of biofuel from cellulosic
0
50
2011 2015 2022
• Projected $30bn cellulosic biofuel market
Year
Market Drivers:• Rising gasoline prices
Risks:• Cellulosic margins and cost are notRising gasoline prices
• Government support – RFS programs• Costs will decrease with innovation in:
• Enzymes• Agronomy
Cellulosic margins and cost are not competitive with first‐generation ethanol
• Competing technologies • Other Biofuels• EV DeploymentAgronomy
• Process TechnologiesEV Deployment
• Changes to regulations – Removal of RFS

“One Word: Plastics”
There are a range of chemical markets which could use biomass feedstocks, of which plastics is the most attractive
Product Market sizeFeedstock source
applicabilitySubstitution for
petroleum
PlasticsPlastics
Adhesive
Surfactant
Pigments
Wall Paints
Not attractive Attractive Very attractive
Market size based on USDA Industrial Bioproducts, Today and Tomorrow. 2004.

Biomass Derived Synthetic Chemicals Market
There are tens of billion‐dollar markets in chemicals ‐ Khosla
23391
20000
25000
t
US Plastics Consumption by Market Segment, 2009
11139
14862 14738
10000
15000
20000
n of lbs, dry weight
9412008 1495 1004
0
5000Million
$650 million market

Case Study: NatureWorks Ingeo
Selling bio‐derived chemicals is already a growing market with specialist players
NatureWorks is a leader in the development of bio‐based plastics and fibers
• Started as JV between Dow Chemical and Cargill• Product: Ingeo is a biopolymer, Polylactic Acid• Ingeo is used in a range of plastics, replacing petrochemical feedstocks
2009 Ingeo Information
Production 300 million lbs
Price $0.7‐0.85/lb
Revenue $210‐255 million
Contents
T h l O iTechnology Overview
Market AssessmentMarket Assessment
Feedstock Industry Dynamicsy y
Recommendations

Feedstock Value Chain
BiofuelsOur Innovation’s End Product
SeedTrait
BiofuelsOur Innovation’s Market
End Product Market
BiorefiningSeed
ProductionFarming
Trait Optimization
Biomass‐derived Synthetic Chemicals
(BDSC’s)
EnzymesFertilizer, Pesticides

Feedstock Market Dynamics
BiorefineriesAgricultural Firms / Labs Farmers
Trait Engineering
Seed Development
Planting & Farming
Harvest & Transport
Processing Synthesis
Bi SUS Cooperatives Big Sugar ‐Brazil
• Highly consolidated“Bi A ” d i t
• Disaggregated, few large players
• Emerging industry
P ll l i d i d• “Big Ag” dominates traditional markets
• Focused Bioenergy players entering market
players
• Risk averse to innovation• Close relationships with seed makers
• Pure cellulosic and mixed feedstock players
• Feedstock is critical to success, driving upstream integration

The Cellulosic Feedstock Industry
Corn Stover Bioenergy Crops
• Large existing market • Small industry• Grown on prime arable land• Low energy return – parity with output
• Grown on cheap marginal land• High energy return – low input/high output
Source: Billion ton Vision, DOE & USDA 2005

Market Structure Issues
Farmers are paid by dry mass… but our product improves yield quality, not mass
=Standard
=Weight and moisture measured
TuLIP42% more
sugar
The feedstock market must develop pricing premiums for quality:
• Biorefineries sign long‐term contracts with farmers for specified crops
• Sufficient dedicated bioenergy crop activity to establish market standards
• There are precedents in differentiating crop types

Contents
T h l O iTechnology Overview
Market AssessmentMarket Assessment
Feedstock Industry Dynamicsy y
Recommendations

Commercialization Strategies
Strategy Positive Negative
Li T it • Less financial risk • Lower share of any returnsLicense Trait • Less financial risk• Faster to market• No additional investment or new skills required
• Lower share of any returns• Loss of control• Innovation can be culled if not aligned with licensee’s product
Go‐it‐Alone:Develop Seed
and Sell
• Capture all potential profits• Control market approach• Potential to leverage TuLIP
• Financially risky• Capital intensive• Longer time to marketand Sell g g• Requires other skills/experience
Joint Venture • Gain experience and skills from • Share potential valueJoint Venture Gain experience and skills from partners
• Retains some control• Access to upside value• Potential to leverage TuLIP
Share potential value • Less control than alone• Financial risk of investment
Potential to leverage TuLIP
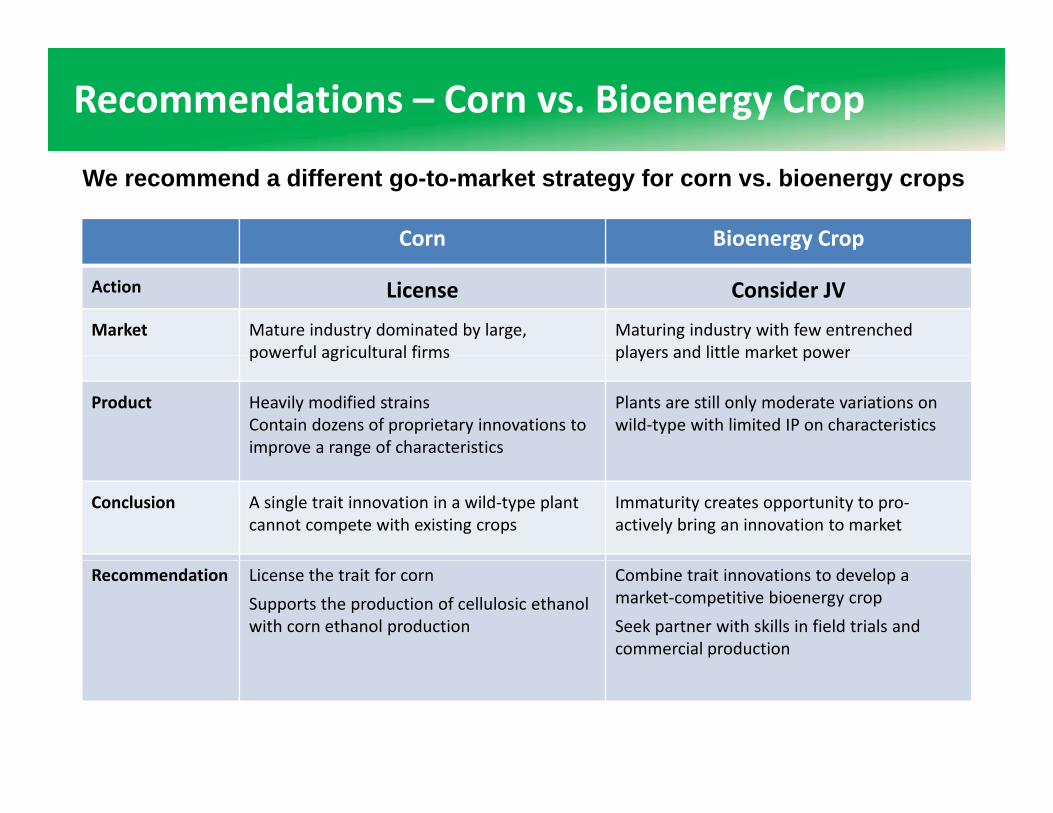
Recommendations – Corn vs. Bioenergy Crop
We recommend a different go-to-market strategy for corn vs. bioenergy crops
Corn Bioenergy CropCorn Bioenergy Crop
Action License Consider JV
Market Mature industry dominated by large, powerful agricultural firms
Maturing industry with few entrenched players and little market powerpowerful agricultural firms players and little market power
Product Heavily modified strains Contain dozens of proprietary innovations to improve a range of characteristics
Plants are still only moderate variations on wild‐type with limited IP on characteristics
Conclusion A single trait innovation in a wild‐type plant cannot compete with existing crops
Immaturity creates opportunity to pro‐actively bring an innovation to market
Recommendation License the trait for corn
Supports the production of cellulosic ethanol with corn ethanol production
Combine trait innovations to develop a market‐competitive bioenergy crop
Seek partner with skills in field trials and commercial production
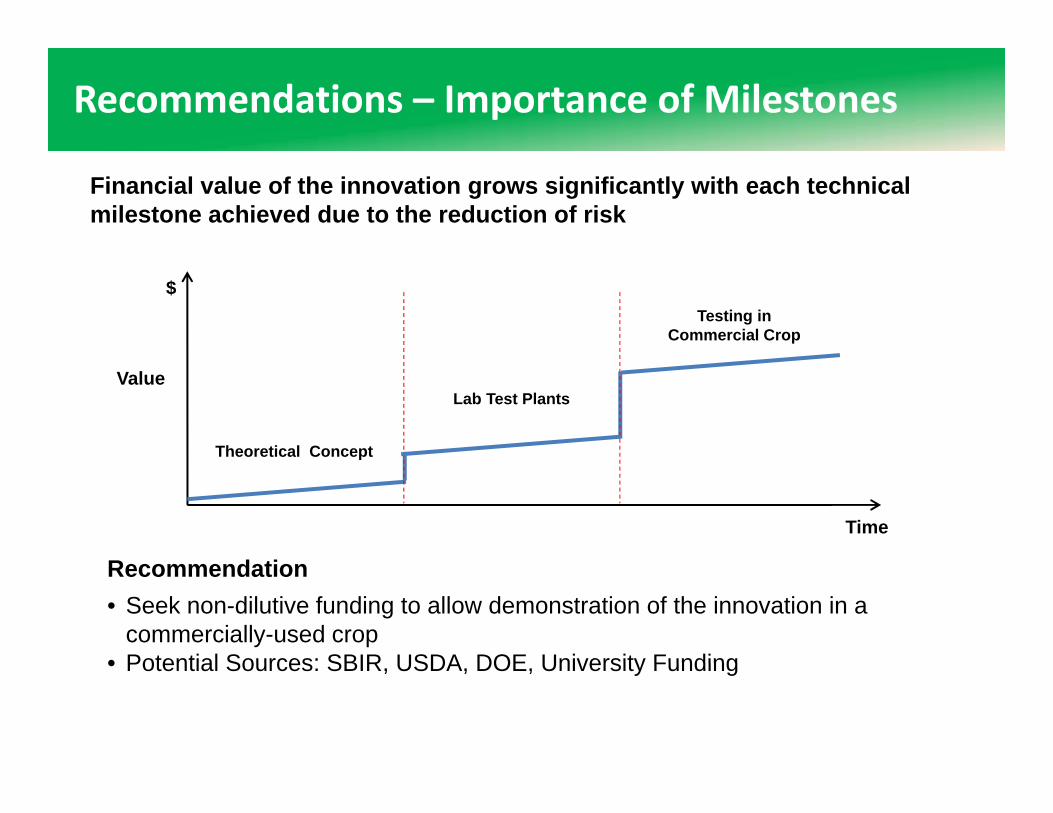
Recommendations – Importance of Milestones
Financial value of the innovation grows significantly with each technical milestone achieved due to the reduction of risk
$Testing in
Commercial Crop
ValueLab Test Plants
Theoretical Concept
R d ti
Time
p
Recommendation• Seek non-dilutive funding to allow demonstration of the innovation in a
commercially-used crop• Potential Sources: SBIR USDA DOE University Funding• Potential Sources: SBIR, USDA, DOE, University Funding

Roadmap to Commercialization
1‐2 years
1‐2 years
5‐7 years
Greenhouse Study Field Study Commercialization
• In real plants • License for corn use• Seek funding • Partnership
Proof of Concept
• In real plants• Regulatory hurdles
• License for corn use• Assess Scalability• Determine Productivity• Seek funding e.g. SBIR II
• Seek funding e.g. SBIR phase I/ Discovery Grants
• Early marketing
• Partnership• Licensing• Start‐up

Appendixpp

Intellectual Property and Protection
• Patentability and Freedom to Operate for the TuLIP platform assessed• No prior art found, innovation is novel and non-obvious• Inventors have freedom to operate
• A provisional patent application has been filed• An updated international PCT application will be filed within 1 year• Patent protection will be pursued in the US and other select countries
• Additional patent applications will be filed on tunable production of bio-products and the TuLIP platform

Selling Trait vs. Platform
The potential of our lignin innovation to form part of a wider crop enhancement platform technology is an important go-to-market consideration
Partnership Case Study:
• Mendel has developed and retained IP to form a complementary portfolio
• Mendel has partnered with Monsanto and Bayer CropSciencel h i i i i l d i li ito leverage their experience in trials and commercialization
• In exchange, these companies gain use of Mendel’s IP and learning curve
• Partnerships allow Mendel to retain more control and value than• Partnerships allow Mendel to retain more control and value than licensing, but take on greater risk
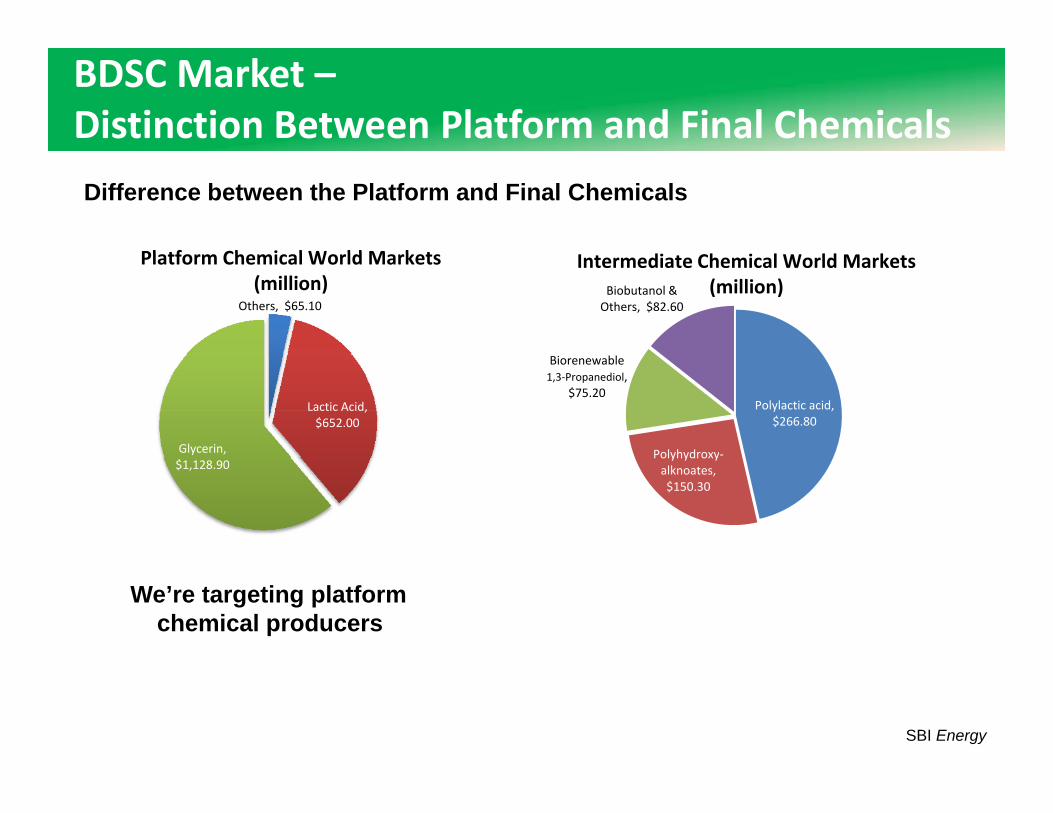
BDSC Market –Distinction Between Platform and Final Chemicals
Difference between the Platform and Final Chemicals
Pl tf Ch i l W ld M k t
Others, $65.10
Platform Chemical World Markets (million)
bl
Biobutanol & Others, $82.60
Intermediate Chemical World Markets (million)
Lactic Acid, $652.00
Glycerin,
Polylactic acid, $266.80
Polyhydroxy‐
Biorenewable1,3‐Propanediol,
$75.20
$1,128.90 Polyhydroxyalknoates, $150.30
We’re targeting platform chemical producers
SBI Energy

Interviewed Companies
• Arborgen• Amyris
• Mendel• HCL Cleantech
• Ceres• Catchlight• Terviva
• Dow• Elan Management• United Sugars• Terviva
• Weyerhauser• Poet
• United Sugars• Farmer – Bob• Fertilizer CompanyPoet Fertilizer Company

The Team
Principal Researchers – JBEI
Henrik Scherrer Dominique Loque
C2M Team
David Goetz Darren WoulfeMBA 2012Ph.D, J.D. 2012 MBA 2012
Phuong NguyenMS ChemE 2011
Peter ThompsonMBA 2012