bibliography - springer978-94-017-0709-1/1.pdf · bibliography adger, w. neil, and cecilia luttrell...
TRANSCRIPT
Bibliography
Adger, W. Neil, and Cecilia Luttrell (2000) "Property Rights and the Utilization of Wetlands." Ecological Economics 35: 75-89.
Alchian, A. (1967) "Pricing and Society." Westminster: The Institute of Economic Affairs. Occasional Paper No. 17.
Alesina, Alberto, Sule OzIer, Nouriel Roubini, and Philip Swagel (1991) "Political Instability and Economic Growth." Cambridge: NBER Research.
Alker, Hayward R. Jf. and Peter M. Haas (1993) "The Rise of Global Ecopolitics." in: Choucri, Nazli. Global Accord. Environmental Challenges and International Responses. Massachusetts Institute of Technology: Cambridge.
Allen, Douglas W. (1991) "What Are Transaction Costs?" Research in Law and Economics 14: 1-18.
Amacher, Ryan c., Robert D. Tollison, and Thomas D. Willett. (1972). "The Economics of Fatal Mistakes: Fiscal Mechanisms for Preserving Endangered Predators." Public Policy 20: 411-441.
Arbetman, Marina, and Jacek Kugler (eds.) (1997) Political Capacity & Economic Behavior. Boulder :Westview Press.
Arrow, Kenneth, B. Bolin, R. Constanza, P. Dasgupta, C. Folke, S. Holling, B.-O. Jansson, S. Levin, K.-G. Miller, C. Perrings, D. Pimentel (1995) "Economic Growth, Carrying Capacity and the Environment." Science 268: 520-521.
Axelrod, Robert (ed.) (1976) Structure Of Decision: The Cognitive Maps Of Political Elites. Princeton: Princeton University Press.
Baden, John A., and Tim O'Brien (1997) "Bringing Private Management to the Public Lands: Environmental and Economic Advantages." in: Sheldon Kamieniecki, George Gonzalez, and Robert Vos (eds.) Flashpoints in Environmental Policymaking. Albany: State University of New York Press.
Bardaracco, Joseph (1985) Loading the Dice. A Five-Country Study of Vinyl Chloride Regulation. Boston: Harvard Business School Press.
Barro, Robert (1991. "Economic Growth in a Cross Section of Countries." Quarterly Journal of Economics. 61: 407-44.
Barkin, J. Samuel, and George E. Shambaugh (eds.) (1999) Anarchy and the Environment: The International Relations of Common Pool Resources. Albany: Suny Press.
Barzel, Yoram (1989) Economic Analysis of Property Rights. Cambridge: Cambridge University Press.
Beaumont, Paul M., and Robert T. Walker (1996) "Land Degradation and Property Regimes." Ecological Economics 18: 55-66.
Berge, Erling, and Nils Christian Stenseth (1998) Law and the Governance of Renewable Resources. Oakland: ICS Press.
Berkes, Fikret (1992) "Success and Failure in Marine Coastal Fisheries of Turkey." in: Daniel W. Bromley (ed.) Making the Commons Work. San Francisco: ICS Press, pp. 161-182.
Bohmer-Christiansen, Sonja, and Jim Skea (1991) Acid Politics: Environmental and Energy Policies in Britain and Germany. New York: Belhaven.
121

122
Bohmer-Christiansen, Sonja (1992) "Anglo-German Contrasts in Environmental PolicyMaking and their Impacts in the Case of Acid Rain Abatement." International Environmental Affairs 4(4): 295-322.
Bomer, Silvio, and Aymo Brunetti, and Beatrice Weder (1995) "Policy Reform and Institutional Uncertainty: The Case of Nicaragua." KYKLOS 48: 43-64.
Botkin, Daniel B., and Edward A. Keller (1995) Environmental Science. Earth as a Living Planet. New York: John Wiley & Sons, Inc ..
Bressers, Hans, and Lawrence O'Toole (1998) "The selection of policy instruments: A network-based perspective." Journal of Public Policy 3(3): 213-239.
Brickman, Ronald, Sheila Jasanoff, and Thomas Ilgen (1985) Controlling Chemicals: The Politics of Regulation in Europe and the United States. Ithaca: Cornell University Press.
Bromley, Daniel W. (ed.) (1992) Making the Commons Work Theory, Practice, and Policy. San Francisco: ICS Press.
Bromley, Daniel W. (1991) Environment and Economy. Property Rights and Public Policy. Cambridge: Blackwell.
Bromley, Daniel W. (1989) Economic Interests and Institutions. The Conceptual Foundations of Public Policy. New York: Basil Blackwell Inc.
Bromley, Daniel W. (1978) "Property Rules, and Environmental Economics." Journal of Economic Issues 12: 43-60.
Buchanan, James M. (1975) "Before Public Choice." in: Henry G. Manne (ed.) The Economics of Legal Relationships. Readings in the Theory of Property Rights. St. Paul, New York, a.o.: West Publishing Company. pp. 67-77.
Buell, John and Tom DeLuca (1996) Sustainable Democracy: Individuality And The Politics Of The Environment. Thousand Oaks: Sage Publications.
Burger, Joanna, and Michael Gochfeld (1998) "The Tragedy of the Commons at 30 Years." Environment 40(10): 4-13, 26-27.
Carraro, Carlo, and Domenico Siniscalco (1991) "Strategies for the International Protection of the Environment." CEPR Discussion Paper No. 568. London: Centre for Economic Policy Research.
Chakraborty, Rabindra Nath (2001) "Stability and Outcomes of Common Property Institutions in Forestry: Evidence from the Terai Region of Nepal." Ecological Economics 36: 341-353.
Cheung, Steven N.S. (1975) "The Structure of A Contract and the Theory of a Non-Exclusive Resource." in: Henry G. Manne (ed.) The Economics of Legal Relationships. Readings in the Theory of Property Rights. St. Paul, New York, a.o.: West Publishing Company. pp. 437-56.
Choucri, Nazli (1993) Global Accord. Environmental Challenges and International Responses. Massachusetts Institute of Technology: Cambridge.
Choucri, Nazli and Robert C. North (1993a) "Growth, Development, and Environmental Sustainability: Profiles and Paradox." in: Choucri, Nazli. Global Accord. Environmental Challenges and International Responses. Massachusetts Institute of Technology: Cambridge.
Choucri, Nazli, and Robert C. North (1993b) "Global Accord: Imperatives for the TwentyFirst Century." in: Choucri, Nazli. Global Accord. Environmental Challenges and International Responses. Massachusetts Institute of Technology: Cambridge.
Clague, Christopher, Philip Keefer, Stephen Knack, and Mancur Olson (1995) "ContractIntensive Money: Contract Enforcement, Property Rights, and Economic Performance." Unpublished Manuscript.
Coase, R.H. (1960) "The Problem of Social Cost." The Journal of Law and Economics 3: 1-44.
Bibliography 123
Cornell, Stephen, and Joseph P. Kalt (1995) "Where Does Economic Development Really Come From? Constitutional Rule among the Sioux and the Apache." Economic Inquiry 33: 402-426.
Comes, Richard, and Todd Sandler (1983) "On Commons and Tragedies." American Economic Review 73: 787-92.
Costanza, Robert, and Herman E. Daly (1987) "Toward and Ecological Economics." Ecological Modelling 38: 1-7.
Cronon, William (ed.) (1995) Uncommon Ground. Toward Reinventing Nature. New York: W.W. Norton & Company.
Dalton, Russel J. (1994) The Green Rainbow. Environmental Groups in Western Europe. New Haven: Yale University Press.
Daly, Herman E., and John B. Cobb, Jr. (1989) For the Common Good: Redirecting the Economy Toward Community, the Environment, and a Sustainable Future. Boston: Beacon Press.
Dasgupta, Partha, and Karl-Goran Maler. (1994). Poverty, Institutions, and the Environmental-Resource Base. World Bank Environment Paper Number 9. The World Bank: Washington D.C.
Dasgupta, Susmita, Ashoka Mody, Subhendy Roy, and David Wheeler (1995) Environmental Regulation and Development: A Cross-Country Analysis. Washington, D.C.: The World Bank.
Dauvergne, Peter (1997) Shadows in the Forest: Japan and the Politics of Timber in Southeast Asia. Boston: MIT Press.
Davis, Charles (1997) "This Land is "Our" Land: The Case for Federal Retention of Public Lands." in: Sheldon Kamieniecki, George Gonzalez, and Robert Vos (eds.) Flashpoints in Environmental Policymaking. Albany: State University of New York Press.
Deacon, Robert T. (1995) "Assessing the Relationship between Government Policy and Deforestation." Journal of Environmental Economics and Management 28: 1-18.
Deacon, Robert T. (1994) "Deforestation, Investment and Ownership Security." Unpublished Work.
De Alessi, L. (1991) "Development of the Property Rights Approach." in: Furubotn, Eirik G., and Rudolf Richter (eds.) The New Institutional Economics. A Collections of Articles from the Journal of Institutional and Theoretical Economics. College Station: Texas A&M University Press. pp. 45-53.
De Bruyn, Sander M. (1997) "Explaining the environmental Kuznets curve: structural change and international agreements in reducing sulphur emissions." Environment and Developmental Economics 2: 485-503.
De Bruyn, Sander M., J.C.J.M. van den Bergh, and J.B. Opschoor (1998) "Economic Growth and Emissions: Reconsidering the Empirical Basis of Environmental Kuznets Curves." Ecological Economics 25: 161-175.
De Bruyn, Sander M., and J.B. Opschoor (1997) "Developments in the Throughput-Income Relationship: Theoretical and Empirical Observations." Ecological Economics 20: 255-268.
Demsetz, Harold (1975a) "Toward a Theory of Property Rights." in: Henry G. Manne (ed.) The Economics of Legal Relationships. Readings in the Theory of Property Rights. St. Paul, New York, a.o.: West Publishing Company. pp. 23-36.
Demsetz, Harold (1975b) "When Does the Rule of Liability Matter?" in: Henry G. Manne (ed.) The Economics of Legal Relationships. Readings in the Theory of Property Rights. St. Paul, New York, a.o.: West Publishing Company. pp. 168-83.
124
Demsetz, Harold (1975c) "Some Aspects of Property Rights." in: Henry G. Manne (ed.) The Economics of Legal Relationships. Readings in the Theory of Property Rights. St. Paul, New York, a.o.: West Publishing Company. pp. 184-93.
Demsetz, Harold (1975d) "The Exchange and Enforcement of Property Rights." in: Henry G. Manne (ed.) The &onomics of Legal Relationships. Readings in the Theory of Property Rights. St. Paul, New York, a.o.: West Publishing Company. pp. 362-77.
Denzau, Arthur, and Douglass North (1994) "Shared Mental Models: Ideologies and Institutions." KYKLOS 47: 3-31.
De Soto, Hernando (1989) The Other Path. New York: Harper & Row. Devlin, Rose Anne, and Quentin Grafton (1998) &onomic Rights and Environmental
Wrongs. Property Rights for the Common Good. Cheltenham: Elgar. Dinda, Soumyananda, Dipankor Coondoo, and Manoranjan Pal (2000) "Air Quality and
Economic Growth: An Empirical Study." &ological Economics 34: 409-423. Dryzek, John (1997) The Politics Of The Earth: Environmental Discourses. New York:
Oxford University Press. Dryzek, John (1987) Rational &ology: Environment and Political Economy. Oxford and
New York: Basil Blackwell. Eggertson, Thrainn (1998) "The Economic Rational of Communal Resources." in: Berge,
Erling, and Nils Christian Stenseth (eds.) Law and the Governance of Renewable Resources. Oakland: ICS Press.
Eggertson, Thrainn (1996) "The Economics of Control and the Cost of Property Rights." in: Hanna, Susan, Carl Folke, and Karl-Goran Miller (eds.) Rights to Nature. Washington, D.C.: Island Press.
Eliasson, Gunnar (1995) Investment Incentive in the Formerly Planned Economies. The Royal Institute of Technology, Department of Industrial Economics and Management: Stockholm.
Ekins, Paul (1997) "The Kuznets Curve for the Environment and Economic Growth: Examining the Evidence." Environmentand_Planning 29: 805-830.
Ekins, Paul, Mayer Hillman, and Robert Hutchinson (1992) The Gaia Atlas of Green &onomics. New York: Anchor Books Doubleday.
Elkins, David J., and Richard E.B. Simeon (1979) "A Cause in Search of Its Effect, of What Does Political Culture Explain?" Comparative Politics 11: 127-45.
Emerson, Kirk, and Charles R. Wise (1995) "Statutory Approaches to Regulatory Takings. State Property Rights Legislation. Issues and Implications for Public Administration." Paper Prepared for the Annual Meeting of the American Political Science Association, Chicago, 1995.
Enloe, Cynthia (1975) The Politics of Pollution in a Comparative Perspective. Ecology and Power in Four Nations. New York: David McKay.
Ensminger, Jean, and Andrew Rutten (1991) "The Political Economy of Changing Property Rights: Dismantling a Pastoral Commons." American Ethnologist 18(4): 41-57.
European Commission, DO XI (1998) "Workshop on Sustainable Development - Challenge for the Financial Sector." Final Report. Brussels: The European Commission.
European Commission, DO XI (1997) "The Role of Financial Instruments in Achieving Sustainable Development." Report. Brussels: The European Commission.
Feeny, David (1998) "Suboptimality and Transaction Costs on the Commons." in: Loehman, Edna T., and D. Marc Kilgour (eds.) Designing Institutionsfor Environmental and Resource Management. Cheltenham: Edward Elgar.
Feeny, David (1988) "The Development of Property Rights in Land: A Comparative Study." in: Robert H. Bates. Toward a Political Economy of Development. A Rational Choice Perspective. Berkeley, Los Angeles, and London: University of California Press.
Bibliography 125
Feeny, David, Fikret Berkes, Bonnie J. McCay, and James M. Acheson (1990) "The Tragedy of the Commons: Twenty-Two Years Later." Human Ecology 18(1): 1-18.
Fisher, Frank (1995) Evaluating Public Policy. Chicago: Nelson-Hall. Fisher, Frank, and John Forrester (eds.) (1993) The Argumentative Turn In Policy Analysis
And Planning. Durham: Duke University Press. Furubotn, Eirik G., and Rudolf Richter (eds.) (1991) The New Institutional Economics. A
Collections of Articles from the Journal of Institutional and Theoretical Economics. College Station: Texas A&M University Press.
Furubotn, Eirik G., and Svetozar Pejovich (1975) "Property Rights and Economic Theory: A Survey of Recent Literature." in: Henry G. Manne (ed.) The Economics of Legal Relationships. Readings in the Theory of Property Rights. St. Paul, New York, a.o.: West Publishing Company. pp. 53-65.
Gallup Poll (1989) "The Environment." The Gallup Report 285. Gangadharan, Lata, and Ma. Rebecca Valenzuela (2000) "Interrelationships between Income,
Health, and the Environment: Extending the Environmental Kuznets Curve Hypothesis." Ecological Economics 36(3): 513-31.
Goldsmith, Edward, et al. (1972) Blueprint for Survival. Boston: Houghton Mifflin. Gordon, Scott H. (1954) "The Economic Theory of a Common-Property Resource: the
Fishery." Journal of Political Economy 62: 124-42. Gore, Albert, Jr. (1992) Earth in the Balance: Ecology and the Human Spirit. New York:
Houghton Mifflin. Greene, William H. (1993) Econometric Analysis. New York: Macmillan Publishing
Company. Grossman, Gene M., and Alan B. Krueger (1995) "Economic Growth and the Environment."
Quarterly Journal of Economics pp. 353-377. Grossman, Gene M., and Alan B. Krueger (1994) "Economic Growth and the Environment."
NBER Working Paper No. 4634. Cambridge: National Bureau of Economic Research. Grossman, Gene M., and Alan B. Krueger (1993) "Environmental Impacts of a North
American Free Trade Agreement," in: P. Garber, (ed.) The US.-Mexico Free Trade Agreement. Cambride: MIT Press.
Grossman, Gene M., and Alan B. Krueger. (1991) "Environmental Impacts of a North American Free Trade Agreement." Paper prepared for the SECOFE conference on the U.S.-Mexico Free Trade Agreement.
Gurr, Ted Robert, Keith Jaggers, and Will H. Moore (1991) "The Transformation of the Western State: The Growth of Democracy, Autocracy, and State Power since 1800." in: Alex Inkeles (ed.) On Measuring Democracy. Its Consequences and Concmitants. New Brunswick: Transaction Publishers.
Hanna, Susan, Carl Folke, and Karl-Goran Maler (1996) Rights to Nature. Washington, D.C.: Island Press.
Hardin, Garrett (1968) "The Tragedy of the Commons." Science 162: 1243-1248. Hayward, Bronwyn M. (1995) "Beyond Liberalism? Environmental Management and
Deliberative Democracy." Paper presented at the 91 st Annual Meeting of the American Political Science Association, Chicago, Illinois.
Heemskerk, K.N. (1997) "Sustainable Development: A Challenge for Banks?" Dissertation, ERASMUS University, Faculty of Business Administration.
Heilbroner, Robert L. (1980) An Inquiry into the Human Prospect. Updated and Reconsideredfor the 1980. New York: Norton and Company.
Heilbroner, Robert L. (1975) An Inquiry into the Human Prospect. New York: W.W. Norton. Hempel, Lamont C. (1996) Environmental Governance: The Global Challenge. Washington,
D.C.: Island Press.

126
Hirschman, Albert O. (1970) Exit, Voice, and Loyality - Responses to Decline in Firms, Organizations, and States. Cambridge: Harvard University Press.
Hobbes, Thomas (1991) Leviathan. New York: Cambridge University Press. Homer-Dixon, Thomas F. (1993) "Physical Dimensions of Global Change." in: Choucri,
Nazli. Global Accord. Environmental Challenges and International Responses. Massachusetts Institute of Technology: Cambridge.
Hsiang, Cheng (1986) Analysis o/Panel Data. New York: Cambridge University Press. Inglehart, Ronald (1990) Culture Shift in Advanced Industrial Societies. Princeton: Princeton
University Press. Inglehart, Ronald (1971) "The Silent Revolution in Europe: Intergenerational Change in
Postindustrial Societies." American Political Science Review 65: 991-1007. Inglehart, Ronald, and Paul R. Abramson (1994) "Economic Security and Value Change."
American Political Science Review 88(2): 336-353. Janicke, Martin, Manfred Binder, Stefan Bratzel, Alexander Carius, Helge Joergens, Kristine
Kern, and Harald Manch (1995) Umweltpolitik im internationalen Vergleich: Untersuchungen zu strukturellen Er/olgsbedingungen. Forschungsstelle fuer Umweltpolitik: Berlin.
Janicke, Martin, and Harald Manch (1988) "Okologischer und Wirtschaftlicher Wandel im Industrielandervergleich. Eine explorative Studie tiber Modernisierungskapazitaten." in: Manfred G. Schmidt (ed.) International und Historisch Vergleichende Analysen. PVS Sonderheft 19. Opladen: Westdeutscher Verlag.
Kaufmann, Robert, Brynhildur Davidsdottir, Sophie Gamham, Peter Pauly (1998) "The determinants of atmospheric S02 concentrations: reconsidering the environmental Kuznets curve." Ecological Economics (25) 2: 209-220.
Keefer, Philip, and Stephen Knack (1994) "Property Rights, Inequality and Growth." Unpublished Manuscript.
Keohane, Robert and Elinor Ostrom (1995) Local Commons and Global Interdependence. Thousand Oaks: SAGE.
Kissling-Niif, Ingrid, and Frederic Varone (eds.) (2000) Institutionen/ur eine nachhaltige Ressourcennutzung. Innovative Steuerungsansiitze am Beispiel der Ressourcen Luft und Boden. Ztirich: Rtiegger.
Kitschelt, Herbert P. (1986) "Political Opportunity Structures and Political Protest: AntiNuclear Movements in Four Democracies." British Journal o/Political Science 16(1): 57-85.
Kobler, Markus (2000) Der Staat und die Eigentumsrechte. Ttibingen: Mohr Siebeck. Knapfel, Peter, and Helmut Weidner (1985) Luftreinhaltepolitik (Stationiire Quellen) im
Internationalen Vergleich. Berlin: edition sigma. Kraft, Michael. E. (1996) Environmental Policy and Politics: Toward the Twenty-First
Century. New York: Harper Collins. Kratochwil, Friedrich (1989) Rules, Norms, and Decisions. Cambridge: Cambridge
University Press. Leal, Donald (1996) "Community-Run Fisheries: Avoiding the "Tragedy of the Commons"."
PERC Policy Series PS-7. Leiss, William (1972) The Domination o/Nature. New York: George Braziller. Levi, Margaret (1988) 0/ Rule and Revenue. Berkeley: University of California Press. Libecap, Gary (1998) "Distributional and Political Issues in Modifying Traditional Common-
property Institutions." in: Berge, Erling, and Nils Christian Stenseth (eds.) Law and the Governance o/Renewable Resources. Oakland: ICS Press.
Libecap, Gary (1991) "Distributional Issues in Contracting for Property Rights." in: Eirik G. Furubotn and Rudolf Richter (eds.) The New Institutional Economics. A Collection 0/
Bibliography 127
Articles from the Journal of Institutional and Theoretical Economics. College Station: Texas A&M University Press. pp. 214-32.
Litfin, Karen (1999) "Constructing Environmental Security and Ecological Interdependence." Global Governance 5: 359-377.
Livingston, Marie Leigh (1987) "Evaluating the Performance of Environmental Policy: Contributions of Neoclassical, Public Choice, and Institutional Models." Journal of Economic Issues 21: 281-295.
Loehman, Edna T., and D. Marc Kilgour (1998) Designing Institutionsfor Environmental and Resource Management. Cheltenham: Edward Elgar.
Lovins, Amory (1977) Soft Energy Paths. Cambridge: Ballinger. Lowry, William (1998) Preserving Public Landsfor the Future. The Politics of
Intergenerational Goods. Washington, D.C.: Georgetown University Press. Lueck, Dean (1995) "Property Rights and the Economic Logic of Wildlife Institutions."
Natural Resources Journal 35: 625-670. Lundquist, Lennart (1974) "Do Political Structures Matter in Environmental Politics? The
Case of Air Pollution Control in Canada, Sweden, and the United States." Canadian Public Administration 17: 119-14l.
Lundquist, Lennart (1980) The Hare and the Tortoise: Clean Air Policies in the United States and Sweden. Ann Arbor: University of Michigan Press.
Mansbridge, Jane (1980) Beyond Adversary Democracy. New York: Basic Books. Margerum, Christine (1995). "The Decentralization of Policy making: Lessons from the U.S.
and German Subnational Support for High-Technology Industries." Paper presented at the 91 st Annual Meeting of the American Political Science Association, Chicago, Illinois.
Martin, Fenton (1992) Common Pool Resources and Collective Action: A Bibliography. Vol. 2. Bloomington: Indiana University, Workshop in Political Theory and Policy Analysis.
Mazmanian, Daniel A. (1995) "Clear Vision, Clean Skies: A New Epoch in Air Pollution Control for the Los Angeles Region." Monograph. Claremont: The Center for Politics and Economics, The Claremont Graduate School.
Mazmanian, Daniel A., and David Morell (1990) "The NIMBY Syndrome: Facility Siting and the Failure of Democratic Discourse." in: Norman J. Vig, and Michael E. Kraft. (eds) Environmental Policy in the 1990s~ Washington, D.C.: Congressional Quarterly Press.
McCay, Bonnie J., and James M. Acheson (eds.) (1987) The Question of the Commons. The Culture and Ecology of Communal Resources. Tucson: The University of Arizona Press.
McChesney, Fred S. (1990) "Government as Definer of Property Rights: Indian Lands, Ethnic Externalities, and Bureaucratic Budgets." Journal of Legal Studies 19: 297-335.
McGrory Klyze, Christopher (1996) Who Controls Public Lands? Chapel Hill: The University of North Carolina Press.
McIntyre, Robert J. and James R. Thornton (1978) "On the Environmental Efficiency of Economic Systems." Soviet Studies Vol. XXX(2): 173-92.
McKean, Margaret (1992) "Management of Traditional Common Lands (Iriaichi) in Japan." in: Daniel W. Bromley (ed.) Making the Commons Work. San Francisco: ICS Press.
Midlarsky, Manus (1998) "Democracy and the Environment: An Empirical Assessment." The Journal of Peace Research 35(3): 341-36l.
Milbrath, Lester (1993) "The World Is Relearning Its Story About How The World Works." in: Sheldon Karnieniecki (ed.) Environmental Politics In The International Arena. Albany: SUNY.
Mohr, Ernst (1990) "Courts of Appeal, Bureacracies and Conditional Project Permits: The Role of Negotiating Non-Exclusive Property Rights over the Environment." Journal of Institutional and Theoretical Economics 146: 601-616.
128
Moomaw, W.R., and G.c. Unruh, W.R. (1998) "An alternative analysis of apparent EKCtype transitions." Ecological Economics (25)2: 221-229.
Mueller-Rommel, Ferdinand (1993) Grune Parteien in Westeuropa. Entwicklungsphasen und Erfolgsbedingungen. Opladen: Westdeutscher Verlag.
National Research Council (1986) Proceedings of the Conference on Common Property Resource Management. Washington, D.C.: National Academy Press.
Naughton-Treves, Lisa, and Steven Sanderson (1995) "Property, Politics, and Wildlife Conservation." World Development 23(8): 1265-75.
Nelkin Dorothy and Michael Pollack (1981) The Atom Besieged. Extraparliamentary Dissent in France and Germany. Cambridge: MIT Press.
North, Douglass (1991a) "Transaction Costs, Institutions, and Economic History." in: Eirik G. Furubotn and Rudolf Richter (eds.) The New Institutional Economics. A Collection of Articles from the Journal of Institutional and Theoretical Economics. College Station: Texas A&M University Press. pp. 203-13.
North, Douglass (1991b) "A Transaction Cost Approach to the Historical Development of Polities and Economies." in: Eirik G. Furubotn and Rudolf Richter (eds.) The New Institutional Economics. A Collection of Articles from the Journal of Institutional and Theoretical Economics. College Station: Texas A&M University Press. pp. 253-60.
North, Douglass (1989) "Institutions and Economic Growth: An Historical Introduction." World Development 17(9): 1319-1332.
North, Douglass, and Robert Thomas (1973) The Rise of the Western World. Cambridge: Cambridge University Press.
Olson, Mancur (1992) "Foreword." in: Todd Sandler. Collective Action. Theory and Applications. Ann Arbor: The University of Michigan Press.
Olson, Mancur (1965) The Logic of Collective Action. Cambridge: Harvard University Press. Ophuls, William (1977) Ecology and the Politics of Scarcity: Prologue to a Political Theory
of the Steady State. San Francisco: W.H. Freeman. Ophuls, William and A. Stephen Boyan, Jr. (1992) Ecology and the Politics of Scarcity
Revisited. The Unraveling of the American Dream. New York: W.H. Freeman and Company.
Orr, David W. (1992) Ecological Literacy. Education and the Transition to a Postmodern World. Albany: State University of New York Press.
Orr, David W. and Stuart Hill (1978) "Leviathan, the Open Society, and the Crisis of Ecology." The Western Political Quarterly 31(4): 457-69.
Ostrom, Elinor (1999) "Institutional rational choice: An assessment of the institutional analysis and development framework." in: Paul A. Sabatier (ed.) Theories Of The Policy Process. Boulder: Westview Press.
Ostrom, Elinor (1998) "A Behavioral Approach to the Rational Choice Theory of Collective Action." American Political Science Review 92(1): 1-22.
Ostrom, Elinor (1992) "The Rudiments of a Theory of the Origins, Survival, and Performance of Common-Property Institutions." in: Daniel W. Bromley (ed.) Making the Commons Work Theory, Practice, and Policy. San Francisco: ICS Press.
Ostrom, Elinor (1990) Governing the Commons. The Evolution of Institutions for Collective Action. Cambridge: Cambridge University Press.
Ostrom, Elinor, Roy Gardner, and James Walker (1994) Rules, Games, and Common Pool Resources. Ann Arbor: University of Michigan Press.
Ostrom, Elinor, James Walker and Roy Gardner (1990) "Sanctioning by Participants in Collective Action Problems." Paper delivered at the Annual Meeting of the American Political Science Association, San Francisco, California.

Bibliography 129
OzIer, Sule, and Dani Rodrik (1992) "External Shocks, Politics, and Private Investment: Some Theory and Empirical Evidence." NBER Working Paper No. 3960. Cambridge.
Passmore, J. (1974) Man's Responsibility for Nature. New York: Basic Books. Payne, Roger A. (1995) "Freedom and the Environment." Journal of Democracy 6(3): 41-55. Pearce, David W., and Jeremy J. Warford (1993) World Without End: Economics,
Environment, and Sustainable Development. New York: Oxford University Press. Pejovich, Svetozar (1975) "Towards an Economic Theory of the Creation and Specification of
Property Rights." in: Henry G. Manne (ed.) The Economics of Legal Relationships. Readings in the Theory of Property Rights. St. Paul, New York, a.o.: West Publishing Company. pp. 37-52.
Persson, Torsten, and Guido Tabellini (1994) "Is Inequality Harmful for Growth?" American Economic Review 84(3): 600-62.
Press, Daniel (1998) "Local Environmental Policy Capacity: A Framework for Research." Natural Resources Journal 38(1): 29-52.
Press, Daniel (1994) Democratic Dilemmas in the Age of Ecology. Tress and Toxics in the American West. Durham and London: Duke University Press.
Princen, Thomas (1998) "From Property Regime to International Regime: An Ecosystems Perspective." Global Governance 4(4): 395-413.
Reich, Michael R. (1984) "Mobilizing for Environmental Policy in Italy and Japan." Comparative Politics 16: 379-402.
Repetto, Robert (1988) "Overview." in: Robert Repetto and M. Gills. Public Policies and the Misuse of Forest Resources. Cambridge: Cambridge University Press.
Rinquist, Evan (1993) Environmental protection at the State Level. Politics and Progress in Controlling Pollution. Armonk: Sharpe.
Rinquist, Evan (1993) "Does Regulation Matter?: Evaluating the Effects of State Air Pollution Control Programs." The Journal of Politics 55(4): 1022-45.
Rosenthal, Jean-Laurent (1990) "The Development of Irrigation in Provence, 1700-1860: The French Revolution and Economic Growth." The Journal of Economic History L(3): 615-638.
Rothman, Dale, and Sander M. de Bruyn (1998) "Probing into the Environmental Kuznets Curve Hypothesis." Ecological Economics 25: 143-145.
Ruggie, John (1998) Constructing the World Polity: Essays on International Institutionalization. New York: Routledge.
Runge, C. Ford (1992) "Common Property and Collective Action in Economic Development." in: Daniel W. Bromley (ed.) Making the Commons Work. Theory, Practice, and Policy. San Francisco: ICS Press.
Sabatier, Paul (1988) "An Advocacy Coalition Framework Of Policy Change And The Role Of Policy-Oriented Learning Therein." Policy Sciences 21: 129-168.
Sabatier, Paul and Hank Jenkins-Smith (1999) "The Advocacy Coalition Framework: An Assessment." in: Paul Sabatier (ed.) Theories Of The Policy Process. Boulder: Westview Press.
Sabatier, Paul and Hank Jenkins-Smith (1993) Policy Change And Learning: An Advocacy Coalition Approach. Boulder: Westview Press.
Sagasti, Francisco R. and Michael E. Colby (1993) "Eco-Development and Perspectives on Global Change from Developing Countries." in: Choucri, Nazli. Global Accord. Environmental Challenges and International Responses. Massachusetts Institute of Technology: Cambridge.
Sagoff, Mark (1988) The Economy of the Earth. Philosophy, Law, and the Environment. Cambridge: Cambridge University Press.
130
Sandler, Todd (1992) Collective Action. Theory and Applications. Ann Arbor: The University of Michigan Press.
Sandler, Todd, and Frederic P. Sterbenz (1990) "Harvest Uncertainty and the Tragedy of the Commons." Journal of Environmental Economics and Management 18: 155-167.
Sanderson, Steven (1995) "Allocating Rights to Biota: Intellectual Property and the Preservation of Biodiversity." Paper presented at the Annual Meeting of the American Political Science Association, Chicago.
Schaltegger, Stefan, and Frank Figge (1998) "Environmental Shareholder Value." WWZ'Sarasin Basic Report # 54. Basel: WWZ, University of Basel.
Scharpf, Fritz (1997) Games Real Actors Play: Actor-Centred Institutionalism In Policy Research. Boulder: Westview Press.
Scheberle, Denise (1997) Federalism and Environmental Policy: Trust and the Politics of Implementation. Washington, D.C.: Georgetown University Press.
Schelbert-Syfrig, Heidi, and Andreas 1. Zimmermann (1988) "Konkurrenz und Umweltschutz. Wald- und Holzwirtschaft zwischen Okonomie und Okologie." Schweizerische Zeitschriftfor Volkswirtschafi und Statistik 3: 289-302.
Schlager, Edella, and William Blomquist (1998) "Heterogeneity and Common Pool Resource Management." in: Loehman, Edna T., and D. Marc Kilgour (eds.) DeSigning Institutions for Environmental and Resource Management. Cheltenham: Edward Elgar.
Schlager, Edella and Elinor Ostrom (1992) "Property-Rights Regimes and Natural Resources: A Conceptual Analysis." Land Economics 68(3): 249-62.
Schmidheiny, Stephan, and Federico Zorraquin (1996) Financing Change. The Financial Community, Eco-EjJiciency, and Sustainable Development Cambridge: The MIT Press.
Sch5n, Donald, and Martin Rein (1994) Frame Reflection: Toward The Resolution Of Intractable Policy Controversies. New York: Basic Books.
Schrama, Geerten (1998) "Banks as change agents towards more sustainable industry?" Paper presented at the 7th International Conference of the Greening of Industry Network, Rome, Italy, November 15-18.
Schrama, Geerten, and Ferd Schelleman (1996) "Banks as External Stakeholders to Corporate Environmental Management. Trends in the Netherlands." CSTM Studies and Reports # 45. Enschede: CSTM, University of Twente.
Schumacher, E.F. (1973) Small Is Beautiful: Economics as if People Mattered. New York: Harper and Row.
Sedjo, Roger A. (1989) ''Property Rights for Plants." RESOURCES 97: 1-4. Selden, R. M., and D. Song (1994) "Environmental Quality and Development: Is there a
Kuznets Curve for Air Pollution?" Journal of Environmental Economics and Environmental Management 27: 147-162.
Serageldin, Ismail (1995) "Sustainability and the Wealth of Nations: First Steps in an Ongoing Journey." Paper for the Third Annual World Bank Conference on Environmentally Sutainable Development. Preliminary Draft for Discussion Only.
Shafik, Nemat, and Sushenjit Banyopadhyay (1992) "Economic Growth And Environmental Quality. Time-Series and Cross-Country Evidence." Background Paper for World Development Report 1992. Washington, D.C.: The World Bank.
Shiva, Vandana (1999) "Diversity and Democracy: Resisting the Global Economy." GlobalDialogue 1(1): 19-30.
Shleifer, Andrei (1995) "Establishing Property Rights." in: Proceedings of the World Bank Annual Conftrence on Development Economics 1994. The International Bank for Reconstruction and DevelopmentlThe World Bank.

Bibliography 131
Skolnikoff, Eugene B. (1993) "Science and Technology: The Sources of Change." in: Choucri, Nazli. Global Accord. Environmental Challenges and International Responses. Massachusetts Institute of Technology: Cambridge.
Solesbury, William (1976) "Issues and Innovation in Environmental Policy in Britain, West Germany, and California." Policy Analysis 2: 1-38.
Southgate, Douglas, John Sanders, and Simeon Ehui (1990) "Resource Degradation in Africa and Latin America: Population Pressure, Policies, and Property Arrangements." American Journal 0/ Agricultural Economics 72(5): 1259-63.
Southgate, Douglas, Rodrigo Sierra, and Lawrence Brown (1991) "The Causes of Tropical Deforestation in Ecuador: A Statistical Analysis." World Development 19(9): 1145-51.
Span, Henry A. (1996) "Protecting Property from Democracy: Political Inequality and "Liberal" and "Civic Republican" Approaches to the Takings Clause." Paper Presented at the 1996 Annual Meeting of the American Political Science Association, San Francisco, California.
Stern, David, Michael S. Common, and Edward Barbier (1996) "Economic Growth and Environmental Degradation: The Environmental Kuznets Curve and Sustainable Development." World Development 24(7): 1151-1160.
Stubblebine, Wm. Craig (1975) "On Property Rights and Institutions." in: Henry G. Manne (ed.) The Economics o/Legal Relationships. Readings in the Theory o/Property Rights. St. Paul, New York, a.o.: West Publishing Company. pp. 11-22.
Suri, Vivek, and Duane Chapman (1998) "Economic growth, trade and energy: implications for the environmental Kuznets curve." Ecological Economics (25)2: 195-208.
Taylor, Bob Pepperman (1992) Our Limits Transgressed. Environmental Political Thought in America. Lawrence: University of Kansas Press.
Taylor, Michael (1987) The Possibility o/Cooperation. Cambridge: Cambridge University Press.
Thirgood, J.V. (1981) Man and the Mediterranean Forest: A History o/Resource Depletion. London: Academic Press.
Thompson, Michael, Richard Ellis, and Aaron Wildavsky (1990) Cultural Theory. Boulder: Westview Press.
Thomson, James T., David Feeny, and Ronald J. Oakerson (1992) "Institutional Dynamics: The Evolution and Dissolution of Common-Property Resource Management." in: Daniel W. Bromley (ed.) Making the Commons Work. San Francisco: IeS Press. pp. 129-160.
Torras, Mariano, James K. Boyce (1998) "Income, inequality, and pollution: a reassessment of the environmental Kuznets Curve." Ecological Economics (25)2: 147-160.
Torstensson, Johan (1994) "Property Rights and Economic Growth: An Empirical Study." KYKLOS 47: 231-247.
Turvey, Ralph (1975) "On Divergences between Social and Private Cost." in: Henry G. Manne (ed.) The Economics o/Legal Relationships. Readings in the Theory o/Property Rights. St. Paul, New York, a.o.: West Publishing Company. pp. 357-361.
United Nations Population Fund (1991) Population Policies and Programmes: Lessons Learned/rom Two Decades o/Experience. New York: New York University Press.
United Nations Environmental Programme. "Public and Leadership Attitudes to the Environment in Four Continents. A Report of a Survey in 16 Countries." New York: Louis Harris and Associates.
Vogel, David (1993) "Representing Diffuse Interests in Environmental Policymaking." in: R. Kent Weaver and Bert A. Rockman (eds.) Do Institutions Matter? Government Capabilities in the United States and Abroad. Washington, D.C.: The Brookings Institution.
132
Weber, Edward P. (1998) Pluralism by the Rules: Conflict and Cooperation in Environmental Regulation. Washington, D.C.: Georgetown University Press.
Wendt, Alexander (1999) Social Theory of International Politics. Cambridge: Cambridge University Press.
White, Mark (1995) "Environmental Finance: Raising and Using Funds in an Age of Ecology." Paper presented at the 4th International Conference of the Greening of Industry Network, Toronto, Canada, November.
Wiebe, Keith, Abebayehu Tegene, and Betsey Kuhn (1997) "Managing Public and Private Land through Partial Interests." Contemporary Economic Policy XV: 35-43.
Williams, Burce A., and Albert R. Matheny (1995) Democracy, Dialogue, and Environmental Disputes. New Haven: Yale University Press.
World Bank (1995) Monitoring Environmental Progress. A Report on Work in Progress. The World Bank: Washington, D.C.
World Commission on Environment and Development (Brundtland Commission) (1987). Our Common Future. New York: Oxford University Press.
World Resources Institute (1994) World Resources 1994-1995. People and the Environment. New York: Oxford University Press.
World Resources Institute (1992) World Resources 1992-1993. Toward Sustainable Development. New York: Oxford University Press.
Young, Oran B. (1994) International Governance. Protecting the Environment in a Stateless Society. Cornell University Press: Ithaca and London.
Ziegler, Charles E. (1980) "Soviet Environmental Policy and Soviet Central Planning: A Reply to Mcintyre and Thornton." Soviet Studies XXXII(1): 124-34.
Appendix A
As discussed in chapter 2, numerous quantitative analyses have been conducted in this area of research. These analyses tend to face substantial difficulties, for instance in terms of data availability and quality, questions of methodology, and problems with the inclusion of ecological aspects such as ecosystem resilience or irreversibility of damage. As a consequence, quantitative analyses are not at the center of the analyses in this book. However, some quantitative inquiries into the influence of institutions on environmental quality at a given level of economic development were conducted. The results of these analyses are presented here for those interested in further pursuing such assessments. Admittedly, these econometric analyses focus only on a limited group of the various institutional, social, and cognitive determinants of environmental quality identified by scholars. Besides the aim to concentrate on the most interesting ones, the selection was limited by measurability of the factors and data availability.
A.I The dependent variable: environmental quality
The analysis follows the examples of Grossman and Krueger (1995), Shafik and Bandyopadhyay (1992), and Janicke et al. (1995), in its choice of indicators of environmental quality. Data were obtained from Gene Grossman and Alan Krueger at Princeton, who in turn, drew the information directly from the Global Environmental Monitoring Systems (GEMS) project, and from the World Resources Institute, the World Bank, and the OEeD. The 11 indicators of environmental quality range from measures of air quality in the form of concentrations of sulfur dioxide (S02) and light and
133
134 Appendix A
heavy suspended particulate matter (smoke and SPM), of water quality in the form of dissolved oxygen (D02), biochemical oxygen demand (BOD), and fecal coliform in rivers, deforestation, and rural and urban access to safe drinking water and sanitation.
Indicators of Air Quality: Sulfur Dioxide and Suspended Particulate Matter Sulfur dioxide is a major form of air pollution today. It is a colorless and
odorless gas, which is normally present at the Earth's surface at low concentrations, but has been dramatically increased through major anthropogenic sources, such as the burning of fossil fuels (mostly coal in power plants), as well as through a variety of industrial processes (petroleum refining, production of paper, cement and aluminum). In the atmosphere, complex interaction with oxygen and water vapor transforms S02 into sulfuric acid, which then is deposited as acid precipitation in the form of rainfall, snow, and fog. The impact of sulfuric acids depends on the dose or concentration present, which in turn is influenced by geology and climatic patterns, types of vegetation and soil composition, and ranges from severe damage to human and animal lung function to death for animals and plants, as well as corrosion of paint, metals and other building materials. Acid rain is responsible for the death of forests and lake ecosystems, as well as the acidification of soils.
Previous research has found S02 to be significantly correlated with per capita incomes. Specifically, a general agreement exists that the relationship between S02 and per capita income levels takes the form of an Environmental Kuznets Curve. However, Janicke et al. (1995) point out that in their study the relationship between income levels and the S02 ratio is not very robust, as it almost disappears if you only look at the OECD countries without Turkey and Spain (which, they acknowledge, might be attributed to distortions in the design of their indicator). The reason for this relationship probably is that relatively 'simple' answers to S02 emissions are available. From the original idea to build higher smokestacks (which of course only turned a local into a regional problem), to technology to clean up coal so that it burns more cleanly, to the possibility to switch from coal with high sulfur content to coal with low sulfur content, to scrubbing or processes of coal gasification or fluidized-bed combustion, technological solutions have been found. In addition, policy advances have introduced economic incentives to reduce S02 emissions in the United States, for instance, in the form of the emissions trading program under the Clean Air Act. Finally, Janicke et al. (1995) point out that high income levels might provide a relief from environmental problems in this regard apart from policy achievements, as they allow adjustments in the structure of fossil fuel consumption.

Appendix A 135
The dependent variable is measured as the median daily concentration of S02 ()..lg/m\ Furthermore, the data document the urban or suburban location of the station, the nearby land use, and the type of measuring device used, which have an impact on the S02 concentrations measured. In addition, three control variables devised by Grossman and Krueger, capturing the population density, proximity to the coast, and volcanic eruptions nearby are utilized.! The sample, then, includes measurements from 228 stations in 40 countries between 1977 and 1991. As not all of these stations reported measurements in every year, the sample is of an unbalanced nature.
Suspended particulate matter forms the second indicator of air quality. Following Grossman and Krueger's lead, the analysis differentiates between heavy particulates and light particulates (smoke). SPM generally refers to small particles of solid or liquid substances, some of which are visible as smoke, soot, or dust, while others are not. Particulates affect human and animal health, and local ecosystems as well as the global one. In humans, particulates can cause chronic health problems, as they enter (and stay in) the lungs. Asbestos particles as well as particles of heavy metals (arsenic, copper, lead, zinc) that are emitted from industrial facilities such as smelters are particularly dangerous in this regard. Dust layers on plants affect their ability to absorb light, carbon dioxide, and water as well as the release of oxygen. The sources of SPM are many. They include modern agriculture, desertification, nearly all industrial processes, tobacco smoke, automobile exhaust, cement and coal dust, as well as a range of natural sources such as pollen, volcanic eruptions, fires, dust storms, human hair, sea spray, and beach sand. Their different characteristics (point sources, fugitive sources, mobile sources) imply correspondingly different potential for and costs of air quality improvement.
Previous research has analyzed the relationship between SPM and per capita income levels. Similar to their results for S02, Grossman and Krueger (1991, 1993, 1994, 1995) found evidence of an Environmental Kuznets Curve for smoke, but a uniform decrease in heavy particulates with rising per capita incomes. Likewise, Shafik and Bandyopadhyay (1992) report that SPM concentrations appear to increase with initial rises in per capita income levels, but fall with further increases once ascertain income level is reached. In contrast, Janicke et al. (1995) find a negative linear relationship, indicating a decrease in SPM emissions with rising per capita income levels,
! As Grossman and Krueger point out, the inclusion of these control variables is not necessary to obtain unbiased results, since they are unlikely to be correlated with per capita income levels (and in this case, also with institutional capacity). They reduce the variance of the residuals, however, and thereby allow more precise estimates of the relationship between the indicators of environmental quality and institutional capacity and per capita income levels.
136 Appendix A
which might be due to the comparatively high income levels of the countries in their sample.
Again, the median daily concentrations of heavy particulate matter and smoke are used as dependent variables (Jlglm\ and variables capturing land use, closeness to the coast, desert, population density and measuring devices as control variables. The sample includes measurements for heavy particulates from 152 stations in 25 countries and for smoke from 84 stations in 17 countries, from 1977-1991, and is again of an unbalanced nature.
Indicators o/Water Quality: Dissolved Oxygen (DOJJ, Biochemical Oxygen Demand (BOD), and Fecal Coliform One indicator of water quality in rivers is the state of the oxygen regime.
If levels of oxygen are too low, fish and plant life dies. Dead rivers are those that contain no oxygen, while we mostly refer to low oxygen levels when we talk about polluted streams. Oxygen levels in rivers are influenced by the amount of dead organic matter present and the consequent bacterial activity, as the bacteria responsible for decay of dead organic matter in water require oxygen to do their job. If there is too much bacterial activity, insufficient oxygen might be left for the fish life. The sources of dead organic matter, in tum, are primarily waste water treatment plants as well as a range of natural sources such a dead leaves, agricultural runoff (accounts for approximately 33% of dead organic matter present in rivers), and urban sewage. All streams possess a natural cleansing ability allowing them to degrade organic waste. Problems arise when the stream is overloaded with the latter, and its ecosystem breaks down. A second cause of changes in oxygen levels are the nutrients contained in runoff from fertilized agricultural areas; the excess algae growth induced by higher levels of nitrogen and phosphorus likewise competes with fish life and organisms for oxygen.
Two indicators of the state of the oxygen regime are employed, as different stations and countries report one or the other, but not always both. Dissolved oxygen indicates the level of oxygen in a river. A more common measure for water quality, BOD, is an inverse measure of the levels of dissolved oxygen. It reports the amount of oxygen required for biochemical decomposition. Previous research studying the relationship between the state of the oxygen regime and per capita income levels has arrived at conflicting results. Grossman and Krueger report an environmental Kuznets curve for both D02 and BOD, while Shafik and Bandyopadhyay found D02 to increase with per capita income levels.
2 Because of the skewed distribution of SPM levels, the log of the dependent variable is utilized to normalize the data.

Appendix A 137
The analysis concentrates on measurements of river water quality, as data on lake and groundwater stations is too sparse. For both D02 and BOD, the mean levels are documented, (J..lglm3). Importantly, the majority of stations reports the mean temperature of the river, which has a significant influence on oxygen levels, and needs to be included in the analysis as a control variable. Data on BOD were available for 215 stations in 39 countries and D02 for 263 stations in 50 countries between 1979 and 1990.
Fecal coliform is a measure used to indicate the disease potential of a water resource caused by pathogenic pollution. Compared to the state of the oxygen regime, pathogenic pollution has more to do with human access to safe drinking water than with the health of aquatic resources. The lack of clean, disease-free drinking water is still one of the most serious water pollution problems today. While proper treatment of water has greatly reduced the risk of epidemics in most developed countries, every year billions of people, especially in developing countries, face the risk of waterborne diseases. Pathogens from fecal discharges can cause a range of diseases ranging from an upset stomach to potentially fatal diseases such as typhoid and cholera. Specifically, fecal coliform counts measure microbial pollution, mostly by common and harmless forms of bacteria. The presence of these harmless bacteria, however, indicates the likelihood of the presence of the harmful bacteria, which are difficult to measure directly. The sources of pathogenic pollution are all kinds of human and animal waste. Separating sewage from drinking water supplies is, thus, an essential step in reducing the disease potential of water resources. Furthermore, in most developing countries the water supply is continuously being monitored for quality.
Previous research again found conflicting results when studying the relationship between fecal coliform and per capita income levels. Grossman and Krueger report GDP per capita to be associated with constant levels of fecal coliform up to a per capita income of $8,000 and to fall sharply thereafter. Shafik and Bandyopadhyay, however, find a cubic relationship.
Coliform is measured as log(I+Y), where Y is number of organisms per 100 milliliters. The transformation is necessary because of the exponential growth in coliform and the skewed nature of the data. A simple log operation is not possible, since many of the stations report coliform levels of zero when the reading falls below the detectable level· of the measuring instrument. Furthermore, a control variable for the mean annual water temperature is included since fecal coliform is especially sensitive to heat, so that bacterial counts can vary over several orders of magnitude at a given monitoring station, as well as a control variable for the type of measuring device used. The sample includes measurements from 205 stations in 44 countries between 1979 and 1990.

138 Appendix A
Deforestation Deforestation is probably one of the most visible environmental problems
today. Even though this visibility is deceptive in terms of the identification of the 'villains,' since many nations cut down their forests over the past centuries and therefore have low deforestation rates today, the problem demands attention. Deforestation is such a serious problem because of the historical link between forests and civilization and because of the multiple functions forests fulfil. Forests are economic resources providing wood for building material, as a source of fuel, as material for boats and wagons, apart from any symbolic, aesthetic and recreational functions. Nearly half of the world's population still depends on wood for cooking as well as heating. Moreover, forests reduce problems of soil erosion, act as water sheds, and provide a habitat for wildlife including many endangered species. The irreversibility of deforestation is a further problem since genetic diversity is lost which diminishes future opportunities to develop pharmaceuticals (a very anthropocentric concern). Most importantly, forests are pivotal for climate protection as they absorb atmospheric carbon dioxide, a greenhouse gas. Naturally, deforestation reduces this 'storage space.' In addition, deforestation often takes place in the form of burning which releases the carbon sequestered in the forest's biomass and thereby compounds the problem.
Deforestation is measured as change in forest cover in nations over time. Forests are defined as areas where trees are the dominant vegetation ranging from closed canopy forests to open woodlands, often also scrublands and bushlands. While changes in forest cover are natural and necessary, this natural change is extremely slow in terms of human life expectancy. Today forests are cut at alarmingly high rates for lumber and paper products, for fuel, or to obtain agricultural land. Only approximately 2.5 billion hectares (ha) of closed forest and 1.2 billion ha of open woodlands and savannas remain in the world. Furthermore, indirect deforestation, the death of trees from pollution, is a reality but not counted in the deforestation data.
As pointed out earlier, several studies of smaller cross-sections of countries have been able to find support for a significant relationship between property rights and deforestation. Interestingly, the relationship between per capita income levels and environmental quality, so prevalent for all other environmental indicators, could not be proven by Shafik and Bandyopadhyay (1992). The authors explain this lack of evidence with the 'bias' inherent in the sample, as we lack data on the historical cutting of forests by the now-developed nations.
Deforestation data, specifically data on the annual percentage of deforestation, are gathered by the World Resources Institute. Unfortunately, the official description of the data, as providing data on deforestation rates in

Appendix A 139
a cross-section of countries from 1980-1990, is misleading, as only one data point in the form of the average annual deforestation rate and the average percentage change in forest cover for the entire decade are reported for each country. The sample therefore is small, including only 89 observations (from 89 countries).
Access to Safe Drinking Water and Sanitation Access to safe drinking water and sanitation are important determinants
of the quality of the environment in which we are living. For more than a billion people worldwide the lack of access to safe drinking water and sanitation pose serious health problems, including a generally high morbidity and mortality from waterborne diseases. Recognizing this, countries set targets for the degree of access to drinking water and sanitation to be achieved by 1990. At that point, approximately 1.3 billion people still lacked access to safe drinking water, while 1.7 billion lacked adequate sanitation. Access to water is a major component necessary for sustainable development. Yet resources are becoming ever more scarce, with more people and functions (power companies, agricultural and leisure uses) competing for them. As a consequence, experts are questioning whether access to drinking water and sanitation is actually increasing or decreasing in developing countries. Previous research, however, has found it to increase with increases in per capita income levels, which would support the intuitive logic that governments will provide and people will obtain these services once they can afford them (Shafik and Bandyopadhyay, 1992).
Data on access to safe drinking water and sanitation were obtained from the World Bank's Economic and Social Indicators data base as well as the WRI. Both sources report percentages of the population with access to these services, separated into rural and urban. All four measures are used as dependent variables in the analysis: percent of urban population with access to safe drinking water, percent of rural population with access to safe drinking water, percent of urban population with access to sanitation, and percent of rural population with access to sanitation.3 The sample includes observations from 108 countries for access to drinking water, and observations from 69 countries for access to sanitation.
3 As with most indicators of environmental quality, the data on access to safe drinking water and sanitation are far from perfect. Access to safe water is not a question of being connected to a supply system, but also of cost and quality of water provision. Measuring coverage as the percentage of population having access to standpipes or house connections is therefore an inaccurate representation of whether people have access to safe water. (World Bank, 1995: 331) Furthermore, besides the general paucity of data, definitional uncertainties regarding 'adequate amount' or 'safe' make comparisons over time difficult. At the same time, private or self-provision of these basic services, which people will rely on if government provision is not available but private resources are is often not counted.

140 Appendix A
What Is Missing Important indicators of environmental quality are absent from this
analysis. They include other measures of urban air pollution such as nitrogen and carbon monoxides or lead, alternative measures of water pollution such as contamination by heavy metals, and, most importantly, indicators of other dimensions of environmental quality such as soil degradation or measures of biodiversity. Their absence is particularly unfortunate, since they include environmental indicators for which the distancing between the consumption and production of environmental degradation has generally confounded scholars pursuing this type of empirical analyses. Institutional capacity in the United States, for instance, might do little to protect biodiversity in the Amazon region (or in fact might do the opposite). Likewise, carbon monoxide emissions are likely to be less effected by institutional capacity as the consequences are global rather than local in nature. Supportive results of the environmental impact of institutional capacity, then, might overestimate their effect to some degree or simply cannot be generalized to all dimensions of environmental quality.
A.2 The Independent Variables
Institutional Capacity The central focus of this book is on the environmental implications of
institutions, in particular property rights. Therefore, the empirical analysis was supposed to include a measure of property rights. Clague, Keefer, Knack, and Olson (1996, 1995) developed such a measure in the form of 'Contract Intensive Money' (CIM) to estimate the impact of secure property rights on economic growth. The measure is based on the idea that individuals in environments with insecure property rights will choose to engage only in self-enforcing contracts, which provide less potential for the society to realize gains from trade and build a foundation for economic growth. Contracts requiring external enforcement by a third party will only be chosen if the institutional capacities exist to provide this enforcement. Consequently, the designers of this measure argue that the relative reliance on non-currency monetary instruments should mirror the perceived security of property rights.
Clague et al. introduce the CIM measure when analyzing the differentials in levels and rates of growth and investment between countries and trying to explain why the poor countries do not catch up. They hypothesize that the poor performance of some countries is caused by a lack of institutional arrangements necessary to reap the larger gains from trade, which arise from enforcement-intensive contracts. Contracts requiring external enforcement by a third party will only be chosen if the institutional capacities exist to
Appendix A 141
provide this enforcement. While markets for self-enforcing contracts can be found in any economy, the authors point out that most contractual arrangements in sophisticated economies depend on the expectation that an authoritarian body will enforce the contract if necessary. Consequently, the authors expect the ratio of 'contract-intensive, institution-sensitive transactions' to 'spot-market and self-enforcing transactions' to be higher in economically successful societies with capital-intensive production than in poor societies with labor-intensive production. Furthermore, they argue that this ratio should be related to economic growth and rates of capital investment.
Operationalizing this difference between self-enforcing contracts and those requiring intensive external contract enforcement, Clague et al. argue that the sophistication of the financial instruments used in a society will mirror the conditions of contract enforcement. If property rights are insecure, loans to institutions or people will be insecure as well, and people will prefer cash (or even barter) exchanges. Based on this argument, then, Clague et al. derive their measure of contract-intensive money.
Thus the extent to which societies can capture not only the gains from self-enforcing transactions, but also those potential trades that are intensive in contract enforcement and property rights, can be approximated by the relative use of currency in comparison with "contract-intensive money." We define contract-intensive money (CIM) as the ratio of non-currency money to the total money supply [Mr C]IM2,
where M2 is a broad definition of the money supply and C is currency held outside banks (p. 7).
With this measure, the authors test their hypothesis that the CIM ratio of a country is positively related to the transaction-friendliness of its institutions, gains from trade and specialization reaped, investment, per capita incomes, and economic growth. Their empirical results show that a higher CIM ratio means indeed higher per capita incomes, economic growth and investment.
Clague et al. argue that the CIM measure offers a new indicator of the quality of institutions. Some scholars will look at this measure critically, however, and argue that all it captures are levels of development, especially in terms of development of financial markets. The authors show both logically and empirically that this is not the case. They test the significance of CIM when controlling for GDP per capita, financial sophistication (measured as M2/GDP), price stability, and inflation, and find that the results are robust to the addition of these variables. Furthermore, CIM performs

142 Appendix A
well for both OEeD and non-OEeD countries, indicating that it does not simply capture the differences between developed and developing nations.4
The elM measure, thus, was considered as a monetary approximation of the security of property rights for this analysis. However, it appears that elM measures general institutional capacity of a government rather than property rights specific aspects, as the creators of the measure claim. After all, the general institutional capacity of a government is an important determinant of the development of sophisticated financial markets and institutions. These markets and institutions need to be based on prudent and effective regulation in order to be efficient and trustworthy. Thus, in this analysis, elM is utilized to measure the influence of governmental institutional capacity on environmental quality. The data for elM, in particular on M2 and the share of currency in M2, were obtained from the International Financial Statistics (IPS) of the International Monetary Fund (IMP), where they are available for a large number of countries over a significant period of time.
Democracy Political scientists have identified numerous political factors as
determinants of policy outcomes, and specifically environmental quality. As pointed out in chapter 2, one of the most prominent arguments regarding the political determinants of environmental quality concerns regime types and centralization. Accordingly, both factors have been included in the empirical analysis.
Are democracies better or worse protectors of the environment? Both sides of this debate have logical arguments in their favor. One the one side, democracies might be incapable of solving today's major environmental problems, as the cause of these problems is just the liberty awarded to selfinterested individuals to pursue their personal gain without concern for the social benefit. Individual rationality might prevent the necessary sacrifice and the solution of the associated collective action problems (Hardin, 1968; Heilbroner, 1975; Ophuls, 1977). On the other side, a higher responsiveness to public demands for a clean environment, higher degree of long-term legitimacy awarded to environmental policies, improved information flows, and a consequently more knowledgeable public might make democracies superior in solving environmental problems (Press, 1994; Passmore, 1974; Payne, 1995). Moreover, the openness of the system, which gives access to business and labor interests and therefore rise to criticism of the environmental potential of democracies, may also give access to environmental organizations. Likewise, the central role of the market system
4 Again, these results were robust to additions of measures of inflation, financial depth, population growth, trade openness, government size, and increases in human capital.

Appendix A 143
in Western democracies may provide a better foundation green consumerism and marketing.
The divergence in views arises from differing assessments of the individual's ability to decipher complex ecological problems and pursue solutions through effective participation in public affairs. Advocates of the 'authoritarian' side do not have to look far to find evidence that this ability is limited. Democracies have indeed proven unable to deal with some of the most severe environmental problems to date, and the influence of special interests on representatives is well documented. Furthermore, the long-term legitimacy allegedly awarded to environmental policies by the democratic process is not necessarily given, as the current political dynamics in the United States show. The question is, however, whether non-democratic regimes have, on average, produced superior results because of their ability to overcome the democratic collective action problems. Increasingly, better information about the state of the environment in Eastern Europe seems to suggest that that is not the case. The former socialist regimes developed environmental collective action problems of their own and left, in some instances, abhorrent environmental conditions behind. Furthermore, advocates of the 'democracy benefits environment' argument point out that environmental organizations were among the first to develop in the transition to democracy in many Eastern European states.5
Again, the debate on the environmental impacts of differences in levels of centralization in the decision-making process is closely associated with the above one. Centralists argue that centralized decision-making is better for environmental quality because it is associated with a higher potential to achieve the optimal social outcome (Heilbroner, 1975; Ophuls, 1977; McIntyre and Thornton, 1978). They base their claims on the view that a centralized decision-making process reduces the coordination difficulties between the various units, and allows more efficient gathering and distribution of information. Most importantly, centralized policies avoid competition between the various units through top-down channels. In the context of environmental standards, for instance, one concern with policy making at the state or even local level is that states or communities will try to attract business by down-competing environmental standards.
Decentralists, in contrast, argue that decision-making at lower levels and by more units is better for the environment (Press, 1994; Passmore, 1974;
5 This argument has to be taken with a grain of salt, however, since many environmental organizations developed before the transition and received part of their popularity from their unofficial status and opposition role to the socialist regime and government. It has yet to be shown how they will fare under the democratic regime in the long term, especially given the pressing economic problems, which reduce the significance of environmental problems in the minds of many people (as we know all too well from the experiences of Western environmental groups).
144 Appendix A
Schumacher, 1989; Goldsmith, 1972; Lovins, 1977). They highlight the capabilities of a decentralized systems to adjust to local needs and allow a higher level of participation. Furthermore, they blame centralization as part of the problem, as it leads to production processes and technologies beyond the control of the individual, the consequences and costs of which are rarely understood: "(oo.) the crisis owes in part to the loss of a sense of appropriate scale and meaningful purpose" (Orr and Hill, 1978: 465).
Similar to the democracy debate, a number of contributions to the decentralization argument have favored middle-of-the-road solutions, pointing out, for example, that the appropriate level of centralization is a function of the environmental issue at hand. Orr and Hill (1978), for instance, argue for selective decentralization with centralized coordination as the best political structure to promote a 'resilient society' (see also Orr, 1992). The main criticism that centralists have to face is that they assume a centralized state can cope with its own increased size and complexity, need for skill, exertion of control, and still be efficient at the management of a diverse range of tasks. Such assumptions are increasingly viewed with doubt both by scholars and practitioners, and - similar to the democracy side -de centralists are currently holding the upper hand in the debate. Decentralists, however, have yet to come up with answers to criticisms they face, such as how to avoid coordination difficulties and most of all how to ensure that competition between units will not lead to weaker environmental measures. The federal model, then, could be seen as a way to combine the advantages of centralization and decentralization, and allow the necessary flexibility in the choice of the appropriate policy strategy.
One of the greatest difficulties when it comes to empirical tests of the impact of political factors is their operationalization. How do you measure democracy? Fortunately, several data sets measuring political characteristics and recording political events have been developed in the last decades. For this specific test, data from Gurr's Polity III data set were employed. Polity III contains data on authority traits for a large number of countries between 1800 and 1987. In contrast to Gastil's Civil and Political Liberties Index, which Gastil codes on the basis of what the substance of rights seems to be in countries according to media reports, Gurr's measures of democracy and others are based on the legal provisions given in each country.
In order to assess the claims of the positive or negative influences of democracy and centralization on environmental quality, the two respective measures from the data set are employed. The democracy indicator combines ratings in four categories to compute a weighted ten point scale: competitiveness in political participation, competitiveness of executive recruitment, openness of executive recruitment, and constraints on the chief executive. Gurr bases this choice of categories on grounds that they are

Appendix A 145
'essential, interdependent elements' in contrast to 'means to, or specific manifestations of theses general principles,' such as a system of checks and balances or freedom of the press (GUIT, Jaggers, and Moore, 1991: 79).
Environmental Effort Finally, the analysis assesses the influence of the environmental effort of
government on environmental quality. While this factors was not discussed as a determinant of environmental quality that is central in the literature in chapter 2, the analyses of chapters 4 and 5 have demonstrated that a government's commitment to environmental objectives is an important determinant of environmental outcomes. In a related inquiry, this empirical analysis attempts to assess to what extent empirical evidence supports the claim that a government's environmental effort has an influence on the environmental quality achieved at a given level of development. Intuition suggests and environmental policy assumes that the environmental policy effort of a government would have a positive impact on environmental quality in a nation.
As with the political indicators discussed above, however, we return to the problem of operationalization when we want to empirically test this intuitively convincing argument. How can we compare environmental effort on a cross-national basis? While there are several possibilities to approximate governmental environmental effort, for instance in the form of environmental budgets or the signing of international environmental agreements, each of these has significant flaws. Looking at budgets does not tell us how efficiently the money is spent, or, more importantly, how much is lost to corruption. Moreover, for many nations we would have to combine federal and state if not local budgets, as environmental policies are often decided and implemented at the state or local levels, which again leads to difficulties in terms of data availability and comparability. International agreements, on the other side, are often signed for publicity reasons, while their provisions are not implemented and enforced, and therefore fail to provide a trustworthy picture as well.
For this preliminary analysis, then, date were obtained from the World Bank's coding of national environmental reports. These reports were prepared by 145 countries for the United Nations Conference on Environment and Development (UNCED, 1992). Their contents is somewhat comparable because the UN had prescribed a standard format. Furthermore, while admittedly the information in the reports is based on self-reporting, the requirement that NGOs and business representatives be part of the drafting process seems to have assured to some degree that these reports are more than governmental propaganda: "To a striking degree, they seem to reflect

146 Appendix A
real environmental conditions and issues" (Dasgupta, Moody, Roy and Wheeler, 1995: 3).
Based on these reports, Dasgupta et aL (1995) developed a set of comparative indices for the status of environmental policy and performance in the respective countries. They randomly selected 31 reports from the 145 provided to UNCED, with countries ranging from highly industrialized to extremely poor, and representing every region in the world. The authors considered the status of policy and performance in four environmental dimensions, air, water, land, and living resources, and attempted to assess the interaction between each of these and five 'active categories': Agriculture, Industry, Energy, Transport, and the Urban Sector. In order to arrive at a quantitative measure of the status and performance of environmental policy, they applied a survey with 25 questions to categorize (a) the state of environmental awareness; (b) scope of policies adopted; (c) scope of legislation enacted; (d) control mechanisms in place; and (v) the degree of success in implementation, giving 0-2 points for low, medium and high rankings. In sum, the coding provided 500 assessment scores answering each of the 25 questions for each of the 20 elements in the matrix for each UNCED report (see table AI).
Table AI. Evaluation Format Used by Dasgupta et al. Sector! Activity Agriculture Industry Energy Transport Urban
Air Water Land Living Resources
From the individual scores, the authors calculated four composite indices by adding scores within each dimension and also computed a total score for the state of environmental policy. For the empirical analysis conducted here, the significance of both the composite score in the respective dimension of the environmental indicator and the total score was tested. Given the small number of countries for which I have these data, however, the indicator could only be utilized for regressions on one measure of air quality (S02) and the three indicators of water quality.
The Control Variables In the choice of control variables, the analysis is guided by previous
research. Since Grossman and Krueger (1995, 1993), Janicke et aL (1995), and Shafik and Bandyopadhyay (1992) all found GDP per capita to be strongly related to environmental quality, the analysis controls for its influence by including the necessary GDP terms in the equation.
Appendix A 147
Furthermore, a time trend is included to reduce error from attributing improvements in environmental quality that derive from technological innovation to institutional capacity or any other of the factors under scrutiny. Finally, the analysis utilizes a measure of the mean temperature of the water in the regressions on the indicators of water quality, since temperature has a strong impact on fecal coliform counts, as well as biochemical oxygen demand and dissolved oxygen levels.6
On the one hand, it seems that there is nothing much to say about GDP per capita as a control variable, since it is such a common economic indicator. The GDP per capita data used here come from the Chain Index World Penn Tables by Summers and Heston and provide measures on per capita output in relation to a common set of international prices. On the other hand, however, books have been written about the deficiencies of per capita GDP as a measure of development. It fails, for instance, to include the informal sector or household economy and counts indicators of social problems as assets. Alternative indices including literacy rates or infant mortality have been constructed because of these deficiencies. Most importantly, should not environmental disasters, the loss of natural capital, and environmental defensive expenditures, which positively contribute to the conventional GDP measure, be deducted from our measure of per capita incomes, especially in the context of this research project? Substantial amounts of research are being pursued on such a greening of national income measures. Unfortunately, however, cross-national data for the 1970s and 1980s are not available yet. Moreover, such a change in indicators would inhibit this effort to replicate and extend the previous research on the relationship between per capita income levels and environmental quality. Therefore, establishing the true relationship between environmental quality and green per capita income levels will remain a task for future research.
In the regression analyses, up to six forms of GDP per capita are included, corresponding to the findings Grossman and Krueger, Shafik and Bandyopadhyay, and Janicke et al. that the relationship between GDP per capita and environmental quality is non-linear and depends on previous income levels as well. To capture the influence of these previous income levels, Grossman and Krueger designed a measure of 'permanent income' calculated as the average per capita income of the three previous years, which this analysis uses as well. The six GDP per capita terms are: GDP per capita, squared GDP per capita, cubed GDP per capita, permanent GDP per capita, squared permanent GDP per capita, and cubed permanent GDP per capita.
6 Grossman and Krueger use a larger set of control variables. Since this analysis concentrates on the 'within' variation, however, control variables which are constant for a specific cross-section such as locational data do not need to be included.

148 Appendix A
A.3 The Econometric Technique
The choice of estimation technique is primarily determined by the characteristics of the data in the sample, and by the assumptions we made about the relationship between the sample and the population. In this case, several of the environmental indicators allowed a panel estimation because observations cover measuring stations and countries over time. Panel data allow for different possibilities regarding varying intercepts and slopes across time and cross-sectional units. Among these models, one of the most common is based on constant slope coefficients and varying intercepts over cross-sectional units. The strength of this model is that it captures effects of omitted variables that are individual, time-invariant, i.e. constant for a given cross-sectional unit through time but varying across cross-sectional units. The variable-intercept model assumes that the effects of the omitted timeinvariant individual variables "can be absorbed into the intercept term of a regression model as a means to explicitly allow for the individual ( ... ) heterogeneity contained in the temporal cross-sectional data" (Hsiang, 1986: 26). By introducing these unit-specific variables into our panel specification, then, we are able to reduce or avoid the omitted-variable bias. In addition, there are different specifications from which to choose. The basic decision is whether to apply a fixed-effects or random-effects model to the estimation. Unfortunately, the theoretical justifications for this choice are not well established and quite controversial among econometricians. Moreover, previous research cannot offer much guidance in this choice, since Shafik and Bandyopadhyay utilized a fixed-effects model, while Grossman and Krueger chose a random-effects one. This analysis utilizes the fixed-effects model, since the arguments in its favor are more convincing.7 Many of the
7 Mundlak (1978) criticized the random-effects model for cases in which omitted variables are correlated with regressors, under which circumstances we would arrive at biased estimations. This is probably the case in these samples as the clustering of developed countries in some regions of the world and of developing countries in others causes environmental spill-overs. A fixed-effects model concentrating on within-country variance, allows, for instance, to reduce the errors from attributing S02 emissions from Germany or the European continent in general to Sweden, or from attributing pollution of the Ganges caused by India to Bangladesh. Moreover, according to Hsiang (1986), we need to be able to assume that the cross-sectional units in our sample do indeed form a random sample of members of the larger population in order to use the random-effects model, which then allows us to make general inferences from this sample to the population. While drawing inferences from the countries in our sample to the population of countries would be ideal, we cannot claim that the countries represented in our data form a random sample of the entire population of countries in the world. In most of the panels, OEeD countries are over-represented, for instance, while they are underrepresented in a few others, most notably access to safe water and sanitation. Greene (1993) presents a counter argument, however. He postulates that the use of a fixed-effects
Appendix A 149
country-specific determinants of environmental quality omitted from the model, such as the geographic conditions or population size, will correlate with some of the independent variables. Consequently, the time-invariant, cross-section specific intercepts in the fixed-effects model allow to reduce the bias resulting from the omission of these variables. In addition, trans boundary pollution, which would cause more of a problem in a randomeffects model than in a fixed-effects one, is indeed a serious problem when we look at measures of water quality in rivers, and measures of air quality. Furthermore, as pointed out above, given the prevalence of OECD countries in some of the samples (and their under-representation in a few others), it would be difficult to argue that the sample is based on a random drawing from the population of countries. Unfortunately, the choice of the fixedeffects model meant a substantial loss in efficiency of the estimates, however, because of the relatively large size of N compared to T. The coefficients are estimated using the Feasible Generalized Least Squares Estimator (FGLS) with robust standard errors based on a variance/covariance matrix of errors calculated according to Huber's (or White's) method.
In those cases in which the time series in the sample were too short, a meaningful estimation of "within" -variation was not possible. This applies to the indicators of access to safe drinking water and sanitation. In the corresponding regressions, therefore, the random effects estimator was used. Fortunately, the theoretical considerations that spoke against using a random-effects model for the indicators of air and river quality do not weigh as heavily here. Transboundary effects and environmental spillovers are not as influential in determining the level of access to safe drinking water and sanitation, as they are for explaining air and water pollution. While some influence might derive from trade or other interdependencies between countries, it will be much less significant than for levels of air and water quality.
Finally, in the case of deforestation the Ordinary Least Squares (OLS) estimator is used to estimate the regression. Given the absence of heteroskedasticity and serial correlation, the OLS estimator is BLUE. Fortunately, almost none of the samples showed significant serial correlation.8
model is appropriate in cases where the sample is exhaustive, i.e. includes the full set of countries. In contrast, he claims that it would be more appropriate to use the randomeffects model and "to view individual specific intercepts as randomly distributed across cross-sectional units if the sample is drawn from a large population" (Greene, 1993: 469).
8 The empirical analysis was further complicated, however, by the presence of strong multicollinearity in the samples. Given the presence of six GDP per capita terms this was not surprising. Unfortunately, there is no easy way of correcting for multicollinearity unless it is possible to drop the highly-correlated variables or replace them with

150 Appendix A
Using the institutional capacity equation as an example, the estimated model then is as follows:
EQit = ai + CIMitf:31 + (GDP/cap)itf:32 + (GDP/capiitf:33 + (GDP/cap)3itf:34 +
(LGDP/cap)itf:35 + (LGDP/capiitf:36 + (LGDP/cap)3itf:37 + Timetf:3s + Citf:39 +Cit
where EQ is a vector of the respective indicator of environmental quality, a is a vector of country specific intercepts, Time is a linear time trend, C is a vector of covariates (which are used for determining the characteristics of the data, such as heteroskedasticity, but dropped for the within-estimation), and Cit is the error term.
A.4 The Evidence
Institutional Capacity The results of the empirical tests of the influence of institutional capacity
(CIM) on environmental quality generally indicated a positive relationship, as the analyses in chapters 4 and 5 would have suggested. The relationship between the measure of institutional capacity and environmental quality follows the expected form and is significant for eight of the eleven indicators of environmental quality. Institutional capacity is positively related to access to rural and urban sanitation and safe drinking water, as well as oxygen levels in rivers, and negatively related to most forms of environmental pollution tested: smoke, S02, and BOD. Most importantly, in most of these
instruments that capture the intended aspect but are less strongly correlated with the other regressors (a concept which can only work in the rarest of cases). In other cases, conducting a log operation on the variables in the analysis will reduce the collinearity. Obviously, I did not have an instrument which I could substitute for the various GDP terms, and did not want to drop the terms permanently, since they had been found to be significant by Grossman and Krueger, and Shafik and Bandyopadhyay. Furthermore, a log operation did not work in this case, since taking a log on the squared and cubed GDP terms would only have turned the high collinearity into perfect collinearity. Grossman and Krueger dealt with the multicollinearity by avoiding interpreting the individual coefficients estimated, and instead tested the joint significance of the GDP terms. Similarly, I handled the problems in two ways. First, I estimated each regression with the institutional capacity measure and the time trend and one of the GDP terms at a time. This gave me an idea of which of the GDP terms was more significant while at the same time providing me with an estimate of the significance of the institutional capacity variable, which is not that strongly correlated with the GDP terms as to render my results invalid. Secondly, I estimated each panel with all of the GDP terms as well as the elM measure and the time trend, after which I tested the significance of the elM measure and the joint significance of the GDP terms individually and jointly, in order to assess whether the elM measure added to the explanatory power of the model.
Appendix A 151
regressions the institutional capacity variable is as significant or even more significant than the GDP terms.
Sulfur Dioxide In the case of S02, the coefficient on the eIM variable is significant and
as pointed out above by being negative has the expected sign (see Table A2). In other words, improvements in the institutional capacity of government mean lower levels of S02. The coefficient is not as significant as the GDP terms and does not increase the joint significance of those terms. With an R2 of .77, the model also explains a substantial share of the variance in S02 levels in the sample. S02 emissions from power plants and other industrial processes, thus appear to decrease with the increasing institutional capacity of government. With respect to the other independent variables, the GDP terms are strongly significant, in the individual regressions as well as jointly in the complete model. The coefficient on the time trend has a negative sign and is marginally significant, indicating that at any given income level S02 levels have on average been decreasing over the years.
Smoke Similarly, the relationship between institutional capacity and
environmental quality takes on the expected form in the case of smoke suggesting that emissions of light particulate matter decrease with improvements in institutional capacity. The coefficient on the eIM variable is negative, implying that a better institutional capacity means lower levels of smoke (see Table A3). Furthermore, the coefficient is strongly significant, and improves the joint significance of the GDP terms when added to the test. With an R2 of .83 (adjusted R2 .79), the model again explains a large share of the variance in levels of smoke in the sample. In contrast to the eIM measure, the GDP terms are not significant in the individual regressions and only marginally significant in the complete model. Furthermore, the time trend is positively related to level of smoke, i.e. at any given level of institutional capacity and per capita incomes, smoke has increased during the time range in the sample.
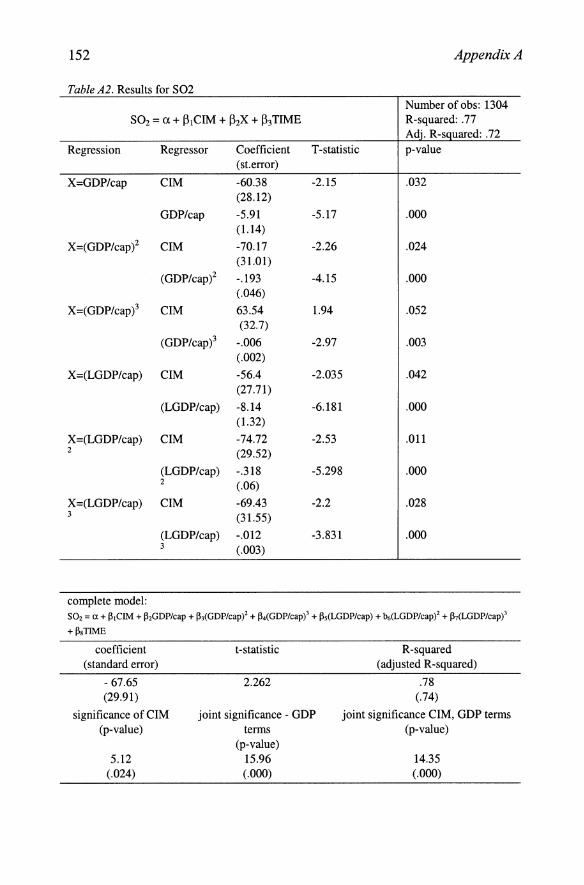
152 Appendix A
Table A2. Results for S02 Number of obs: 1304
S02 = a + /3ICIM + /32X + /33TIME R-squared: .77 Adj. R-squared: .72
Regression Regressor Coefficient T -statistic p-value (st.error)
X=GDP/cap CIM -60.38 -2.15 .032 (28.12)
GDP/cap -5.91 -5.17 .000 (1.14)
X=(GDP/capi CIM -70.17 -2.26 .024 (31.01)
(GDP/capi -.193 -4.15 .000 (.046)
X=(GDP/cap)3 CIM 63.54 1.94 .052 (32.7)
(GDP/cap)3 -.006 -2.97 .003 (.002)
X=(LGDP/cap) CIM -56.4 -2.035 .042 (27.71)
(LGDP/cap) -8.14 -6.181 .000 (1.32)
X=(LGDP/cap) CIM -74.72 -2.53 .011 2 (29.52)
(LGDP/cap) -.318 -5.298 .000 2 (.06)
X=(LGDP/cap) CIM -69.43 -2.2 .028 3 (31.55)
(LGDP/cap) -.012 -3.831 .000 3 (.003)
complete model: S02 = a + IltCIM + ~2GDP/cap + ~3(GDP/cap)2 + ~4(GDP/cap)3 + ~s(LGDP/cap) + b6(LGDP/cap)2 + ~7(LGDP/cap)3
+~8TIME
coefficient (standard error)
- 67.65 (29.91)
significance of CIM (p-value)
5.12 (.024)
t -statistic
2.262
joint significance - GDP terms
(p-value) 15.96 (.000)
R-squared (adjusted R-squared)
.78 (.74)
joint significance CIM, GDP terms (p-value)
14.35 (.000)
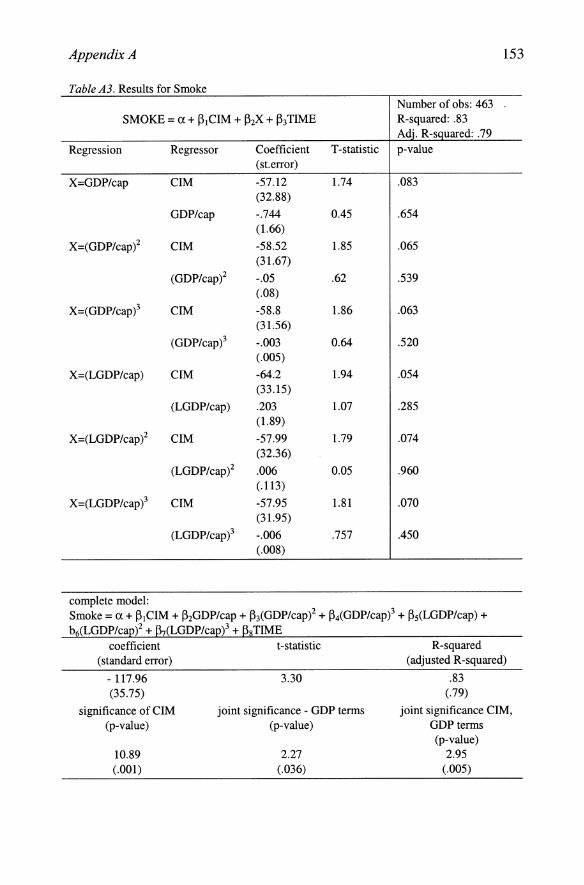
Appendix A 153
Table A3. Results for Smoke Number of obs: 463
SMOKE = a + ~lCIM + ~2X + ~3 TIME R-squared: .83 Adj. R-squared: .79
Regression Regressor Coefficient T -statistic p-value (st.error)
X=GDP/cap CIM -57.12 1.74 .083 (32.88)
GDP/cap -.744 0.45 .654 (1.66)
X=(GDP/cap)2 CIM -58.52 1.85 .065 (31.67)
(GDP/cap)2 -.05 .62 .539 (.08)
X=(GDP/cap)3 CIM -58.8 1.86 .063 (31.56)
(GDP/cap)3 -.003 0.64 .520 (.005)
X=(LGDP/cap) CIM -64.2 1.94 .054 (33.15)
(LGDP/cap) .203 1.07 .285 (1.89)
X=(LGDP/cap )2 CIM -57.99 1.79 .074 (32.36)
(LGDP/cap)2 .006 0.05 .960 (.113)
X=(LGDP/cap )3 CIM -57.95 1.81 .070 (31.95)
(LGDP/cap)3 -.006 .757 .450 (.008)
complete model: Smoke = a + ~lCIM + ~2GDP/cap + ~3(GDP/cap)2 + ~4(GDP/cap)3 + ~5(LGDP/cap) + b6(LGDP/cap)2 + ~7(LGDP/cap)3 + Ps TIME
coefficient t -statistic (standard error)
- 117.96 (35.75)
significance of CIM (p-value)
10.89 (.001)
3.30
joint significance - GDP terms (p-value)
2.27 (.036)
R-squared (adjusted R-squared)
.83 (.79)
joint significance CIM, GDP terms (p-value)
2.95 (.005)
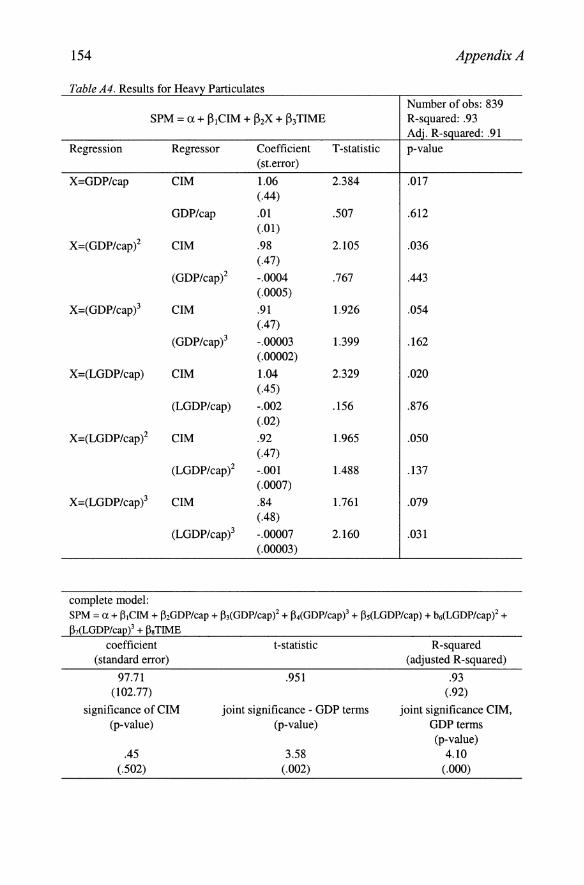
154 Appendix A
Table A4. Results for Heavy Particulates Number of obs: 839
SPM = a + i31CIM + i32X + i33TIME R-squared: .93 Adj. R-squared: .91
Regression Regressor Coefficient T -statistic p-value (st.error)
X=GDP/cap CIM 1.06 2.384 .017 (.44)
GDP/cap .01 .507 .612 (.01)
X=(GDP/cap)2 CIM .98 2.105 .036 (.47)
(GDP/capi -.0004 .767 .443 (.0005)
X=(GDP/cap)3 CIM .91 1.926 .054 (.47)
(GDP/cap)3 -.00003 1.399 .162 (.00002)
X=(LGDP/cap) CIM 1.04 2.329 .020 (.45)
(LGDP/cap) -.002 .156 .876 (.02)
X=(LGDP/cap )2 CIM .92 1.965 .050 (.47)
(LGDP/cap)2 -.001 1.488 .137 (.0007)
X=(LGDP/cap )3 CIM .84 1.761 .079 (.48)
(LGDP/cap)3 -.00007 2.160 .031 (.00003)
complete model: SPM = a + ~ICIM + ~2GDP/cap + MGDP/cap)2 + ~4(GDP/cap)3 + ~s(LGDP/cap) + b6(LGDP/cap)2 + @7(LGDP/cap)3 + ~8 TIME
coefficient (standard error)
97.71 (102.77)
significance of CIM (p-value)
.45 (.502)
t -statistic
.951
joint significance - GDP terms (p-value)
3.58 (.002)
R-squared (adjusted R-squared)
.93 (.92)
joint significance CIM, GDPterrns (p-value)
4.10 (.000)

Appendix A 155
Heavy Particulates For heavy particulate matter the coefficient on the CIM measure has a
positive sign, however, suggesting a positive association between institutional capacity and pollution (see Table A4). It is only marginally significant in the individual regressions, and adds only slightly to the joint significance of the GDP terms in the complete model, but that does not change the results regarding the form of the relationship. One can therefore only posit that assurance of institutional capacity positively influences some sources of particulate matter but not others. The GDP terms, at the same time, are significant in the complete model, while the coefficient on the time trend is negative as in the case of S02. Over the years, pollution by heavy particulate matter has improved at given levels of institutional capacity and per capita incomes.
Biochemical Oxygen Demand For BOD, the coefficient on the institutional capacity measure has the
expected negative sign attesting that an improvement in institutional capacity will lead to lower levels of BOD (see Table A5). Furthermore, the coefficient is statistically significant, in fact more significant than the individual or joint GDP terms, and adds substantially to their joint significance in the complete model. The results suggest, then, that water pollution leading to increasing consumption of oxygen falls with increasing institutional capacity. Again, with an R2 of .74 (adjusted R2 of .68), the model explains a substantial share of the variance of BOD levels in the sample. In terms of the other independent variables, I find that mean temperature is positively related to BOD, which makes intuitive sense, but not significant. Similarly, the coefficient on the time trend is positive, i.e. BOD levels have risen at any given level of institutional capacity and income over the period in the sample, but is not significant.
Dissolved Oxygen Again, the positive coefficient on the CIM measure reflects the
improvement in D02 that is associated with improvements in institutional capacity (see Table A6).
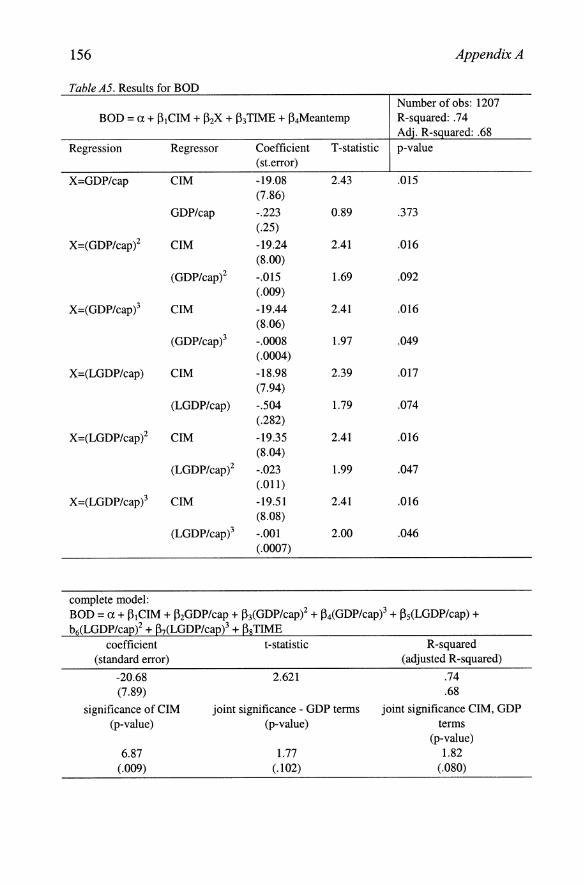
156 Appendix A
Table A5. Results for BOD Number of obs: 1207
BOD = a + 13 1ClM + 132X + 133TIME + 134Meantemp R-squared: .74 Ad·. R-s uared: .68
Regression Regressor Coefficient T -statistic p-value (st.error)
X=GDP/cap ClM -19.08 2.43 .015 (7.86)
GDP/cap -.223 0.89 .373 (.25)
X=(GDP/cap)2 ClM -19.24 2.41 .016 (8.00)
(GDP/capi -.015 1.69 .092 (.009)
X=(GDP/cap)3 ClM -19.44 2.41 .016 (8.06)
(GDP/cap)3 -.0008 1.97 .049 (.0004)
X=(LGDP/cap) ClM -18.98 2.39 .017 (7.94)
(LGDP/cap) -.504 1.79 .074 (.282)
X=(LGDP/cap )2 ClM -19.35 2.41 .016 (8.04)
(LGDPlcap)2 -.023 1.99 .047 (.011)
X=(LGDP/cap )3 ClM -19.51 2.41 .016 (8.08)
(LGDP/cap)3 -.001 2.00 .046 (.0007)
complete model: BOD = a + 13 1CIM + 132GDP/cap + 133(GDP/cap)2 + 134(GDP/cap)3 + I3s(LGDP/cap) + b6(LGDP/cap)2 + Bz(LGDP/cap)3 + Bs TIME
coefficient t-statistic (standard error)
-20.68 (7.89)
significance of ClM (p-value)
6.87 (.009)
2.621
joint significance - GDP terms (p-value)
1.77 (.102)
R-squared (adjusted R-squared)
.74
.68
joint significance ClM, GDP terms
(p-value) 1.82
(.080)
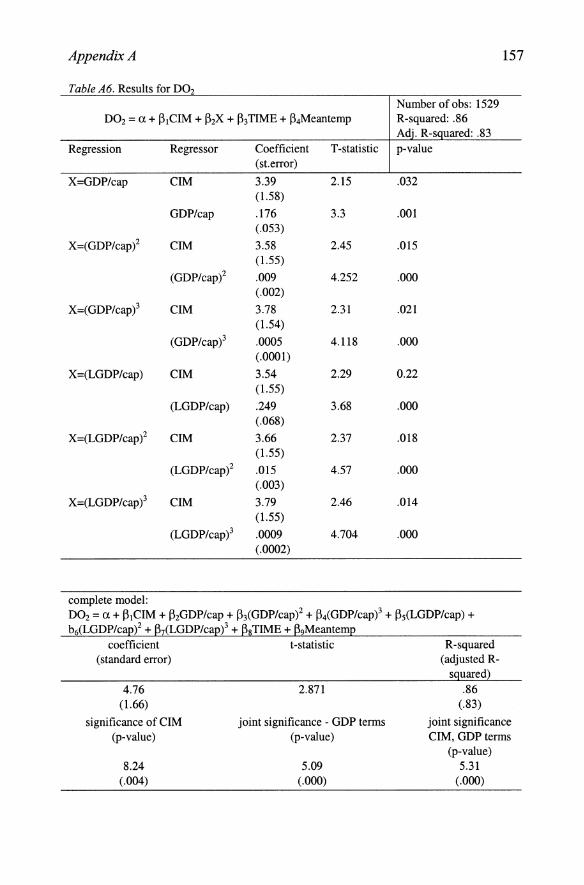
Appendix A 157
Table A6. Results for D02 Number of obs: 1529
D02 = a + 131CIM + 132X + 133TIME + 134Meantemp R-squared: .86 Ad·. R-s uared: .83
Regression Regressor Coefficient T -statistic p-value (st.error)
X=GDP/cap CIM 3.39 2.15 .032 (1.58)
GDP/cap .176 3.3 .001 (.053)
X=(GDP/cap)2 CIM 3.58 2.45 .015 (1.55)
(GDP/cap)2 .009 4.252 .000 (.002)
X=(GDP/cap)3 CIM 3.78 2.31 .021 (1.54)
(GDP/cap)3 .0005 4.118 .000 (.0001)
X=(LGDP/cap) CIM 3.54 2.29 0.22 (1.55)
(LGDP/cap) .249 3.68 .000 (.068)
X=(LGDP/cap )2 CIM 3.66 2.37 .018 (1.55)
(LGDP/cap)2 .015 4.57 .000 (.003)
X=(LGDP/cap )3 CIM 3.79 2.46 .014 (1.55)
(LGDP/capi .0009 4.704 .000 (.0002)
complete model: D02 = a + 131CIM + 132GDP/cap + 133(GDP/cap)2 + l3iGDP/cap)3 + I3s(LGDP/cap) + MLGDP/cap)2 + 137(LGDP/capi + I3sTIME + P9Meantemp
coefficient t -statistic (standard error)
4.76 (1.66)
significance of CIM (p-value)
8.24 (.004)
2.871
joint significance - GDP terms (p-value)
5.09 (.000)
R-squared (adjusted R
sguared) .86
(.83)
joint significance CIM, GDP terms
(p-value) 5.31
(.000)
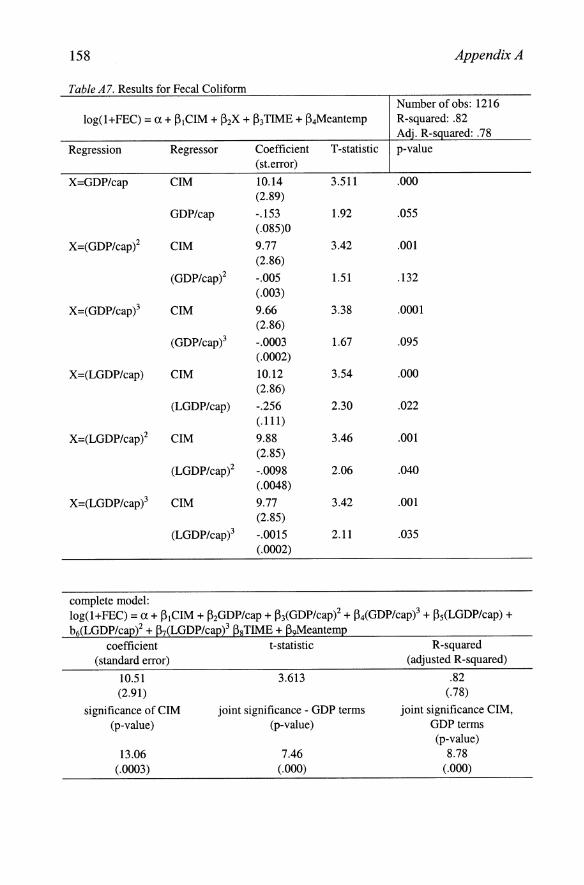
158 Appendix A
Table A7. Results for Fecal Coliform Number of obs: 1216
log(1+FEC) = a + B1CIM + B2X + B3TIME + B4Meantemp R-squared: .82 Ad'. R-s uared: .78
Regression Regressor Coefficient T -statistic p-value (st.error)
X=GDP/cap CIM 10.14 3.511 .000 (2.89)
GDP/cap -.153 1.92 .055 (.085)0
X=(GDP/cap)2 CIM 9.77 3.42 .001 (2.86)
(GDP/cap)2 -.005 1.51 .132 (.003)
X=(GDP/cap)3 CIM 9.66 3.38 .0001 (2.86)
(GDP/cap)3 -.0003 1.67 .095 (.0002)
X=(LGDP/cap) CIM 10.12 3.54 .000 (2.86)
(LGDP/cap) -.256 2.30 .022 (.111)
X=(LGDP/cap )2 CIM 9.88 3.46 .001 (2.85)
(LGDP/cap)2 -.0098 2.06 .040 (.0048)
X=(LGDP/cap)3 CIM 9.77 3.42 .001 (2.85)
(LGDP/cap)3 -.0015 2.11 .035 (.0002)
complete model: log(1 +FEC) = a + B1CIM + B2GDP/cap + B3(GDP/cap)2 + BiGDP/cap)3 + Bs(LGDP/cap) + b6(LGDP/cap)2 + r:h(LGDP/cap)3 Bs TIME + B9Meantemp
coefficient t -statistic (standard error)
10.51 (2.91)
significance of CIM (p-value)
13.06 (.0003)
3.613
joint significance - GDP terms (p-value)
7.46 (.000)
R-squared (adjusted R-squared)
.82 (.78)
joint significance CIM, GDP terms (p-value)
8.78 (.000)
Appendix A 159
The relationship is statistically significant, although it only slightly improves the joint significance of the GDP terms when added in the test (the GDP terms are strongly significant). The R2 of .86 (adjusted R2 .83) further supports the strength of the model. Similar to the results for BOD, the results for D02, then, suggest that water pollution, resulting in higher oxygen consumption by bacteria and excess algae growth and lower levels of dissolved oxygen, falls with improvements in institutional capacity. Again, the negative coefficient on mean water temperatures also delineates the expected relationship; as water temperature goes up, oxygen levels go down. This dynamic can easily be explained with the biochemical effects of increases in water temperature: higher temperatures mean more algae and bacterial growth and generally a lower capability of the water to hold oxygen. The coefficient on the time trend is negative as well reflecting an overall worsening of D02 levels.
Fecal Coliform Fecal coliform counts also form an indicator of water quality in rivers for
which improvements in institutional capacity appear to lead to improvements in environmental quality (see Table A7). The sign of the coefficient for institutional capacity is negative, suggesting that environmental quality improves with improvements in institutional capacity. The results suggest, then, that water pollution from the untreated discharge of human and animal waste decreases with improvements in institutional capacity. The coefficient is significant at the 0.5 level, but does not add to the joint significance of the GDP terms in the complete model. The GDP terms individually fail to show strong significance, but are jointly significant in the complete model. Again, mean water temperature is positively related to pollution levels, as could be expected, but not significant. Finally, the coefficient on the time trend is positive and strongly significant denoting an overall worsening of water quality in terms of fecal coliform counts at any given level of institutional capacity or income over the period of the sample.
Access to Safe Drinking Water The results for urban and rural access to safe drinking water indicate a
positive relationship between institutional capacity and environmental quality (see Tables A8 and A9). The coefficient on the elM measure is positive and significant. Improvements in institutional capacity lead to access to safe drinking water for larger shares of both urban and rural populations. Interestingly, institutional capacity appears to have slightly more explanatory power for urban rather than rural conditions. Furthermore,
9 As pointed out above, the results reported here pertain to the estimation of the random effects model. For the results of the fixed-effects estimations see Appendix B.

160 Appendix A
the elM variable is statistically as significant as the GDP terms, and substantially improves their joint significance in the complete model. As could be expected, the time trend is positively related to access to drinking water implying an improvement in conditions at any given level of institutional capacity and incomes over time. Interestingly, it is much more strongly significant in the regression for rural than for urban access.
Access to Sanitation Again, for both urban and rural access to sanitation, the regression
estimates show a positive relationship between the elM measure and environmental quality (see Tables AlO and All). Moreover, the elM measure is statistically significant in the individual regressions as well as in the complete model. In addition, institutional capacity substantially improves the joint significance of the explanatory variables. The time trend is also positively related to urban and rural access to sanitation, although for rural access it is not significant. Finally the GDP terms are significant, with lagged per capita GDP performing best in the individual regressions, implying maybe a delay in the response between rising income levels and the provision of sanitation services.
Deforestation In the case of deforestation, the regression results show no evidence that
institutional capacity is positively associated with environmental quality as indicated by decreases in deforestation (see Table A12). Not only is the coefficient for institutional capacity not significant, but it is positive, and does not add to the joint significance of the GDP terms in the model. The R2 is correspondingly low, with the model explaining only .23 of the variance in annual percentages of deforestation in the sample. The GDP terms, in contrast, are significant individually as well as jointly in the complete model, and a time trend, of course, was not included, since the data contained only one observation per country.

Appendix A 161
Table AB. Results for Rural Access to Safe Drinkin Water model: random effects Number of obs: 289
Rural access to Safe Drinking Water = 131CIM + 132X + R-squared: .70 TIME
Regression Regressor Coefficient T -statistic p-value (st.error)
X=GDP/cap CIM 25.65 1.966 .049 (13.05)
GDPlcap 3.89 9.175 .000 (.424)
X=(GDP/cap)z CIM 54.71 4.019 .000 (13.61)
(GDP/cap)2 .091 4.539 .000 (.020)
X=(GDP/cap)3 CIM 63.20 4.577 .000 (13.81)
(GDP/cap)3 .001 1.820 .069 (.0007)
X=(LGDP/cap) CIM 16.15 1.273 .203 (12.68)
(LGDP/cap) 4.90 10.601 .000 (.462)
X=(LGDP/cap )2 CIM 38.34 2.923 .003 (13.12)
(LGDP/cap) .228 7.628 .000 Z (.030)
X=(LGDP/cap )3 CIM 51.46 3.825 .000 (13.45)
(LGDP/cap) .009 5.284 .000 3 (.002)
complete model: rur.wat. = 131CIM + 13zGDP/cap + 133(GDP/capf + 13iGDP/cap)3 + 13s(LGDP/cap) + MLGDP/cap)2 + IYLGDP/cap)3 + BsTIME
coefficient (standard error)
2.56 (13.08)
significance of CIM (p-value)
.04 (.833)
t -statistic
.211
joint significance - GDP terms (p-value)
142.35 (.000)
R-squared within R-squared between
.28
.70
joint significance CIM, GDP terms (p-value)
196.99 (.000)
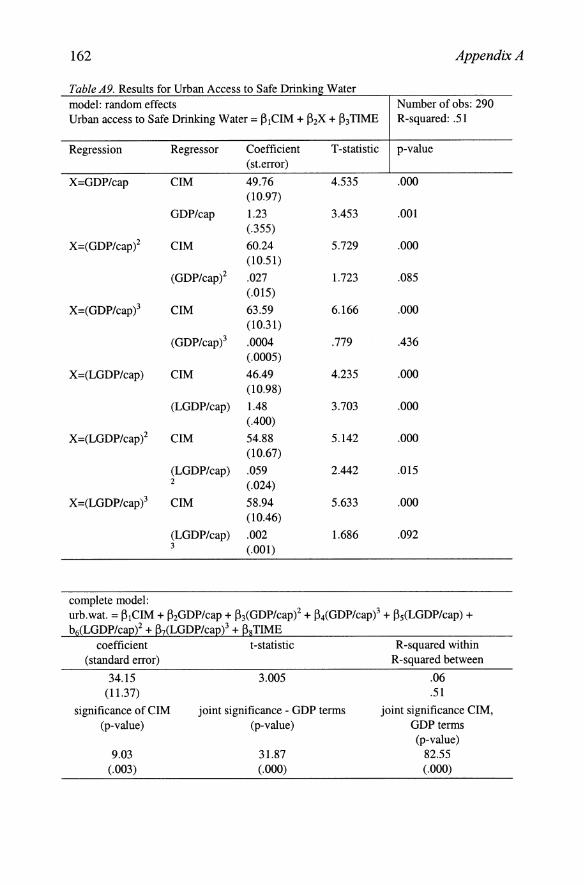
162 Appendix A
Table A9. Results for Urban Access to Safe Drinkin Water model: random effects Number of obs: 290 Urban access to Safe Drinking Water = P1CIM + P2X + P3TIME R-squared: .51
Regression Regressor Coefficient T -statistic p-value (st.error)
X=GDP/cap CIM 49.76 4.535 .000 (10.97)
GDP/cap 1.23 3.453 .001 (.355)
X=(GDP/cap)2 CIM 60.24 5.729 .000 (10.51)
(GDP/cap)2 .027 1.723 .085 (.015)
X=(GDP/cap)3 CIM 63.59 6.166 .000 (10.31)
(GDP/cap)3 .0004 .779 .436 (.0005)
X=(LGDP/cap) CIM 46.49 4.235 .000 (10.98)
(LGDP/cap) 1.48 3.703 .000 (.400)
X=(LGDP/cap )2 CIM 54.88 5.142 .000 (10.67)
(LGDP/cap) .059 2.442 .015 2 (.024)
X=(LGDP/cap )3 CIM 58.94 5.633 .000 (10.46)
(LGDP/cap) .002 1.686 .092 3 (.001)
complete model: urb.wat. = P1CIM + P2GDP/cap + P3(GDP/cap)2 + P4(GDP/cap)3 + P5(LGDP/cap) + MLGDP/cap)2 + P7(LGDP/cap)3 + PgTIME
coefficient t-statistic (standard error)
34.15 (11.37)
significance of CIM (p-value)
9.03 (.003)
3.005
joint significance - GDP terms (p-value)
31.87 (.000)
R-squared within R-squared between
.06
.51
joint significance CIM, GDP terms (p-value)
82.55 (.000)
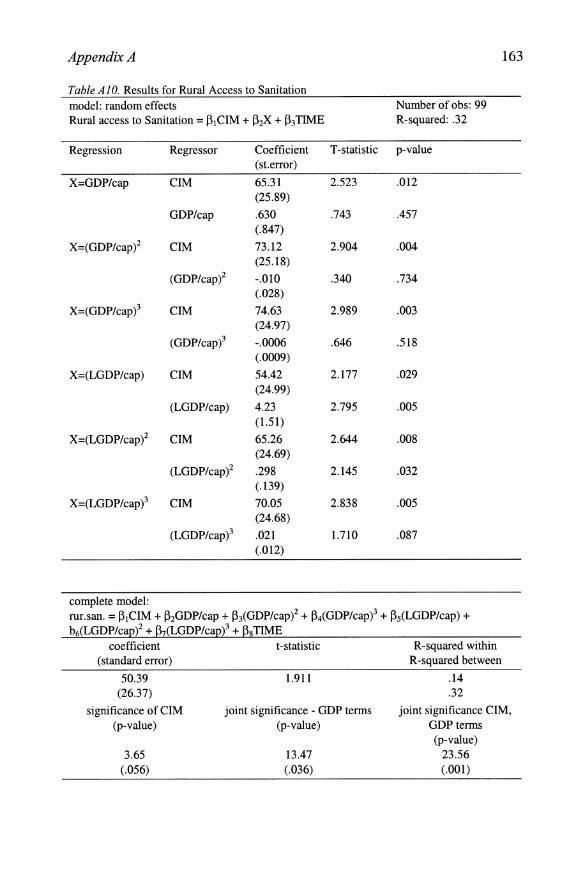
Appendix A 163
Table Al O. Results for Rural Access to Sanitation model: random effects Number of obs: 99 Rural access to Sanitation = 131CIM + 132X + 133TIME R-squared: .32
Regression Regressor Coefficient T -statistic p-value (st.error)
X=GDP/cap CIM 65.31 2.523 .012 (25.89)
GDPlcap .630 .743 .457 (.847)
X=(GDP/cap)2 CIM 73.12 2.904 .004 (25.18)
(GDP/capi -.010 .340 .734 (.028)
X=(GDP/cap)3 CIM 74.63 2.989 .003 (24.97)
(GDP/cap)3 -.0006 .646 .518 (.0009)
X=(LGDP/cap) CIM 54.42 2.177 .029 (24.99)
(LGDP/cap) 4.23 2.795 .005 (1.51)
X=(LGDP/capi CIM 65.26 2.644 .008 (24.69)
(LGDP/cap)2 .298 2.145 .032 (.139)
X=(LGDP/cap )3 CIM 70.05 2.838 .005 (24.68)
(LGDP/cap)3 .021 1.710 .087 (.012)
complete model: rur.san. = 131CIM + 132GDP/cap + 133(GDP/cap)2 + 134(GDP/cap)3 + 135(LGDP/cap) + b6(LGDP/cap)2 + P7(LGDP/cap)3 + Ps TIME
coefficient t -statistic (standard error)
50.39 (26.37)
significance of CIM (p-value)
3.65 (.056)
1.911
joint significance - GDP terms (p-value)
13.47 (.036)
R-squared within R-squared between
.14
.32
joint significance CIM, GDP terms (p-value)
23.56 (.001)

164 Appendix A
Table Al I. Results for Urban Access to Sanitation model: random effects Number of obs: 111
Urban access to Sanitation = f31CIM + f32X + f33TlME R-squared: .35
Regression Regressor Coefficient T -statistic p-value (st.error)
X=GDP/cap ClM 60.77 2.741 .006 (22.17)
GDP/cap 1.72 2.390 .017 (.72)
X=(GDP/cap)2 ClM 72.18 3.295 .001 (21.90)
(GDP/cap)2 .031 1.232 .218 (.025)
X=(GDP/cap)3 ClM 59.29 2.815 .006 (21.06)
(GDP/cap)3 .001 .948 .345 (.001)
X=(LGDP/cap) ClM 50.06 2.249 .025 (22.26)
(LGDP/cap) 4.23 3.345 .001 (1.27)
X=(LGDP/cap) ClM 64.60 2.933 .003 2 (22.03)
(LGDP!cap) .269 2.337 .019 2 (.115)
X=(LGDP/cap) ClM 74.18 3.393 .001 3 (21.86)
(LGDP/cap) .0007 .898 .369 3 (.0008)
complete model: urb.san. = f31ClM + f32GDP/cap + f3iGDP/cap)2 + f34(GDP/cap)3 + f3s(LGDP/cap) + b6(LGDP/capi + @z(LGDP/cap)3 + @8TlME
coefficient t-statistic (standard error)
33.6 (23.83)
significance of ClM (p-value)
1.99 (.159)
1.410
joint significance - GDP terms (p-value)
18.43 (.005)
R-squared within R-squared between
.18
.35
joint significance CIM, GDPterms (p-value)
31.27 (.000)

Appendix A 165
Table Al 2. Results for Deforestation Number of obs: 82
deforestation = a + P1CIM + P2X + P3TIME R-squared: .23
Regression Regressor Coefficient T -statistic p-value (st.error)
X=GDP/cap CIM 1.83 1.885 .063 (.97)
GDP/cap -.15 4.689 .000 (.03)
X=(GDP/capi CIM 1.07 1.149 .254 (.93)
(GDP/cap)2 -.01 4.145 .000 (.002)
X=(GDP/cap)3 CIM .56 .605 .547 (.92)
(GDP/cap)3 -.001 3.489 .001 (.0001)
X=(LGDP/cap) CIM 1.82 1.863 .066 (.98)
(LGDP/cap) -.16 4.608 .000 (.03)
X=(LGDP/cap )2 CIM 1.09 1.164 .248 (.93)
(LGDP/capi -.01 4.115 .000 (.002)
X=(LGDP/capi CIM .59 .641 .523 (.92)
(LGDP/cap)3 -.001 3.505 .0001 (.0002)
complete model: deforestation = a + P1CIM + P2GDP/cap + P3(GDP/cap)2 + P4(GDP/cap)3 + P5(LGDP/cap) + b6(LGDP/capi + @z(LGDP/cap)3 + @8TIME
coefficient t-statistic (standard error)
1.91 (.93)
significance of CIM (p-value)
1.64 (.201)
2.049
joint significance - GDP terms (p-value)
2.74 (.004)
R-squared (adjusted R-squared)
.28 (.21)
joint significance CIM, GDPterms (p-value)
2.43 (.007)

166 Appendix A
Democracy and Centralization The empirical analyses of the influence of democracy and centralization
on environmental quality show why the different parties in the democracy and centralization debates all have been able to find some evidence for their claims. At the same time, they highlight that maybe none of these claims can be empirically supported across a range of environmental dimensions and cases. For both regime type and levels of centralization, the influence on environmental quality can be positive or negative depending on the indicator. More importantly, in most cases neither of the indicators is statistically significant. In a few cases, however, the indicators are significant, in some even more significant than institutional capacity. In sum, we find an erratic picture that brings up more questions than it answers.
Table A13 Results for Democrac~ and Centralization Environ. Democracy p- adds to joint Centrali p-value adds to joint Indicator value significance -zation significance
S02 2.54 .005 .I. -9.07 . 004 .I . SPM -.025 .096 + -.064 .289 + smoke 1.06 .040 .I. -11.23 .0003 .I . BOD -.037 .696 + -.485 .454 + D02 -.017 .357 .I. .333 . 259 .I . fec.coliform -.109 .023 .I. -.421 .298 .I. rural water -.056 .898 + -4.21 .147 + urban water .402 .250 + 1.06 .652 + rural sanit. -1.31 .205 .I. -3.17 .578 .I . urban sanit. .189 .823 .I. -5.61 .263 .I . deforestation .072 .181 + -.465 . 033 +
The democracy indicator is individually significant only for S02, fecal coliform levels, and smoke. In the cases of access to water, SPM, BOD, and deforestation, it adds to the joint significance of the explanatory variables, which highlights multicollinearity problems in the data. While the indicator is more significant than institutional capacity in the case of SPM, this finding is not surprising given the bad performance of institutional capacity in this specific instance. The relationship between democracy and environmental quality according to the empirical findings is slightly more positive (for urban access to safe drinking water and sanitation, D02, S02, smoke, and deforestation) than negative (for rural access to drinking water and sanitation, SPM, BOD, and fecal coliform) with the statistically most significant coefficient (S02) being positive, and the statistically second most significant coefficient (fecal coliform) being negative. As pointed out above, we find an erratic pattern that casts doubt even on the significance of (the measured characteristics of) government regimes for the few indicators of environmental quality for which the results identified a significant causal relationship.

Appendix A 167
A similar failure to convincingly identify a statistically significant influence on environmental quality applies to the indicator of centralization. While the coefficient on centralization is strongly significant for smoke and S02, it is not significant for the majority of indicators. According to the sign on the coefficient in the different regressions, the relationship between levels of centralization and environmental quality is mostly negative, implying that decentralization is associated with improved environmental quality. This relationship can be identified for rural access to drinking water, access to sanitation, S02, SPM smoke, BOD, D02, and fecal coliform. The only case in which decentralization appears to lead to a worsening of environmental quality is urban access to safe drinking water. As pointed out above, however, the vast majority of these relationships is not statistically significant, so that we cannot place much confidence in these interpretations. Yet importantly, the relationship is negative for the statistically significant cases S02 and smoke, implying that the decentralists might have an edge over the centralists.
One hope for participants in these debates arising from the rather ambiguous and disappointing results, however, is that the addition of indicators of regime types and levels of centralization significantly improves the R2 in many of the regressions. Together, then, these indicators hold some explanatory power. An implication of the findings, therefore, might be that we need to move to more differentiated and sophisticated analyses of the interactive dynamics between regime types, levels of centralization, and environmental quality. Thus, one might first have to look at the distribution of cost and benefits of the actions necessary for environmental improvement, as well as the associated transaction cost in order to answer the question whether a democratic or an authoritarian regime is better for environmental quality. If the costs for most members of society are significant either financially or in terms of requiring a change in deeply ingrained habits, an authoritarian government might accomplish an environmental policy objective faster than a democratic one. On the other side, if the costs of environmental actions fall only on a few big manufacturers, for instance, and public pressure is sufficiently high, one might achieve more momentum in a democratic political system than from a government structure not as responsive to public demands.
Environmental Effort The empirical evidence for the influence of governmental environmental
effort on environmental quality is ambiguous at best. The indicators of environmental effort are individually significant only in the cases of S02 and urban access to safe drinking water. The high correlation between the indices and per capita GDP, however, might blur the underlying relationships. In

168 Appendix A
spite of the lack of individual significance, the overall environmental effort measure does add substantially to the significance of the complete model in five of the nine regressions (four of the five regressions for the dimensionspecific ones respectively). Again, the small number of observations in most of the samples requires us to be careful when drawing conclusions from these results.
Table Al 4. Results for Governmental Environmental Effort Environ. air!water! p-value adds to joint environmental p- adds to Indicator liv. signif. effort value joint
resources signif. S02 2.69 .000 + .785 .000 + BOD .054 .532 .I. .011 .63 + D02 -.002 .897 + -.002 .62 + fec.coliform -.059 .094 + -.017 .093 .I. rural water nla nla nla -.051 .586 .I . urban water nla nla nla . 227 .007 + rural sanit. nla nla nla .068 . 797 .I . urban sanit. nla nla nla .218 .181 .I. deforestation .0008 .960 + .0009 .801 +
The sign of the coefficient of the effort measure is counter-intuitive in many of the regressions, indicating that a higher score in terms of effort is associated with lower environmental quality. This finding suggests that the relationship we are capturing might have the wrong causal direction: environmental effort may be high in cases where environmental quality is bad, and government intervention is especially necessary. Unfortunately, cross-sections, in contrast to data sets including a time series aspect, do not allow to test for temporal sequence.
A.S. Discussion
Due to the conflicting results on the influence of democracy and centralization on environmental quality, and the potentially simple explanation of the counter-intuitive findings on the influence of environmental effort, this discussion will concentrate on the empirical results with respect to institutional capacity. Overall, the empirical results are supportive of the positive influence of institutional capacity on environmental quality, both in terms of direction and significance. For the majority of indicators, the empirical evidence strongly indicates that institutional capacity leads to improvements in environmental quality. While per capita income levels are generally also statistically significant - thus attesting to the overall congruence of the results with the findings of previous research - in most cases institutional capacity is more strongly

Appendix A 169
related to environmental quality. This result is fascinating, since previous research had failed to find any political or economic factor to have a stronger influence on environmental quality than per capita income levels. Moreover, cases in which the results fail to show a positive influence of institutional capacity can be explained, if we consider interactive dynamics between capacity, development, and the specific indicator of environmental quality. Only the case of fecal coliform confounds the analysis, if we remind ourselves that the cross-sectional analysis of deforestation is not commensurate with the analyses of the variation within cross-sectional units of the other environmental indicators. In sum, these fmdings show that improvements in institutional capacity can be linked to improvements in environmental quality in terms of air and water quality, as well as access to drinking water and sanitation.
Interestingly, the evidence is particularly strong for the environmental quality of traditional open-access resources such as air and river water. The cases of S02, smoke, BOD, and D02, all show that improvements in institutional capacity translate into improvements in environmental quality. This pattern may be a function of regulatory capacity with respect to the environment. It may also be caused by "private" or political action, or economic incentives. One possible incentive can derive from public pressure in terms of consumer demand. Thus, chemical companies along the Rhine valley had to invest substantial resources into cleaner technology after several accidents lead to highly visible consequences in the form of massive fish dying, to avoid further public scrutiny. Pressure for improvements in environmental quality which are based on individual incentives might also be channelled through the political process, and result in the imposition of more stringent environmental regulation or the establishment of private incentives for polluters.
The counter case, i.e. the failure of institutional capacity to lead to improvements in environmental quality in the case of heavy particulate matter, opens a range of interesting questions, as well. The positive sign of the institutional capacity coefficient can suggest the necessity to take a closer look at the interactive dynamics in the model. One reason, why the sign is 'wrong' may be that better institutional capacity will generally induce more development. Increased construction, which is a consequence of development, is also one of the major sources of heavy particulate matter. Therefore, the positive association between heavy particulate matter and a high level of institutional capacity may derive from the interaction between the causal factors. A naive person might argue that we therefore should prefer less institutional capacity in order to avoid development. The alternative, however, no development or improvement in living standards, is difficult to sell to Americans or inhabitants of other developed countries. It is
170 Appendix A
certainly not an option for developing countries. Rather than avoiding development, we need to focus on sustainable development, and I would argue that institutional capacity is an important element here.
In addition, the stronger significance of institutional capacity for the share of the urban populations with access to safe drinking water, versus rural ones, illustrates an interesting difference between these two indicators, which on the surface would appear to be almost identical. When taken together with the fact that the time trend is stronger for rural access, this finding suggests that urban access to safe drinking water is comparatively more driven by the immediate politico-economic conditions, i.e. institutional capacity and financial resources and independent of time. Rural access, in contrast appears cross-nationally to have strongly improved with time reflecting maybe a concerted political effort as discussed above, given the absence of sufficiently favorable economic conditions in rural areas at that point.
Compared to the supportive results for access to sanitation and drinking water and most of the indicators of air and water quality, the results for deforestation are disappointing. Of course, the failure to find the expected relationship may be a function of the quality of the data. In the case of deforestation, the sample is extremely small and the estimates are of notably poor quality.1O
In general, however, the results strongly suggest the potential of institutional capacity to benefit environmental quality in various dimensions of the latter. The implication, then, is that governments can provide a supportive institutional framework for improvements in environmental quality in conjunction with development.
A closer look at the other explanatory variables provides further interesting insights. In terms of the time trend, for instance, we would like to know whether we generally see an improvement in environmental quality at any given level of institutional capacity and incomes over time, which would indicate a learning curve in the form of technological innovation. In fact, Grossman and Krueger introduced the time trend specifically for the purpose of capturing the effect of improvements in technology, in order to not attribute them to changes in per capita incomes. The results, however, tell a different story. In five of the ten regressions that have a time trend, this time trend is negatively related to environmental quality. BOD, smoke, D02, and fecal coliform, all have deteriorated over time at any given level of income and institutional capacity. Interestingly, this group contains the three indicators of water quality, but only one indicator of air quality, which may be pointing to the greater improvements in cleaning technology or just
10 Shafik and Bandyopadhyay highlight the paucity of deforestation data in their study. Their empirical results for deforestation are similarly weak.

Appendix A 171
stronger efforts in clean air policy than in clean water policy. Alternatively, population growth and the continuously increasing use of fertilizers worldwide may be causing the negative trend for water quality, as these factors impact the selected indicators of water quality more directly than those of air quality. Improvements over time have come for access to drinking water and sanitation, where we know that concerted political efforts have been made, as well as for S02 and SPM. As pointed out earlier, S02 is a cause of acid rain and has, in this context, received political attention in many developed countries as well. The positive developments for these indicators independent of income levels underline what is also illustrated by the institutional capacity measure: where there is a will there is a way.
Rather than pushing these findings too strongly, however, consider an important aspect of the results that should cause some concern. A significant need for further research in this area becomes clear when we compare the present findings on the influence of per capita income levels on environmental quality to those of the previous research efforts. On the positive side, some of the results are in agreement with the findings by either Grossman and Krueger, Shafik and Bandyopadhyay, or Janicke and his colleagues. On the negative side, however, they agree sometimes with one research team and at other points with another, and sometimes even with none of the previous findings at all.
Access to safe drinking water is a case with little controversy. Similar to Shafik and Bandyopadhyay, the present analysis finds access to uniformly increase with higher per capita income levels. In the case of SPM, however, the finding of an inverted u-curve corresponds to Shafik and Bandyopadhyay's finding, but contradicts the findings by both Grossman and Krueger as well as Janicke et aI., who find particulates to uniformly decrease with per capita income levels. In contrast, in the case of D02, the present finding of an inverted u-curve corresponds to Grossman and Krueger's results, but contradicts Shafik and Bandyopadhyay's finding of a uniform worsening of oxygen levels with rising per capita incomes. Significantly, in both cases, the turning points in the calculations here are much higher than those calculated by Grossman and Krueger and Shafik and Bandyopadhyay respectively. Finally, in the case of fecal coliform, the present findings agree with neither those of Grossman and Krueger, nor those of Shafik and Bandyopadhyay. In spite of the generally supportive results, then, what becomes obvious is how little we really know about the complex dynamics in our ecological system. While some of these differences in findings might arise from different compositions in the samples, they generally highlight how much more we need to scrutinize theoretically and empirically the relationships between the different causal factors.
172 Appendix A
An additional caveat to the predictive strength of these empirical assessments is that the results describe the relationships of the past, particularly of the seventies and eighties. There are no guarantees that the relationships found will be the same in the 218t century or even in the nineties. Probably the relationships between environmental quality and the different causal factors were different before the seventies and eighties as well, especially before the rise of the environmental movement. The reason for the changing relationships is that they depend on given economic and especially technological conditions at a time, as well as social conditions specifically environmental awareness. Improvements in technology, for instance, can mean that at any given income level or for any level of institutional capacity, countries will pollute less. Countries that are currently industrializing or will do so in the 218t century might not have to go through the S02 phase. Likewise, international pressure for environmental improvement or even domestic pressures arising as knowledge about environment related health concerns travels around the world can influence these relationships. As a consequence of such developments, we might find higher environmental quality at any given level of institutional capacity and per capita incomes if not a different form of relationship in the future.
At the same time, however, we might also witness the opposite, i.e. that improvements in per capita incomes or even institutional capacity might not be associated with parallel improvements in environmental quality. In the past, developed countries have often achieved improvements of environmental quality, especially air quality, not only through the imposition of stringent air quality regulations, but also through the movement of the most polluting industries to developing countries. That means, however, that some of the developing countries will not have the same option to improve their air quality.
In sum, the empirical evidence supports the expected positive influence of institutional capacity on environmental quality. At any level of development, improvements in institutional capacity lead to improvements in environmental quality in terms of air and water quality, as well as in terms of access to safe drinking water and sanitation for both rural and urban populations. Future research will need to analyze the environmental implications of institutional capacity for additional indicators of environmental quality, as well as attempt to solve the puzzle of conflicting results for the relationship between per capita income levels and environmental quality.
Appendix B
In addition to the institutional factors discussed in Appendix A, preliminary assessments of the empirical support for social and cultural factors as determinants of environmental quality were conducted. The respective factors tested were levels of post-materialism in a society and income distributions.
B.I Culture
The identification of culture as a determinant of environmental policy derives its main impetus from the work by Inglehart (1971, 1990), and is based on the argument that changes in the culture of Western, industrialized societies have led to corresponding changes in the kind of economic growth these societies are pursuing (see also Inglehart and Abramson, 1994). According to Inglehart, these changes, originally caused by developments in the economic, political, and technological conditions of society, have led to an increased concern for quality of life aspects, including environmental quality, and a lessened focus on economic growth rates.
As pointed out above, empirical research has found post-materialism to be a strong determinant of environmental values (Dalton, 1994; MlillerRommel, 1990; Rohrschneider, 1993). Arguments by other scholars, however, link environmental values to higher incomes, education and the influence of younger generations, thus focusing on social rather than culturally specific conditions.
173
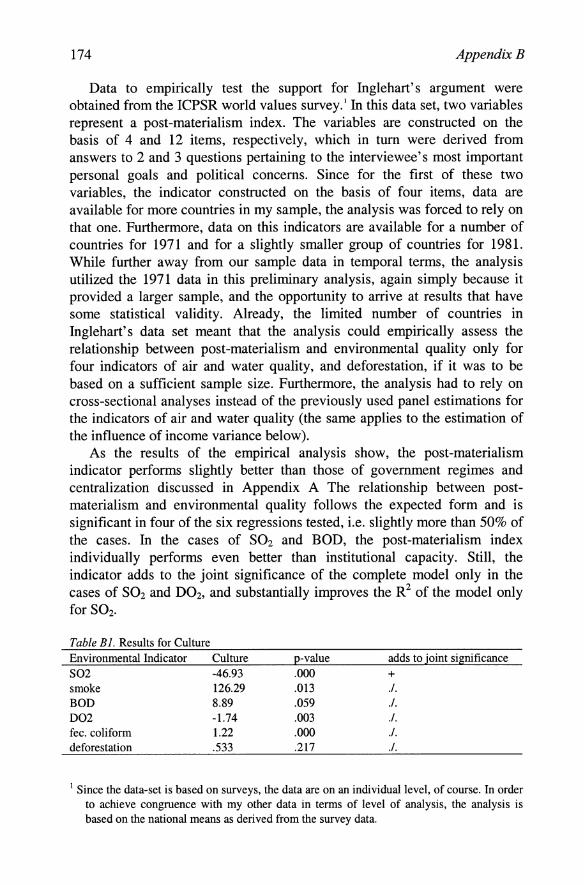
174 AppendixB
Data to empirically test the support for Inglehart's argument were obtained from the ICPSR world values survey. I In this data set, two variables represent a post-materialism index. The variables are constructed on the basis of 4 and 12 items, respectively, which in turn were derived from answers to 2 and 3 questions pertaining to the interviewee's most important personal goals and political concerns. Since for the first of these two variables, the indicator constructed on the basis of four items, data are available for more countries in my sample, the analysis was forced to rely on that one. Furthermore, data on this indicators are available for a number of countries for 1971 and for a slightly smaller group of countries for 1981. While further away from our sample data in temporal terms, the analysis utilized the 1971 data in this preliminary analysis, again simply because it provided a larger sample, and the opportunity to arrive at results that have some statistical validity. Already, the limited number of countries in Inglehart's data set meant that the analysis could empirically assess the relationship between post-materialism and environmental quality only for four indicators of air and water quality, and deforestation, if it was to be based on a sufficient sample size. Furthermore, the analysis had to rely on cross-sectional analyses instead of the previously used panel estimations for the indicators of air and water quality (the same applies to the estimation of the influence of income variance below).
As the results of the empirical analysis show, the post-materialism indicator performs slightly better than those of government regimes and centralization discussed in Appendix A The relationship between postmaterialism and environmental quality follows the expected form and is significant in four of the six regressions tested, i.e. slightly more than 50% of the cases. In the cases of S02 and BOD, the post-materialism index individually performs even better than institutional capacity. Still, the indicator adds to the joint significance of the complete model only in the cases of S02 and D02, and substantially improves the R2 of the model only for S02.
Table BI. Results for Culture Environmental Indicator Culture p-value adds to joint significance S02 -46.93 .000 + smoke 126.29 .013 .I. BOD 8.89 .059 .I. D02 -1.74 .003 .I. fec. coliform 1.22 .000 .I. deforestation .533 .217 .I.
1 Since the data-set is based on surveys, the data are on an individual level, of course. In order to achieve congruence with my other data in terms of level of analysis, the analysis is based on the national means as derived from the survey data.
AppendixB 175
The sign of the post-materialism coefficient also tells a more unambiguous story than in the cases of democracy and centralization. For the statistically significant relationships between post-materialism and environmental quality, the coefficient is generally positive. Yet, in one ofthe cases with the highest significance of the indicators, 502, it is negative, pointing to higher levels of 502 in cultures with higher levels of postmaterialism. With this surprising result, the lack of substantial improvements of the R2 and the joint significance of the complete model, then, the empirical support for the importance of post-materialism for environmental quality is not very convincing as well. The very small sizes of some of the samples in these estimations, of course, are partly to blame for this. The significance of the post-materialism index in most equations suggests the benefit of further exploration of the interactive dynamics between cultural characteristics and environmental quality.
B.2 Income Distribution
Finally, what impact do differences in income distributions have on the environmental quality achieved at any given level of development, if per capita income is such a strong determinant of environmental quality? Going beyond the fundamentally flawed measure of individual welfare provided by per capita GDP, the actual- income of the majority of the population should have a significant impact on the use of natural resources. Including a measure of income distributions in the empirical assessment still does not allow an exact measure of individual welfare, but improves on the assessment of a population's actual wealth and income provided by per capita GDP.
A highly uneven distribution of wealth, for instance, could mean that the majority of a population depends on the (over)exploitation of natural resources for every-day survival. Furthermore, without the means to protect resources, their decision-making will be similar to that of appropriators from open-access resources. Consequently, environmental problems are likely to be distributed in a geographically and socially highly uneven fashion. While the elite is likely to be enjoying relatively healthy environmental conditions with functioning sewage systems and access to safe drinking water, and may have a concern for clean air, clean rivers, and beautiful landscapes in the proximity of their homes, the poor sections of the population lack the financial means to improve their respective environmental conditions.
Even the natural resources owned by the wealthy elite, however, may not fare well under these circumstances, if we look at the political consequences of skewed income distributions. If the income is distributed highly unevenly in a country, the political climate, and with it government's institutional
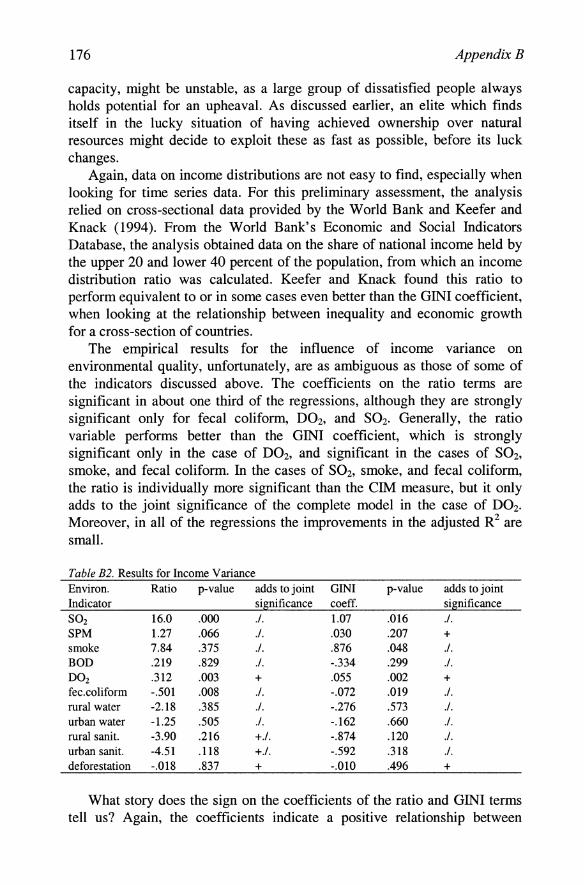
176 AppendixB
capacity, might be unstable, as a large group of dissatisfied people always holds potential for an upheaval. As discussed earlier, an elite which finds itself in the lucky situation of having achieved ownership over natural resources might decide to exploit these as fast as possible, before its luck changes.
Again, data on income distributions are not easy to find, especially when looking for time series data. For this preliminary assessment, the analysis relied on cross-sectional data provided by the World Bank and Keefer and Knack (1994). From the World Bank's Economic and Social Indicators Database, the analysis obtained data on the share of national income held by the upper 20 and lower 40 percent of the population, from which an income distribution ratio was calculated. Keefer and Knack found this ratio to perform equivalent to or in some cases even better than the GINI coefficient, when looking at the relationship between inequality and economic growth for a cross-section of countries.
The empirical results for the influence of income variance on environmental quality, unfortunately, are as ambiguous as those of some of the indicators discussed above. The coefficients on the ratio terms are significant in about one third of the regressions, although they are strongly significant only for fecal coliform, D02, and S02. Generally, the ratio variable performs better than the GINI coefficient, which is strongly significant only in the case of D02, and significant in the cases of S02, smoke, and fecal coliform. In the cases of S02, smoke, and fecal coliform, the ratio is individually more significant than the elM measure, but it only adds to the joint significance of the complete model in the case of D02. Moreover, in all of the regressions the improvements in the adjusted R2 are small.
Table B2. Results for Income Variance Environ. Ratio p-value adds to joint GINI p-value adds to joint Indicator significance coeff. significance S02 16.0 .000 .I. 1.07 . 016 .I . SPM 1.27 .066 .I. .030 .207 + smoke 7.84 .375 .I. .876 .048 .I . BOD .219 .829 .I. -.334 . 299 .I . D02 .312 .003 + . 055 .002 + fec.coliform -.501 .008 .I. -.072 .019 .I . rural water -2.18 . 385 .I. -.276 .573 .I . urban water -1.25 .505 .I . -.162 . 660 .I . rural sanit. -3.90 . 216 +.1. -.874 . 120 .I . urban sanit. -4.51 .118 +.1. -.592 .318 .I . deforestation -.018 . 837 + -.010 .496 +
What story does the sign on the coefficients of the ratio and GINI terms tell us? Again, the coefficients indicate a positive relationship between
AppendixB 177
environmental quality and income distributions in some cases and a negative one in others, with the majority, however, suggesting that environmental quality is poorer where income distributions are highly skewed. The picture is less clear, however, if we restrict our inquiry to the significant relationships. For two of the four indicators for which income distribution is significant, we find a positive relationship between income distributions and environmental quality. Oxygen levels and fecal coliform counts improve the more the income distribution is skewed to the wealthiest quintile of the population. In contrast, SPM and S02 levels worsen with higher ratios. Again, the overall pattern is rather erratic offering little conclusive information. Contrary to intuition, we cannot confidently claim that income variances influence environmental quality.
B.3 Implications
In sum, these preliminary tests find ambiguous results at best for the influence of post-materialism and income variance on environmental quality. Part of the cause behind the poor results may be data quality. For several of the indicators, the samples were extremely small, which influenced the performance of the other variables as well. One cannot blame all of the results on poor data, however, especially not the inconsistency regarding the form of the identified relationships. Again, a more differentiated analysis of the relationship between income distributions and environmental quality might be necessary. Income distributions are likely to have a different influence on environmental quality depending on whether environmental quality tends to improve or deteriorate with increases in per capita income, for instance. If the environmental quality generally deteriorates with rising per capita incomes, as has been shown for the case of waste, for example, an income distribution that is strongly skewed towards a wealthy elite may lead to less pollution in the form of waste, as a larger share of the population will consume less and have less resources to waste. In contrast, when dealing with an indicator that generally improves with per capita income levels, a similarly skewed income distribution will lead to an overall poorer environmental quality. In the case of access to safe drinking water, for instance, a highly skewed income distribution will mean that a larger share of the population does not have this access. Similar to the debates on government regimes and centralization, then, arguments regarding the relationship between environmental quality and income variance need to be made in the context of the specific environmental dimension and indicator in question.
ENVIRONMENT & POLICY
1. Dutch Committee for Long-Term Environmental Policy: The Environment: Towards a Sustainable Future. 1994 ISBN 0-7923-2655-5; Pb 0-7923-2656-3
2. O. Kuik, P. Peters and N. Schrijver (eds.): Joint Implementation to Curb Climate Change. Legal and Economic Aspects. 1994 ISBN 0-7923-2825-6
3. C.l Jepma (ed.): The Feasibility of Joint Implementation. 1995 ISBN 0-7923-3426-4
4. EJ. Dietz, H.RJ. Vollebergh and lL. de Vries (eds.): Environment, Incentives and the Common Market. 1995 ISBN 0-7923-3602-X
5. J.ETh. Schoute, P.A. Finke, ER Veeneklaas and H.P. Wolfert (eds.): Scenario Studies for the Rural Environment. 1995 ISBN 0-7923-3748-4
6. RE. Munn, J.W.M. la Riviere and N. van Lookeren Campagne: Policy Making in an Era of Global Environmental Change. 1996 ISBN 0-7923-3872-3
7. E Oosterhuis, E Rubik and G. Scholl: Product Policy in Europe: New Environmental Perspectives. 1996 ISBN 0-7923-4078-7
8. J. Gupta: The Climate Change Convention and Developing Countries: From Conflict to Consensus? 1997 ISBN 0-7923-4577-0
9. M. Rolen, H. Sjoberg and U. Svedin (eds.): International Governance on Environ-mental Issues. 1997 ISBN 0-7923-4701-3
10. M.A. Ridley: Lowering the Cost of Emission Reduction: Joint Implementation in the Framework Convention on Climate Change. 1998 ISBN 0-7923-4914-8
11. G.J.!. Schrama (ed.): Drinking Water Supply and Agricultural Pollution. Preventive Action by the Water Supply Sector in the European Union and the United States. 1998 ISBN 0-7923-5104-5
12. P. Glasbergen: Co-operative Environmental Governance: Public-Private Agreements as a Policy Strategy. 1998 ISBN 0-7923-5148-7; Pb 0-7923-5149-5
13. P. Vellinga, E Berkhout and J. Gupta (eds.): Managing a Material World. Perspectives in Industrial Ecology. 1998 ISBN 0-7923-5153-3; Pb 0-7923-5206-8
14. EH.J.M. Coenen, D. Huitema and L.J. O'Toole, Jr. (eds.): Participation and the Quality of Environmental Decision Making. 1998 ISBN 0-7923-5264-5
15. D.M. Pugh and J.V. Tarazona (eds.): Regulation for Chemical Safety in Europe: Analysis, Comment and Criticism. 1998 ISBN 0-7923-5269-6
16. W. 0streng (ed.): National Security and International Environmental Cooperation in the Arctic - the Case of the Northern Sea Route. 1999 ISBN 0-7923-5528-8
17. S.V. Meijerink: Conflict and Cooperation on the ScheIdt River Basin. A Case Study of Decision Making on International ScheIdt Issues between 1967 and 1997. 1999
ISBN 0-7923-5650-0 18. M.A. Mohamed Salih: Environmental Politics and Liberation in Contemporary
Africa. 1999 ISBN 0-7923-5650-0 19. C.J. Jepma and W. van der Gaast (eds.): On the Compatibility of Flexible Instruments.
1999 ISBN 0-7923-5728-0 20. M. Andersson: Change and Continuity in Poland's Environmental Policy. 1999
ISBN 0-7923-6051-6
ENVIRONMENT & POLICY
21. W. Kiigi: Economics of Climate Change: The Contribution of Forestry Projects. 2000 ISBN 0-7923-6103-2
22. E. van der Voet, J.B. Guinee and H.A.U. de Haes (eds.): Heavy Metals: A Problem Solved? Methods and Models to Evaluate Policy Strategies for Heavy Metals. 2000
ISBN 0-7923-6192-X 23. G. H!/lnneland: Coercive and Discursive Compliance Mechanisms in the Management
of Natural Resourses. A Case Study from the Barents Sea Fisheries. 2000 ISBN 0-7923-6243-8
24. J. van Tatenhove, B. Arts and P. Leroy (eds.): Political Modernisation and the Environments. The Renewal of Environmental Policy Arrangements. 2000
ISBN 0-7923-6312-4 25. G.K. Rosendal: The Convention on Biological Diversity and Developing Countries.
2000 ISBN 0-7923-6375-2 26. G.H. Vonkeman (ed.): Sustainable Development of European Cities and Regions.
2000 ISBN 0-7923-6423-6 27. J. Gupta and M. Grubb (eds.): Climate Change and European Leadership. A Sus-
tainable Role for Europe? 2000 ISBN 0-7923-6466-X 28. D. Vidas (ed.): Implementing the Environmental Protection Regimefor the Antarctic.
2000 ISBN 0-7923-6609-3; Pb 0-7923-6610-7 29. K. Eder and M. Kousis (eds.): Environmental Politics in Southern Europe: Actors,
Institutions and Discourses in a Europeanizing Society. 2000 ISBN 0-7923-6753-7 30. R. Schwarze: Law and Economics of International Climate Change Policy. 2001
ISBN 0-7923-6800-2 31. M.J. Scoullos, G.H. Vonkeman, I. Thornton, and Z. Makuch: Mercury - Cadmium
Lead: Handbookfor Sustainable Heavy Metals Policy and Regulation. 2001 ISBN 1-4020-0224-6
32. G. Sundqvist: The Bedrock of Opinion. Science, Technology and Society in the Siting of High-Level Nuclear Waste. 2002 ISBN 1-4020-0477-X
33. P.PJ. Driessen and P. Glasbergen (eds.): Greening Society. The Paradigm Shift in Dutch Environmental Politics. 2002 ISBN 1-4020-0652-7
34. D. Huitema: Hazardous Decisions. Hazardous Waste Siting in the UK, The Nether-lands and Canada. Institutions and Discourses. 2002 ISBN 1-4020-0969-0
35. D. A. Fuchs: An Institutional Basis for Environmental Stewardship: The Structure and Quality of Property Rights. 2003 ISBN 1-4020-1002-8
For further information about the series and how to order, please visit our Website
http://www.wkap.nl/series.htmlENPO
KLUWER ACADEMIC PUBLISHERS - DORDRECHT / BOSTON / LONDON