bharti airtel qualcomm, videocon, aircel licenses,telenor excluding administered spectrum 2. ... pan...
TRANSCRIPT

Bharti AirtelManagement Presentation – March 2017

Disclaimer
Certain numbers in this presentation have been rounded off for ease of representation
The information contained in this presentation is only current as of its date. All actions and statements made herein or otherwise shall be subject to the applicable
laws and regulations as amended from time to time. There is no representation that all information relating to the context has been taken care off in the presentation
and neither we undertake any obligation as to the regular updating of the information as a result of new information, future events or otherwise. We will accept no
liability whatsoever for any loss arising directly or indirectly from the use of, reliance of any information contained in this presentation or for any omission of the
information. The information shall not be distributed or used by any person or entity in any jurisdiction or countries were such distribution or use would be contrary to
the applicable laws or Regulations. It is advised that prior to acting upon this presentation independent consultation / advise may be obtained and necessary due
diligence, investigation etc may be done at your end. You may also contact us directly for any questions or clarifications at our end.
This presentation contain certain statements of future expectations and other forward-looking statements, including those relating to our general business plans and
strategy, our future financial condition and growth prospects, and future developments in our industry and our competitive and regulatory environment. In addition to
statements which are forward looking by reason of context, the words ‘may, will, should, expects, plans, intends, anticipates, believes, estimates, predicts, potential or
continue’ and similar expressions identify forward looking statements.
Actual results, performances or events may differ materially from these forward-looking statements including the plans, objectives, expectations, estimates and
intentions expressed in forward looking statements due to a number of factors, including without limitation future changes or developments in our business, our
competitive environment, telecommunications technology and application, and political, economic, legal and social conditions in India. It is cautioned that the
foregoing list is not exhaustive
“The information contained herein does not constitute an offer of securities for sale in the United States. Securities may not be sold in the United States absent
registration or an exemption from registration under the U.S. Securities Act of 1933, as amended. Any public offering of securities to be made in the United States
will be made by means of a prospectus and will contain detailed information about the Company and its management, as well as financial statements. No money,
securities or other consideration is being solicited, and, if sent in response to the information contained herein, will not be accepted.”
Investor Relations :- http://www.airtel.in
For any queries, write to: [email protected]
2

1998 2004
300
million
customers
First
launched
in Delhi
and HP
Pan India
footprint;
India’s
largest
telco
2008
Launch
direct to
home
services
(DTH)
2010
Acquired
Zain;
Present in
over 20
countries
2011
3G
services
launched
2014
First
operator
to launch
4G in
India
2015
#3
operator
in the
world -
Crossed
300 million
customers
Source: Company Filings
Start up (1995 - 2000) Land Grab (2001 - 2010) Multiple Plays (2011 onwards)
Journey Through The Times
2013
3
2016
Pan India
data
operator
with 4G
across
334 towns
and 3G in
21 of 22
circles
Only
operator
in India
with pan
India 3G
& 4G
First
operator to
launch
Pan India
Payments
Bank
2017

What Guides Us
4
• Win customers for life through differentiated experience, products and world class technology
Customer Centricity
• Growth despite challenges
• Grow market share, strip out waste
• Accelerate non-mobile businesses
Performance Excellence
• Highest corporate governance and disclosure rankings
Transparency & Ethical Governance

Investment Highlights
5
Large residual opportunity
Bulk investments already in place; good spectrum bank
Diversified operator with scale and dominance in marketplace
Demonstrated best in class execution
1
2
3
4

6
1. LARGE RESIDUAL OPPORTUNITY
Voice Secularity
• Under-penetrated geographies
• Unique mobile users at c. 50% of total SIMs (large dual-SIM user base)1
• Declining age dependency2
• Industry consolidation, top 3 operators account for 78% RMS3
Data
• India mobile broadband (3G/4G) penetration at 15%4
• Smartphone shipments show tremendous growth. Smartphone penetration at 24%4
• Data traffic to grow by a CAGR of 63% over the period 2015 - 20204
Untapped Opportunities
• Payments Bank and other non-mobile businesses
Source: 1. Cisco VNI forecasts, Ericsson Mobility Report 2. UN estimates, 3. TRAI; RMS as of Q3’17, including Telenor, Airtel + Telenor merger is subject to
regulatory approvals, 4. GSMA Mobile India Economy, as of 2015

7
India, Africa have the lowest wireless penetration
Source: Ericsson Mobility Report 2016
Overall 80% but
Rural – ~ 51%
Opportunity

8
India: 2nd largest mobile market in Asia, but long way from saturation
Source: TRAI; Ericsson Mobility Report; GSMA; CISCO VNI
506
562
619
660
697
734
2015
2016
2017
2018
2019
2020
7.7% CAGR2015: ~50% of total
mobile connected devices
2020: ~54% of total mobile
connected devices
India Unique Subscribers
Opportunity

9
10 Operators 14 Operators 12 Operators 10 Operators
Market share
Industry wide focus on improving operational and financial health
• Industry consolidation via market share gains, with top 3 now accounting for over 78% of the industry revenues as of Dec’16 including Telenor (merger subject to regulatory approvals)
• Exits by many operators post Feb 2012 SC verdict (122 licenses cancelled), many rationalized their footprints
• Spectrum auctions fortified consolidation story
• Even further consolidation WIP
• Small players combining
• Other players evaluating
Source: TRAI
1. Revenue shares are based on Financial Year Gross Revenues
64% 66% 70% 73%
36% 34% 30% 27%
2009 2012 2014 2016
Top 3 Others
iRMS
~95%
India: Industry Consolidation Underway via Revenue Shares
Opportunity

7 out of 10 smartphones shipped in Q2 FY2016 were 4G enabled and 9 out of 10
smartphone sold by eTailers were 4G.
10
India: Transitioning to a Smartphone Market
Source: Ericsson Mobility Report; GSMA Intelligence, JPM estimates
Opportunity
11 16
44
80
104 108
125
83%
48%
170%
83%
29%
5% 15%
0%
20%
40%
60%
80%
100%
120%
140%
160%
180%
-
20
40
60
80
100
120
140
2011 2012 2013 2014 2015 2016E 2017E
Smartphone shipments YoY

11
… driven by increasingly affordable handsets
30 Mn
240 Mn75 Mn 360 Mn
2014 2020 2014 2020
Source: Ericsson Mobility Report; GSMA Intelligence
Prices are expected to fall by 40–50% over the next 3 years for high-end smartphones
High end smartphones (~ USD 165+) Low end smartphones (~ USD 35)
Opportunity

12Source: Ericsson Mobility Report
…and growing appetite for data services
Airtel owned apps
Opportunity

13
… will drive increase in consumption
Source: GSMA Intelligence 2016
Opportunity
Mobile data traffic data per month in India

14
• One App for all the Apps
• Suite of apps including Hike, Juggernaut, Wynk Music, Video, Games, Ditto TV, Airtel Payments Bank under My Airtel App
• Additional features – Dialer, OpenNetwork
MyAirtel
• Carrier agnostic music and video apps with a curated library of ~2.5 million songs and over 5000 movies & 20,000 other video content
• Wynk Music: 30 million downloads, highest consumption music app on Play Store in India
Wynk Music, Video & Games
• Payments Bank launched in India. Airtel Money offered across all 15 opcos in Africa
• KPI: Africa (Q3’FY17)
• 8.8 mn active customers, up 6.6% YoY, transacting c $4.0 bn / quarter
Airtel Money
We continue to innovate across areas that matter
Opportunity

Significant opportunities exist in payments bank and DTH
15
Digital payments will touch $500bn in India by 2020
Source: BCG-Google Digital payments 2020, KPMG-FICCI Indian Media and Entertainment Report 2016
44
55
74
2015 2016P 2017P
No. of pay DTH subscribers projected
to increase to 74mn by 2017
Card Digital Other Paper Cash
Payment Instrument Mix for Countries (2015) No. of DTH subscribers
Opportunity

Fixed broadband and enterprise services market has huge growth potential
16
2015 2021
Collaboration services and Enterprise Mobility
are fast growing verticals and are estimated to
register growth of 18.9% and 20.7% respectively
over the FY’15 to FY’21 period
Source: Broadband Commission Report 2016 , IDC Asia
37.72
31.53
30.49
18.77
18.56
5.25
1.34
United Kingdom
United States
Japan
Russia
China
South Africa
India
Fixed broadband subscriptions per 100
capita, 2015Enterprise data services market growth
Opportunity

Payments Bank will act as Enabler for Financial Inclusion
~65% percent consumer transaction
by value are currently in cash
65%
35%
Cash Non Cash
Out of 230 Mn accounts opened in PMJDY, 25%
are zero balance accounts and a higher number
are non transacting
There is a need to drive Financial Inclusion in India to digitize cash and bring the un-
banked in the folds for organized banking sector
557
415
185
230
2011 2014 PMJDYAccounts
(Till Aug '16)
Unbanked
PMJDY made
large dent in
unbanked
Source : PMJDY website, PWC Report
Payments Bank –Untapped OpportunityOpportunity
Cash v/s non-cash transaction value Unbanked Population (Mn)
17

18
2. BULK INVESTMENTS IN PLACE
Spectrum Bank
• Successful re-farming of sub-GHz spectrum for 3G
• 3G/4G coverage pan-India
• Highest spectrum market share ex-MTNL/BSNL
Largest network of towers and base stations
• 95.3% voice population coverage
• Mobile broadband towers up 28.3% over the last year
Largest network of optic fiber
• Global and national long distance fiber – over 453,607 RKms
• Added c. 4,808 RKms over the past quarter

Source:
1. Including Qualcomm, Videocon, Aircel licenses,Telenor excluding administered spectrum
2. Based on 2015 auctions
3. Includes Telenor (merger is subject to regulatory approvals) 19
Nominal value of
liberalized spectrum at USD 15.7
billion1
Industry leading revenue
yield/MHz at 2x industry
avg with same
cost/MHz2
Wide spectrum presence:
~22%3
spectrum market share
Largest optical fiber
network amongst private players
Prime spectrum to yield data
growth: Pan India 3G &
4G
India: Investments to Yield ResultsInvestments

Source: TRAI, Department of Telecom, Company Filings
1. Including Qualcomm, Videocon, Aircel licenses, Telenor (merger is subject to regulatory approvals) excluding administered spectrum; revenues as of Q3’17
20
India: Superior Spectrum Position
3G sub-Ghz available in 10 circles covering ~50% of own revenues and ~44% of industry
revenue
Pan India 3G and 4G – No Gaps
4G Carrier aggregation covers ~84% of own revenues and ~85% industry revenues
4G capability on 900Mhz is in 10 circles
10 20 8 22 19 19No. of circles present in
Spectrum holdings across bands; % of own revenues covered1
Investments
50
94
45
10084 85
3G (900) 3G (2100) 3G (900 & 2100) 4G (1800) 4G (2300) 4G (1800 & 2300)
xx % of own revenues covered

21
Aggressive Network Build - Monetize Spectrum
Source: Company filings, as of Q3’17
Mobile broadband towers (‘000) - India Total 3G Network Sites (‘000) – Africa1
Investments
46
88
113
31.2%
58.4%
70.8%
40
60
80
100
120
140
Q4'15 Q3'16 Q3'17
25.0%
30.0%
35.0%
40.0%
45.0%
50.0%
55.0%
60.0%
65.0%
70.0%
Mobile broadband towers Mobile broadband towers % of total towers
9.2
11.9
13.6
50%
63%
67%
40%
45%
50%
55%
60%
65%
70%
3.0
5.0
7.0
9.0
11.0
13.0
Q3'15 Q3'16 Q3'17
3G sites % of total sites

22
Pan India 3G and 4G footprint Investments
3G (900) 3G (2100)
3G
(Carrier
Agg) 3G Total 4G (TDD) 4G (FDD)
4G
(TDD+FD
D) 4G Total
Andhra Pradesh Y Y Y Y Y Y Y Y
Assam Y Y Y Y Y Y Y Y
Bihar — Y — Y Y Y Y Y
Delhi Y Y Y Y Y Y Y Y
Gujarat — Y — Y Y Y Y Y
Haryana — Y — Y Y Y Y Y
Himachal Pradesh Y Y Y Y Y Y Y Y
Jammu & Kashmir — Y — Y Y Y Y Y
Karnataka Y Y Y Y Y Y Y Y
Kerala — Y — Y Y Y Y Y
Kolkata Y — — Y Y Y Y Y
Madhya Pradesh — Y — Y Y Y Y Y
Maharashtra — Y — Y Y Y Y Y
Mumbai Y Y Y Y Y Y Y Y
North East Y Y Y Y Y Y Y Y
Orissa — Y — Y Y Y Y Y
Punjab Y — — Y Y Y Y Y
Rajasthan Y Y Y Y — Y — Y
Tamil Nadu — Y — Y Y Y Y Y
Uttar Pradesh (East) — Y — Y — Y — Y
Uttar Pradesh (West) — Y — Y — Y — Y
West Bengal — Y — Y Y Y Y Y
Number of circles
covered in 10 20 8 22 19 22 19 22
50% 94% 45% 100% 83% 100% 83% 100%
* Including Telenor, merger is subject to regulatory approvals

23
Africa: Invested for Growth
3Q’172010
Capex Investments till date: $ 5.3 bn
Well funded out of EBITDA: $ 6.4 bn till date
Thus OFCF = $ 1.1 bn
Further focus on business re-contouring
Tower Sales in 11 countries
Divestment of 2 countries to Orange
Announced merger of Ghana operations with
Millicom
Total proceeds: $ 3.25 bn
Already received: ~$3.1 bn
Investments

24
3. AIRTEL: DIVERSIFIED OPERATOR WITH SIGNIFICANT SCALE
Profitability and scale across diversified segments
• Dominant position to capitalize with bulk investments in place
• Only operator with diversified portfolio
• Scale leading to operating leverage
• Generating significant organic free cash
Leadership across geographies
• Leader in India, #1 or #2 in 12 African countries
Leading market shares
• Highest revenue market share and subscriber market share1
Source: 1. TRAI
Allowing Airtel
the best
chance to
capitalize on
the
opportunities
ahead, with
bulk of
investments
already done

Multiple plays, multiple opportunities
25
Mobile Services across 17 countries
• 365 mn1 wireless subscribers globally
• Over 1.40 trillion minutes of calls (LTM)
• Over 776Bn MBs of data over the last year
Homes Services (Fixed Line & Broadband)
• 2.1 mn1 broadband & internet customers
• Revenue growth – 10.8% YoY
Digital TV
• Pan India DTH, 12.6 mn1 subscribers – top 3 player
• Revenue growth –17.7% YoY
Airtel Business (Large enterprises and carriers)
• Over 230,000 Rkms1 across 50 countries, 5 continents
Tower Infrastructure Services
• Bharti Infratel – 38,997 towers1 across 11 circles
• 42% stake in Indus Tower which has 122,044 towers1
across 15 circles
• Revenue growth – 9.4% YoY
1. Bharti Airtel Quarterly Report and KPI sheet for quarter ending December 31, 2016
EBITDA contribution (Q3’17)
Scale
Wireless India, 59.9%
Homes, 3.9%
Digital, 3.5%
Airtel Business, 9.5%
Tower Co, 8.3%
Africa, 14.8%SA, 0.2%

26
Profitability & Scale across Diversified Segments1
Global Telco – Multiple businesses create opportunity for Convergence
365 million customers as of Dec’2016
$3,838
$858 $251
$727
$8,565
$1,192
$446
9.9%
5.4%
11.8%
13.0%
32.3%
3.0%3.5%
4.4% 7.4%
7.9%
16.2%
17.8%
-2.0%
3.0%
8.0%
13.0%
18.0%
23.0%
28.0%
33.0%
$-
$1,000
$2,000
$3,000
$4,000
$5,000
$6,000
$7,000
$8,000
$9,000
Africa Tower Infra SA Telemedia India Wireless Airtel Business Digital TV
USD Rev
YoY RevenueGrowth
EBITDA Growth
208% 71.1%
Scale
1. As of FY 2016

Scale brings Operating Leverage
27
Overview Revenue Market Share - India
Spectrum Scale – India3Customer Market Share - India
Presence in 17 countries
#3 Operator in the World
#1 in India & #1 or #2 in 11 countries in Africa
US$ 14.74 bn Revenue1
US$ 5.22 bn EBITDA1
2.02 addressable population1
Only operator with Pan India 3G & 4G
Source: Company filings
1. As of FY 2016 2. YoY refers to Sept’15-Sept’16 3. Includes Telenor; merger is subject to regulatory approvals
Scale
678
1,603
157
Multi layer data spectrum in key cities
31.6% 31.6%
32.7% 32.9% 33.1%
Q3FY16 Q4'16 Q1'17 Q2'17 Q3'17
RMS of 35.6% including Telenor
24.1% 24.3%24.7% 24.8%
23.6%
Q3'16 Q4'16 Q1'17 Q2'17 Q3'17
CMS of 28.4% including Telenor
Spectrum Band
Industry
Spectrum (MHz)
Industry
Spectrum ex-
MTNL/BSNL
(Mhz)
Spectrum held
by Bharti (Mhz)
Bharti Spectrum
Market Share ex-
MTNL/BSNL
900 427 289 116 40.3%
1800 1143 1077 277 25.7%
2100 605 495 125 25.3%
2300 600 600 235 39.2%
Total 3400 2901 754 26.0%

Driving increased Profitability
• Reducing costs. Consolidated opex growth -5.1% YoY
• Scale and Profitability across diversified segments• Among Top 3 in every non-mobile segment (TowerCo, DTH, Homes, B2B)
• 39% of consolidated EBITDA comes from businesses other than India mobility
• 24% from India non-mobile businesses
• 15% from International mobility businesses
• Robust EBITDA growth in Indian non-mobility businesses – 10.8% in Homes, 17.7% in Digital TV, and 12.5% in Airtel Business
• Non wireless segments contribute 36% to India operating profit (Q3’17)
• Africa showing signs of growth with bulk operating investments already in place –monetization to catalyze FCF growth. Turned PBT +ve in constant currency
28
Execution

4. Leader in India Revenue and Customer Market Share1
29
1%6%6%5%4%19%23%36%
1. RMS is calculated on the basis of gross revenues. Source: TRAI
2. RMS is as of 9M’17 and CMS is as of Dec’2016
3. Airtel and Telenor merger is subject to regulatory approvals
4%6%7%7%19%20%30%VLR CMS
296
192
6774
194
60 43
RMS
VLR
Customers
(Mn)
Airtel + Telenor Vodafone Idea (Incl Spice) Reliance BSNL+MTNL Tata Tele Aircel Others
6% <0%
58
5
Airtel + Telenor Vodafone IDEA RCOM BSNL/MTNL Aircel/Dishnet Tata Jio Others
Execution

Increasingly gaining revenue market share
30
Execution
0.5% 1.8%
0.2%
0.0%
0.0%
2.5%
30.8%31.3%
32.9% 33.1%
23.3% 23.3% 23.4% 23.5%
16.2%
18.7% 18.7% 18.7%
15.0%
20.0%
25.0%
30.0%
35.0%
40.0%
Q1FY14 Q2FY14 Q3FY14 Q4FY14 Q1FY15 Q2FY15 Q3FY15 Q4FY15 Q1FY16 Q2FY16 Q3FY16 Q4FY16 Q1FY17 Q2FY17 Q3FY17
Airtel Vodafone Idea
Source: TRAI
Combined
V+I
gained
0.2%
RMS
Airtel +
Telenor
combined
entity
RMS is
35.6% as
of Dec’16

Strategic Pillars for execution
31
Execution
Vibrant Brand
Go to
Market
Excellence
War on
Waste
Win with
People
Win with a
Brilliant
Network
Experience
Digital Airtel, Vibrant Brand
Win with
Valuable
Customers

32
Execution
Creating opportunities
• Unlimited voice packs
• Simplified Pricing. From 6500 Postpaid plans to
• Myplan – Customized plans as per customer usage
• Infinity – Options with unlimited benefits
• Wynk – Music, games. Airtel Movies
• Ditto TV, Juggernaut
• Payments Bank, Airtel Money
Strategic Partnerships
• Wynk + Samsung – presence in all new Samsung shipments
Source: Ericsson Mobility Report
Strategic Pillars: Go to Market Excellence
Game changing innovations
Brand Equity’s Most Trusted Brands 2016
Airtel continues to be no. 1 in Telecom
Jumps eight spots to no. 3 across all sectors and brand

Driving increased brand awareness
33
Awareness (%) - 82
Brand recall (%) - 95
Ad reach index - 78
Source: Mint Ipsos TV AdIndx Survery
Airtel 4G ad – Top television in Dec 2016
Execution

Airtel launches India’s first payments bankExecution
34
Highlights
• Committed to an investment of Rs 3,000 crore across its national operations
• Completely digital and paperless bank. Account opened within minutes using Aadhaar based e-KYC
• 250,000 airtel retail outlets will act as Banking Points, more than the total ATMs in the country. Expected to scale to
over 600,000 Banking Points in coming months
• Plan to develop a nationwide merchant ecosystem of over 5 million merchants, more than a million merchants
already on boarded
• Launched Airtel Payments Bank app and Online Card in collaboration with MasterCard for convenient banking and
cashless payments
• More than 1 Mn accounts already opened
Benefits
• Interest rate of 7.25 % p.a. on deposits in savings accounts
• The customer’s mobile number will be his/her bank account number
• Free Personal Accidental Insurance of Rs. 1 Lac with every Savings Account
• One minute of Airtel mobile talk-time for every Rupee deposited at the time of opening a savings account.
• Easy deposit and withdrawal facility across a wide network of Airtel retail outlets
• USSD and IVR in 12 languages for non-smartphone customers

Voice: Significant growth
35
Value Growth
Volume Growth
Airtel carries over 1.48 trillion minutes1
Secular volume growth 10.8% Y-o-Y
Execution
Source: Company Filings1. LTM Dec 2016
290,459
307,988
314,831 313,403
330,217
Q3'16 Q4'16 Q1'17 Q2'17 Q3'17
32,610
33,771 34,191
36,570
35,913
Q3'16 Q4'16 Q1'17 Q2'17 Q3'17
SIM consolidation in the industry due to
unlimited voice offers
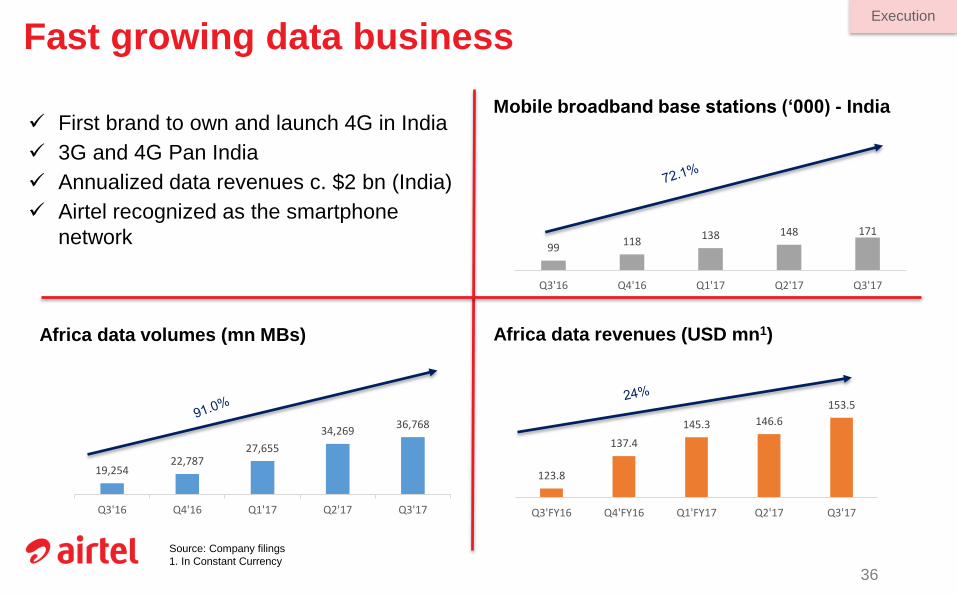
Fast growing data business
36
First brand to own and launch 4G in India
3G and 4G Pan India
Annualized data revenues c. $2 bn (India)
Airtel recognized as the smartphone
network
Mobile broadband base stations (‘000) - India
Execution
99118
138 148 171
Q3'16 Q4'16 Q1'17 Q2'17 Q3'17
19,254 22,787
27,655
34,269 36,768
Q3'16 Q4'16 Q1'17 Q2'17 Q3'17
123.8
137.4
145.3 146.6
153.5
Q3'FY16 Q4'FY16 Q1'FY17 Q2'17 Q3'17
Africa data revenues (USD mn1)Africa data volumes (mn MBs)
Source: Company filings
1. In Constant Currency

INCREASING MARKET SHARE IN RURAL INDIA
Source: TRAI
30.6%30.2%29.5%28.4%27.1%Airtel: Rural subscriber share
Execution
37
112.4
117.5
122.0
124.9126.7
47.8%
48.3%
48.6%
48.8% 48.7%
47.2%
47.4%
47.6%
47.8%
48.0%
48.2%
48.4%
48.6%
48.8%
49.0%
105.0
110.0
115.0
120.0
125.0
130.0
2QFY16 3QFY16 4QFY16 1QFY17 2QFY17
No. of rural subscribers % of rural subscribers to total subscribers

38
Strategic Pillars: Win with Brilliant Network Experience
Blocked calls Repeat calls Dropped
calls
Frustration index
An open networkInvest in toolsEliminate frustration
Capex Outflow FY’16 (mn) Guidance (bn) 9M’17
India & SA $2,379 $2.2 - $2.4 ~ $2.1 bn
Africa $771 $0.6 - $0.7 $275 mn
Largest capital expenditure of
Rs. 60,000 crore over 3 years
towards a comprehensive network
transformation
Execution

Strategic Pillars: Win with Valuable Customers
39
Execution
Source: Company Filings
Mobile Broadband Customer as a % of total
data customersPost-Paid (as % of total Customer Base)
5.9%
6.0%
6.1%
6.3%
6.3%
5.5%
5.6%
5.7%
5.8%
5.9%
6.0%
6.1%
6.2%
6.3%
6.4%
0
0
0
1
1
1
1
Q3'16 Q4'16 Q1'17 Q2'17 Q3'17
56%
61%62%
66%
69%
Q3'16 Q4'16 Q1'17 Q2'17 Q3'17

40
• Airtel has industry wide lowest churn at 4.1%
Source: As per company’s reported numbers
India: Churn %
• In Africa, churn decreased from 6.8% in March 2016 to 4.9% in Dec 2016
Africa: Churn %
Quality Subscriber AcquisitionsExecution
3.4%3.3%
3.6%3.7%
4.1%
Dec'15 Mar'16 June'16 Sept'16 Dec'16
6.0%
6.8%
4.9%5.3%
4.9%
Dec'15 Mar'16 June'16 Sept'16 Dec'16

41
Strategic Pillars: Win with War on Waste
Increasing Opex Productivity Smart procurement Frugal cost structure
Maximizing sharing Network re-design Divestment of towers
Execution
Source: Company FilingsNote: Q3’15 numbers are based on IFRS accounting
Opex Growth YoY EBITDA %
33.7%
35.2%
36.7%
Q3'15 Q3'16 Q3'17
3.9%
1.4%
-5.1%
Q3'15 Q3'16 Q3'17

Strategic Pillars: Win with People
Build a high performance
culture
Learning, mentoring, succession
planning
Build capabilities
and help people grow
Execution
42

43
Enhancing leadership Position across Geographies
RMS1 Rank # of circles Avg. RMS
#1 13 43.4%
#2 6 28.4%
#3 3 19.9%
No 1 Share
No 2 Share
No 3 Share
1. For India RMS is as of Dec’2016. Includes Telenor (merger is subject to regulatory approvals)
2. For Africa, only for GSMA telecoms are considered
Source: TRAI; Company data, CIA World Factbook, World Bank
Market Position # of Countries
#1 5
#2 7
#3 3
Execution

44
BEST IN CLASS EXECUTION
Q3’17 highlights
• India – Broad based revenue growth across DTH, Homes, Enterprise segments. Mobile revenues hit in the
quarter due to competition and demonetization
– Continue healthy customer acquisitions in Mobile India; added 5.9mn customers in Q3’17
– Data volumes up 28.3% YoY
– Voice volumes grew 13.7% YoY
• Africa– Revenue growth 5.4% YoY in constant currency
– Data volumes up by 91.0% YoY, now 16.7% of mobile revenues
– Voice volumes up 10.1% YoY
– Airtel Money has 8.8 mn active customers, up 6.6% YoY, transacting c. $4.0 bn / quarter
Execution

STRONG CORPORATE
PROFILE

Financial flexibility & Balance Sheet Focus
Diversified debt profile; focus on deleveragingOver last 3 years:
Leverage: Net Debt (ex-DOT) to EBITDA down from 2.51x as of Mar 2013 to 1.45. Net Debt to EBITDA down from 3x to 2.7x (with fully loaded all spectrum auctions)
Average Maturity: Average tenors pushed out from 2 years to ~5 years
Diversified debt mix: 100% bank to a balanced mix of bonds, bank, ECA and DoT debt
Currency diversification: >75% USD weight to a mix of USD (41%), INR (37%), EUR (15%), Rest (7%)
Interest: 100% floating portfolio to predominantly a fixed portfolio
46
Strategic initiatives undertaken include Airtel QIP, Infratel IPO & further sell down
Deleveraging in Africa via tower sales and divestment of 2 countries to Orange

Highest Standards of Corporate Governance
Credit Rating and Information Services of India (“CRISIL”) has
assigned its Governance and Value Creation rating “CRISIL GVC Level
1” to the corporate governance and value creation practices of Bharti
Airtel
Quarterly financials audited on Ind-AS basis
Diversified Board – 50% independent directors
SingTel representatives on the Board of the company
Ranked first in a listing of 100 emerging market multinational
companies as part of a study on corporate transparency and reporting
by Transparency International
IG rating from 3 International Rating Agencies
47
Ranked #1 in FTI Consulting’s “India Disclosure Index” for Mandatory
& Voluntary disclosure practices, for the second year in a row

Summary
India & Africa remain attractive markets, with large opportunities
We are extremely well positioned
• Large customer base
• Only operator with diversified portfolio
• Scale leading to operating leverage
• Generating significant organic free cash
Bulk investments in place, asset restructuring in progress
• Spectrum
• Network
• Deleveraging via asset monetization (Tower sales, sale to Orange, Bangladesh
merger, Ghana merger)
We have to continue to drive best in class execution
48
………while maintaining strong balance sheet focus for returns as
well as enhanced financial flexibility

THANK YOU