beyond the risks to food availability – linking climatic ... · md abdullah al mamun...
TRANSCRIPT
ORIGINAL PAPER
Beyond the risks to food availability – linking climatic hazardvulnerability with the food access of delta-dwelling households
Md Mofakkarul Islam1& Md Abdullah Al Mamun2
Received: 20 February 2019 /Accepted: 20 November 2019 /Published online: 5 December 2019# The Author(s) 2019
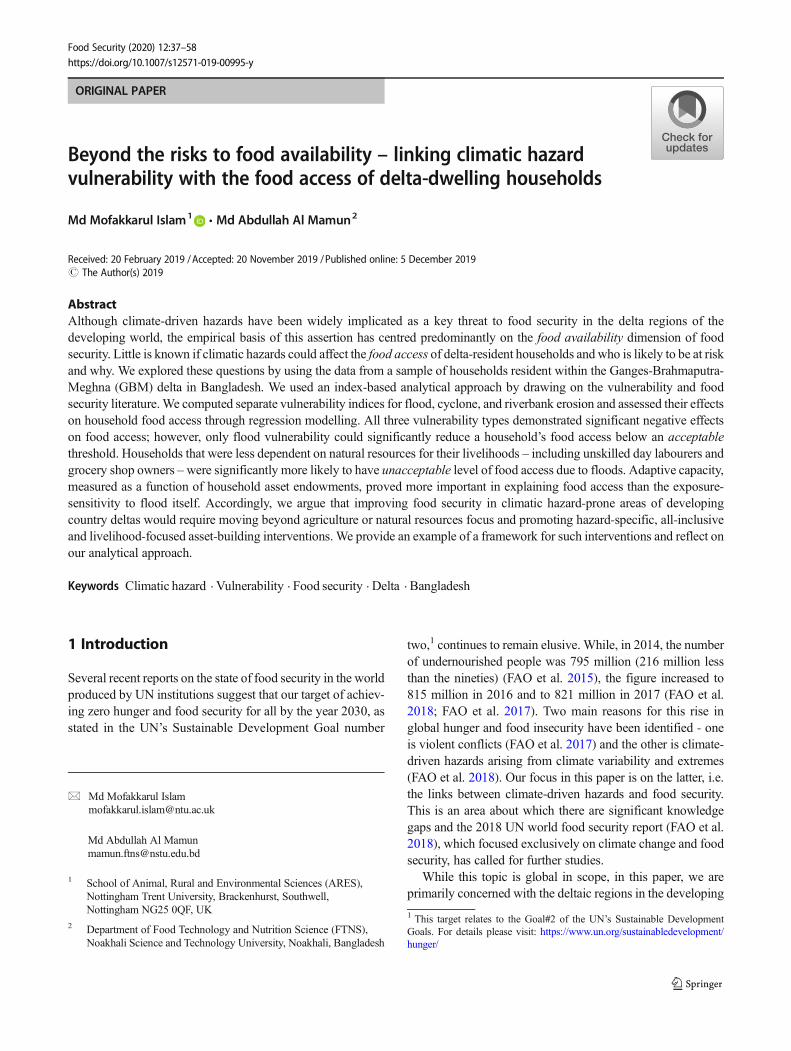
AbstractAlthough climate-driven hazards have been widely implicated as a key threat to food security in the delta regions of thedeveloping world, the empirical basis of this assertion has centred predominantly on the food availability dimension of foodsecurity. Little is known if climatic hazards could affect the food access of delta-resident households and who is likely to be at riskand why. We explored these questions by using the data from a sample of households resident within the Ganges-Brahmaputra-Meghna (GBM) delta in Bangladesh. We used an index-based analytical approach by drawing on the vulnerability and foodsecurity literature.We computed separate vulnerability indices for flood, cyclone, and riverbank erosion and assessed their effectson household food access through regression modelling. All three vulnerability types demonstrated significant negative effectson food access; however, only flood vulnerability could significantly reduce a household’s food access below an acceptablethreshold. Households that were less dependent on natural resources for their livelihoods – including unskilled day labourers andgrocery shop owners –were significantly more likely to have unacceptable level of food access due to floods. Adaptive capacity,measured as a function of household asset endowments, proved more important in explaining food access than the exposure-sensitivity to flood itself. Accordingly, we argue that improving food security in climatic hazard-prone areas of developingcountry deltas would require moving beyond agriculture or natural resources focus and promoting hazard-specific, all-inclusiveand livelihood-focused asset-building interventions. We provide an example of a framework for such interventions and reflect onour analytical approach.
Keywords Climatic hazard . Vulnerability . Food security . Delta . Bangladesh
1 Introduction
Several recent reports on the state of food security in the worldproduced by UN institutions suggest that our target of achiev-ing zero hunger and food security for all by the year 2030, asstated in the UN’s Sustainable Development Goal number
two,1 continues to remain elusive. While, in 2014, the numberof undernourished people was 795 million (216 million lessthan the nineties) (FAO et al. 2015), the figure increased to815 million in 2016 and to 821 million in 2017 (FAO et al.2018; FAO et al. 2017). Two main reasons for this rise inglobal hunger and food insecurity have been identified - oneis violent conflicts (FAO et al. 2017) and the other is climate-driven hazards arising from climate variability and extremes(FAO et al. 2018). Our focus in this paper is on the latter, i.e.the links between climate-driven hazards and food security.This is an area about which there are significant knowledgegaps and the 2018 UN world food security report (FAO et al.2018), which focused exclusively on climate change and foodsecurity, has called for further studies.
While this topic is global in scope, in this paper, we areprimarily concerned with the deltaic regions in the developing
1 This target relates to the Goal#2 of the UN’s Sustainable DevelopmentGoals. For details please visit: https://www.un.org/sustainabledevelopment/hunger/
* Md Mofakkarul [email protected]
Md Abdullah Al [email protected]
1 School of Animal, Rural and Environmental Sciences (ARES),Nottingham Trent University, Brackenhurst, Southwell,Nottingham NG25 0QF, UK
2 Department of Food Technology and Nutrition Science (FTNS),Noakhali Science and Technology University, Noakhali, Bangladesh
Food Security (2020) 12:37–58https://doi.org/10.1007/s12571-019-00995-y

world – for example, the Ganges-Brahmaputra-Meghna(GBM) and the Mahanadi deltas in Asia as well as the Nigerand Nile deltas in Africa. These regions not only have consid-erable prevalence of food insecurity, but also are widely iden-tified as vulnerable to global climate change and associatedhazards (Abdrabo et al. 2015; Arto et al. 2019; Dasgupta et al.2009; FAO et al. 2018; FAO et al. 2017; Lauria et al. 2018;Nicholls et al. 2018). This vulnerability is linked to theirunique physical characteristics (e.g. low elevation from sealevel and high flood probabilities) and socio-demographicprofiles (e.g. high population density, high prevalence of pov-erty, and commercial activities) (Alam 2012; Arto et al. 2019;van Driel et al. 2015; Ericson et al. 2006; IPCC 2007; Lauriaet al. 2018; Nicholls et al. 2018; Wright et al. 2012).Consequently, developing world deltas are frequently affectedby saline water intrusion, floods, riverbank and coastal ero-sions, underground water depletion, and storms and cyclones(Alam 2012; Arto et al. 2019; Dar et al. 2017; Masterson andGarabedian 2007; McElwee et al. 2017; Neumann et al.2015; Nicholls et al. 2018; Rasul et al. 2012). Evidenceprovided in the 2018 UN world food security report (FAOet al. 2018) indicate that such hazards have increased sig-nificantly in the last 20 years, with others suggesting thatthey are likely to aggravate due to global climate change(Dasgupta et al. 2011; IPCC 2007; Nicholls et al. 2018;Woodruff et al. 2013).
The vulnerability of the deltas and its implications for foodsecurity have received widespread attention; however, thepublished research on this issue suffer from notable shortcom-ings in their focus on the ‘human dimension’ of climatic haz-ards and food security. The overwhelming focus has been onthe vulnerabilities of the deltas (as physical or ecological en-tities), rather than on the vulnerabilities of the people livingwithin the deltas. Likewise, concerning food security, the pre-dominant focus has been on the risks to agricultural and fish-eries production (usually at sectoral, national, regional, orlandscape levels), that is, the availability dimension of foodsecurity (Abdrabo et al. 2015; Allison et al. 2009; Arto et al.2019; Clarke et al. 2018; Dar et al. 2017; Hughes et al. 2012;Krishnamurthy et al. 2014; Lauria et al. 2018; Liersch et al.2013; Rasul et al. 2012). In comparison, not many publishedresearch can be found on the ability of people to access foods,that is, the access dimension of food security. This deficiencyhas also been noticed bymany authors (e.g. Esham et al. 2018;Keller et al. 2018; van Soesbergen et al. 2017). Such short-comings are counterintuitive, since the term “food security”,according to its commonly accepted definition, refers primar-ily to food access (FAO 1996). Food production or supply iscertainly important for food security; however, the research ofNobel Laureate Amartya Sen (Sen 1981) suggests that hungerand famine, the most extreme manifestations of food insecu-rity, may occur even when foods are available, but people lackthe ability to access those foods. This evidence challenged the
erstwhile FAD (Food Availability Decline) view2 of food in-security prevalent in the late seventies. It also greatly influ-enced the redefinition, in the 1996World Food Summit, of thevery concept of “food security” from being a production issueto an access issue. Therefore, there is a need to move beyondnational or regional level food availability analysis and focuson food access at the individual and household levels.
Although the 2018 UN world food security report (FAOet al. 2018) touch upon the access issue, the empirical evi-dence linking climatic hazards and household food accesshave largely been extrapolated based on the impacts ofclimatic hazards on agricultural production and trades andthe consequent rise in food prices. It is also unclear who inthe deltas is likely to be food insecure because of climatichazards, and why. Although FAO et al. (2018) identifies thatthe most vulnerable are those whose livelihoods depend onagricultural and natural resources, it provides no direct evi-dence from the world’s deltas.
Accordingly, in this paper we aim to investigate if climate-driven hazards could affect the food access of the householdsresident within low-lying deltaic zones and who is likely to beat risk and why. To achieve these aims, we use the data col-lected from a sample of households resident within theGanges-Brahmaputra-Meghna (GBM) delta in Bangladesh.We apply an index-based analytical approach by drawing oninsights from the vulnerability and food security literature. Insection 2 we provide the analytical framework and then insection 3 describe the data source and research methods. Insection 4, we present the results of the research and, in section5, discuss those results and draw the study’s main conclusions.
2 Analytical framework
The term “vulnerability” is defined and interpreted in differentways (Cutter et al. 2009; IPCC 2007; Nelson et al. 2010).Here, we refer to the widely-cited definition provided by theIntergovernmental Panel on Climate Change (IPCC) that de-fines vulnerability as “the degree to which an environmentalor social system is susceptible to, and unable to cope with,adverse effects of climate change, including climate variabil-ity and extremes” (IPCC 2007: 883). According to the IPCC(2007), “vulnerability” (V) is a function of three variables –exposure (E), sensitivity (S), and adaptive capacity (AC). Erefers to the exposure of a system to the hazards caused by
2 In his writings Amartya Sen uses the terms “FAD view” or “FAD approach”to refer to the traditional and commonly-found approach to famine explanationin terms of a decline in food availability or supply. This term is now used byothers within the development community to refer to the discourses or viewsthat consider food insecurity solely or primarily as a problem of not havingadequate food production or supply.
38 Islam M.M., Al Mamun M.A.
climate variability or extremes, S refers to the degree to whicha system is affected by those hazards, and AC refers to theability of the system to avoid the damages caused by thosehazards. Many authors (Antwi-Agyei et al. 2012; Smit andWandel 2006) however argue that, at the household level ofanalysis, it may be difficult to separate E from S. This argu-ment is plausible, since a household cannot incur damage (S),unless E occurs first. Moreover, climatic hazards are macrolevel incidents (Dilley and Boudreau 2001) which makes itimmensely difficult to precisely assess the E of individualhouseholds to a specific hazard. Studies therefore measure Sor E as an integrated concept at household and even at higherlevel (Žurovec et al. 2017). Therefore, for household levelanalysis we could conceptualise Vas a function of ES and AC.
The commonly identified climatic hazards which the deltasare exposed to include: sea level rise, tidal surges, floods,tropical cyclones, salinity of soils and water bodies, and riv-erbank and coastal erosions (Anthony et al. 2015; Das 2017;Duncan et al. 2017; IPCC 2007; McElwee et al. 2017;Neumann et al. 2015; Nguyen 2007; Nicholls et al. 2018;Yang et al. 2011). The harms that these hazards could inflictare well-documented. The key ones include: declining agri-cultural productivity, destruction of crops, loss of livestock,loss of lives, damage to assets and properties, damage to in-frastructure, and disease outbreaks (AMS 1998; Bhattacharjeeand Behera 2018; Das 2017; Dar et al. 2017; Duncan et al.2017; Ericksen et al. 2011; IPCC 2007; Jutla et al. 2013;McElwee et al. 2017; Nguyen 2007; Nicholls et al. 2018).
Although the effects of these ES indicators on householdfood access in deltas is yet to be empirically established wecould expect a link according to Sen’s (1981) theory of enti-tlement. According to Sen, people’s ability to access food ismediated through four types of “entitlements” – production(growing food), trade (buying food), own labour (working forfood), and inheritance and transfer (receiving foods donatedby others). Intuitively, one could argue that the exposure toand damages from climatic hazards could undermine theseentitlements. For instance, saline water intrusion and conse-quent decline in farm productivity may erode a delta-residenthousehold’s ability to produce its own foods, i.e. cause a de-cline in its “production-based entitlement”. Disease and/ordeath of working age family members may reduce a house-hold’s ability to access foods through the sale of family labour(i.e. a failure in “labour-based entitlement”). It may also in-crease the household’s burden of care, which, in turn, couldaffect its ability to buy foods (de Waal and Whiteside 2003).Likewise, loss of livestock could deplete household incomeand resources (FAO 2016; FAO et al. 2018), leading to adecline in both production and trade-based entitlements (sincelivestock are sometimes used as buffer during periods ofcrisis).
Insights from the climate vulnerability literature, however,suggest that the link between ES and food access may not be
that straightforward. Humans are not merely the passive re-cipients of hazards, but they also can adjust to hazards, mod-erate potential damages, take advantage of opportunities, orcope with the consequences (Adger 1999; IPCC 2007;Vincent and Cull 2010; Vincent 2007). In the literature thisis defined as Adaptive Capacity (AC). Accordingly, re-searchers analyse vulnerability to climatic hazards as V =ES-AC (e.g. Hughes et al. 2012; Piya et al. 2016). This sug-gests that ES may not have a direct effect on food access.Rather, the difference between ES-AC, i.e. vulnerability, willdetermine whether a household’s food access will suffer fromclimatic hazards.
However, confusions are rife as to what exactly determinesthis AC (Vincent 2007). With insights from the SustainableLivelihoods literature (Chambers and Conway 1992; DFID1999), many researchers assess AC indirectly by using ahousehold’s possession of five types of assets or capitals –human, social, financial, natural, and physical – as proxy in-dicators (Adger and Kelly 1999; Antwi-Agyei et al. 2012;Piya et al. 2016; Wright et al. 2012). Assets, termed as “en-dowments”, is also a central element in the theory of entitle-ment (Devereux 2001; Sen 1981). According to Sen, it is byconverting their endowments into entitlements that house-holds acquire food. By combining this premise with theasset-based conceptualisation of AC in the climate vulnerabil-ity literature, we could argue that the more a household pos-sesses the five types of assets (endowments), the less vulner-able it will be to climatic hazards, and consequently, to thedisruption of food access, and vice versa.
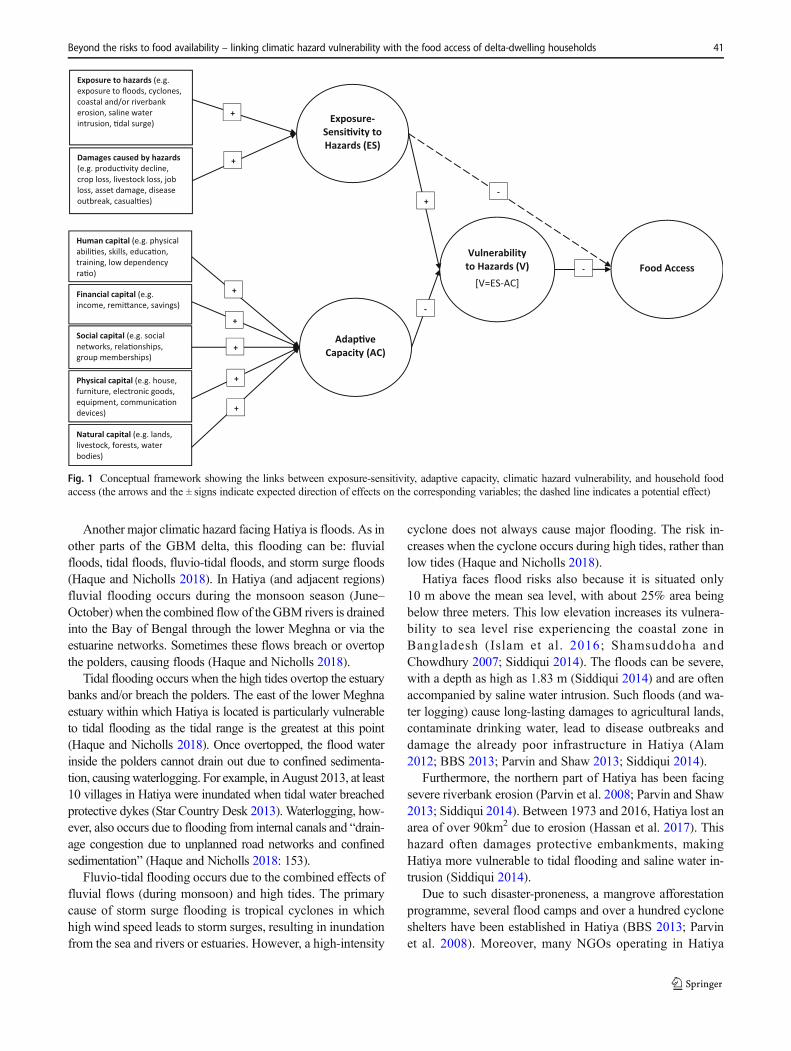
The roles of the five types of assets in enabling householdsto overcome climatic hazards are well-documented in the lit-erature, including examples from developing country deltas(Table 1). In consideration of this evidence and the literaturereviewed above, we conceptualise the links between ES, AC,V, and food access as in Fig. 1. Using this framework, we theninvestigate if there is an effect of ES and an effect of V onhousehold food access and how these effects interact withvarious livelihood groups living in a delta zone.
3 Data and methods
3.1 Data source
The data for this study came from a household survey con-ducted in the Hatiya Upazilla (sub-district) of NoakhaliDistrict in the South-eastern part of Bangladeshi coasts.Hatiya is located within the Ganges-Brahmaputra-Meghna(GBM) delta – one of the world’s largest deltas covering mostof Bangladesh and the Indian state of West Bengal and someparts of China, Nepal, and Bhutan. The GBM delta is formedby the flows of the three major river systems – The Ganges,Brahmaputra, and Meghna. Within the GBM, Hatiya is
Beyond the risks to food availability – linking climatic hazard vulnerability with the food access of delta-dwelling households 39
located at the eastern estuary of the Meghna river. It is formedby “deltaic lobes”, which consist of a series of smaller,shallower channels that branched-off from the Meghna riverwhile it emptied into the Bay of Bengal (Fig. 2). Thus, Hatiyalooks like an island (and is sometime called as such locally).The island has an area of ca. 1507Km2, of which 20% is forestreserve and around 22% is riverine area (BBS 2011).
Hatiya has a population of 453,000 in around 91,000households (BBS 2011). Agriculture contributes to over65% of the income, while non-agricultural labour contrib-utes to 5%, commerce 12%, service 4%, remittance 1%,and others 12% (Banglapedia 2015). The literacy rate inHatiya is 34% which is significantly lower than the nation-al average of 68%. Poverty, on the other hand, is muchhigher (64%) than the national average of 23% (BBS2013; BBS 2017), with one earlier study finding over50% being landless, two-thirds having a monthly house-hold income of Taka 5,000 only (ca. US$60), and the vast
proportion living in temporary houses with unhygienichanging latrines (Parvin et al. 2008).
Like other low-lying areas within the GBM delta, Hatiyafaces several climate-driven hazards, the most common onesbeing cyclones, floods, riverbank erosion, and salinity intru-sion. The island is in a pathway that cyclones affectingBangladesh commonly follow. Hatiya experienced disastrouscyclones in 1970, 1985, and 1991, leading to the death ofabout 130,000 people (Parvin et al. 2008). Successively,Hatiya and the adjoining islands were hit by cyclone Sidr in2007 and cyclone Aila in 2009, with devastating effects on thehouses, crops, household goods, livestock, and incomesources of over 100,000 inhabitants in 25,000 households(Alam 2012). The risks are far from being over. In fact, dueto rise in temperature, the intensity and frequency of cycloneshave increased in Bangladesh, with 70 high intensity cyclonesstriking the coastal areas in the last 200 years. Of these, 40%were in the Noakhali and Chittagong zone (Minar et al. 2013).
Table 1 Assets and their roles in enabling households to overcome climatic shocks and hazards
Assets Roles
Physical capital Physical assets – such as mobiles, TV, radio – indicate not only status and wealth, but also can help households toaccessweather information and early warning. Empirical studies in coastal Bangladesh (Wright et al. 2012) and SriLanka (Thathsarania and Gunaratneb 2018) found strong links between the ownership of these assets and AC.Ownership of permanent or structurally strong houses can provide securer shelter and thereby improve householdAC and reduce climate-related vulnerabilities, as observed in Vietnam delta (Tran et al. 2017), Sri Lanka(Thathsarania and Gunaratneb (2018), and Nepal (Piya et al. 2016).
Social capital Social capital in the forms of trust, reciprocity, group memberships, and networks can help households overcomeclimatic hazards by improving access to resources, information, institutional assistance, and collective action.Empirical evidence have been found in the coastal areas of Southeast Asia and the Caribbean (Adger 2003), SriLanka (Thathsarania and Gunaratneb 2018), Ethiopia (Demeke et al. 2011), Nepal (Piya et al. 2016), and coastalBangladesh (Jordan 2015; Parvin and Shaw 2013).
Natural capital Natural capital, such as lands and livestock, can help maintain productive activities (e.g. farming), generate income,and act as insurance in times of crisis. Amount of land ownership had a negative correlation with householdvulnerability to climatic hazards in Vietnam delta (Tran et al. 2017). Household landholding size had positiveeffects on AC against floods in the Indian state of West Bengal (Bhattacharjee and Behera 2018) and in theMahanadi delta of Odisha, India (Duncan et al. 2017). Livestock ownership improved AC and reduced householdvulnerability to climatic shocks in Ethiopia (Demeke et al. 2011), Peru (Sietz et al. 2012), and Nepal (Piya, Joshiand Maharjan (2016).
Human capital Higher education increases job opportunities (especially, off-farm employment); increases awareness of hazards andthe ability to understand early warning signals; and thus, can enhance AC and reduce vulnerability. Low educationcan have the opposite effects. Empirical evidence have been found in Bangladesh (Collins 2014; Quader et al.2017), Vietnam (Tran et al. 2017), Ethiopia (Demeke et al. 2011), Peru (Sietz et al. 2012), Nepal (Piya et al.(2016), and Sri Lanka (Thathsarania and Gunaratneb 2018).
Dependency ratio (more children and elderly people compared to working age adults) can reduce households’ abilityto overcome climatic shocks, e.g. due to burden of care. Evidence comes from theMyanmar delta (Oo et al. 2018),and Nepal (Piya et al. 2016.
Higher age can reduce physical abilities, thus reducing opportunities for employment and increasing the burden ofcare. Younger age can enhance the ability to work and to take quicker actions during hazards, and thus, canimprove adaptive capacity and reduce vulnerability, as found in Sri Lanka (Thathsarania and Gunaratneb 2018)and the Indian state of West Bengal (Bhattacharjee and Behera 2018).
Financial capital Income and savings can help households cope with climatic hazards, as found in Vietnam (Tran et al. 2017) andNepal (Piya et al. 2016). Non-agricultural income can enable households to adapt and quickly recover fromhazards impacts, as observed in Sri Lanka (Thathsarania and Gunaratneb 2018) and the Mahanadi delta (Duncanet al. 2017) and West Bengal (Bhattacharjee and Behera 2018) in India.
40 Islam M.M., Al Mamun M.A.
Another major climatic hazard facing Hatiya is floods. As inother parts of the GBM delta, this flooding can be: fluvialfloods, tidal floods, fluvio-tidal floods, and storm surge floods(Haque and Nicholls 2018). In Hatiya (and adjacent regions)fluvial flooding occurs during the monsoon season (June–October) when the combined flow of theGBM rivers is drainedinto the Bay of Bengal through the lower Meghna or via theestuarine networks. Sometimes these flows breach or overtopthe polders, causing floods (Haque and Nicholls 2018).
Tidal flooding occurs when the high tides overtop the estuarybanks and/or breach the polders. The east of the lower Meghnaestuary within which Hatiya is located is particularly vulnerableto tidal flooding as the tidal range is the greatest at this point(Haque and Nicholls 2018). Once overtopped, the flood waterinside the polders cannot drain out due to confined sedimenta-tion, causingwaterlogging. For example, inAugust 2013, at least10 villages in Hatiya were inundated when tidal water breachedprotective dykes (Star Country Desk 2013). Waterlogging, how-ever, also occurs due to flooding from internal canals and “drain-age congestion due to unplanned road networks and confinedsedimentation” (Haque and Nicholls 2018: 153).
Fluvio-tidal flooding occurs due to the combined effects offluvial flows (during monsoon) and high tides. The primarycause of storm surge flooding is tropical cyclones in whichhigh wind speed leads to storm surges, resulting in inundationfrom the sea and rivers or estuaries. However, a high-intensity
cyclone does not always cause major flooding. The risk in-creases when the cyclone occurs during high tides, rather thanlow tides (Haque and Nicholls 2018).
Hatiya faces flood risks also because it is situated only10 m above the mean sea level, with about 25% area beingbelow three meters. This low elevation increases its vulnera-bility to sea level rise experiencing the coastal zone inBangladesh (Islam et al. 2016; Shamsuddoha andChowdhury 2007; Siddiqui 2014). The floods can be severe,with a depth as high as 1.83 m (Siddiqui 2014) and are oftenaccompanied by saline water intrusion. Such floods (and wa-ter logging) cause long-lasting damages to agricultural lands,contaminate drinking water, lead to disease outbreaks anddamage the already poor infrastructure in Hatiya (Alam2012; BBS 2013; Parvin and Shaw 2013; Siddiqui 2014).
Furthermore, the northern part of Hatiya has been facingsevere riverbank erosion (Parvin et al. 2008; Parvin and Shaw2013; Siddiqui 2014). Between 1973 and 2016, Hatiya lost anarea of over 90km2 due to erosion (Hassan et al. 2017). Thishazard often damages protective embankments, makingHatiya more vulnerable to tidal flooding and saline water in-trusion (Siddiqui 2014).
Due to such disaster-proneness, a mangrove afforestationprogramme, several flood camps and over a hundred cycloneshelters have been established in Hatiya (BBS 2013; Parvinet al. 2008). Moreover, many NGOs operating in Hatiya
Exposure-Sensi�vity to Hazards (ES)
Adap�ve Capacity (AC)
Vulnerability to Hazards (V)
[V=ES-AC]Food Access
Human capital (e.g. physical abili�es, skills, educa�on, training, low dependency ra�o)
Financial capital (e.g. income, remi�ance, savings)
Social capital (e.g. social networks, rela�onships, group memberships)
Physical capital (e.g. house, furniture, electronic goods, equipment, communica�on devices)
Natural capital (e.g. lands, livestock, forests, water bodies)
Damages caused by hazards(e.g. produc�vity decline, crop loss, livestock loss, job loss, asset damage, disease outbreak, casual�es)
Exposure to hazards (e.g. exposure to floods, cyclones, coastal and/or riverbank erosion, saline water intrusion, �dal surge)
-
+
-
+
+
+
+
+
+
+
-
Fig. 1 Conceptual framework showing the links between exposure-sensitivity, adaptive capacity, climatic hazard vulnerability, and household foodaccess (the arrows and the ± signs indicate expected direction of effects on the corresponding variables; the dashed line indicates a potential effect)
Beyond the risks to food availability – linking climatic hazard vulnerability with the food access of delta-dwelling households 41

provide a range of services, including micro-credit, awarenessraising, drinking water purification, installation of sanitarylatrines, disaster information, construction of safe houses,and relief (Alam 2012; Parvin et al. 2008).
The above features make Hatiya particularly suitable toachieve the aims of this study. Not only is it highly vulnerableto climate-driven hazards, but also has a high incidence ofpoverty and food insecurity, including starvation (substantialreduction in meal numbers or not eating at all in a day) to copewith the impacts of climatic hazards (Parvin, Takahashi andShaw 2008).
Data for this study were collected during May–June 2018.A cluster sampling technique was used. At the initial stage,eight Unions3 out of eleven were randomly selected. Then,households from each of these Unions were randomly select-ed, totalling a sample size of 421 households (Table 2).
A structured questionnaire was used for data collection. Itincluded questions about whether or not the households wereexposed to cyclones, floods (tidal/monsoon or seasonal/storm-surge), and riverbank erosion in the last five years, and if yes,whether or not they experienced as a consequence of theirexposure to each of these hazards: (i) loss of life, (ii) loss ofcrops, (iii) loss of livestock, (iv) disease attack, (v) damage tohouse and/or household goods, and (vi) other damages. Thequestionnaire also included questions about the demographiccharacteristics of the households, their food access, and thefive types of assets – physical, financial, social, natural, andhuman capital (Table 3).
The questionnaire was translated from English to Bangla4
and pilot-tested before final administration. The data werecollected by the co-author of this paper (assisted by two re-search assistants) through face-to-face interviews with a mem-ber within each of the selected households. Nearly 46% (192)of the interviewees were household heads (main income
3 A Union is the lowest administrative unit at the local government level inBangladesh 4 Native language of Bangladesh
Fig. 2 Maps showing Bangladesh (left) and the study area Hatiya (right)(source: left – Maps of World, https://www.mapsofworld.com/bangladesh/bangladesh-political-map.html; right – Prime Minister’s
Office Library, Dhaka, Government of the People’s Republic ofBangladesh, http://lib.pmo.gov.bd/maps/images/noakhali/Hatiya.gif)
42 Islam M.M., Al Mamun M.A.

earner, almost all of them being males), about 42% (175) thespouses of the heads, 10% (43) the adult sons and daughters ofthe household heads, and the rest (2.6%) the other members(e.g. the parents of the household heads living in the samehousehold).
The study was conducted with strict adherence to ethicalguidelines. A formal ethical approval was obtained from theauthors’ affiliated institutions. Informed consents were obtain-ed from the elected Chairperson of the local government inHatiya and the households before conducting the interviews.Throughout the study anonymity and confidentiality of theparticipants were strictly maintained.
3.2 Measurement and analysis
3.2.1 Measuring food access
As many as nine proxy indicators for assessing householdfood access have been identified, each having unique advan-tages and limitations (Leroy et al. 2015). We used the FoodConsumption Score (FCS) proxy indicator developed andchampioned by the World Food Programme (WFP 2008).The FCS is one of the methodologically robust and mostcommonly-used tools for measuring household food access(Leroy et al. 2015; WFP 2008). The FCS was computed as acomposite score based on dietary diversity, food frequency,and relative nutritional importance of eight food groups. Thequestionnaire included location-specific food items for thosegroups. A seven days recall period was used, as per the WFP(2008) guideline. The respondents were first asked about thenumber of days each of the listed food items was consumedwithin the household. Consumption frequencies of the fooditems were then multiplied by the corresponding food groupweights as suggested by WFP (2008). The values were thensummed up to obtain the FCS for each household as per eq. 1.
FCS ¼ 2*xstaple þ 3*xpulse þ 1*xveg þ 1*xfruit þ 4*xanimal
þ 4*xdairy þ 0:5*xsugar þ 0:5*xoil ð1Þ
Where, x represents the number of days each food itemwasconsumed within a week.
The summated FCS scores were then categorised as: poor(scores up to 28), borderline (scores 28.5 to 42) and acceptable(scores ≥42.5) consumptions (WFP 2008). These higher cut-off points were used, since the sampled households and thepeople in Bangladesh, in general, consume sugar and oil al-most every day. Poor and borderline consumption categoriestogether were considered as “unacceptable” food access.
3.2.2 Measuring exposure-sensitivity (ES), adaptive capacity(AC), and vulnerability (V)
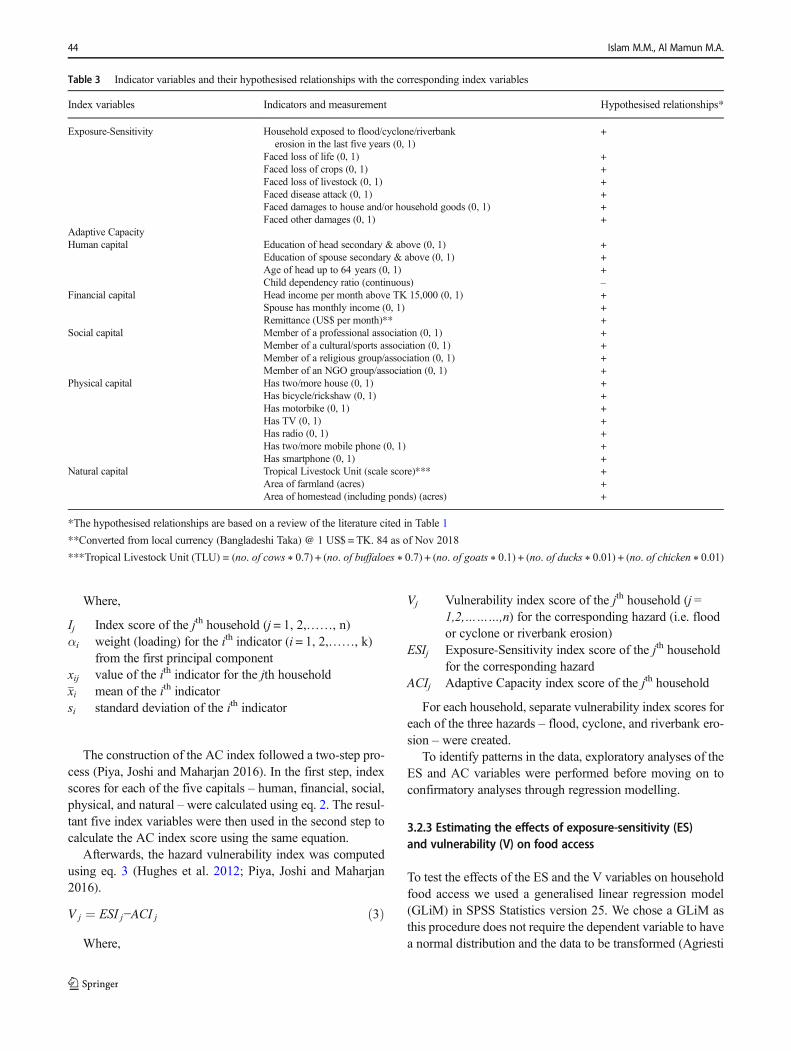
We used an index basedmethod tomeasure the ES, AC, and Vvariables. At first, we created separate indices for ES and AC,and then used these to calculate V (Hahn et al. 2009; Piya et al.2016). The ES and V indices were for flood, cyclone, andriverbank erosion each. The indicators of these indices wereidentified from the literature (Table 1) and validated throughlocal consultations in the study area. The indicators, theirhypothesised relationships with the corresponding index var-iables, and their literature sources are provided in Table 3. Inthe original questionnaire, some variables (e.g. education, in-come) were measured as ordinal-categorical which were latercoded as dummy variables as per guidelines in the literature(Córdova 2008; Filmer and Pritchett 2001; WFP 2017). Someindicator variables with very low (<5%) or very high (>95%)frequency counts in the data were excluded from analysis(WFP 2017).
After exploratory analyses, all the ES and AC indicatorswere standardised. Weights for each of the indicators werethen calculated. Some studies use an equal weighting method,but due to its arbitrariness it may lead to over- or under-weighting of indicators (Piya et al. 2016). Another method,based on expert judgements, may suffer from subjectivity andlack of agreement among experts (Piya et al. 2016).We, there-fore, used a popular method based on Principal ComponentAnalysis (PCA). After the seminal work of Filmer andPritchett (2001), this weighting method is now widely used,not only by researchers (e.g. Piya et al. 2016), but also inter-national programmes like the World Food Programme (WFP2017), Latin American Public Opinion Project (LAPOP)(Córdova 2008), and the Demographic and Health Surveys(DHS) programme. In the PCA, the indicator loadings onthe first principal component (PC1) were taken as the weightsof the indicators. Based on these, ES index scores for each ofthe hazards and for AC were created using eq. 2 (Córdova2008; Filmer and Pritchett 2001; Piya et al. 2016; WFP 2017).
I j ¼ ∑ki¼1αi
xij−xisi
" #ð2Þ
Table 2 Distribution of the sample used in this study
Name of Union Number of households % of the total sample
Burirchar 49 11.6
Char Ishwar 54 12.8
Tamaruddin 47 11.2
Jahajmara 50 11.9
Char king 53 12.6
Harni 59 14.0
Chandnandi 57 13.5
Nijhum Dwip 52 12.4
Total 421 100.0
Beyond the risks to food availability – linking climatic hazard vulnerability with the food access of delta-dwelling households 43
Where,
Ij Index score of the jth household (j = 1, 2,……, n)αi weight (loading) for the ith indicator (i = 1, 2,……, k)
from the first principal componentxij value of the ith indicator for the jth householdxi mean of the ith indicatorsi standard deviation of the ith indicator
The construction of the AC index followed a two-step pro-cess (Piya, Joshi and Maharjan 2016). In the first step, indexscores for each of the five capitals – human, financial, social,physical, and natural – were calculated using eq. 2. The resul-tant five index variables were then used in the second step tocalculate the AC index score using the same equation.
Afterwards, the hazard vulnerability index was computedusing eq. 3 (Hughes et al. 2012; Piya, Joshi and Maharjan2016).
V j ¼ ESI j−ACI j ð3Þ
Where,
Vj Vulnerability index score of the jth household (j =1,2,………,n) for the corresponding hazard (i.e. floodor cyclone or riverbank erosion)
ESIj Exposure-Sensitivity index score of the jth householdfor the corresponding hazard
ACIj Adaptive Capacity index score of the jth household
For each household, separate vulnerability index scores foreach of the three hazards – flood, cyclone, and riverbank ero-sion – were created.
To identify patterns in the data, exploratory analyses of theES and AC variables were performed before moving on toconfirmatory analyses through regression modelling.
3.2.3 Estimating the effects of exposure-sensitivity (ES)and vulnerability (V) on food access
To test the effects of the ES and the V variables on householdfood access we used a generalised linear regression model(GLiM) in SPSS Statistics version 25. We chose a GLiM asthis procedure does not require the dependent variable to havea normal distribution and the data to be transformed (Agriesti
Table 3 Indicator variables and their hypothesised relationships with the corresponding index variables
Index variables Indicators and measurement Hypothesised relationships*
Exposure-Sensitivity Household exposed to flood/cyclone/riverbankerosion in the last five years (0, 1)
+
Faced loss of life (0, 1) +Faced loss of crops (0, 1) +Faced loss of livestock (0, 1) +Faced disease attack (0, 1) +Faced damages to house and/or household goods (0, 1) +Faced other damages (0, 1) +
Adaptive CapacityHuman capital Education of head secondary & above (0, 1) +
Education of spouse secondary & above (0, 1) +Age of head up to 64 years (0, 1) +Child dependency ratio (continuous) –
Financial capital Head income per month above TK 15,000 (0, 1) +Spouse has monthly income (0, 1) +Remittance (US$ per month)** +
Social capital Member of a professional association (0, 1) +Member of a cultural/sports association (0, 1) +Member of a religious group/association (0, 1) +Member of an NGO group/association (0, 1) +
Physical capital Has two/more house (0, 1) +Has bicycle/rickshaw (0, 1) +Has motorbike (0, 1) +Has TV (0, 1) +Has radio (0, 1) +Has two/more mobile phone (0, 1) +Has smartphone (0, 1) +
Natural capital Tropical Livestock Unit (scale score)*** +Area of farmland (acres) +Area of homestead (including ponds) (acres) +
*The hypothesised relationships are based on a review of the literature cited in Table 1
**Converted from local currency (Bangladeshi Taka) @ 1 US$ = TK. 84 as of Nov 2018
***Tropical Livestock Unit (TLU) = (no. of cows ∗ 0.7) + (no. of buffaloes ∗ 0.7) + (no. of goats ∗ 0.1) + (no. of ducks ∗ 0.01) + (no. of chicken ∗ 0.01)
44 Islam M.M., Al Mamun M.A.

2007). The GLiM also offers the flexibility to model variouskinds of distribution, including binomial. Our FCS datadisplayed a non-normal distribution (Fig. 3) and we wantedto model the binary outcome of the FCS (i.e. unacceptableand acceptable food access). Hence, the GLiM procedure wasappropriate for us. The GLiM can be expressed as in eq. 4.
E FCSð Þ ¼ g μð Þ ¼ β0 þ ∑βixi ð4Þ
Where,
E(FCS) Expected values (means) of the Food ConsumptionScore (FCS) variable
g(μ) the link function (Identity) of FCS which in thiscase is the same asE(FCS) (i.e. no transformation ismade in the dependent variable FCS)
xi the ES index variables for flood, cyclone, andriverbank erosion (to test the effects of ES on foodaccess) or the V index variables for flood, cyclone,and riverbank erosion (to test the effects of Vonfood access)
β0 intercept of the modelβi regression coefficients
Afterwards, we categorised the FCS scores into a binaryvariable – “unacceptable access” (FCS scores ≤42) (coded 1)and “acceptable access” (FCS scores ≥42.5) (coded 0) – andfitted the variable into a binary logistic regression model (eq.5) in order to estimate the likelihood of a household havingunacceptable food access. For this as well, we used the GLiMprocedure in SPSS version 25.
lnp
1−p
� �¼ β0 þ ∑βixi ð5Þ
Where,
p the probability that the FCS variable takes thevalue of 1 (i.e. unacceptable access)
p1−p the odds of a household falling within the
unacceptable access categoryln p
1−p
� �the log link (Logit) of the FCS variable
We then estimated the odds of a household becoming foodinsecure from eq. 6.
p1−p
¼ eβ0þ∑βixi ð6Þ
Then, to identify which occupation groups in Hatiya werelikely to be affected, we estimated the “interaction effects”between the statistically significant vulnerability variable(s)in eq. 5 and the “main occupation of household head” variable(having seven categories – unskilled labourer, farmer, fisher-man, office employee, boatman, driver, and grocer). The odds
of each of these occupation groups to have unacceptable foodaccess were then calculated from eq. 6.
4 Results
4.1 Food access
The aggregate Food Consumption Scores ranged from 25.00to 105.50, with a mean of 53.97 and standard deviation of15.90. The distribution of the scores was non-normal (Fig.3). According to WFP’s (2008) suggested cut-off points, only1.9% of the households had poor consumption (scores up to28), nearly 24% had borderline consumption (scores 28.5 to42), and over 74% had acceptable consumption (scores≥42.5) (Fig. 4). The poor and borderline categories combined,
Food Consumption Score
120.0100.080.060.040.020.0
Freq
uenc
y (h
ouse
hold
s)
40.0
30.0
20.0
10.0
0.0
Mean = 53.9726Std. Dev. = 15.89593N = 419
Normality curve (Kolmogrov Smirnov p=0.002; Shapiro Wilk p=0.000)
Fig. 3 Food Consumption Scores (FCSs) of the sample households inHatiya
74.46%
23.63%
1.91%
Poorconsumption
Borderlineconsumption
Acceptableconsumption
Fig. 4 FCS categories of the sample households in Hatiya
Beyond the risks to food availability – linking climatic hazard vulnerability with the food access of delta-dwelling households 45
slightly over 25% of the households in Hatiya hadunacceptable food access.
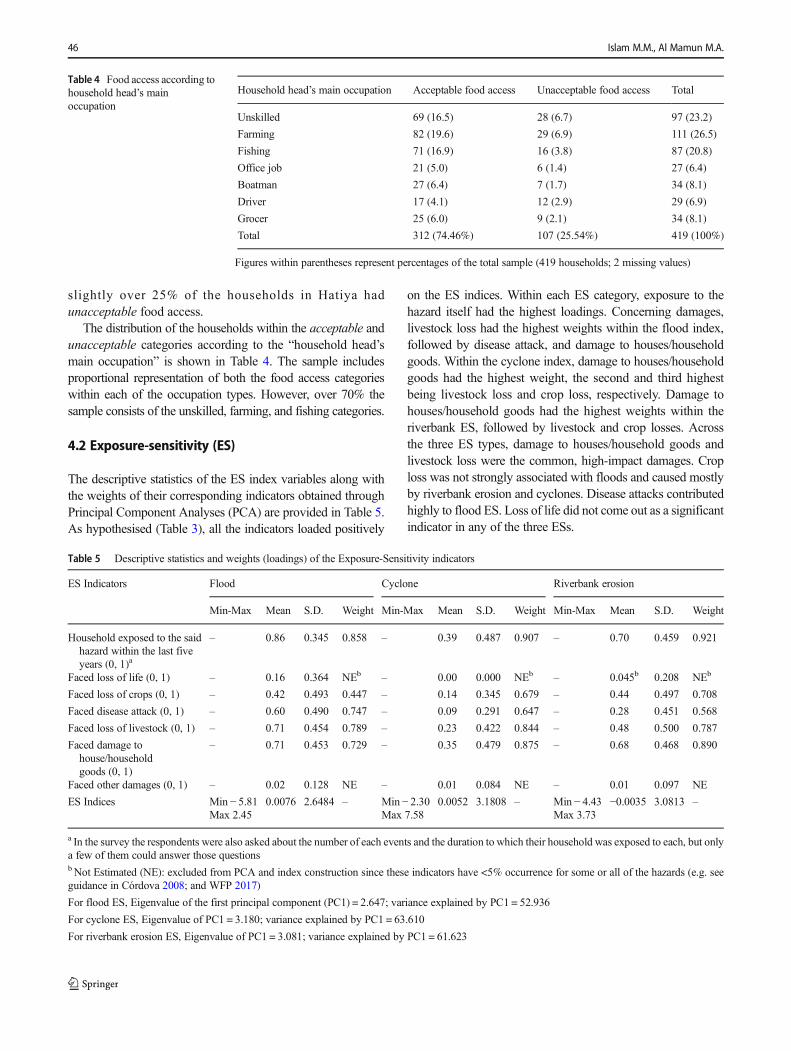
The distribution of the households within the acceptable andunacceptable categories according to the “household head’smain occupation” is shown in Table 4. The sample includesproportional representation of both the food access categorieswithin each of the occupation types. However, over 70% thesample consists of the unskilled, farming, and fishing categories.
4.2 Exposure-sensitivity (ES)
The descriptive statistics of the ES index variables along withthe weights of their corresponding indicators obtained throughPrincipal Component Analyses (PCA) are provided in Table 5.As hypothesised (Table 3), all the indicators loaded positively
on the ES indices. Within each ES category, exposure to thehazard itself had the highest loadings. Concerning damages,livestock loss had the highest weights within the flood index,followed by disease attack, and damage to houses/householdgoods. Within the cyclone index, damage to houses/householdgoods had the highest weight, the second and third highestbeing livestock loss and crop loss, respectively. Damage tohouses/household goods had the highest weights within theriverbank ES, followed by livestock and crop losses. Acrossthe three ES types, damage to houses/household goods andlivestock loss were the common, high-impact damages. Croploss was not strongly associated with floods and caused mostlyby riverbank erosion and cyclones. Disease attacks contributedhighly to flood ES. Loss of life did not come out as a significantindicator in any of the three ESs.
Table 4 Food access according tohousehold head’s mainoccupation
Household head’s main occupation Acceptable food access Unacceptable food access Total
Unskilled 69 (16.5) 28 (6.7) 97 (23.2)
Farming 82 (19.6) 29 (6.9) 111 (26.5)
Fishing 71 (16.9) 16 (3.8) 87 (20.8)
Office job 21 (5.0) 6 (1.4) 27 (6.4)
Boatman 27 (6.4) 7 (1.7) 34 (8.1)
Driver 17 (4.1) 12 (2.9) 29 (6.9)
Grocer 25 (6.0) 9 (2.1) 34 (8.1)
Total 312 (74.46%) 107 (25.54%) 419 (100%)
Figures within parentheses represent percentages of the total sample (419 households; 2 missing values)
Table 5 Descriptive statistics and weights (loadings) of the Exposure-Sensitivity indicators
ES Indicators Flood Cyclone Riverbank erosion
Min-Max Mean S.D. Weight Min-Max Mean S.D. Weight Min-Max Mean S.D. Weight
Household exposed to the saidhazard within the last fiveyears (0, 1)a
– 0.86 0.345 0.858 – 0.39 0.487 0.907 – 0.70 0.459 0.921
Faced loss of life (0, 1) – 0.16 0.364 NEb – 0.00 0.000 NEb – 0.045b 0.208 NEb
Faced loss of crops (0, 1) – 0.42 0.493 0.447 – 0.14 0.345 0.679 – 0.44 0.497 0.708
Faced disease attack (0, 1) – 0.60 0.490 0.747 – 0.09 0.291 0.647 – 0.28 0.451 0.568
Faced loss of livestock (0, 1) – 0.71 0.454 0.789 – 0.23 0.422 0.844 – 0.48 0.500 0.787
Faced damage tohouse/householdgoods (0, 1)
– 0.71 0.453 0.729 – 0.35 0.479 0.875 – 0.68 0.468 0.890
Faced other damages (0, 1) – 0.02 0.128 NE – 0.01 0.084 NE – 0.01 0.097 NE
ES Indices Min − 5.81Max 2.45
0.0076 2.6484 – Min − 2.30Max 7.58
0.0052 3.1808 – Min − 4.43Max 3.73
−0.0035 3.0813 –
a In the survey the respondents were also asked about the number of each events and the duration to which their household was exposed to each, but onlya few of them could answer those questionsb Not Estimated (NE): excluded from PCA and index construction since these indicators have <5% occurrence for some or all of the hazards (e.g. seeguidance in Córdova 2008; and WFP 2017)
For flood ES, Eigenvalue of the first principal component (PC1) = 2.647; variance explained by PC1 = 52.936
For cyclone ES, Eigenvalue of PC1 = 3.180; variance explained by PC1 = 63.610
For riverbank erosion ES, Eigenvalue of PC1 = 3.081; variance explained by PC1 = 61.623
46 Islam M.M., Al Mamun M.A.
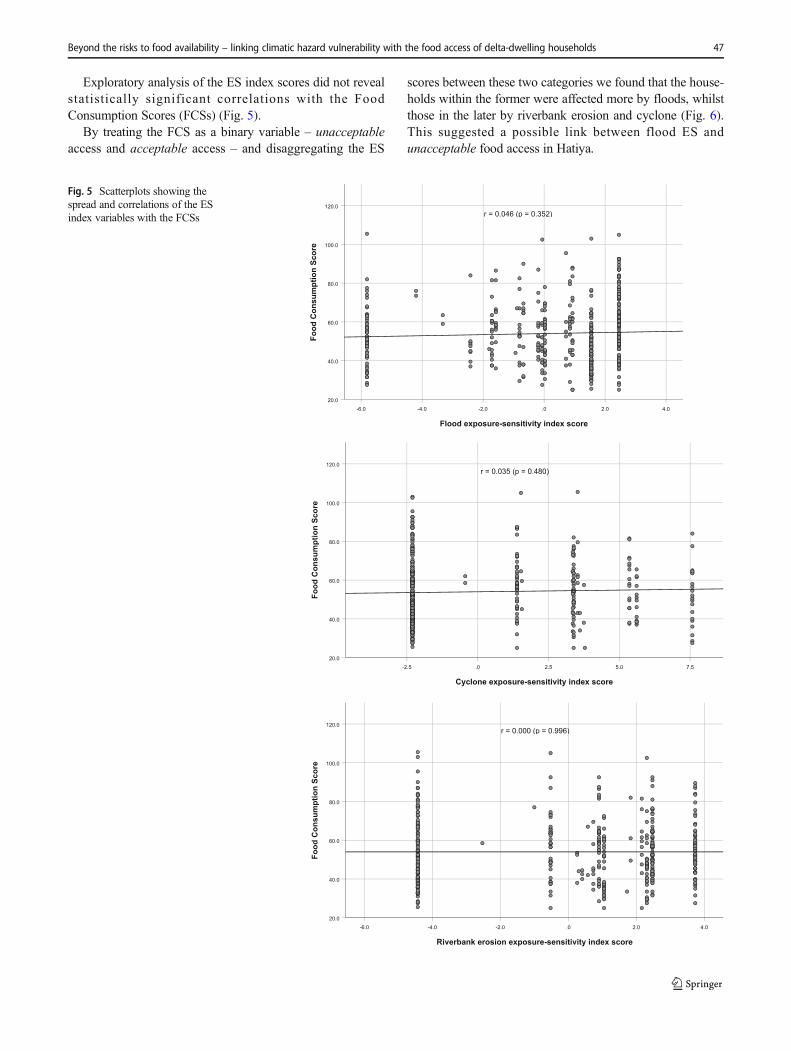
Exploratory analysis of the ES index scores did not revealstatistically significant correlations with the FoodConsumption Scores (FCSs) (Fig. 5).
By treating the FCS as a binary variable – unacceptableaccess and acceptable access – and disaggregating the ES
scores between these two categories we found that the house-holds within the former were affected more by floods, whilstthose in the later by riverbank erosion and cyclone (Fig. 6).This suggested a possible link between flood ES andunacceptable food access in Hatiya.
Flood exposure-sensitivity index score
4.02.0.0-2.0-4.0-6.0
Food
Con
sum
ptio
n Sc
ore
120.0
100.0
80.0
60.0
40.0
20.0
r = 0.046 (p = 0.352)
Cyclone exposure-sensitivity index score
7.55.02.5.0-2.5
Food
Con
sum
ptio
n Sc
ore
120.0
100.0
80.0
60.0
40.0
20.0
r = 0.035 (p = 0.480)
Riverbank erosion exposure-sensitivity index score
4.02.0.0-2.0-4.0-6.0
Food
Con
sum
ptio
n Sc
ore
120.0
100.0
80.0
60.0
40.0
20.0
r = 0.000 (p = 0.996)
Fig. 5 Scatterplots showing thespread and correlations of the ESindex variables with the FCSs
Beyond the risks to food availability – linking climatic hazard vulnerability with the food access of delta-dwelling households 47

By disaggregating the ES indices and food access cat-egories according to the household heads’ main occupa-tion, we found that flood ES was the highest amongst thegrocer within the unacceptable category (Fig. 7). Anothergroup, driver within the unacceptable category, also had ahigher flood ES compared to its counterpart in theacceptable category and so was the case of the unskilled.It suggested that flood ES might have a connection withunacceptable food access among the grocers, drivers, andunskilled labourers. However, the results did not show aclear pattern, since some groups, such as office employeeand boatman, had higher flood ES within the acceptablecategory (Fig. 7).
4.3 Adaptive capacity (AC)
The AC index was constructed in two steps. First, index scoresfor the five capitals – human, financial, social, physical, andnatural – were created. Second, these five indices were thenaggregated to create the AC index. The descriptive statistics ofthese indices, along with the weights of their correspondingindicators, are provided in Table 6.
Within the human capital (HC) index, the highestweightings (0.802 and 0.801) were for the education (second-ary and above) of household heads and spouses.Unexpectedly, however, child dependency ratio had a verysmall (0.052), but positive loading on HC.
Food access
UnacceptableAcceptable
Riverbankerosion ES
index
Cyclone ES index
Flood ES index
Mea
n
0.4
0.2
0.0
-0.2
-0.4
-0.6
Riverbankerosion ES
index
Cyclone ES index
Flood ES index
Fig. 6 Mean ES index scoreswithin acceptable andunacceptable food accesscategories
Food access
UnacceptableAcceptable
Main occupation of head
grocer
driverboatman
office job
fishingfarming
unskilled
Mea
n
3.0
2.0
1.0
0.0
-1.0
-2.0
Main occupation of head
grocer
driverboatman
office job
fishingfarming
unskilled
Riverbank erosion ES indexCyclone ES indexFlood ES index
Fig. 7 Mean ES index scores ofoccupation groups within theunacceptable and acceptablecategories
48 Islam M.M., Al Mamun M.A.
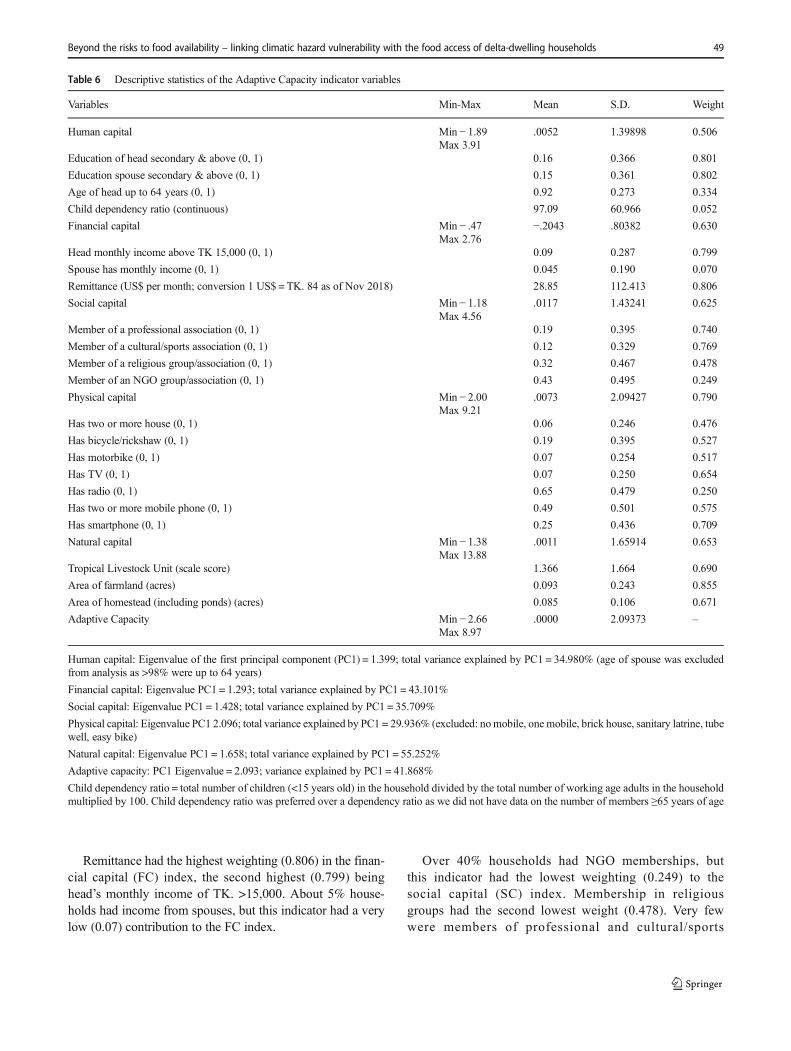
Remittance had the highest weighting (0.806) in the finan-cial capital (FC) index, the second highest (0.799) beinghead’s monthly income of TK. >15,000. About 5% house-holds had income from spouses, but this indicator had a verylow (0.07) contribution to the FC index.
Over 40% households had NGO memberships, butthis indicator had the lowest weighting (0.249) to thesocial capital (SC) index. Membership in religiousgroups had the second lowest weight (0.478). Very fewwere members of professional and cultural/sports
Table 6 Descriptive statistics of the Adaptive Capacity indicator variables
Variables Min-Max Mean S.D. Weight
Human capital Min − 1.89Max 3.91
.0052 1.39898 0.506
Education of head secondary & above (0, 1) 0.16 0.366 0.801
Education spouse secondary & above (0, 1) 0.15 0.361 0.802
Age of head up to 64 years (0, 1) 0.92 0.273 0.334
Child dependency ratio (continuous) 97.09 60.966 0.052
Financial capital Min − .47Max 2.76
−.2043 .80382 0.630
Head monthly income above TK 15,000 (0, 1) 0.09 0.287 0.799
Spouse has monthly income (0, 1) 0.045 0.190 0.070
Remittance (US$ per month; conversion 1 US$ = TK. 84 as of Nov 2018) 28.85 112.413 0.806
Social capital Min − 1.18Max 4.56
.0117 1.43241 0.625
Member of a professional association (0, 1) 0.19 0.395 0.740
Member of a cultural/sports association (0, 1) 0.12 0.329 0.769
Member of a religious group/association (0, 1) 0.32 0.467 0.478
Member of an NGO group/association (0, 1) 0.43 0.495 0.249
Physical capital Min − 2.00Max 9.21
.0073 2.09427 0.790
Has two or more house (0, 1) 0.06 0.246 0.476
Has bicycle/rickshaw (0, 1) 0.19 0.395 0.527
Has motorbike (0, 1) 0.07 0.254 0.517
Has TV (0, 1) 0.07 0.250 0.654
Has radio (0, 1) 0.65 0.479 0.250
Has two or more mobile phone (0, 1) 0.49 0.501 0.575
Has smartphone (0, 1) 0.25 0.436 0.709
Natural capital Min − 1.38Max 13.88
.0011 1.65914 0.653
Tropical Livestock Unit (scale score) 1.366 1.664 0.690
Area of farmland (acres) 0.093 0.243 0.855
Area of homestead (including ponds) (acres) 0.085 0.106 0.671
Adaptive Capacity Min − 2.66Max 8.97
.0000 2.09373 –
Human capital: Eigenvalue of the first principal component (PC1) = 1.399; total variance explained by PC1 = 34.980% (age of spouse was excludedfrom analysis as >98% were up to 64 years)
Financial capital: Eigenvalue PC1 = 1.293; total variance explained by PC1 = 43.101%
Social capital: Eigenvalue PC1 = 1.428; total variance explained by PC1 = 35.709%
Physical capital: Eigenvalue PC1 2.096; total variance explained by PC1 = 29.936% (excluded: nomobile, one mobile, brick house, sanitary latrine, tubewell, easy bike)
Natural capital: Eigenvalue PC1 = 1.658; total variance explained by PC1 = 55.252%
Adaptive capacity: PC1 Eigenvalue = 2.093; variance explained by PC1 = 41.868%
Child dependency ratio = total number of children (<15 years old) in the household divided by the total number of working age adults in the householdmultiplied by 100. Child dependency ratio was preferred over a dependency ratio as we did not have data on the number of members ≥65 years of age
Beyond the risks to food availability – linking climatic hazard vulnerability with the food access of delta-dwelling households 49

Adaptive capacity index score
10.07.55.02.5.0-2.5
Food
Con
sum
ptio
n Sc
ore
120.0
100.0
80.0
60.0
40.0
20.0
r = 0.526 (p = 0.000)
Fig. 8 Scatterplot showing thespread of AC and its correlationwith the FCSs
Food access
UnacceptableAcceptable
ACIndex
FCIndex
SCIndex
PCIndex
NCIndex
HCIndex
Mea
n
0.5
0.0
-0.5
-1.0
ACIndex
FCIndex
SCIndex
PCIndex
NCIndex
HCIndex
Fig. 9 Mean of the assets and ACindices within the unacceptableand acceptable categories(HC=Human Capital;NC=Natural Capital;PC=Physical Capital; SC=SocialCapital; FC=Financial Capital;AC =Adaptive Capacity)
Food access
UnacceptableAcceptable
Main occupation of head
grocer
driverboatman
office job
fishingfarming
unskilled
Mea
n ad
aptiv
e ca
paci
ty in
dex
3.0
2.0
1.0
0.0
-1.0
-2.0
Main occupation of head
grocer
driverboatman
office job
fishingfarming
unskilled
Fig. 10 Mean AC index scores ofoccupation groups within theunacceptable and acceptablecategories
50 Islam M.M., Al Mamun M.A.

associations, with the latter contributing the most (0.769)to the SC index.
Only 6% of the households had two or more houses, but ithad the second lowest weight (0.476) within the physical cap-ital (PC) index. The ownership of motorbike and TV was alsovery low, with the latter having the second highest weight(0.654). A quarter of the households had smartphones and thisindicator had the highest loading (0.709) on the PC index. Thelowest weight (0.250) was for radio ownership.
Around 65% of the sampled households had no farmlandsat all. Within the rest, land ownership ranged from 0.01 acre to2.8 acres only. This indicator had the highest loading (0.855)on the Natural Capital (NC) index, followed by livestock andhomesteads.
As expected, all the asset indices had positive contributionsto the AC index, with the highest coming from the PC indexand the lowest from the HC index (Table 6). The weightingsfor the other indices were very similar.
Exploratory analyses revealed a strong positive correlationbetween the Food Consumption Scores (FCSs) and the AC ofthe sampled households (Fig. 8).
Disaggregated analysis of the five asset indices and the ACindex between the unacceptable and acceptable food accesscategories are shown in Fig. 9. All the asset indices, and thusthe AC index, were considerably lower within theunacceptable category.
Further disaggregated analysis of the AC scores accordingto head’s main occupation is shown in Fig. 10. Unskilled,farmer, and fisher groups had very low AC, but those withinthe acceptable category, especially unskilled and farmergroups, looked slightly better-off. Boatman had the least ACof all the occupation groups, but those within theunacceptable category had lower AC than those in theacceptable category. Drivers within the unacceptable catego-ry had less AC. The grocer group within the acceptable cate-gory showed significantly higher AC than those within theunacceptable category. The picture was the same for the officejob holders.
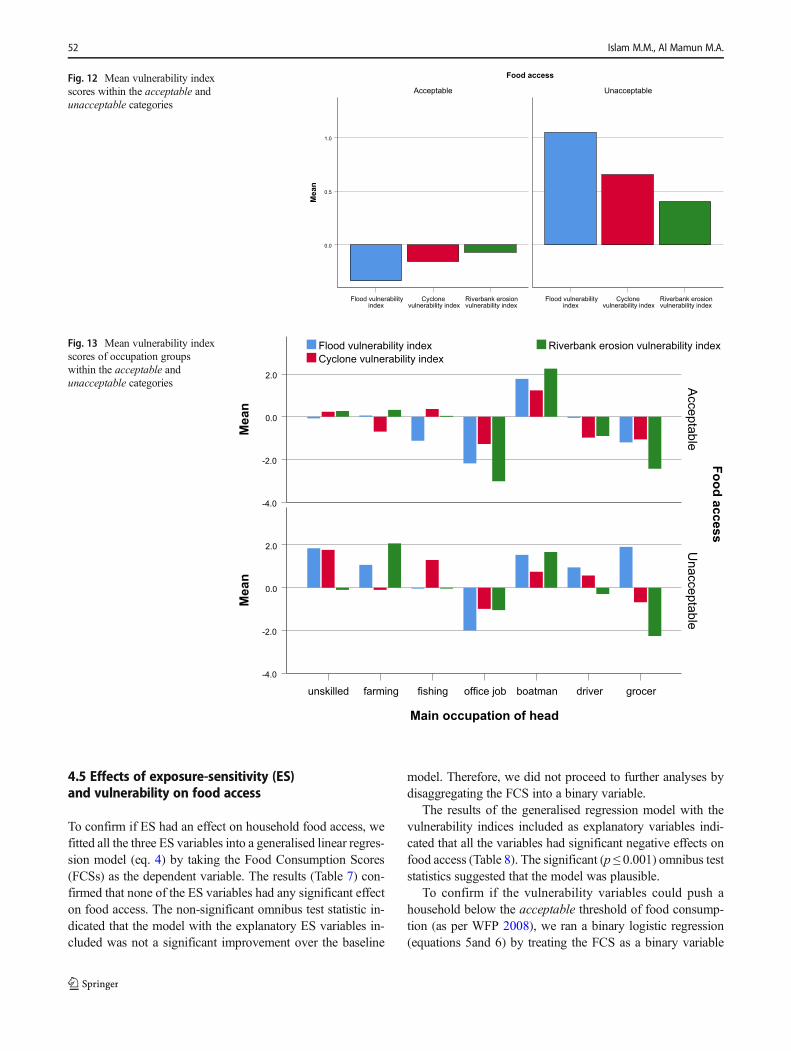
4.4 Vulnerability
The spread of the vulnerability index scores vis-à-vis the FoodConsumption Scores (FCSs) are shown in Fig. 11. A higherscore indicates a higher vulnerability of a household, and viceversa. Since the vulnerability scores were created by deductingthe AC scores from the ES scores, a positive vulnerability scorewould indicate that the household concerned had insufficientAC to address their ES to a hazard. All the three vulnerabilityindices showed strong negative correlations with the FCSs.
Disaggregation of the vulnerability scores between theunacceptable and acceptable categories revealed that thehouseholds within the former category had considerablyhigher vulnerabilities to all the three hazards compared to
the households within the latter category (Fig. 12). The vari-ation in flood vulnerability was the highest, followed by thevariations in cyclone and riverbank erosion vulnerabilities.This finding indicated that, whilst, all the vulnerabilities mighthave links with unacceptable food access, flood vulnerabilitymight have the strongest link.
Further disaggregation according to occupation groups re-vealed clear distinction between the acceptable andunacceptable categories (Fig. 13). Grocers within theunacceptable category showed higher flood vulnerabilityscores than those within the acceptable category. The samewas found for the driver, farmer, and unskilled groups. It waslikely, therefore, that flood vulnerability would have a linkwith unacceptable food access within these groups.
Flood vulnerability index score
4.02.0.0-2.0-4.0-6.0-8.0-10.0
Food
Con
sum
ptio
n Sc
ore
120.0
100.0
80.0
60.0
40.0
20.0
r = - 0.279 (p = 0.000)
Cyclone vulnerability index score
10.05.0.0-5.0-10.0-15.0
Food
Con
sum
ptio
n Sc
ore
120.0
100.0
80.0
60.0
40.0
20.0
r = - 0.294 (p = 0.000)
Riverbank erosion vulnerability index score
10.05.0.0-5.0-10.0-15.0
Food
Con
sum
ptio
n Sc
ore
120.0
100.0
80.0
60.0
40.0
20.0
r = - 0.289 (p = 0.000)
Beyond the risks to food availability – linking climatic hazard vulnerability with the food access of delta-dwelling households 51
Fig. 11 Scatterplots showing the spread of the vulnerability index scoresand their correlations with the FCSs
4.5 Effects of exposure-sensitivity (ES)and vulnerability on food access
To confirm if ES had an effect on household food access, wefitted all the three ES variables into a generalised linear regres-sion model (eq. 4) by taking the Food Consumption Scores(FCSs) as the dependent variable. The results (Table 7) con-firmed that none of the ES variables had any significant effecton food access. The non-significant omnibus test statistic in-dicated that the model with the explanatory ES variables in-cluded was not a significant improvement over the baseline
model. Therefore, we did not proceed to further analyses bydisaggregating the FCS into a binary variable.
The results of the generalised regression model with thevulnerability indices included as explanatory variables indi-cated that all the variables had significant negative effects onfood access (Table 8). The significant (p ≤ 0.001) omnibus teststatistics suggested that the model was plausible.
To confirm if the vulnerability variables could push ahousehold below the acceptable threshold of food consump-tion (as per WFP 2008), we ran a binary logistic regression(equations 5and 6) by treating the FCS as a binary variable
Food access
UnacceptableAcceptable
Riverbank erosion vulnerability index
Cyclonevulnerability index
Flood vulnerability index
Mea
n
1.0
0.5
0.0
Riverbank erosion vulnerability index
Cyclonevulnerability index
Flood vulnerability index
Fig. 12 Mean vulnerability indexscores within the acceptable andunacceptable categories
Food access
AcceptableU
nacceptable
Mea
n
2.0
0.0
-2.0
-4.0
Main occupation of head
grocerdriverboatmanoffice jobfishingfarmingunskilled
Mea
n
2.0
0.0
-2.0
-4.0
Riverbank erosion vulnerability indexCyclone vulnerability indexFlood vulnerability indexFig. 13 Mean vulnerability index
scores of occupation groupswithin the acceptable andunacceptable categories
52 Islam M.M., Al Mamun M.A.

(FCS ≤42.0 = unacceptable food access and FCS ≥42.5 =acceptable food access). In this model we treatedunacceptable as the response (coded as 1.0) and theacceptable as the reference category (coded as 0.0).
The results (Table 9) indicated that flood vulnerability wasthe only variable having a significant effect. The odds ratios(exponential of Beta) suggested that, given the other
vulnerability variables constant, the odds of a household witha flood vulnerability score of 1.0 to fall within theunacceptable category would be around 1.17 times (or 17%)higher than that of a household with a zero flood vulnerabilityscore (as per eq. 6). The significant (p ≤ 0.01) omnibus teststatistics indicated that the model was plausible.
To identify which occupational groups were likely to haveunacceptable food access due to floods, we estimated theinteraction effects of flood vulnerability and the householdheads’ main occupation. The results (Table 10) indicated thatgrocers and unskilled labourers were significantly more likelyto be affected. Of this, grocers appeared to be the worst affect-ed in terms of the corresponding odds ratio.
5 Discussion and conclusions
In this research we aimed to investigate if climatic hazardscould affect the food access of households resident inhazard-prone areas of developing country deltas and whowas likely to be at risk and why. To achieve these aims weapplied an analytical framework (section 2) consisting of fourconstructs: exposure-sensitivity (ES), adaptive capacity (AC),vulnerability (V), and food access (measured as FoodConsumption Scores). Accordingly, we explored, using datafrom a hazard-prone delta zone in Bangladesh, if there was aneffect of ES on food access, an effect of V (ES-AC) on foodaccess, and an effect on food access of the interactions be-tween V and households heads’ main occupation.
Our regression analysis confirmed that ES did not have a directeffect on food access (Table 7). Unlike ES, however, we foundsignificant negative effects of all the three V indices – flood,cyclone, and riverbank erosion – on food access (Table 8). Thisconfirmed that, rather than ES alone, it was the combined effectsof both the ES and AC that hampered food access.
Table 7 Effects of the ES variables on the household FoodConsumption Scores
Parameter Coeff. (B) Std. Error Wald Sig.
(Intercept) 53.975 .7773 4822.469 .000
ESfl .278 .3030 .842 .359
EScycl .160 .2478 .419 .518
ESre .069 .2613 .070 .791
Model: Genearlised linear regression model with Identity link function;Estimation: Maximum Likelihood
Omnibus Test: Likelihood Ratio Chi-sq. 1.312 (p = 0.726)
For missing values listwise deletion was used (N = 417 in the model)
ESfl, EScycl, and ESre refer to the exposure-sensitivity to flood, cycloneand river erosion, respectively
Table 8 Effects of the vulnerability variables on the household FoodConsumption Scores
Parameter Coeff. (B) Std. Error Wald Sig.
(Intercept) 54.769 .7374 5516.861 .000
Vfl −1.026 .2504 16.782 .000
Vcycl −.740 .2179 11.529 .001
Vre −.803 .1960 16.783 .000
Model: Genearlised linear regression model with Identity link function;Estimation: Maximum Likelihood
Omnibus Test: Likelihood Ratio Chi-sq. 71.795 (p = 0.000)
For missing values listwise deletion was used (N = 398 in the model)
Vfl, Vcycl, and Vre refer to the vulnerability to flood, cyclone, and river-bank erosion, respectively
Table 9 Effects of the vulnerability variables on the likelihood of ahousehold having an unacceptable level of food access
Parameter Coeff. (B) Std. Error Wald Sig. Exp(B)
(Intercept) −1.275 .1294 97.095 0.000 .279
Vfl .159 .0501 10.022 0.002 1.172
Vcycl .019 .0368 .275 0.600 1.019
Vre .009 .0347 .064 0.800 1.009
Model: Genearlised linear regression model with Logit link function;Estimation: Hybrid
Omnibus Test: Likelihood Ratio Chi-sq. 15.210 (p = 0.002)
For missing values listwise deletion was used (N = 398 in the model)
Table 10 Interaction effects of flood vulnerability and household head’soccupation on the odds of a household having unacceptable food access
Parameter B Std. Error Wald Sig. Exp(B)
(Intercept) −1.321 .1398 89.250 .000 .267
Unskilled * Vfl .251 .0971 6.690 .010 1.285
Farmer * Vfl .182 .0960 3.605 .059 1.200
Fisherman * Vfl .111 .0901 1.504 .220 1.117
Office * Vfl .075 .1827 .167 .683 1.078
Boatman * Vfl −.138 .1667 .685 .408 .871
Driver * Vfl .279 .2007 1.933 .164 1.322
Grocer * Vfl .543 .2302 5.557 .018 1.720
Model: Genearlised linear regression model with Logit link function;Estimation: Hybrid
Omnibus Test: Likelihood Ratio Chi-sq. 89.250 (p = 0.000)
For missing values listwise deletion was used (N = 398 in the model)
Beyond the risks to food availability – linking climatic hazard vulnerability with the food access of delta-dwelling households 53

However, by considering food access as a binary variable –unacceptable and acceptable –we found that flood vulnerabilitywas the only variable that could reduce a household’s food accessbelow an acceptable level (Table 9). These findings indicate thatsome hazards can be more significant than the others, and there-fore, vulnerability analyses and interventions aimed at improvinghousehold food access in deltas need to be location- and hazard-specific, rather than general (Vincent 2007).
Disaggregated analyses of ES and AC can help explain whyflood had such an effect. The households within the acceptablecategory had considerably lower flood ES (Fig. 6), but muchhigher AC (Fig. 9). In contrast, the households within theunacceptable category had higher flood ES (Fig. 6), but signifi-cantly lower AC (Fig. 9). The combined effects of these twovariables, therefore, made the households within theunacceptable category significantly vulnerable to floods.Moreover, unlike cyclone and riverbank erosion, the damagesinflicted by floods can be long-lasting. The ES indicators withinthe flood index (Table 5) suggest that in the current study areasuch damage occurred mainly through the loss of livestock(highest weight), disease attacks (second highest weight) anddamage to houses/household goods (third highest weight).Disease attack is particularly noteworthy. As shown in Table 5,across the three hazards, disease attack had the highest weight inthe flood ES and the lowest in the riverbank ES. Diseases canhave very long-lasting consequences on a household, such asincreased financial stress due to burden of care and reducedsupply of labour due to illness and death. This, in turn, couldworsen a household’s ability to access food (de Waal andWhiteside 2003). These findings indicate the need for food se-curity interventions in deltas to move beyond agricultural focusand adopt such measures as protecting livestock and houses aswell as preventing disease outbreaks following a hazard.
Regarding livelihood groups, our finding contradicts thebroad generalisation in the recent UN reports (FAO et al.2018; FAO 2016) that climatic hazards would particularlyaffect the food security of ‘natural-resource-based’ liveli-hoods. The effects of flood vulnerability on the farmer- andfishermen-headed households in our study were not signifi-cant (Table 10). In contrast, floods significantly affected thefood access of two non-natural-resource-based livelihoods,including small grocers and unskilled labourers (e.g. daylabourers and rickshaw pullers). Such observations raise theneed to make food security interventions in developing coun-try deltas ‘all-inclusive’ by considering all livelihood groups.Such a requirement is rarely specified in the current literatureon climate and food security, including the recent state of theworld’s food security reports (FAO et al. 2018; FAO 2016).
Disaggregated analyses shed light as to why the grocers andunskilled labourers were more likely to have unacceptable foodaccess. In this case as well, a combined effect of ES and AC canbe seen. The grocers within the unacceptable category hadmuch higher flood ES (Fig. 7), but much lower AC (Fig. 10)
compared to the grocers within the acceptable category. Thesame pattern can be observed for the unskilled.
Whilst, both ES and AC were found important in explaininghousehold food access, AC appeared to be more important.Exploratory analyses showed that none of the ES variableswas correlated with the Food Consumption Scores (Fig. 5).Unlike ES however, AC had a strong positive correlation(Fig. 8). Moreover, the ES scores did not show a clear patternof variation between the acceptable and unacceptable catego-ries. For example, the households within the acceptable cate-gory had higher ES to riverbank erosion and cyclones (Fig. 6).Similarly, flood ES was higher among the office job holdersand boatmen within the acceptable category (Fig. 7). However,what was common among all the households within theunacceptable category was that they had much lower ACscores compared to those in the acceptable category (Figs. 9and 10). Higher AC therefore explained why some households,e.g. within the office job holder group, managed to maintain anacceptable level of food consumption despite having higherES. Since, AC is conceptualised in this research and the widerliterature (see the references in Table 1) as a function of assets, itcan be inferred that efforts towards improving food access inhazard-prone deltas would require more emphasis on buildinghousehold assets, alongside preventing hazard exposure anddamages.
Our study provides two important lessons for such an asset-building approach. First, it shows that, all the five types ofassets considered in this study are important for AC, althoughtheir relative importance may vary. For instance, althoughphysical capital had the highest contribution to the AC index,the other assets including social, financial, natural, and humancapitals were almost equally important (Table 6). Therefore,the said asset-building approach needs to be holistic by goingbeyond traditional income-generation or cash support mea-sures and include such less-recognised measures as improvingvulnerable peoples’ organisational capacity and literacy.
Second, within each asset type, the emphasis on specificassets may vary (Table 6). Within the physical capital index,the possession of smart phones and multiple houses had thehighest weights. Not only are these manifestations of a house-hold’s wealth and status (which can help them access otherforms of capital), but also are crucial for climate-related AC(Table 1). Smart phones, for instance, can help people accesshazard early waring information, sometimes live throughInternet connections. TV (the indicator with the second highestweight within physical capital) can also enhance access to suchinformation. More mobile phones (third highest weight withinphysical capital) canmeanmore householdmembers being ableto access weather and early warning information.
Within financial capital, the highest weighting was for remit-tance (Table 6). Some households in our sample had membersworking overseas, especially in the Middle-Eastern countries.This study shows the importance of the money they send back
54 Islam M.M., Al Mamun M.A.
home. The next highest weighting was for the head’s monthlyincome of TK. >15,000. Improving the financial capital of vul-nerable households, therefore, would require promoting high-income and off-farm jobs, as found in other studies (see Table 1).
Similarly, membership of cultural/sports and professionalorganisations was quite important within the social capitalindex (Table 6). Membership in NGO groups, however, hadthe least contribution, probably because NGOs operating inthe region mostly provide micro-finance services, the impactsof which was found minimal in a previous study (Jordan2015). Improving vulnerable households’ social capital, there-fore, would require greater emphasis on supporting andstrengthening local institutions.
For natural capital, ownership of farmlands had the highestweight (Table 6), the importance of which is widely recognisedin the literature (see Table 1), implying the need for land distri-bution interventions to support the landless. Additionally, thesecondary and above level education of household heads andspouses had the highest effects on human capital, indicating theneed for promoting higher education in deltaic areas.
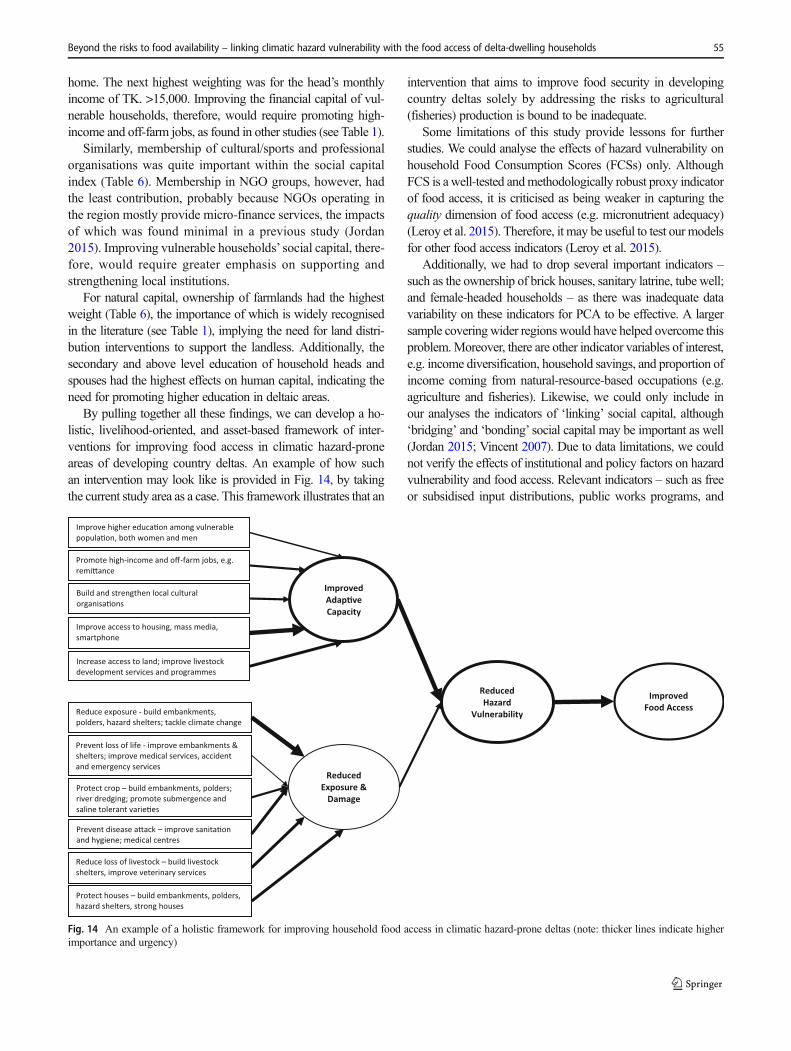
By pulling together all these findings, we can develop a ho-listic, livelihood-oriented, and asset-based framework of inter-ventions for improving food access in climatic hazard-proneareas of developing country deltas. An example of how suchan intervention may look like is provided in Fig. 14, by takingthe current study area as a case. This framework illustrates that an
intervention that aims to improve food security in developingcountry deltas solely by addressing the risks to agricultural(fisheries) production is bound to be inadequate.
Some limitations of this study provide lessons for furtherstudies. We could analyse the effects of hazard vulnerability onhousehold Food Consumption Scores (FCSs) only. AlthoughFCS is a well-tested andmethodologically robust proxy indicatorof food access, it is criticised as being weaker in capturing thequality dimension of food access (e.g. micronutrient adequacy)(Leroy et al. 2015). Therefore, it may be useful to test our modelsfor other food access indicators (Leroy et al. 2015).
Additionally, we had to drop several important indicators –such as the ownership of brick houses, sanitary latrine, tube well;and female-headed households – as there was inadequate datavariability on these indicators for PCA to be effective. A largersample covering wider regions would have helped overcome thisproblem.Moreover, there are other indicator variables of interest,e.g. income diversification, household savings, and proportion ofincome coming from natural-resource-based occupations (e.g.agriculture and fisheries). Likewise, we could only include inour analyses the indicators of ‘linking’ social capital, although‘bridging’ and ‘bonding’ social capital may be important as well(Jordan 2015; Vincent 2007). Due to data limitations, we couldnot verify the effects of institutional and policy factors on hazardvulnerability and food access. Relevant indicators – such as freeor subsidised input distributions, public works programs, and
Reduced Exposure &
Damage
Reduced Hazard
Vulnerability
Improve higher educa�on among vulnerable popula�on, both women and men
Promote high-income and off-farm jobs, e.g. remi�ance
Build and strengthen local cultural organisa�ons
Improve access to housing, mass media, smartphone
Increase access to land; improve livestock development services and programmes
Improved Adap�ve Capacity
Improved Food Access
Protect crop – build embankments, polders; river dredging; promote submergence and saline tolerant varie�es
Prevent loss of life - improve embankments & shelters; improve medical services, accident and emergency services
Prevent disease a�ack – improve sanita�on and hygiene; medical centres
Reduce loss of livestock – build livestock shelters, improve veterinary services
Protect houses – build embankments, polders, hazard shelters, strong houses
Reduce exposure - build embankments, polders, hazard shelters; tackle climate change
Fig. 14 An example of a holistic framework for improving household food access in climatic hazard-prone deltas (note: thicker lines indicate higherimportance and urgency)
Beyond the risks to food availability – linking climatic hazard vulnerability with the food access of delta-dwelling households 55
56 Islam M.M., Al Mamun M.A.
grain reserve management or food pricing policies (Devereux2007) –may be worth investigating. In addition, in any adaptivesystem having a human component, learning is an importantfactor. Therefore, further studies could consider this indicator.
Because of the cross-sectional nature of this research, it pro-vides only a snapshot in time. Such an approach has limitations,e.g. it cannot explain “chronic” (persistent, long-lasting) and “sea-sonal” food insecurities as well as the shifts in livelihood assetsover time due to hazard impacts. Future studies could use a longi-tudinal or historical approach combining time series or panel data.
Acknowledgements We thank all the individuals and organisations whohave supported this study. We are extremely grateful to the households inHatiya, Bangladesh, for providing data for this research. We also thank thetwo anonymous reviewers for their rigorous review of the manuscript andvaluable comments. The study was made possible through Nottingham TrentUniversity (NTU) funding support and a British Commonwealth scholarship.
Compliance with ethical standards
Conflict of interest The authors declare that they have no conflict of interest.
Open Access This article is distributed under the terms of the CreativeCommons At t r ibut ion 4 .0 In te rna t ional License (h t tp : / /creativecommons.org/licenses/by/4.0/), which permits unrestricted use,distribution, and reproduction in any medium, provided you give appro-priate credit to the original author(s) and the source, provide a link to theCreative Commons license, and indicate if changes were made.
References
Abdrabo, M. A., Hassaan, M. A., & Selmy, A. R. N. (2015). Economicvaluation of sea level rise impacts on agricultural sector in northerngovernorates of the Nile Delta. Low Carbon Economy, 6, 51–63.
Adger, W. N. (1999). Social vulnerability to climate change and extremesin coastal Vietnam. World Development, 27(2), 249–269.
Adger, W. N. (2003). Social capital, collective action, and adaptation toclimate change. Economic Geography, 79(4), 387–404.
Adger, W. N., & Kelly, P. M. (1999). Social vulnerability to climatechange and the architecture of entitlements. Mitigation andAdaptation Strategies for Global Change, 4(3), 253–266.
Agriesti, A. (2007). An introduction to categorical data analysis (2nded.). New Jersey: Wiley.
Alam, M.R. (2012). Climate change and its impact on health and liveli-hood within Hatiya Island of Bangladesh. Journal of agroforestryand environment, 6 (2): 13-16, 2012.
Allison, E. H., Perry, A. L., Badjeck, M.-C., Adger, N. W., Brown, K.,Conway, D., et al. (2009). Vulnerability of national economies to theimpacts of climate change on fisheries.Fish and Fisheries, 10, 173–196.
AMS (American Meteorological Society). (1998). Tropical cyclones andglobal climate change. A Post-IPCC Assessment. Bulletin of theAmerican Meteorological Society, 79, 19–38.
Anthony, E. J., Brunier, G., Besset, M., Goichot, M., Dussouillez, P., &Nguyen, V. L. (2015). Linking rapid erosion of the Mekong Riverdelta to human activities. Scientific Reports, 5, 14745. https://doi.org/10.1038/srep14745.
Antwi-Agyei, P., Dougill, A.J., Fraser, E.D.G., & Stringer, L.C. (2012).Characterising the nature of household vulnerability to climate var-iability: Empirical evidence from two regions of Ghana.
Environment, Development and Sustainability, https://doi.org/10.1007/s10668-012-9418-9.
Arto, I., García-Muros, X., Cazcarro, I., González-Eguino, M.,Markandya, A., & Hazra, S. (2019). The socioeconomic future ofdeltas in a changing environment. Science of the Total Environment,648(2019), 1284–1296.
Banglapedia (2015). National Encyclopaedia of Bangladesh [Online].Available at: http://en.banglapedia.org/index.php?title=Hatiya_Upazila (accessed 29/11/2018).
BBS. (Bangladesh Bureau of Statistics). (2011). Statistical yearbook ofBangladesh. Dhaka: Bangladesh Bureau of Statistics.
BBS. (Bangladesh Bureau of Statistics). (2013). District statistics 2011Noakhali. Dhaka: Bangladesh Bureau of Statistics.
BBS. (Bangladesh Bureau of Statistics). (2017). Statistical yearbook ofBangladesh 2017. Dhaka: Bangladesh Bureau of Statistics.
Bhattacharjee, K., & Behera, B. (2018). Determinants of household vul-nerability and adaptation to floods: Empirical evidence from theIndian state of West Bengal. International Journal of Disaster RiskReduction, 31, 758–769.
Chambers, R., & Conway, G. (1992). Sustainable rural livelihoods:Practical concepts for the 21st century. In IDS discussion paper296. Sussex: Institute of Development Studies.
Clarke, D., Lazar, A. N., Saleh, A. F. M., & Jahiruddin, M. (2018).Prospects for agriculture under climate change and soil salinisation.In R. J. Nicholls et al. (Eds.), Ecosystem Services for Well-being indeltas (pp. 447–467). Switzerland: Palgrave Macmillan.
Collins, J. (2014). A rising tide in Bangladesh: Livelihood adaptation toclimate stress. Australian Geographer, 45, 289–307.
Córdova, A. (2008). Methodological Note: Measuring Relative Wealthusing Household Asset Indicators. Americas Barometer Insights,2008 (No. 6). Available at: https://www.vanderbilt.edu/lapop/insights/I0806en_v2.pdf (accessed 15/10/2018).
Cutter, S. L., Emrich, C. T., Webb, J. J., & Morath, D. (2009). Socialvulnerability to climate variability hazards: A review of the litera-ture. Final report to Oxfam America. Columbia: Hazards andVulnerability Research Institute, University of South Carolina.
Dar, M. H., Chakravorty, R., Waza, S. A., Sharma, M., Zaidi, N. W.,Singh, A. N., et al. (2017). Transforming rice cultivation in floodprone coastal Odisha to ensure food and economic security. FoodSecurity, 9(4), 711–722.
Das, D. (2017). Tropical cyclones and coastal communities: The dialec-tics of social and environmental change in the Sundarban delta.Journal of the Indian Ocean Region, 13(2), 257–275.
Dasgupta, S., Laplante, B., Meisner, C., Wheeler, D., & Yan, J. (2009).The impact of sea level rise on developing countries: A comparativeanalysis. Climatic Change, 93, 379–388.
Dasgupta, S., Laplante, B., Murray, S., & Wheeler, D. (2011). Exposureof developing countries to sea-level rise and storm surges. ClimaticChange, 106, 567–579.
de Waal, A., & Whiteside, A. (2003). New variant famine: AIDS andfood crisis in southern Africa. The Lancet, 362(9391), 1234–1237.
Demeke, A. B., Keil, A., & Zeller, M. (2011). Using panel data to estimatethe effect of rainfall shocks on smallhers food security and vulnera-bility in rural Ethiopia. Climatic Change, 108(1–2), 185–206.
Devereux, S. (2001). Sen’s Entitlement Approach: Critiques andCounter-critiques. Oxford Development Studies, 29(3), 245–263.
Devereux, S. (2007). The impact of droughts and floods on food securityand policy options to alleviate negative effects. AgriculturalEconomics, 37(1), 47–58.
DFID. (1999). Sustainable livelihoods guidance sheets. London, UK:Department for International Development.
Dilley, M., & Boudreau, T. E. (2001). Coming to terms with vulnerability: Acritique of the food security definition. Food Policy, 26(3), 229–247.
vanDrielW.F., Bucx, T.,Makaske, A., van deGuchte C., van der Sluis T.,Biemans, H., et al. (2015). Vulnerability assessment of deltas intransboundary river basins. Delta Alliance contribution to the

Beyond the risks to food availability – linking climatic hazard vulnerability with the food access of delta-dwelling households 57
Transboundary water assessment program, river basins assessment.Delta Alliance report 9. Delta Alliance international, Wageningen –Delft, the Netherlands.
Duncan, J. M., Tompkins, E. L., Dash, J., & Tripathy, B. (2017).Resilience to hazards: Rice farmers in the Mahanadi Delta, India.Ecology and Society, 22(4), 3.
Ericksen, P., Thornton, P., & Notenbaert, A. (2011).Mapping hotspots ofclimate change and food insecurity in the global tropics. Nairobi:International Livestock Research Institute.
Ericson, J. P., Vörösmarty, C. J., Dingman, S. L., Ward, L. G., &Meybeck, M. (2006). Effective Sea-level rise and deltas: Causes ofchange and human dimension implications. Global and PlanetaryChange, 50(1–2), 63–82.
Esham, M., Jacobs, B., Rosairo, H. S. R., & Siddighi, B. B. (2018).Climate change and food security: A Sri Lankan perspective.Environment, Development and Sustainability, 20(3), 1017–1036.
FAO. (1996). Rome Declaration onWorld Food Security andWorld FoodSummit Plan of Action. World Food Summit, 13–17 November,1996, Rome.
FAO, IFAD & WFP. (2015). The State of Food Insecurity in the World2015.Meeting the 2015 international hunger targets: Taking stock ofuneven progress. Rome: FAO.
FAO, IFAD, UNICEF,WFP&WHO. (2017). The State of Food Securityand Nutrition in the World 2017. Building resilience for peace andfood security. Rome: FAO.
FAO, IFAD, UNICEF,WFP&WHO. (2018). The State of Food SecurityandNutrition in theWorld 2018. Building climate resilience for foodsecurity and nutrition. Rome: FAO.
FAO. (2016). The state of food and agriculture 2016: Climate change,agriculture and food security. Rome.
Filmer, D., & Pritchett, L. H. (2001). Estimating wealth effects withoutexpenditure data - or tears: An application to educational enrolmentsin states of India. Demography, 38(1), 115–132.
Hahn, M. B., Riederer, A. M., & Foster, S. O. (2009). The livelihoodvulnerability index: A pragmatic approach to assessing risks fromclimate variability and change – A case study in Mozambique.Global Environmental Change, 19, 74–88.
Haque, A., & Nicholls, R. (2018). Floods and the Ganges-Brahmaputra-Meghna Delta. In R. J. Nicholls et al. (Eds.), Ecosystem Services forWell-being in deltas (pp. 147–159). Switzerland: PalgraveMacmillan.
Hassan, S.M. T., Syed,M. A., &Mamnun, N. (2017). Estimating erosionand accretion in the coast of Ganges-Brahmaputra-Meghna delta inBangladesh. In Paper presented at the 6th international conferenceon Water & Flood Management (ICWFM-2017), 4–6 march 2017.Dhaka: Bangladesh.
Hughes, S., Yau, A., Max, L., Petrovic, N., Davenport, F., Marshall, M.,et al. (2012). A framework to assess national level vulnerability fromthe perspective of food security: The case of coral reef fisheries.Environmental Science & Policy, 23, 95–108.
IPCC. (2007). Climate change 2007: Impacts, adaptation and vulnera-bility: Contribution of working group II to the fourth assessmentreport of the intergovernmental report on climate change.Cambridge: Cambridge University Press.
Islam, M., Huda, M., & Islam, S. M. D. (2016). Changing croppingpattern in disaster prone region of Bangladesh: A case study.Jahangirnagar University Environment Bulletin, 5, 25–36.
Jordan, J. C. (2015). Swimming alone? The role of social capital in en-hancing local resilience to climate stress: A case study fromBangladesh. Climate and Development, 7(2), 110–123. https://doi.org/10.1080/17565529.2014.934771.
Jutla, A., Whitcombe, E., Hasan, N., Haley, B., Akanda, A., Huq, A., et al.(2013). Environmental factors influencing epidemic cholera. AmericanSociety of Tropical Medicine and Hygiene, 89(3), 597–607.
Keller, M., Zamudio, A. N., Bizikova, L., Sosa, A. R., & Gough, A. M.(2018). Food security and climate change from a systems
perspective: Community case studies from Honduras. Climate andDevelopment, 10(8), 742–754.
Krishnamurthy, P. K., Lewis, K., & Choularton, R. J. (2014). A methodolog-ical framework for rapidly assessing the impacts of climate risk onnational-level food security through a vulnerability index. GlobalEnvironmental Change –Human and Policy Dimensions, 25, 121–132.
Lauria, V., Das, I., Hazra, S., Cazcarro, I., Arto, I., Kay, S., et al. (2018).Importance of fisheries for food security across three climate changevulnerable deltas. Science of the Total Environment, 640–641,1566–1577.
Leroy, J. L., Ruel, M., Frongillo, E. A., Harris, J., & Ballard, T. J. (2015).Measuring the food access dimension of food security: A criticalreview and mapping of indicators. Food and Nutrition Bulletin,36(2), 167–195.
Liersch, S., Cools, J., Kone, B., Koch, H., Diallo, M., Reinhardt, J., et al.(2013). Vulnerability of rice production in the inner Niger Delta towater resources management under climate variability and change.Environmental Science & Policy, 34, 18–33.
Masterson, J. P., & Garabedian, S. P. (2007). Effects of sea-level rise onground water flow in a coastal aquifersystem. Ground Water, 45(2),209–217.
McElwee, P., Nghiem, T., Le, H., & Vu, H. (2017). Flood vulnerabilityamong rural households in the red River Delta of Vietnam:Implications for future climate change risk and adaptation. NaturalHazards, 86, 465–492.
Minar, M., Hossain, M., & Shamsuddin, M. (2013). Climate change andcoastal zone of Bangladesh: Vulnerability, resilience and adaptabil-ity. Middle-East Journal of Scientific Research, 13(1), 114–120.
Nelson, R., Kokic, P., Crimp, S., Meinke, H., & Howden, S. M. (2010).The vulnerability of Australian rural communities to climate vari-ability and change: Part I - conceptualizing and measuring vulnera-bility. Environmental Science and Policy, 13, 8–17.
Neumann, J. E., Emanuel, K. A., Ravela, S., Ludwig, L. C., & Verly, C.(2015). Risks of coastal storm surge and the effect of sea level rise inthe red River Delta, Vietnam. Sustainability, 7(6), 6553–6572.https://doi.org/10.3390/su7066553.
Nguyen, H.N. (2007). Flooding in Mekong River Delta, Vietnam. UNDPocas s i ona l pape r 2007 /53 . Ava i l ab l e a t f i l e : / / /E : /F S _ m a n u s c r i p t _ r e s u b m i s s i o n /M am u n%2 0 d a t a% 2 0 a n a l y s i s% 2 0 o n% 2 0 h o l i d a y /Mamun%20data%20analysis/literature/Nguyen%202007-disease%20flood%20vietnam%20delta.Pdf (last accessed on 20/09/2019).
Nicholls, R. J., Hutton, C. W., Adger, W. N., Hanson, S. E., Rahman, M.M., & Salehin, M. (Eds.). (2018). Ecosystem Services for Well-beingin deltas – Integrated assessment for policy analysis. Switzerland:Palgrave Macmillan.
Oo, A. T., Huylenbroeck, G. V., & Speelman, S. (2018). Assessment ofclimate change vulnerability of farm households in Pyapon District,a delta region in Myanmar. International Journal of Disaster RiskReduction, 28, 10–21.
Parvin, G., & Shaw, R. (2013). Microfinance institutions and a coastalcommunity’s disaster risk reduction, response, and recovery pro-cess: A case study of Hatiya, Bangladesh. Disasters, 37(1), 165–184.
Parvin, G. A., Takahashi, F., & Shaw, R. (2008). Coastal hazards andcommunity coping methods in Bangladesh. Journal of CoastalConservation, 12, 181–193.
Piya, L., Joshi, N. P., &Maharjan, K. L. (2016). Vulnerability of Chepanghouseholds to climate change and extremes in the Mid-Hills ofNepal. Climatic Change, 135, 521–537. https://doi.org/10.1007/s10584-015-1572-2.
Quader, M. A., Khan, A. U., & Kervyn, M. (2017). Assessing the risksfrom cyclones for human lives and livelihoods in the coastal regionof Bangladesh. International Journal of Environmental Research
58 Islam M.M., Al Mamun M.A.
and Public Health, 14 , 831. ht tps: / /doi .org/10.3390/ijerph14080831.
Rasul, G., Mahmood, A., Sadiq, A., &Khan, S. I. (2012). Vulnerability ofthe Indus Delta to climate change in Pakistan. Pakistan Journal ofMeteorology, 8(16), 89–107.
Sen, A. K. (1981). Poverty and famines: An essay on entitlement anddeprivation. Oxford: Clarendon Press.
Shamsuddoha, M. & Chowdhury, R.K. (2007). Climate Change Impactand Disaster Vulnerabilities in the Coastal Areas of Bangladesh.Dhaka: COAST Trust.
Siddiqui, M. R. (2014). Patterns and factors of out-migration in theMeghna Estuarine Islands of Bangladesh. GEOGRAFIA online.Malaysian Journal of Society and Space, 10(1), 11–24.
Sietz, D., Choque, S. E. M., & Ludeke, M. K. B. (2012). Typical patternsof smallholder vulnerability to weather extremes with regard to foodsecurity in the PeruvianAltiplano.Regional Environmental Change,12(3), 489–505.
Smit, B., & Wandel, J. (2006). Adaptation, adaptive capacity and vulner-ability. Global Environmental Change, 16(3), 282–292.
Star Country Desk (2013, August 21). Over 60 villages flooded in Bhola,Hatiya. Retried from https://www.thedailystar.net/news/over-60-villages-flooded-in-bhola-hatiya (accessed on 16/09/2019).
Thathsarania, U. S., & Gunaratneb, L. H. P. (2018). Constructing andindex to measure the adaptive capacity to climate change in SriLanka. Procedia Engineering, 212, 278–285.
Tran, H., Nguyen, Q., & Kervyn, M. (2017). Household social vulnera-bility to natural hazards in the coastal tan Van Thoi District, Ca MauProvince, Mekong Delta, Vietnam. Journal of CoastalConservation, 21(4), 489–503.
van Soesbergen, A., Nilsen, K., Burgess, N.D., Szabo, S., &Matthews, Z.(2017). Food and nutrition security trends and challenges in theGanges Brahmaputra Meghna (GBM) delta. Elementa science ofthe Anthropocene, 5: 56, https://doi.org/10.1525/elementa.153.
Vincent, K. (2007). Uncertainty in adaptive capacity and the importanceof scale. Global Environmental Change, 17(1), 12–24.
Vincent, K., & Cull, T. (2010). A household social vulnerability index(HSVI) for evaluating adaptation projects in developing countries.Paper presented in PEGNet conference 2010, policies to Foster andSustain equitable development in times of crises, Midrand, 2nd-3rdSeptember 2010.
WFP (World Food Programme). (2008). Food consumption analysis:Calculation and use of the food consumption score in food securityanalysis. Rome: FAO.
WFP. (2017). Creation of a wealth index. VAM guidance paper. Availableat: https://docs.wfp.org/api/documents/WFP-0000022418/download/?_ga=2.156326329.343949792.1543501988-1745710939.1423496269 (accessed 29/11/2018).
Woodruff, J. D., Irish, J. L., & Camargo, S. J. (2013). Coastal flooding bytropical cyclones and sea-level rise. Nature, 504, 44–52.
Wright H., Kristjanson P., & Bhatta G. (2012). Understanding adaptivecapacity: Sustainable livelihoods and food security in coastalBangladesh. CCAFS working paper no. 32. CGIAR research pro-gram on climate change, agriculture and food security (CCAFS),Copenhagen, Denmark. Available online at: www.ccafs.cgiar.org.
Yang, S. L., Milliman, J. D., Li, P., & Xu, K. (2011). 50,000 dams later:Erosion of the Yangtze River and its delta. Global and PlanetaryChange, 75(1–2), 14–20.
Žurovec, O., Cˇadro, S., & Sitaula, B. K. (2017). Quantitative assessmentof vulnerability to climate change in rural municipalities of Bosniaand Herzegovina. Sustainability, 2017(9), 1208. https://doi.org/10.3390/su9071208.
Dr Islam is a senior lecturer atNottingham Trent University(NTU) in the UK. He has over20 years of experience in teach-ing, research, and developmentalactivities in the broad areas of sus-tainable agriculture and food se-curity, both in developed and de-veloping country contexts. Dr.Islam holds a PhD from MasseyUniversity New Zealand and hasw o r k e d f o r B a n g l a d e s hAgricultural University, OpenUniversity UK, Scotland’s RuralC o l l e g e ( S R U C ) , a n d
Nottingham Trent University. Dr. Islam has been involved in a range ofinternational development projects funded by the World Bank, DFID,JSPS and industry. Dr. Islam is the programme leader for the MSc/MRes in Global Food Security & Development courses at NTU.
Mr Mamun is an AssistantProfessor at Noakhali Science &Technology University (NSTU)in Bangladesh. He teaches foodscience and nutrition and has beeninvolved with a range of develop-mental activities in the Southerncoastal areas of Bangladesh. Mr.Mamun holds an MSc degree inG l o b a l F oo d S e c u r i t y &Development from NottinghamTrent University, UK.