benchmark demonstration: comparison of wrc-based … · benchmark demonstration: comparison of...
TRANSCRIPT

Benchmark Demonstration: Comparison of WRc-based CCTV Inspections v. Electro Scanning Topsham, England 8 November 2012
Presented in Cooperation with South West Water Pell Frischmann, and Electro Scan Inc. 1
Topsham

A Special Thanks to Pell Frischmann Consulting Engineers for hosting Electro Scan’s Inaugural Demonstration in the UK, Thursday 8 November in Topsham (near Exeter). 2
Selected Attendees

Topsham Demonstration 8 Nov 2012
3

Topsham Demonstration 8 Nov 2012
4

Challenge Use Electro Scan ,in accordance with ASTM F2550-06, to assess a UK sewer pipe that had been previously televised, in accordance with WRc UK CCTV standards, that found no evidence of infiltration or leaks.
5 http://www.astm.org/Standards/F2550.htm

Principle of Operation
• Electro-scanning is carried out by pulling the probe through the pipe at a speed of 10 m/minute (30 ft/minute) and measuring the variation of electric current flowing between the probe and the fixed electrode on the surface. When the probe is close to a pipe defect the electric current increases because the defect decreases the electrical resistance of the pipe wall. The probe is designed to measure only that electric current which flows through a circular test band around the pipe wall. The test band is about 30 mm (1 inch) wide and located at the middle of the probe.
• As the probe is pulled through the pipe the electric current flow and the position of the probe in the pipe are recorded and displayed in real time as a “current trace” on a notebook computer (Figure 5). When the middle of the probe is within 20 to 30 mm of a defect in the pipe wall the electric current through the pipe wall increases, attaining a maximum value when the center of the probe is radially aligned with the defect.
ASurface Electrode
VoltageSource
ElectricCurrentMeter
Probe Cable Defect Electrode test bandProbe
LOW resistance paththrough ground
HIGH resistance paththrough pipe wallexcept where there is awater leakage paththrough wall
LOW resistance path through water in pipe Pipe fullof waterat probelocation
6

Run 1 Analysis ANOMALY ANALYSIS
Anomaly Picking Threshold 100.00
Grade Current Levels
Number Length % Length of Pipe Tested
% of Total Anomaly Length
Grade Large >700 1 0.0 0% 1% Medium 700 to
400 6 0.7 3% 72%
Small <400 21 0.3 1% 27% Total 28 1.0 5% 100%
Grade Flow
Levels Number Flow
lt/min Flow lt/sec
>15 1 40.7 0.6783 15 to 5 0 0.0 0.0
<5 27 36.8 0.6133 <1 28 77.5 1.2916
7

Run 2 Analysis
ANOMALY ANALYSIS
Anomaly Picking Threshold 100.00
Grade Current Levels
Number Length % Length of Pipe Tested
% of Total Anomaly Length
Grade Large >700 0 0.0 0% 0% Medium 700 to
400 4 0.2 1% 13%
Small <400 24 1.0 5% 87% Total 28 1.2 6% 100%
Grade Flow
Levels Number Flow
lt/min Flow lt/sec
>15 1 23.0 0.3833 15 to 5 2 12.0 0.2000
<5 25 32.6 0.5433 <1 28 67.6 1.126
8

Topsham Defect Analysis ANOMALY ANALYSIS
Anomaly Picking Threshold 100.00
Grade Current Levels
Number Length % Length of Pipe Tested
% of Total Anomaly Length
Grade Large >700 1 0.0 0% 1% Medium 700 to
400 6 0.7 3% 72%
Small <400 21 0.3 1% 27% Total 28 1.0 5% 100%
ANOMALY ANALYSIS
Anomaly Picking Threshold 100.00
Grade Current Levels
Number Length % Length of Pipe Tested
% of Total Anomaly Length
Grade Large >700 0 0.0 0% 0% Medium 700 to
400 4 0.2 1% 13%
Small <400 24 1.0 5% 87% Total 28 1.2 6% 100%
Grade Flow
Levels Number Flow
lt/min Flow lt/sec
>15 1 40.7 0.6783 15 to 5 0 0.0 0.0
<5 27 36.8 0.6133 <1 28 77.5 1.2916
Grade Flow
Levels Number Flow
lt/min Flow lt/sec
>15 1 23.0 0.3833 15 to 5 2 12.0 0.2000
<5 25 32.6 0.5433 <1 28 67.6 1.126
Notes: • A variance of defect quantification within the expected + or – 20% range is shown as expected. This generally
occurs as a result of changes in the nature of the contact between the pipe wall and ground in the trench. As more water is forced out through a defect, it pushes the earth away from the pipe, slightly reducing the amplitude of electrical leakage.
• Due to the grading of defects occurring at a definite point (ie. 700) some defects may be graded differently as this + or – 20% variance occurs.
Run 1
Run 2
9

Defect Start (m)
Defect End (m)
Defect Length (mm)
Defect Max
Current Defect
Severity -0.117 0.205 322 554 M
2.79 2.88 90 249 S
3.951 3.951 0 161 S
4.563 4.563 0 116 S
5.072 5.072 0 112 S
5.664 5.664 0 132 S
7.542 7.564 22 581 M
8.221 8.221 0 113 S
8.778 8.778 0 238 S
9.388 9.676 288 695 M
9.93 9.947 17 422 M
10.637 10.689 52 423 M
11.869 11.869 0 191 S
12.398 12.424 26 128 S
12.48 12.649 169 479 M
13.079 13.079 0 132 S
13.676 13.707 31 317 S
14.901 14.901 0 116 S
15.462 15.462 0 117 S
16.68 16.68 0 130 S
16.743 16.76 17 242 S
17.355 17.369 14 138 S
17.981 17.992 11 202 S
18.642 18.667 25 385 S
18.851 18.883 32 168 S
18.901 18.912 11 284 S
19.296 19.32 24 188 S
19.836 19.836 0 200 S
Topsham Defect Analysis Notes: • Defect location appears to
be offset from CCTV measurements by as much as 0.13 m (towards end of pipe) due to differences in zeroing of data cable, and potential slack in CCTV data cable.
• Defects with length reading of ‘0’ are considered radial pipe defects of < 10mm in size.
• Regular interval of defects indicated many leaking joints.
10

Electro Scan
Size Grading of Defect
Number of Defects Identified
Small 24
Medium 4
Large 0
Total 28
Electro Scan and CCTV Comparison
CCTV
Nature of Defect
Number of Defects Identified
Grade
Structural 1 1
Service 3 4
11

Electro Scan and CCTV Comparison
12

CCTV Screenshot Comparisons
The following analysis shows a screenshot taken at the location of each defect identified with Electro Scan in this trial. Notes: • Visual comparisons will note distances slightly
less than those recorded on Electro Scan report. This is due to the need to stop the camera short of defects in order to get a screenshot of them.
13

Defect Identified: Manhole Connection Defect
Notes: Most significant leak in pipe.
CCTV Call Out: None
Defect Start (m)
Defect End (m)
Defect Length (mm)
Defect Max
Current Defect
Severity -0.117 0.205 322 554 M
No Photo Available on CCTV video. Inspection started at 0.4m
14

Defect Identified: Joint Defect CCTV Call Out: None
Defect Start (m)
Defect End (m)
Defect Length (mm)
Defect Max
Current Defect
Severity 2.79 2.88 90 249 S
15

Defect Identified: Joint Defect CCTV Call Out: None
Defect Start (m)
Defect End (m)
Defect Length (mm)
Defect Max
Current Defect
Severity 3.951 3.951 0 161 S
16

Defect Identified: Joint Defect CCTV Call Out: None
Defect Start (m)
Defect End (m)
Defect Length (mm)
Defect Max
Current Defect
Severity 4.563 4.563 0 116 S
17
Defect Identified: Joint Defect CCTV Call Out: None
Defect Start (m)
Defect End (m)
Defect Length (mm)
Defect Max
Current Defect
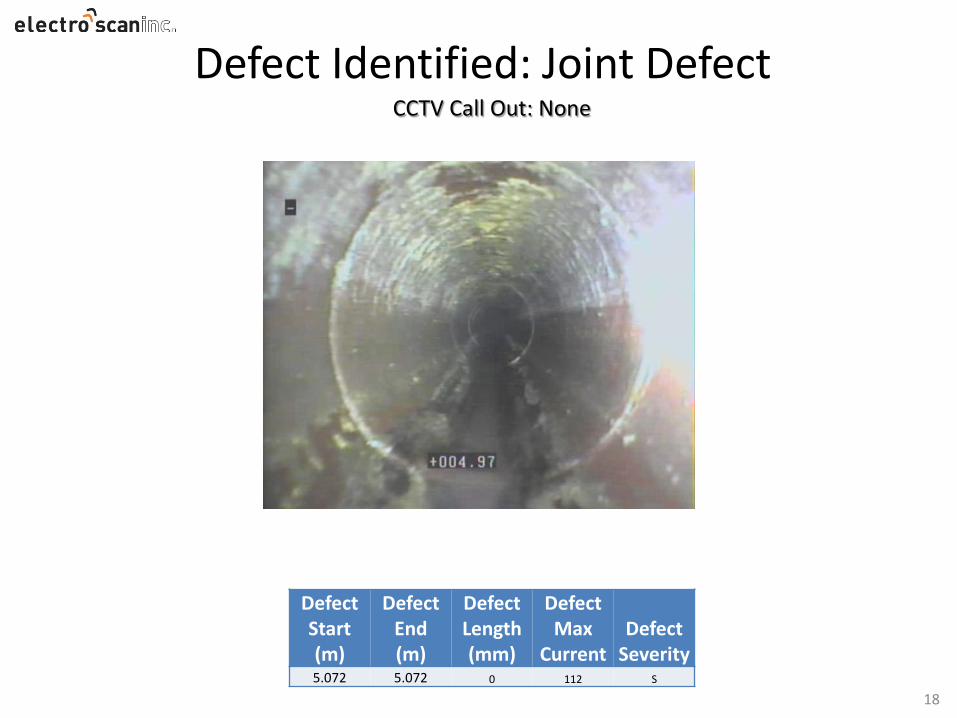
Severity 5.072 5.072 0 112 S
18

Defect Identified: Joint Defect CCTV Call Out: None
Defect Start (m)
Defect End (m)
Defect Length (mm)
Defect Max
Current Defect
Severity 5.664 5.664 0 132 S
19

Defect Identified: Joint Defect CCTV Call Out: None
Defect Start (m)
Defect End (m)
Defect Length (mm)
Defect Max
Current Defect
Severity 7.542 7.564 22 581 M
20
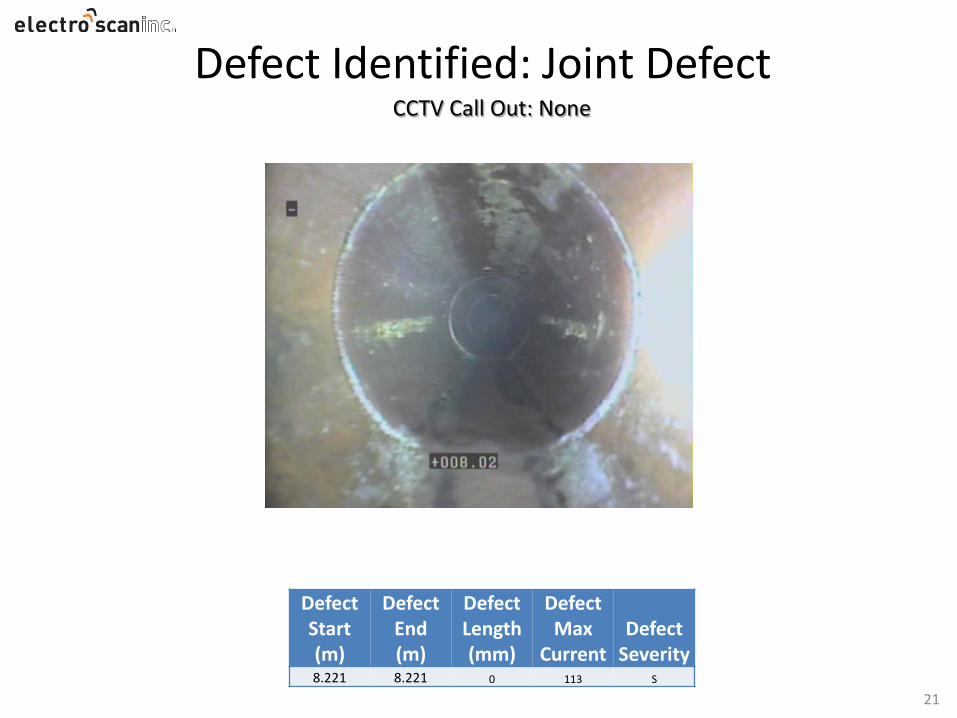
Defect Identified: Joint Defect CCTV Call Out: None
Defect Start (m)
Defect End (m)
Defect Length (mm)
Defect Max
Current Defect
Severity 8.221 8.221 0 113 S
21

Defect Identified: Joint Defect CCTV Call Out: None
Defect Start (m)
Defect End (m)
Defect Length (mm)
Defect Max
Current Defect
Severity 8.778 8.778 0 238 S
22

Defect Identified: Joint Defect CCTV Call Out: None
Defect Start (m)
Defect End (m)
Defect Length (mm)
Defect Max
Current Defect
Severity 9.388 9.676 288 695 M
23

Defect Identified: Joint Defect CCTV Call Out: None
Defect Start (m)
Defect End (m)
Defect Length (mm)
Defect Max
Current Defect
Severity 9.93 9.947 17 422 M
24
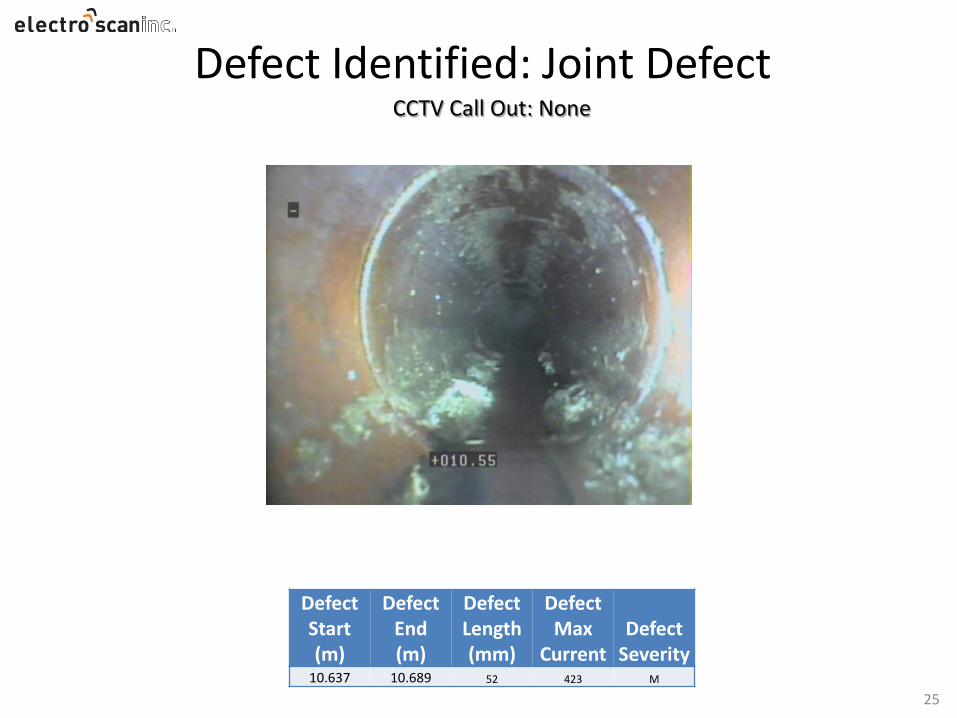
Defect Identified: Joint Defect CCTV Call Out: None
Defect Start (m)
Defect End (m)
Defect Length (mm)
Defect Max
Current Defect
Severity 10.637 10.689 52 423 M
25

Defect Identified: Joint Defect CCTV Call Out: None
Defect Start (m)
Defect End (m)
Defect Length (mm)
Defect Max
Current Defect
Severity 11.869 11.869 0 191 S
26

Defect Identified: Small Longitudinal Defect CCTV Call Out: None
Defect Start (m)
Defect End (m)
Defect Length (mm)
Defect Max
Current Defect
Severity 12.398 12.424 26 128 S
Notes: Evidence of minor cracking @ 5 o‘clock
27

Defect Identified: Joint Defect CCTV Call Out: None
Defect Start (m)
Defect End (m)
Defect Length (mm)
Defect Max
Current Defect
Severity 12.48 12.649 169 479 M
Notes: Evidence of minor cracking @ 5 o‘clock continuing on from joint.
28

Defect Identified: Joint Defect CCTV Call Out: None
Defect Start (m)
Defect End (m)
Defect Length (mm)
Defect Max
Current Defect
Severity 13.079 13.079 0 132 S
29

Defect Identified: Joint Defect CCTV Call Out: None
Defect Start (m)
Defect End (m)
Defect Length (mm)
Defect Max
Current Defect
Severity 13.676 13.707 31 317 S
30

Defect Identified: Joint Defect CCTV Call Out: None
Defect Start (m)
Defect End (m)
Defect Length (mm)
Defect Max
Current Defect
Severity 14.901 14.901 0 116 S
31

Defect Identified: Joint Defect CCTV Call Out: None
Defect Start (m)
Defect End (m)
Defect Length (mm)
Defect Max
Current Defect
Severity 15.462 15.462 0 117 S
32

Defect Identified: Small Longitudinal Defect CCTV Call Out: None
Defect Start (m)
Defect End (m)
Defect Length (mm)
Defect Max
Current Defect
Severity 16.68 16.68 0 130 S
Notes: Evidence of minor cracking @ 9 o‘clock.
33

Defect Identified: Joint Defect CCTV Call Out: None
Defect Start (m)
Defect End (m)
Defect Length (mm)
Defect Max
Current Defect
Severity 16.743 16.76 17 242 S
34

Defect Identified: Joint Defect CCTV Call Out: None
Defect Start (m)
Defect End (m)
Defect Length (mm)
Defect Max
Current Defect
Severity 17.355 17.369 14 138 S
35

Defect Identified: Joint Defect CCTV Call Out: None
Defect Start (m)
Defect End (m)
Defect Length (mm)
Defect Max
Current Defect
Severity 17.981 17.992 11 202 S
36

Defect Identified: Joint Defect CCTV Call Out: None
Defect Start (m)
Defect End (m)
Defect Length (mm)
Defect Max
Current Defect
Severity 18.642 18.667 25 385 S
37

Defect Identified: Small Longitudinal Defect CCTV Call Out: None
Defect Start (m)
Defect End (m)
Defect Length (mm)
Defect Max
Current Defect
Severity 18.851 18.883 32 168 S
18.901 18.912 11 284 S
Notes: Evidence of minor cracking @ 9 o‘clock.
38

CCTV Call Out: None
Defect Start (m)
Defect End (m)
Defect Length (mm)
Defect Max
Current Defect
Severity 19.296 19.32 24 188 S
Defect Identified: Small Longitudinal Defect
Notes: Evidence of minor cracking @ 9 o‘clock.
39

Defect Identified: Joint Defect CCTV Call Out: OJM – Open Joint Medium
Defect Start (m)
Defect End (m)
Defect Length (mm)
Defect Max
Current Defect
Severity 19.836 19.836 0 200 S
40

CCTV, alone, is unable and inadequate to identify, locate, and quantify defects in sanitary
sewers that potentially cause infiltration.
In addition to becoming a recommended pre-rehabilitation assessment tool, added benefit exists as a post-rehabilitation assessment tool
to certify sewer repairs, relining, and replacements, as “leak free.”
41
Findings & Conclusions

Andrew O’Keefe Director of Sales
Email: [email protected] Tel: +1 503 939 0403
Facebook www.facebook.com/Electro-Scan-Inc/214255938644317 LinkedIn www.linkedin.com/charlesahansen YouTube www.youtube.com/SewerElectroScan Twitter @electroscan 42