bear stearns conference - smith & nephewcopy-1).pdf · bear stearns conference ... as amended,...
TRANSCRIPT

0
Bear Stearns Conference1 March 2006Sir Christopher O’Donnell

1
Forward looking statementsThis presentation contains certain "forward-looking statements" within the meaning of the US Private Securities Litigation Reform Act of 1995. In particular, statements regarding expected revenue growth and operating margins discussed under "Outlook" are forward-looking statements as are discussions of our product pipeline. These statements, as well as the phrases "aim", "plan", "intend", "anticipate", "well-placed”, "believe", "estimate", "expect", "target", "consider" and similar expressions, are generally intended to identify forward-looking statements. Such forward-looking statements involve known and unknown risks, uncertainties and other important factors (including, but not limited to, the outcome of litigation, claims and regulatory approvals) that could cause the actual results, performance or achievements of Smith & Nephew, or industry results, to differ materially from any future results, performance or achievements expressed or implied by such forward-looking statements. Please refer to the documents that Smith & Nephew has filed with the U.S. Securities and Exchange Commission under the U.S. Securities Exchange Act of 1934, as amended, including Smith & Nephew's most recent annual report on Form 20F, for a discussion of certain of these factors.
All forward-looking statements in this presentation are based on information available to Smith & Nephew as of the date hereof. All written or oral forward-looking statements attributable to Smith & Nephew or any person acting on behalf of Smith & Nephew are expressly qualified in their entirety by the foregoing. Smith & Nephew does not undertake any obligation to update or revise any forward-looking statement contained herein to reflect any change in Smith & Nephew's expectation with regard thereto or any change in events, conditions or circumstances on which any such statement is based.

2
• Continued growth in tighter market conditions
• Orthopaedics gained share in reconstruction and trauma
• Divestment of BSN completes business transformation
• Delivered on earnings and profits
• Strategic move to dollar reporting
2005 business highlights
3
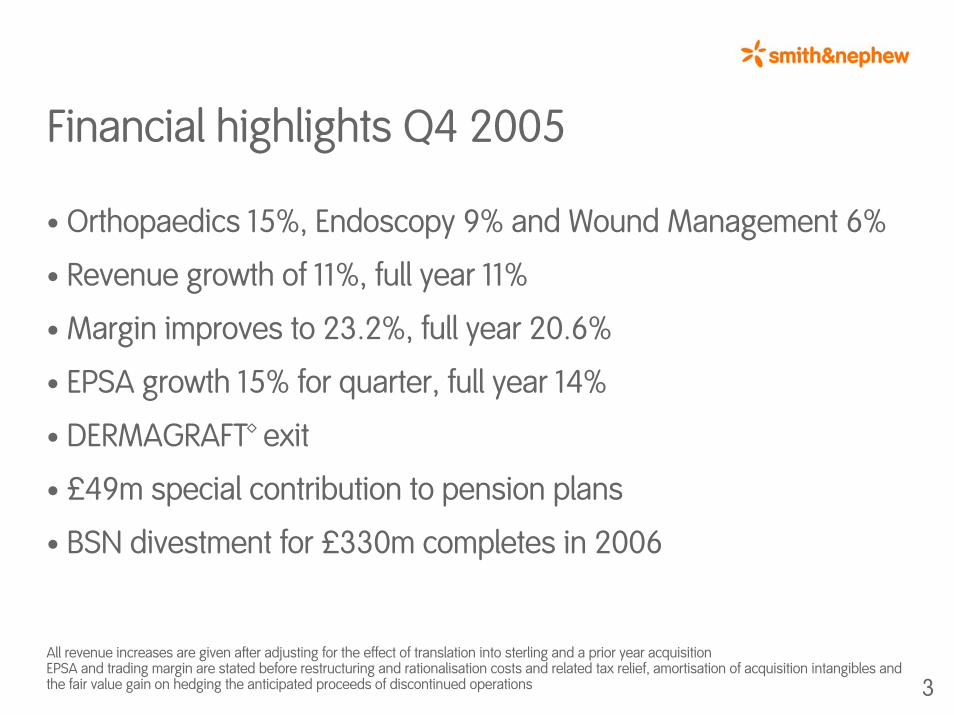
Financial highlights Q4 2005
• Orthopaedics 15%, Endoscopy 9% and Wound Management 6%
• Revenue growth of 11%, full year 11%
• Margin improves to 23.2%, full year 20.6%
• EPSA growth 15% for quarter, full year 14%
• DERMAGRAFT™ exit
• £49m special contribution to pension plans
• BSN divestment for £330m completes in 2006
All revenue increases are given after adjusting for the effect of translation into sterling and a prior year acquisitionEPSA and trading margin are stated before restructuring and rationalisation costs and related tax relief, amortisation of acquisition intangibles and the fair value gain on hedging the anticipated proceeds of discontinued operations
4
Positive market dynamics
• Ageing population– baby boomers reach age 60
• Reducing age threshold for joint reconstruction through new technologies (OXINIUM™, BHR™)
• Lifestyle trends – Increasingly active lifestyles – increased injuries– More obesity – more product applications
• Demand for improved outcomes
• Technology evolution
• Consumer awareness increases
• Healthcare spending pressure but alternatives emerge
Fundamentals continue strong

5
• Exploit positive market dynamics
• Build on technology leadership to expand markets
• Organic growth - innovative product pipeline
- sales force development
• Pursue synergistic technology acquisitions
• Build on Smith & Nephew brand
Strategy continuing to drive growth and value
Smith & Nephew strategy

6
Strategic initiatives for growth
Improve market and customer focus• Separate segment and identity for Reconstruction/Trauma• Revised business focus for Advanced Wound Management
Provide additional management capacity• CEO to focus strategy/businesses• COO to drive business growth.
Move to dollar reporting• Reduces risk by aligning capital base with trading• Improves visibility with capital markets
7
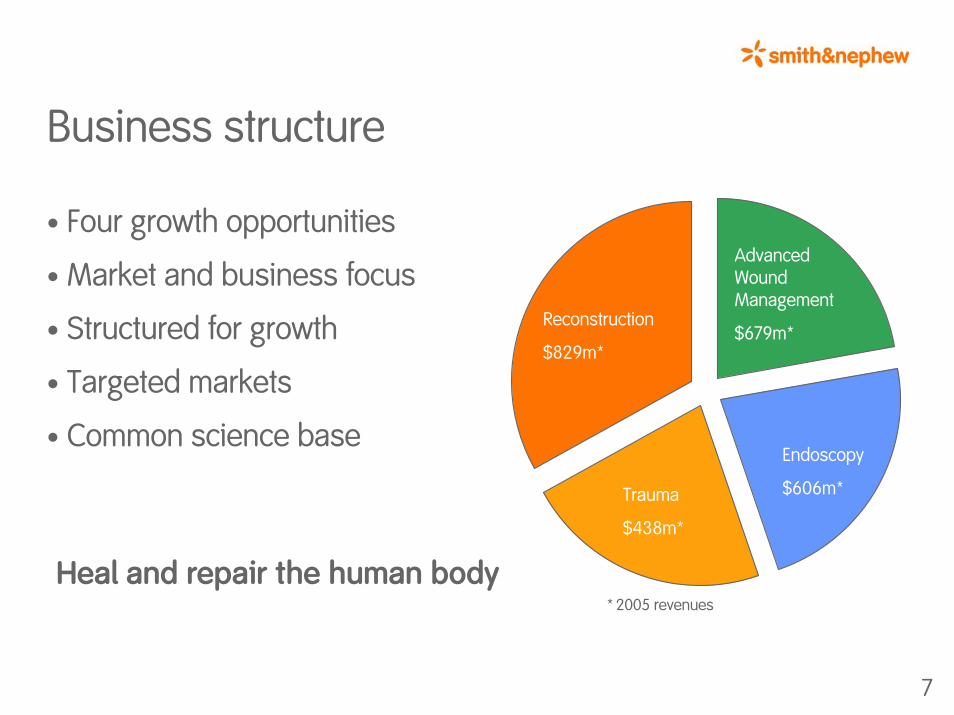
Business structure
• Four growth opportunities
• Market and business focus
• Structured for growth
• Targeted markets
• Common science base
* 2005 revenues
Reconstruction
$829m*
Advanced Wound Management
$679m*
Endoscopy
$606m*Trauma
$438m*
Heal and repair the human body

8
Orthopaedics - 2005Q4 FY
Knees 12%
Outside US 15% 12%
15%
Trauma 16% 14%Clinical Therapies 31% 38%Global 15% 16%US 15% 19%
Hips 13% 13%
• Outperformed H2 market growth of 10%
• Knees await LEGION™ & JOURNEY™
• BHR™ benefits OUS hips
• PERI-LOC™ and sales force momentum at Trauma
• New products 16%
Global Growth 2005
0%
2%
4%
6%
8%
10%
12%
14%
16%
18%
Stryker Biomet Synthes* DePuy Zimmer Smith &Nephew
Q4 05 FY 05

9
Reconstruction
Market
• Growth slowed in H205 to around 10%
• Mix/price big element of slowdown
• Forward global growth rate around 10%
Innovation grows Reconstruction above market• Enhanced sales coverage US/UK/Japan• Strong new product rollout• 2005 revenues $830m - growth 14%• President – Scott Flora LEGION™ revision knee system
10
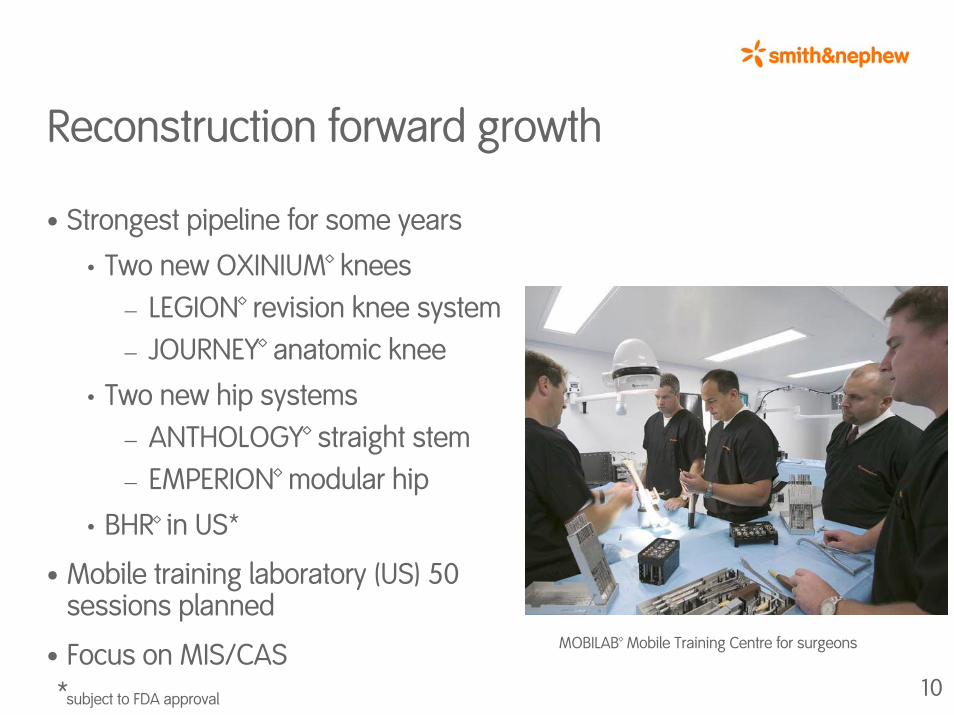
Reconstruction forward growth
• Strongest pipeline for some years
• Two new OXINIUM™ knees– LEGION™ revision knee system– JOURNEY™ anatomic knee
• Two new hip systems– ANTHOLOGY™ straight stem– EMPERION™ modular hip
• BHR™ in US*
• Mobile training laboratory (US) 50 sessions planned
• Focus on MIS/CAS*subject to FDA approval
MOBILAB™ Mobile Training Centre for surgeons

11
Trauma
TRIGEN™ Hindfoot Fusion Nail
Market• Volume growth continues• Technology improves mix• Global growth rate around 12%
Established Trauma as a growth opportunity• Sales force investment 2003/4/5• New product introductions 2004/5/6• Clinical Therapies channelCreate separate identity and strategy 2006• 2005 revenues $440m - growth 20%• President – Mark Augusti

12
Trauma forward growth
• Strong new products
• PERI-LOC™ upper extremity (US)
• TRIGEN™ InterTAN™ nail
• PERI-LOC™ lower extremity global rollout
• Sales force investment increasing outside US
• Clinical Therapies
• SUPARTZ™ 3/4/5 injection
• EXOGEN™ 4000 launch
TRIGEN™ InterTAN nail

13
Endoscopy - 2005
Q4 FYRepair 20%
Outside US 12% 10%
21%
Blade 7% 4%Radio frequency 6% -Global 9% 8%US 6% 6%
Visualisation & DOR 8% 7%
• Strong knee and shoulder repair
• Rationalisation of manufacturing underway
• New products 24% Digital Operating Room

14
Endoscopy
Market
• Volume trending upwards
• Technology improves mix
• Arthroscopy growth rate around 8%
Increasing momentum
• Strong new product programme
• Expanding international business
• Digital Operating Room programme new business opportunity
• 2005 revenues $610m - growth 8%
• President – Jim TaylorDYONICS™ 25 Fluid Management System
15
Endoscopy forward growth
• Repair procedure growth• knee• shoulder• hip
• Core arthroscopy refocus• access• resection
• Progressive innovation in DOR/Visualisation
• Salesforce segmentation to support delivery DYONICS™ GLIDER™ RF Articular Cartilage Probe

16
Advanced Wound Management - 2005
Q4 FYALLEVYN™ 16% 13%
DERMAGRAFT™ & related products - (16%)Global 6% 4%US 8% (2)%Outside US 5% 6%
ACTICOAT™ 16% 25%
ACTICOAT™ Moisture Control dressing
• Abatement of destocking and intermediate products benefit US
• Underlying end customer revenues +7% in US
• Spending pressures in parts of Europe in H2
• DERMAGRAFT™ and TRANSCYTE™ revenues £12m exited
• New products 14%
17
Advanced Wound Management
Market
• Volume trending upwards
• Mix positive but offset by price
• Global growth 7%
Revised business focus• Refocused sales force on class leading
products• Leveraging strong market position for
growth and margin improvement• Increased focus on cost effective solutions• 2005 revenues $680m - growth 4%• President – Joe Woody
VERSAJET™ Hydrosurgery System

18
Advanced Wound Managementforward growth• Driving class leading products
ALLEVYN™/ACTICOAT™
• Comprehensive range/wide treatment options
• Innovation in debridement -VERSAJET™
• Margin improvement from DERMAGRAFT™ exit
IODOSORB™ Cadexomer Iodine Dressing

19
New products 2006
Advanced Wound ManagementEndoscopyOrthopaedics
Q1 Q2 Q3 Q4
LEGION™ revision knee system JOURNEY™ anatomic knee PERI-LOC™ upper extremity EMPERION™ hip
ANTHOLOGY™ flat hip stemBIRMINGHAM HIP RESURFACING™ - US* EXOGEN™ 4000+ bone healing
systemACTICOAT™ surgical line extension
DYONICS™ POWERMAX™ ELITE Arthroscopic ShaverHandpiece & associated blade line extensions
TRIGEN™ InterTAN nail ALLEVYN™ major product upgrade
New fixation systems for arthroscopic knee repair
660HD Image Management System for Digital OR
New Hip Arthroscopy products, including hip positioning system
IODOSORB™ iodine dressing –US
ACTICOAT™ Moisture Control –Europe
VERSAJET™ improvedhandpiece – Europe
* subject to FDA approval

20
Outlook
• Continued demographic and procedural growth
• Four focused market segments
• Sales force expansion and development momentum
• Strong new product launch programme is a key competitive advantage

Appendix

23
2006 Guidance
• Revenue growth:Trauma = mid-teensReconstruction = just below mid-teensEndoscopy = just into double digitsWound Management = mid single digits/ low single digits after DERMAGRAFT™
• Margin expansion around 1½% (½% in Q1)
• Trading profit growth in high teens
• Interest/finance income $9m
• Tax rate 30½% expected
• Full year EPSA growth around 7-8% before currency translation reflecting;• BSN 4% dilution• 3 – 4% dilution from loss of interest rate differentials• 1½% tax rate dilution
• Q1 flat EPSA growth, before currency
24
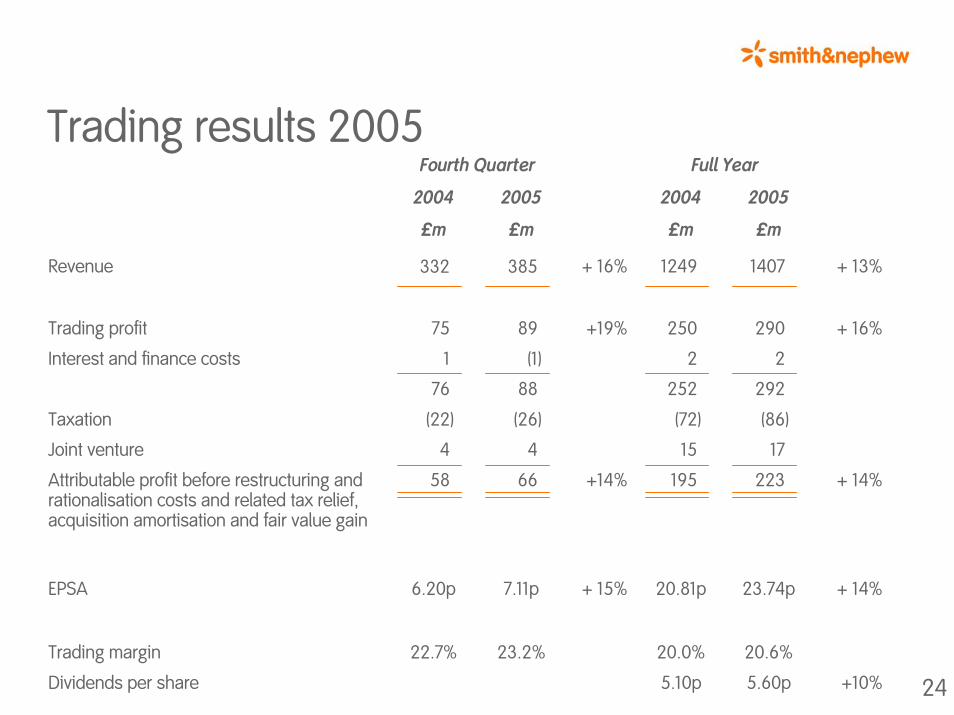
Trading results 2005Fourth Quarter Full Year
+ 16%
+19%
+14%
+ 15%
Dividends per share 5.10p 5.60p +10%
20052004
£m
1249
250
2
252
(72)
15
195
20.81p
£m
1407
290
2
292
(86)
17
223
23.74p
20.6%
+ 13%
+ 16%
+ 14%
Interest and finance costs 1 (1)
Taxation (22) (26)
+ 14%
20.0%
Joint venture 4 4
EPSA 6.20p 7.11p
2004 2005
Revenue
Trading profit
Attributable profit before restructuring and rationalisation costs and related tax relief, acquisition amortisation and fair value gain
Trading margin
£m£m
332
75
76
58
385
89
88
66
22.7% 23.2%
25
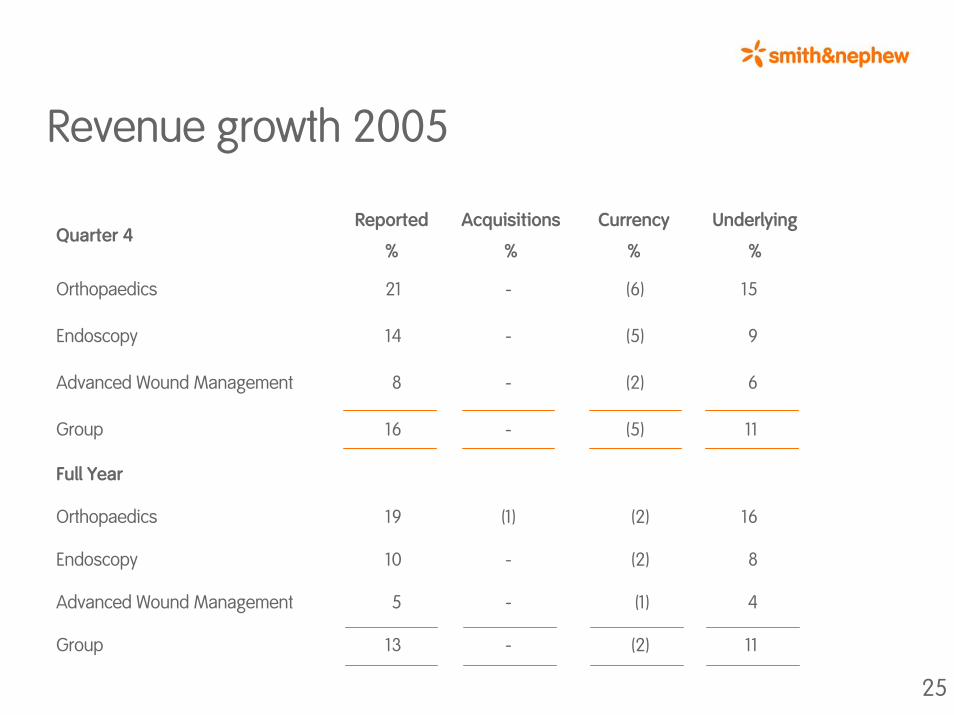
Revenue growth 2005
Quarter 4Reported
%
Acquisitions
%
Currency
%
Underlying
%
21 15
9
6
11
16
8
Advanced Wound Management 5 - (1) 4
Group 13 - (2) 11
14
8
16
19
10
Orthopaedics - (6)
Endoscopy - (5)
Full Year
Orthopaedics (1) (2)
Endoscopy - (2)
Advanced Wound Management - (2)
Group - (5)
26
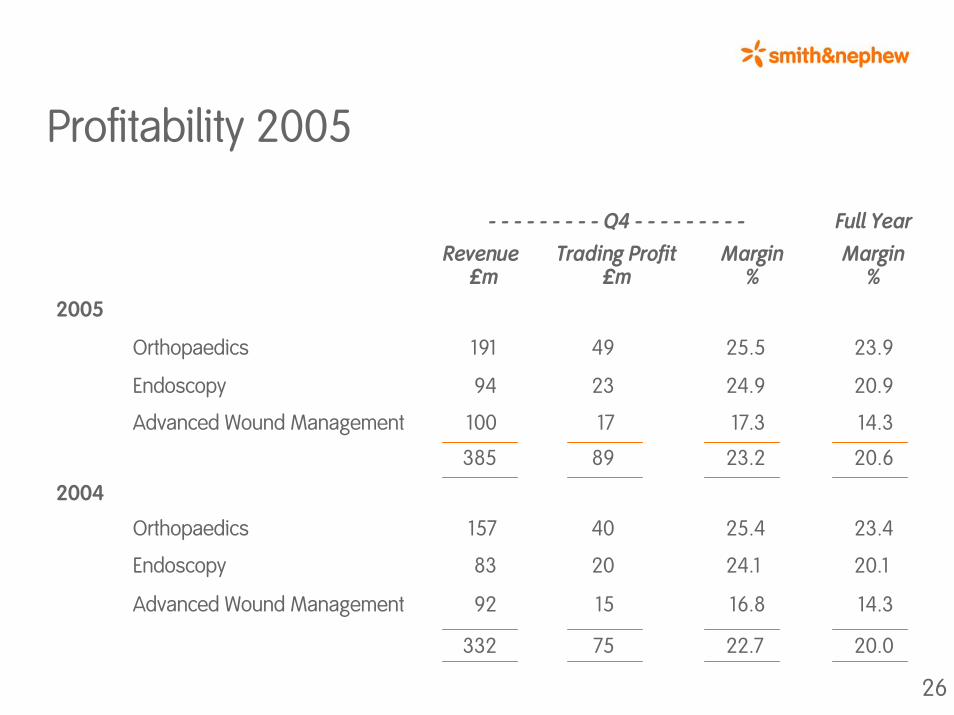
Profitability 2005
- - - - - - - - - Q4 - - - - - - - - - Full YearMargin
%
23.9
20.9
14.3
20.6
23.4
20.1
14.3
20.0
Revenue£m
Trading Profit£m
Margin%
2005
Orthopaedics 191 49 25.5
Endoscopy 94 23 24.9
Advanced Wound Management 100 17 17.3
385 89 23.2
2004
Orthopaedics 157 40 25.4
Endoscopy 83 20 24.1
Advanced Wound Management 92 15 16.8
332 75 22.7

27
Cash flow
Closing net debt comprises long term borrowings £123m, bank overdrafts and loans £132m, net currency swap liabilities £12m and cash at bank £89m
2004 2005£m £m
Special pension contribution - (49)
Restructuring and rationalisation (2) (4)
Shares 4 10
Opening debt (136) (121)Closing debt (121) (178)
Trading cash flow after capex 145 173
Macrotextured settlements (17) (26)
Operating cash flow after capex 126 94Joint venture 14 14Interest and tax (34) (57)Free cash flow 106 51Dividends (47) (50)Acquisitions (85) (14)
Net cash flow (22) (3)Currency 37 (54)
Trading cash to trading profit 58% 60%Gearing 17% 21%

28
Retained profit and capital employed2004 2005
Reported £m
Profit
Adjusted£mTax
Reported £m
Profit
Adjusted£mTax
Interest and finance costs 2 2 3 2Restructuring and rationalisation - (47)Amortisation of intangibles (4) (6)Macrotextured provision (80) -Profit before tax 168 252 240 292Taxation (45) (72) (70) (86)Profit after tax 123 180 170 206Discontinued 15 15 17 17Attributable profit 138 195 187 223Dividends (47) (50)Others 1 24Opening capital and reserves 610 702Capital and reserves 702 863Net debt 121 178Capital employed 823 1041ROCE – EBITA and JV/average capital employed 34% 34%EPSA 20.81p 23.74p
Trading Profit 250 250 290 290

29
Other items2004 2005£m £m
Depreciation - 5% of sales 59 69Currency in profit - Transactional gain 9 6
- Translational gain (14) 3IFRS Pension deficit (135) (95)Restructuring and rationalisation
Endoscopy (8)DERMAGRAFT™ (inc impairment) (39)
(47)Average number of shares in issue 935m 938mDividends per share declared 5.10p 5.60p
Translation rates for P&L $1.842 $1.814€1.471 €1.466
Capital Expenditure - 8% of sales 102 111
30
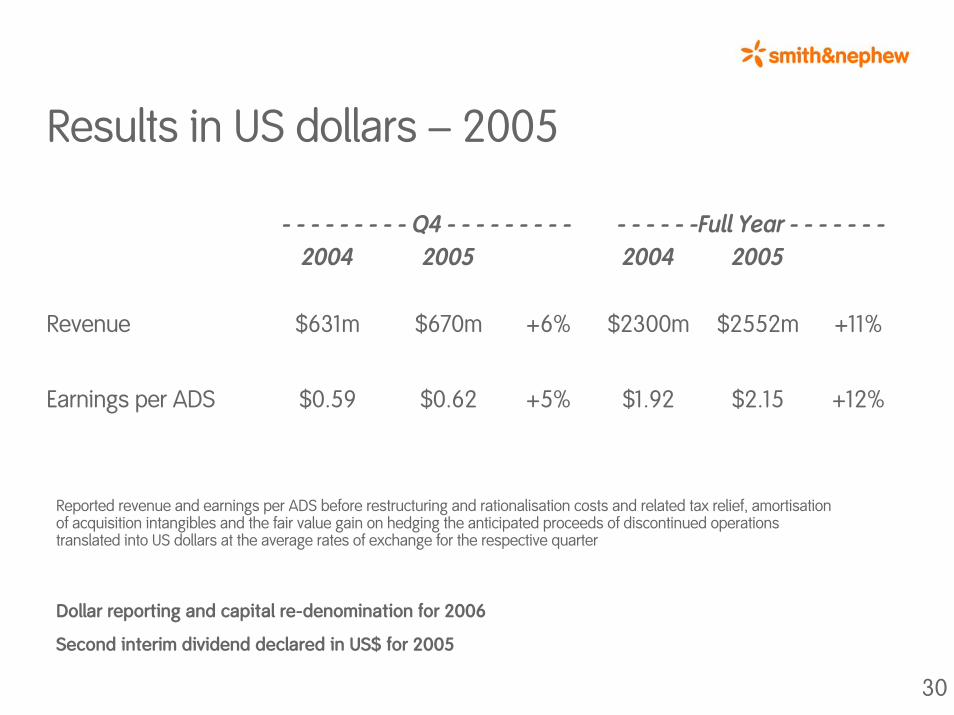
Results in US dollars – 2005
- - - - - - - - - Q4 - - - - - - - - - - - - - - -Full Year - - - - - - -2004 2005
$2552m +11%
+12%$2.15
$2300m
$1.92
2004 2005
Revenue $631m $670m +6%
Earnings per ADS $0.59 $0.62 +5%
Reported revenue and earnings per ADS before restructuring and rationalisation costs and related tax relief, amortisation of acquisition intangibles and the fair value gain on hedging the anticipated proceeds of discontinued operations translated into US dollars at the average rates of exchange for the respective quarter
Dollar reporting and capital re-denomination for 2006
Second interim dividend declared in US$ for 2005

31
Geographic revenue growth 2005
Quarter 4US
£m
Growth
%
Europe
£m
Growth
%
ROW
£m
Growth
%
Total
£m
Growth
%
Orthopaedics 119 15 41 9 31 24 191 15
Orthopaedics 433 19 148 7 117 19 698 16
Endoscopy 182 6 93 7 59 16 334 8
Advanced Wound Management 79 (2) 200 5 96 9 375 4
694 12 441 6 272 15 1407 11
Endoscopy 52 6 25 8 17 18 94 9
Advanced Wound Management 23 8 51 4 26 8 100 6
194 12 117 7 74 16 385 11
Full Year
On underlying basis
32
2004 2005
Q1 Q2 Q3 Q4 FY Q1 Q2 Q3 Q4 FY
12%
13%
16%
31%
15%
13%
14%
38%
21%
7%
2%
13%
25%
(16%)
11%
20%
8%
4%
16%
16%
-
11%
13%
10%
15%
35%
23%
2%
3%
12%
26%
(25%)
10%
20%
16%
13%
42%
23%
3%
2%
14%
33%
(10%)
12%
17%
12%
14%
51%
21%
21%
-
13%
30%
(25%)
11.5%
21%
15%
11%
44%
16%
22%
3%
15%
47%
14%
11.5%
23%
14%
14%
62%
21%
45%
5%
17%
42%
(14%)
14%
22%
15%
13%
49%
13%
23%
-
10%
40%
37%
12%
16%
14%
9%
33%
10%
15%
2%
15%
49%
7%
8%
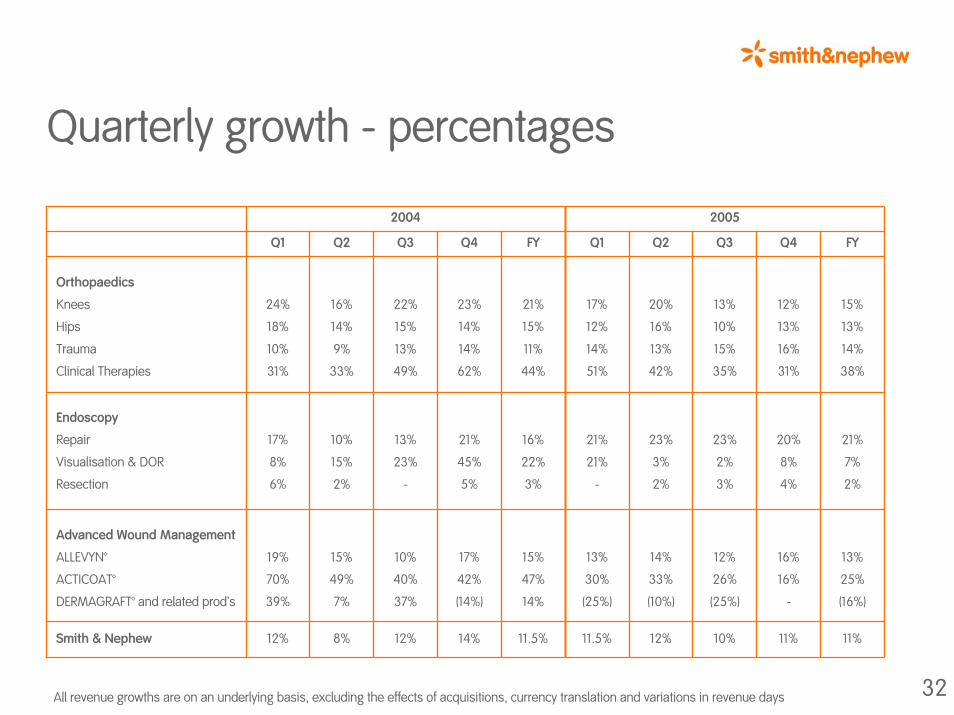
Orthopaedics
Knees
Hips
Trauma
Clinical Therapies
24%
18%
10%
31%
Endoscopy
Repair
Visualisation & DOR
Resection
17%
8%
6%
Advanced Wound Management
ALLEVYN™
ACTICOAT™
DERMAGRAFT™ and related prod’s
19%
70%
39%
Smith & Nephew 12%
Quarterly growth - percentages
All revenue growths are on an underlying basis, excluding the effects of acquisitions, currency translation and variations in revenue days

33
Reconstruction & Trauma (including Clinical Therapies)
—————————— 2005 ——————————— 2004Q1$m
Q2$m
Trading profitReconstruction 57 54 44 57 212 186Trauma & CT 18 23 22 28 91 68
75 77 66 85 303 254
MarginReconstruction 26.9% 25.5% 23.0% 26.7% 25.5% 26.0%Trauma & CT 18.1% 20.9% 20.3% 23.4% 20.8% 18.8%
24.0% 24.0% 22.0% 25.5% 23.9% 23.5%
Q3$m
Q4$m
FY$m
FY$m
722363
313 320 302 331 1267 1085
829438
RevenueReconstruction 211 212 193 213Trauma & CT 102 108 109 119