bcrc report durability performance of cronulla …
TRANSCRIPT

B U I L D I N G & C O N S T R U C T I O N - R E S E A R C H & C O N S U L T A N C Y
BCRC Pty Ltd ABN 91 116 565 265
PO Box 471, Belrose West, NSW 2085, Australia
U6, 22 Narabang Way, Belrose, NSW 2085
Tel: +61 2 8445 2441 | Fax: +61 2 8445 2442
[email protected] | www.bcrc.com.au
REPORT
TITLE:
DURABILITY PERFORMANCE OF CRONULLA MARINA
A CONCRETE SLAB MODIFIED WITH XYPEX WATER-PROOFING ADMIXTURE
CLIENT: Xypex Australia
REPORT
AUTHORS: Dr Zhen Tian Chang Marton Marosszeky
REPORT
DATE: 16 July 2013
FILE
REF: Document BCRC0372
SUMMARY
The condition of a concrete deck slab modified with Xypex admixture was investigated
after nearly 19 years exposure to a severe marine environment at the Cronulla Marina.
The slab was in good condition, free of concrete spalls, cracks and rust stains.
A concrete core sample was taken from the slab and was analysed in a NATA
accredited laboratory for the chloride contents at 5 average depths of 3, 10, 20, 30 and
40mm. The results clearly showed that the chloride content in the slab drops rapidly
with the slab depth beyond the first 15mm. The chloride diffusion coefficient calculated
from Fick's second law was found to be 0.080 x 10⁻¹²
(m2/s), which is a very low value
compared to those of normal concretes described in the literature. Based on this
chloride diffusion coefficient and Fick's second law, the predicted time for the chloride
level in the slab to reach the critical threshold level of 0.4% by weight of cement at
40mm (the reinforcement cover depth) would be 129 years.
The half-cell potential readings measured on a 3x1.2 m2 area on the slab top were found
to have an average value of -370 mV. Although the measured potentials were relatively
high negative values, the potentials were reasonably uniform over the slab surface as
shown on the potential contour map. Two most negative potentials of -529 mV and -
487 mV were measured at the two locations where the reading could have been
influenced by the exposed fittings on the slab. Further analysis of the potential gradient
based on the Potential Curvature method indicated only one locations with high
potential curvature values that could relate to higher corrosion risks, and this was
adjacent to one of the two fittings.
In conclusion, the slab concrete modified with Xypex admixture is in an excellent
condition after nineteen years' exposure in a severe marine environment. This is
indicated by its sound and defect-free condition, very low chloride diffusion coefficient
and the absence of any significant half-cell potential gradients over the slab area.
KEY WORDS: concrete durability, chloride permeability, performance life
BCRC

B U I L D I N G & C O N S T R U C T I O N - R E S E A R C H & C O N S U L T A N C Y
REVISION SHEET
Revision
Number
Description of Revision Prepared By Checked/
Reviewed By
Approved Issued to Client
1st Draft Z T Chang M Marosszeky
Final Draft Z T Chang M Marosszeky 16 July 2013
Final Issue Z T Chang M Marosszeky 22 July 2013
Disclaimer:
This report and the results shown and the recommendations made herein are based upon the information, drawings, samples
and tests referred to. BCRC, its consultants and agents accepts no liability for any damages, charges, costs or expenses in
respect of or in relation to injury to or death of any person or damage to any property or of other loss whatsoever arising
either directly or indirectly from the use of this report, the carrying out of any recommendations contained herein or the use of
any goods or materials referred to.
About the authors
Dr Zhen Tian Chang is a senior durability consultant with BCRC. He has researched and consulted in the areas of concrete
durability and structural performance for over 20 years.
Marton Marosszeky is a Director of BCRC, he held the Multiplex Chair of Construction Innovation at UNSW. He was the
Director of the Australian Centre for Construction Innovation at UNSW. He is widely published and has researched and
consulted in the areas of infrastructure durability and performance for over 20 years.

B U I L D I N G & C O N S T R U C T I O N - R E S E A R C H & C O N S U L T A N C Y
Table of Contents
INTRODUCTION ____________________________________________________________ 1
SITE INVESTIGATION ________________________________________________________ 1
TEST RESULTS AND DISCUSSIONS ____________________________________________ 2
Chloride Contents and Chloride Diffusion Coefficient _______________________________________ 2
Half-Cell Potential Survey ______________________________________________________________ 3
CONCLUSION 5
BCRC Report on Investigation of a Xypex modified concrete Slab at Cronulla Marina Page 1 of 21
DURABILITY PERFORMANCE OF CRONULLA MARINA A CONCRETE SLAB MODIFIED WITH XYPEX WATER-PROOFING ADMIXTURE
INTRODUCTION
Xypex Australia requested BCRC (Building & Construction Research & Consulting) Pty Ltd
to assess the durability performance of a 19 year old Xypex modified precast concrete deck
slab that has been in continuous service at the Cronulla Marina jetty since 1994.
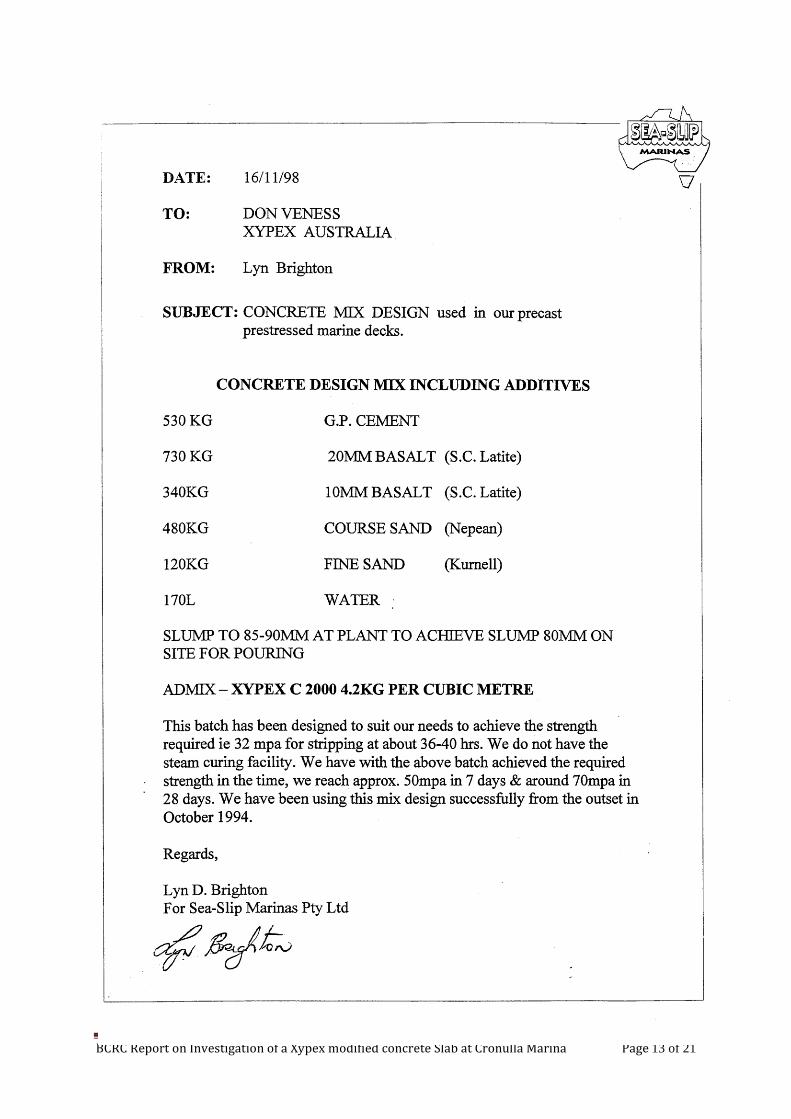
When the precast jetty slabs were cast in October 1994 Xypex C-2000 admixture was added
to the concrete mix to enhance the water-proof characteristics of the concrete. After
construction the deck surface was treated with a "Faux Brick" application to form a pattern
textured concrete surface for decorative purposes. The design details of the concrete mix and
the slabs, the test results of compressive strength and chloride contents in the aggregates are
attached in Appendix I. These jetty deck slabs have been exposed to a severe marine
environment similar to a splash zone since the slab top surfaces are only around 350 mm
above sea level.
During the investigation a visual inspection was carried out of the deck slabs and a detailed
investigation was carried out on a deck slab at the outmost location of the jetty as denoted by
a circle on the second drawing in Appendix I. A core sample was taken from the slab for
analysis of the chloride contents at different depths from the top of the concrete slab and, a
half cell corrosion potential survey was conducted on a 3m x 1.2m area on the slab. This
report summarises the site observations, investigation results, analysis and conclusions
regarding the durability performance of the concrete.
SITE INVESTIGATION
The site inspection was undertaken in June 2013. Overall, the jetty deck slabs were found to
be in a good condition, there was no sign of any concrete spall or other defects (see Photo 1).
A detailed investigation was carried out on a deck slab 12 m long, 1.2 m wide and 100 mm
thick at the outer end of the jetty. The slab was prestressed using longitudinal wire strands.
During the visual inspection we looked for signs of corrosion induced damage and could find
none, there were no rust stains or spalls (see Photos 2 and 3).
A concrete core was extracted within 1 m from the outer end (see Photo 4); at this location
the structure is exposed to wind-swept waves and salt laden aerosols. The core was extracted
between painted patches of the Faux Brick pattern in order to minimize any effect of the Faux
Brick materials on the results. Two Faux Brick patches overlapped the edges of the core,
these portions were sawn off (see Photo 5) before materials were sampled for the analysis of
the chloride content in the core.
A 3m long slab area over the full width of the slab (1.2 m) was marked with a two directional
150 mm grid, starting from panel centre and carrying towards the outer end of the pier, a half-
cell potential survey was conducted at each of the grid intersections. A copper & copper-
sulphate electrode (CSE) was used for the half cell survey and a connection to the reinforcing
steel was made to one of the exposed strands whose electrical continuity to the reinforcing
steel in the slab had been verified.

BCRC Report on Investigation of a Xypex modified concrete Slab at Cronulla Marina Page 2 of 21
TEST RESULTS AND DISCUSSIONS
Chloride Contents and Chloride Diffusion Coefficient
The report "Chloride Resistance of Concrete" by CCAA (Cement Concrete & Aggregates
Australia, 2009) concludes that "The chloride diffusion coefficient, derived from the chloride
profile after long-term exposure, is considered one of the best indicators of chloride
resistance".
The concrete core sample extracted in this investigation was sent to a NATA accredited
materials laboratory for analysis. The chloride content was measured at different depths from
the top surface of the core. The concrete core was firstly saw cut into approximately 6mm
thick slices parallel to the top surface and, each of these slices was crushed and ground into
powder for analysis of the chloride content according to AS 1012, Part 20.
The results of the chloride content by weight of concrete are shown in Table-1 below and the
laboratory report is attached in Appendix II. The chloride content by weight of cement can be
obtained by multiplying the result by the ratio of the weight of concrete to the weight of
cement in the concrete mix. The mix design information in Appendix I indicates that each
cubic metre of concrete (2370 kg) contained 530 kg of cement, thus the concrete/cement ratio
is 2370/530 = 4.471. The calculated chloride contents by weight of cement are shown in the
last column in Table-1.
Table-1. Chloride Contents in the Concrete Slab Core
Range of Sample
Depths (mm)
Average Sample
Depth (mm)
Chloride Content by
Weight of Concrete ( % )
Chloride Content by
Weight of Cement ( % )
0 - 6 3 0.46 2.057
7 - 13 10 0.26 1.163
17 – 23 20 0.041 0.183
27 – 33 30 0.019 0.085
37 – 43 40 0.009 0.040
The results in Table-1 demonstrate that, after 19 years exposure in a severe marine
environment, the chloride content in the concrete slab is only significant within the first
approximate 15mm from the top surface, it then reduces rapidly to very low levels with depth.
The dramatic drop in the chloride concentration with increased depth is a clear indication of a
dense concrete with very low chloride permeability.
To further quantitatively evaluate the resistance of concrete against chloride penetration, the
chloride diffusion coefficient in the core was calculated using Fick's second law of diffusion.
In Fig. 6 the measured chloride contents in the core are plotted as "diamonds", while the
theoretical curve obtained from Fick’s law is displayed as the red line. This theoretical curve
fits reasonably well with the measured chloride profile, and it yields an effective chloride
diffusion coefficient of 0.08 x10⁻¹²
(m2/s). This diffusion coefficient is a very low value
compared to those reported in the literature for normal concretes.
In typical concretes, chloride diffusion coefficients are found in the order of 10-12
m2/s
(John P. Broomfield, Corrosion of Steel in Concrete, 1997). A chloride diffusion coefficient

BCRC Report on Investigation of a Xypex modified concrete Slab at Cronulla Marina Page 3 of 21
of 0.94 x 10⁻¹²
m2/s was considered as "typical" for the performance of a bridge pier exposed
in "very severe" environments and designed in accordance with BS5400 (refer Taywood
Engineering report "Guidance on the Selection of Measures for Minimising the Risk of
Corrosion of Reinforcement in Concrete" for UK Concrete Society in 2004). The typical
performance of such a bridge concrete designed with BS5400 was considered to have a
predicted time to cracking (due to corrosion) of some 95 years.
The concrete cover depth to the main prestressing strands in the Cronulla Marina slab was
measured with a Covermeter to be in the range of 40 to 45 mm. For a chloride diffusion
coefficient of 0.080 x10⁻¹²
(m2/s) for the Xypex modified concrete, an analysis was
undertaken based on Fick's second law of diffusion to predict the time by which the chloride
concentration would increase to the widely used critical threshold level of 0.4% by weight of
cement at the level of the reinforcement.
The results of this analysis are plotted as the blue curve in Fig. 7, the predicted critical
chloride concentration of 0.4% by weight of cement at 40 mm could be reached at an age of
129 years with the current exposure conditions. This is the time to the onset of corrosion and
not to cracking resulting from corrosion as in the case referenced above.
Half-Cell Potential Survey
The half-cell potential technique has been widely used in corrosion condition surveys since
the work on the evaluation of the condition of bridge decks by J R Van Daveer in 1975. This
US Federal Highway Administration project compared the results of potential surveys to the
physical manifestation of corrosion on reinforcing steel on 473 bridge decks. On the basis of
this work Van Daveer and his team recommended guidelines for the probability of corrosion
for varying potential readings as set out below.
If a potential reading is more negative than -350 millivolt, then there is a 90% probability
that the reinforcing steel is corroding.
Between -200 and -350 millivolts, there is a 50% chance that the steel is corroding.
If a potential reading is less negative than -200 millivolt then there is a 90% probability
that the steel is not corroding.
This work became the basis of the ASTM C876-91 standard (Standard Test Method for Half-
Cell Potentials of Uncoated Reinforcing Steel in Concrete) and the above guidelines were
also included in the appendix to ASTM C876 as guidance information.
However, these interpretation criteria were devised empirically based on bridge structures
affected by deicing salts. It has been found by many investigators that, with different
concretes and under different environmental conditions, the critical potential ranges can shift
significantly ("Potential Mapping and Corrosion of Steel in Concrete", Proceedings of the
Symposium on Corrosion Rates of Steel in Concrete, ASTM, 1990). In marine environments,
very negative potential readings can be found in saturated conditions. However, the corrosion
rates in these cases are often very slow due to lack of oxygen for the cathodic reaction of the
corrosion process. Therefore, the location of steel corrosion in structures exposed to different
environments may not be properly assessed with the guidelines from ASTM C876. The
interpretation of the potential data, especially in marine structures, has to be based on the
correlation with other factors and the experience in the investigation of similar corrosion
problems.
An active corrosion "hot spot" is usually associated with not only more negative potentials
but also high potential gradients. Based on the analysis of half-cell potential results and their

BCRC Report on Investigation of a Xypex modified concrete Slab at Cronulla Marina Page 4 of 21
gradients, a numerical method has been developed (“Potential Curvature Method – A new
Approach for Corrosion Assessment in Concrete Structures”, the 9th International
Conference on Durability of Building Materials & Components, Brisbane, Australia, 2002),
which identifies locations with higher active corrosion risks based on positive potential
curvature values that correspond to potential gradients of 150 mV per meter or more.
In this investigation, a copper/copper-sulphate electrode (CSE) was used for the half cell
potential survey. The potentials were measured on 150 mm x 150 mm square grid over an
area of 3.6 square metres (Photo 8). The half-cell potential results are summarised in Table-2.
Table-2. Summary of Measured Half-Cell Potentials (CSE)
Time of Survey Max. Potential
(mV)
Min. Potential
(mV) Average (mV)
May 2013 -290 -529 -370
Total Points Points in the ASTM C876 Potential Ranges
<-350mV -200 to –350mV >-200mV
189 127 62 0
100% 67.2 % 32.8 % 0 %
The measured potential values shown in Table-2 were very negative in a range of -290 mV to
-529 mV with an average value of -370 mV. On the basis of the ASTM C876 guidelines, the
potential values of 127 (67.2%) slab locations fall into the category having a 90% probability
of active corrosion. Furthermore the remainder of the slab locations would have 50% chance
of active corrosion. However, the slab as previously noted is in a very sound condition
without any signs of deterioration or rust staining. The high negative potentials measured on
the jetty slab in this case could be mainly related to the marine exposure environment rather
than active corrosion.
The potential results were plotted as a potential contour map in Fig. 9, which shows
equipotential lines with a 10 mV difference. In such a potential contour map denser equal-
potential lines indicate higher potential gradients. In general, the equipotential lines are
reasonably uniform and denser lines are found only at the two right corners (x = 3m), where
the two most negative potentials of -529 mV and -487 mV were measured. It is considered
that these readings were influenced by the two exposed fittings fixed in the slab at these
corners.
To further analyse the half-cell potential readings on the basis of the local gradient of
potential change, the Potential Curvature method of analysis was used. The half cell potential
values over the measured area were numerically analysed for their potential curvature values
based on the potential gradients in both directions.
Fig. 10 plots the half cell potential curvature contour map showing locations corresponding to
the potential gradients of 150 mV per metre or higher. It shows there is only one location
with high potential curvature values (x = 1.2m, y = 0.5m) where the risk would be only
slightly higher because there are no multi and dense contour lines around the location.
BCRC Report on Investigation of a Xypex modified concrete Slab at Cronulla Marina Page 5 of 21
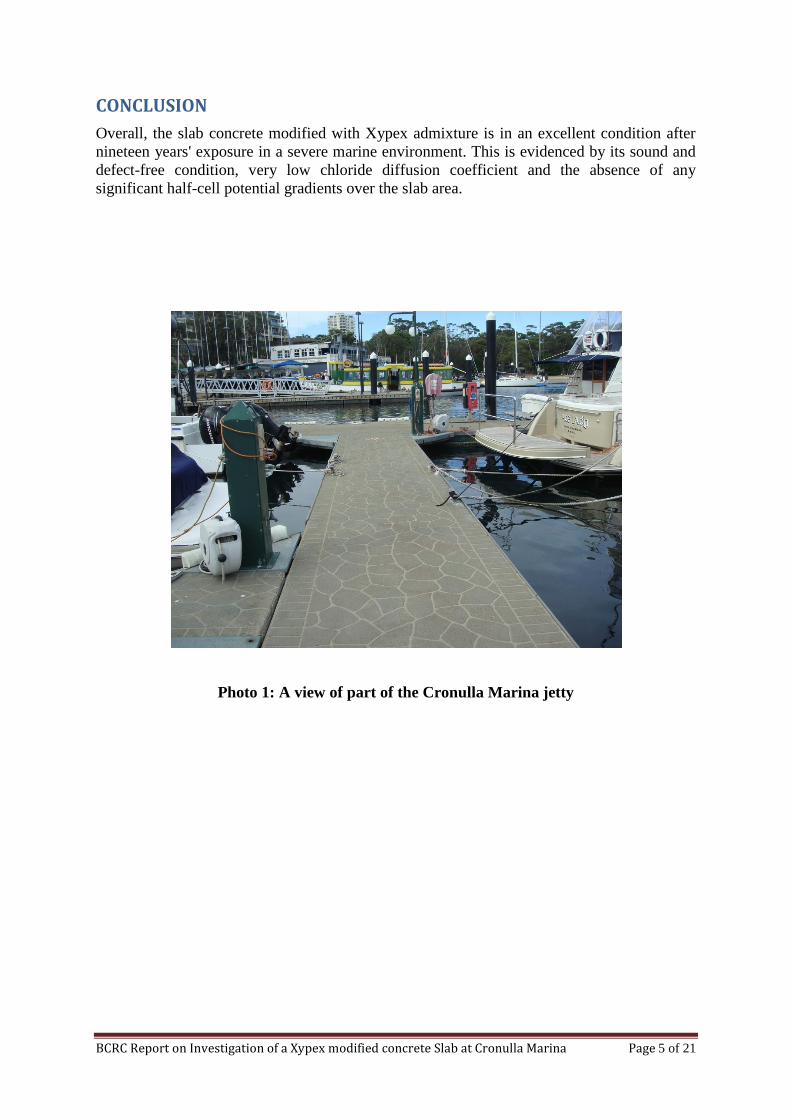
CONCLUSION
Overall, the slab concrete modified with Xypex admixture is in an excellent condition after
nineteen years' exposure in a severe marine environment. This is evidenced by its sound and
defect-free condition, very low chloride diffusion coefficient and the absence of any
significant half-cell potential gradients over the slab area.
Photo 1: A view of part of the Cronulla Marina jetty

BCRC Report on Investigation of a Xypex modified concrete Slab at Cronulla Marina Page 6 of 21
Photo 2: The 12m long jetty slab being investigated
Photo 3: A closer view of the jetty slab top surface condition

BCRC Report on Investigation of a Xypex modified concrete Slab at Cronulla Marina Page 7 of 21
Photo 4: Core location between patterns near the slab seaside end
Photo 5: Core top surface after removing Faux Brick on two edges

BCRC Report on Investigation of a Xypex modified concrete Slab at Cronulla Marina Page 8 of 21
Fig.6 Measured and calculated Chloride diffusion profiles in the concrete core
Fig.7 Predicted "Critical" chloride diffusion profile verses the measured profile
0.00%
0.40%
0.80%
1.20%
1.60%
2.00%
2.40%
2.80%
3.20%
3.60%
0 10 20 30 40 50 60
Ch
lori
de
co
nte
nt
in c
em
en
t (%
)
Depth into concrete (mm)
Chloride Diffusion Prifile
Measured from Core
Calculated from Fick's Law
0.00%
0.40%
0.80%
1.20%
1.60%
2.00%
2.40%
2.80%
3.20%
3.60%
0 10 20 30 40 50 60
Ch
lori
de
co
nte
nt
in c
em
en
t (%
)
Depth into concrete (mm)
Chloride Diffusion Prifile
Measured from Core
Calculated from Fick's Law
Predicted

BCRC Report on Investigation of a Xypex modified concrete Slab at Cronulla Marina Page 9 of 21
Photo 8: Grids marked on slab area for a half cell potential survey

BCRC Report on Investigation of a Xypex modified concrete Slab at Cronulla Marina Page 10 of 21
Fig.9 Half Cell Potential Contour Map over Surveyed Concrete Slab Area

BCRC Report on Investigation of a Xypex modified concrete Slab at Cronulla Marina Page 11 of 21
Fig.10 Half Cell Potential Curvature Contour Map over Surveyed Concrete Slab Area

BCRC Report on Investigation of a Xypex modified concrete Slab at Cronulla Marina Page 12 of 21
Appendix I
Design Details of Concrete Mix and Slabs, Test Results of Compressive
Strength of Concrete and Chloride Content in Aggregates and Sands
BCRC Report on Investigation of a Xypex modified concrete Slab at Cronulla Marina Page 13 of 21

BCRC Report on Investigation of a Xypex modified concrete Slab at Cronulla Marina Page 14 of 21

BCRC Report on Investigation of a Xypex modified concrete Slab at Cronulla Marina Page 15 of 21

BCRC Report on Investigation of a Xypex modified concrete Slab at Cronulla Marina Page 16 of 21

BCRC Report on Investigation of a Xypex modified concrete Slab at Cronulla Marina Page 17 of 21

BCRC Report on Investigation of a Xypex modified concrete Slab at Cronulla Marina Page 18 of 21
Appendix II
Analytical Report of Chloride Contents in a Concrete Core

BCRC Report on Investigation of a Xypex modified concrete Slab at Cronulla Marina Page 19 of 21

BCRC Report on Investigation of a Xypex modified concrete Slab at Cronulla Marina Page 20 of 21

BCRC Report on Investigation of a Xypex modified concrete Slab at Cronulla Marina Page 21 of 21