bc municipal spending watch 2013 final draft.pdf
DESCRIPTION
“At the local government level, we’re just not seeing the aggressive reining in of their expenses” that is seen at the provincial and federal levels, said CFIB spokesman Mike Klassen, who released the report to The Province a day early.TRANSCRIPT
www.cfib.ca
Research November 2013
Mike Klassen, Director of Provincial Affairs, British Columbia Richard Fong, Public Policy and Entrepreneurship Intern
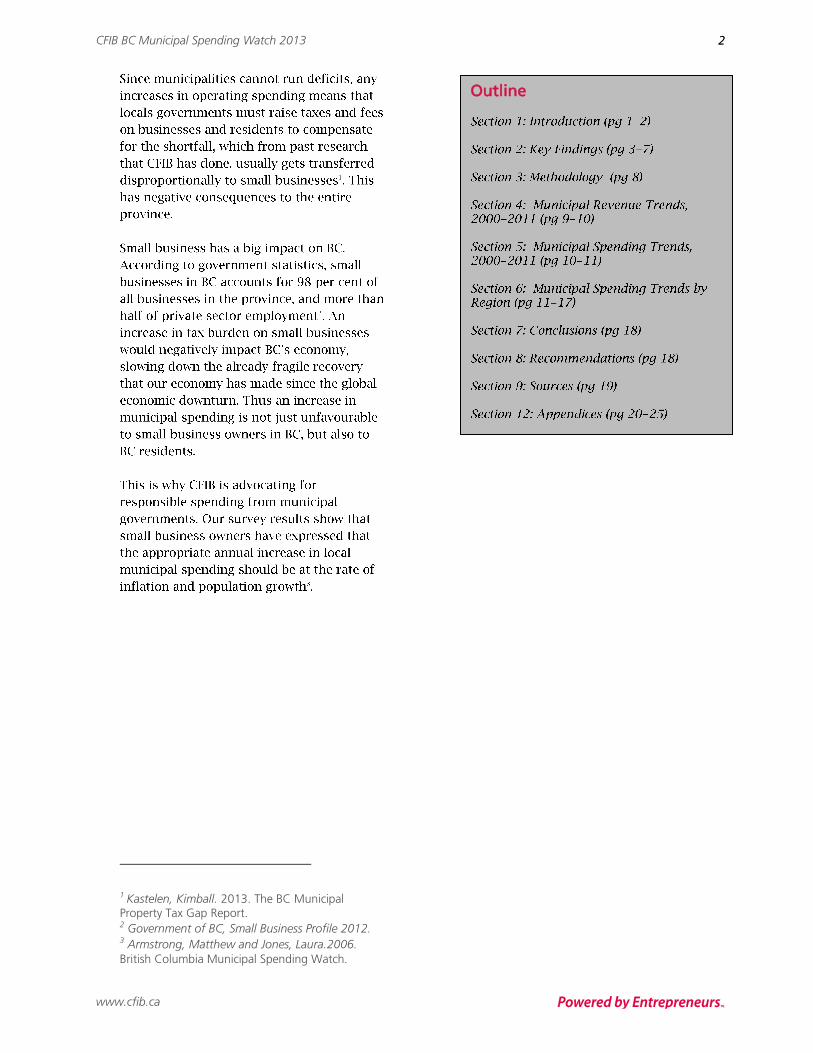
Figure 1
BC Municipal Operating Spending
Growth Adjusted for inflation and
Population Growth, 2000 – 2011
Source: Ministry of Community, Sport and Cultural
Development; BC Stats, Population Estimates; BC
Stats, CPI.
52%
15%
-10%
0%
10%
20%
30%
40%
50%
60%
200020012002200320042005200620072008200920102011
Operating Spending Growth
(Excluding policing costs and Capital Expenditures
and adjusted for inflation)
Population Growth
CFIB BC Municipal Spending Watch 2013
www.cfib.ca
2 2
1 Kastelen, Kimball. 2013. The BC Municipal Property Tax Gap Report. 2 Government of BC, Small Business Profile 2012. 3 Armstrong, Matthew and Jones, Laura.2006.
British Columbia Municipal Spending Watch.
Outline

CFIB BC Municipal Spending Watch 2013
www.cfib.ca
3 3
4 City of Surrey, Statement of Financial Information
2010, 2011
CFIB BC Municipal Spending Watch 2013
www.cfib.ca
4 4
Case Study: City of Penticton
CFIB BC Municipal Spending Watch 2013
www.cfib.ca
5 5
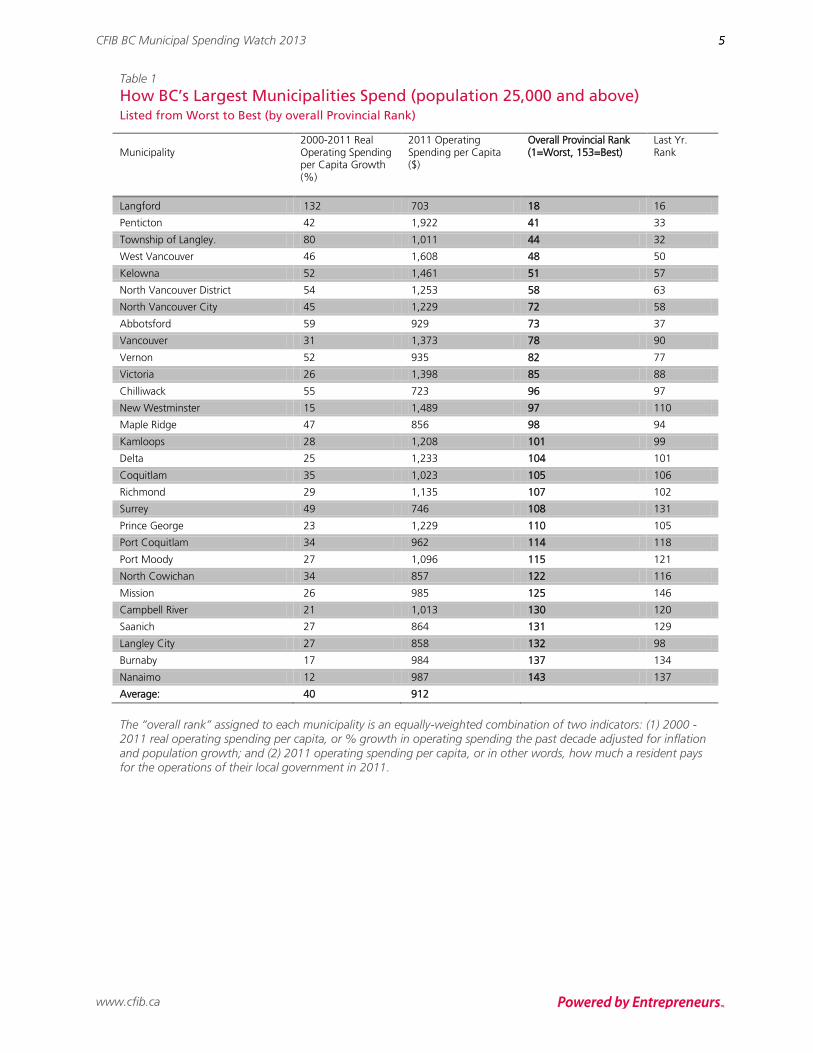
Table 1
How BC’s Largest Municipalities Spend (population 25,000 and above) Listed from Worst to Best (by overall Provincial Rank)
Municipality
2000-2011 Real Operating Spending per Capita Growth (%)
2011 Operating Spending per Capita ($)
Overall Provincial Rank (1=Worst, 153=Best)
Last Yr. Rank
Langford 132 703 18 16
Penticton 42 1,922 41 33
Township of Langley. 80 1,011 44 32
West Vancouver 46 1,608 48 50
Kelowna 52 1,461 51 57
North Vancouver District 54 1,253 58 63
North Vancouver City 45 1,229 72 58
Abbotsford 59 929 73 37
Vancouver 31 1,373 78 90
Vernon 52 935 82 77
Victoria 26 1,398 85 88
Chilliwack 55 723 96 97
New Westminster 15 1,489 97 110
Maple Ridge 47 856 98 94
Kamloops 28 1,208 101 99
Delta 25 1,233 104 101
Coquitlam 35 1,023 105 106
Richmond 29 1,135 107 102
Surrey 49 746 108 131
Prince George 23 1,229 110 105
Port Coquitlam 34 962 114 118
Port Moody 27 1,096 115 121
North Cowichan 34 857 122 116
Mission 26 985 125 146
Campbell River 21 1,013 130 120
Saanich 27 864 131 129
Langley City 27 858 132 98
Burnaby 17 984 137 134
Nanaimo 12 987 143 137
Average: 40 912
The “overall rank” assigned to each municipality is an equally-weighted combination of two indicators: (1) 2000 - 2011 real operating spending per capita, or % growth in operating spending the past decade adjusted for inflation and population growth; and (2) 2011 operating spending per capita, or in other words, how much a resident pays for the operations of their local government in 2011.
CFIB BC Municipal Spending Watch 2013
www.cfib.ca
6 6
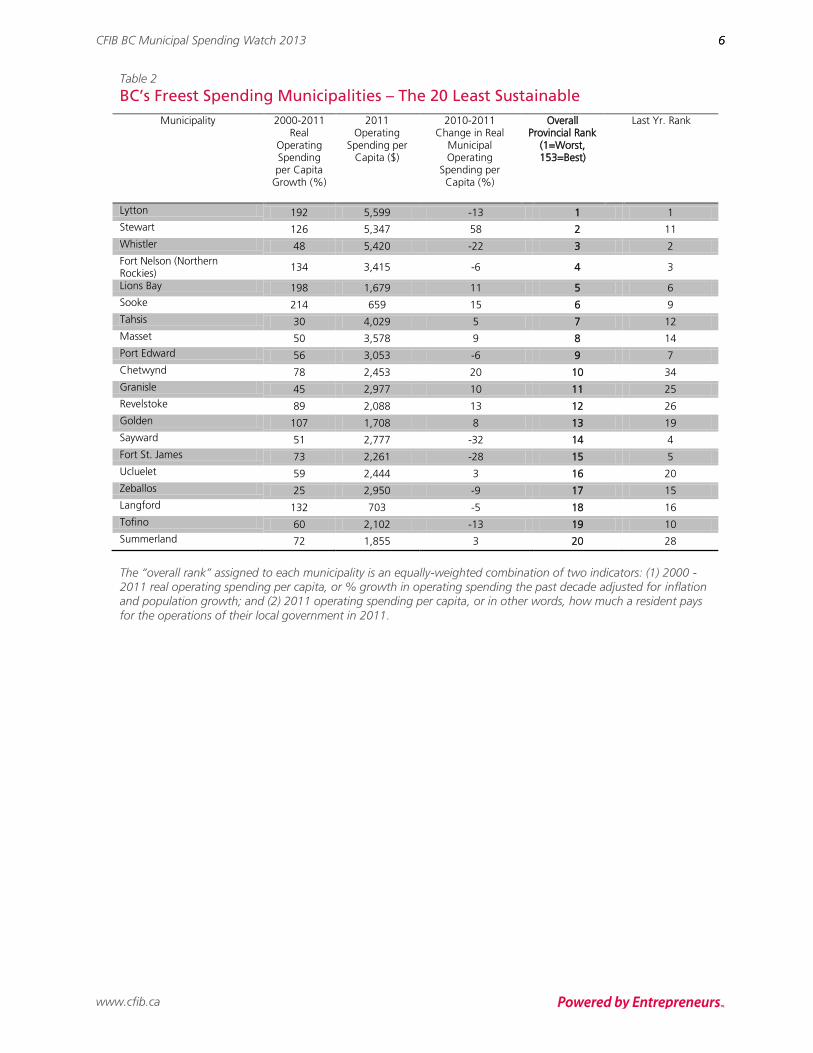
Table 2
BC’s Freest Spending Municipalities – The 20 Least Sustainable
Municipality 2000-2011 Real
Operating Spending per Capita
Growth (%)
2011 Operating
Spending per Capita ($)
2010-2011 Change in Real
Municipal Operating
Spending per Capita (%)
Overall Provincial Rank
(1=Worst, 153=Best)
Last Yr. Rank
Lytton 192 5,599 -13 1 1
Stewart 126 5,347 58 2 11
Whistler 48 5,420 -22 3 2
Fort Nelson (Northern Rockies)
134 3,415 -6 4 3
Lions Bay 198 1,679 11 5 6
Sooke 214 659 15 6 9
Tahsis 30 4,029 5 7 12
Masset 50 3,578 9 8 14
Port Edward 56 3,053 -6 9 7
Chetwynd 78 2,453 20 10 34
Granisle 45 2,977 10 11 25
Revelstoke 89 2,088 13 12 26
Golden 107 1,708 8 13 19
Sayward 51 2,777 -32 14 4
Fort St. James 73 2,261 -28 15 5
Ucluelet 59 2,444 3 16 20
Zeballos 25 2,950 -9 17 15
Langford 132 703 -5 18 16
Tofino 60 2,102 -13 19 10
Summerland 72 1,855 3 20 28
The “overall rank” assigned to each municipality is an equally-weighted combination of two indicators: (1) 2000 - 2011 real operating spending per capita, or % growth in operating spending the past decade adjusted for inflation and population growth; and (2) 2011 operating spending per capita, or in other words, how much a resident pays for the operations of their local government in 2011.
CFIB BC Municipal Spending Watch 2013
www.cfib.ca
7 7
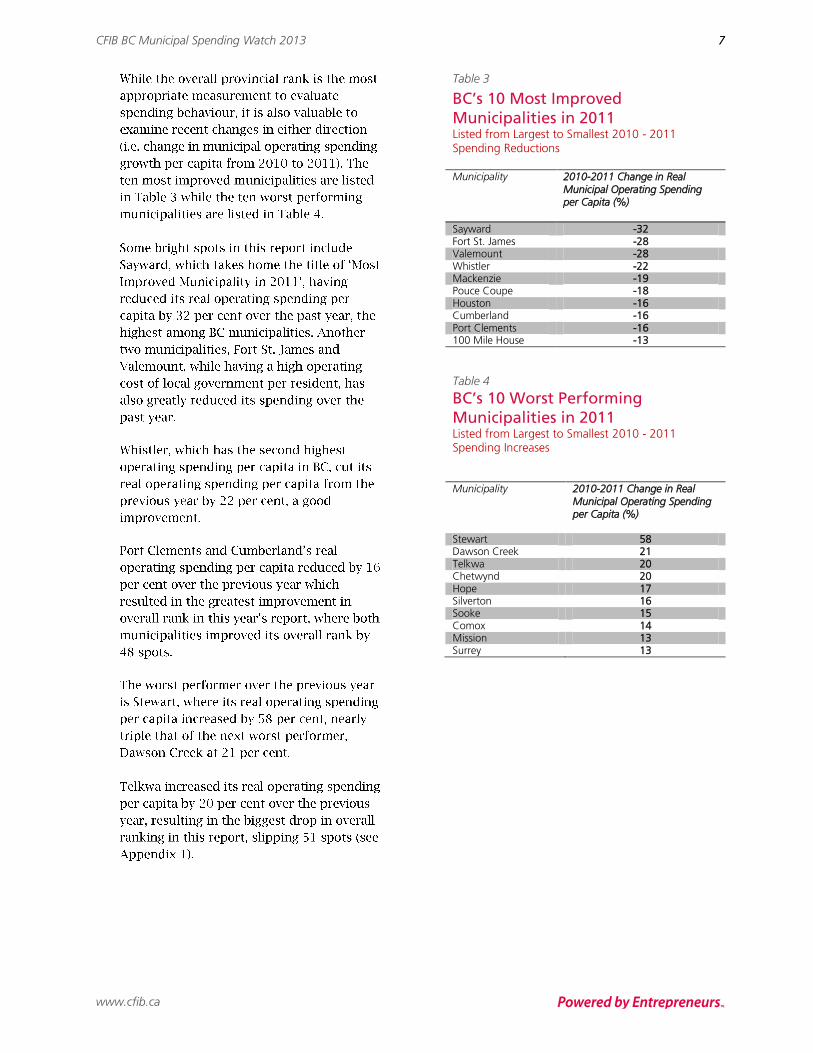
Table 3
BC’s 10 Most Improved
Municipalities in 2011 Listed from Largest to Smallest 2010 - 2011 Spending Reductions Municipality 2010-2011 Change in Real
Municipal Operating Spending per Capita (%)
Sayward -32 Fort St. James -28 Valemount -28 Whistler -22 Mackenzie -19 Pouce Coupe -18 Houston -16 Cumberland -16 Port Clements -16 100 Mile House -13
Table 4
BC’s 10 Worst Performing
Municipalities in 2011 Listed from Largest to Smallest 2010 - 2011 Spending Increases
Municipality 2010-2011 Change in Real Municipal Operating Spending per Capita (%)
Stewart 58 Dawson Creek 21 Telkwa 20 Chetwynd 20 Hope 17 Silverton 16 Sooke 15 Comox 14 Mission 13 Surrey 13
CFIB BC Municipal Spending Watch 2013
www.cfib.ca
8 8
5A standardized index is created for each indicator
(between 1 and 100). A municipality with the highest real operating spending per capita growth is given a score of 1 while the municipality with the lowest 2010 – 2011 real operating spending per capita growth is given a score of 100. All other municipalities are given a proportionate score within that range. The same exercise is applied to the indicator for the 2011 operating spending per capita. 6 Lam, Janice. 2011. BC Policing Costs.
7In the case of West Vancouver, transportation and
transit expenses have also been excluded from operating spending due to special circumstances in
these expenses after 2000. This is addressed in the previous editions of this report. Due to changes in accounting practices, starting from 2008, amortization is excluded from total expenses.
8 The BC savings for a family of 4 ($5,302) was
calculated based on BC total operating spending in 2000 and inflation/population growth rates up to 2011.The BC population figure was based on the year 2011.
CFIB BC Municipal Spending Watch 2013
www.cfib.ca
9 9
9 Ministry of Community, Sport, & Cultural
Development. 2011. Local Government Statistics 10Kastelen, Kimball. The BC Municipal Property Tax
Gap 11Ibid.
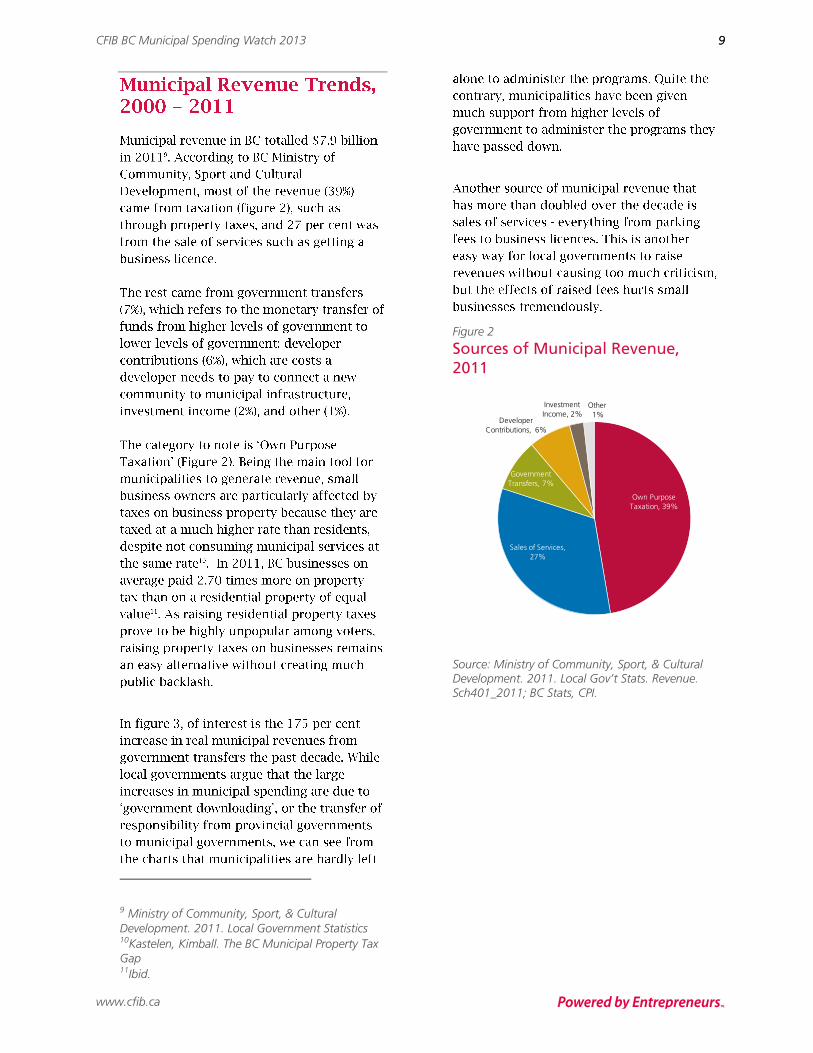
Figure 2
Sources of Municipal Revenue,
2011
Source: Ministry of Community, Sport, & Cultural Development. 2011. Local Gov’t Stats. Revenue. Sch401_2011; BC Stats, CPI.
Own Purpose
Taxation, 39%
Sales of Services,
27%
Government
Transfers, 7%
Developer
Contributions, 6%
Investment
Income, 2%Other
1%

CFIB BC Municipal Spending Watch 2013
www.cfib.ca
10 10
Figure 3
Growth of Revenue Sources,
inflation adjusted, 2000 – 2011
Source: Ministry of Community, Sport, & Cultural Development. 2011. Local Gov’t Stats. Revenue. Sch401_2000 -2011; BC Stats, CPI.
Figure 4
Allocation of Municipal Spending,
2011
Source: Ministry of Community, Sport, & Cultural Development. 2011. Local Gov’t Stats, Expenditure. Sch402_2011.
Mallett, Ted. Wong, Queenie. Canadian
Federation of Independent Business. 2008. Wage Watch: A Comparison of Public-sector and Private-sector Wages 13
Provincial Guidance. Community, Sport and
Cultural Development.
46%
107%
175%
479%
60%
Own Purpose Taxation
Sales of Services Government Transfers
Developer Contributions
Total Revenue
17%
13%
5%
1%4%
14%
24%
18%
4%
General Government
Protective Services
(Excluding Policing Cost)
Solid Waste Mgmt and
Recycling
Health, Social Services
and Housing
Development Services
Transportation and
Transit
Parks, Recreation and
Culture
Water and Sewer
Services
Other Services

CFIB BC Municipal Spending Watch 2013
www.cfib.ca
11 11
Figure 5
Growth of Spending, by
expenditure category, adjusted to
inflation, 2000 – 2011
Source: Ministry of Community, Sport, & Cultural Development. 2000-2011. Local Gov’t Stats, Expenditure. Sch402_2000-2011; BC Stats, CPI.
Figure 6
BC Regional Real Operating
Spending Growth and Population
Growth, 2000 – 2011
Source: Ministry of Community, Sport, & Cultural
Development. 2000-2011. Local Gov’t Stats,
Expenditure. Sch402_2000-2011; BC Stats,
Population Estimates 2000-2011; BC Stats, CPI.
42%
43%
76%
-55%
59%
53%
72%
79%
130%
-60% -40% -20% 0% 20% 40% 60% 80% 100% 120% 140%
General Government
Protective Services (Excluding Policing Cost)
Solid Waste Mgmt and Recycling
Health, Social Services and Housing
Development Services
Transportation and Transit
Parks, Recreation and Culture
Water and Sewer Services
Other Services
68%
54%
46%
38%
32%
15%
7% 6% 4%
-4%-10%
0%
10%
20%
30%
40%
50%
60%
70%
80%
Van. Coast &
Mountains
Van. Island Thomp-Oak Koot-Rock & Carib-
Chil
North BC
Real Operating Spending Growth Population Growth

CFIB BC Municipal Spending Watch 2013
www.cfib.ca
12 12
CFIB BC Municipal Spending Watch 2013
www.cfib.ca
13 13
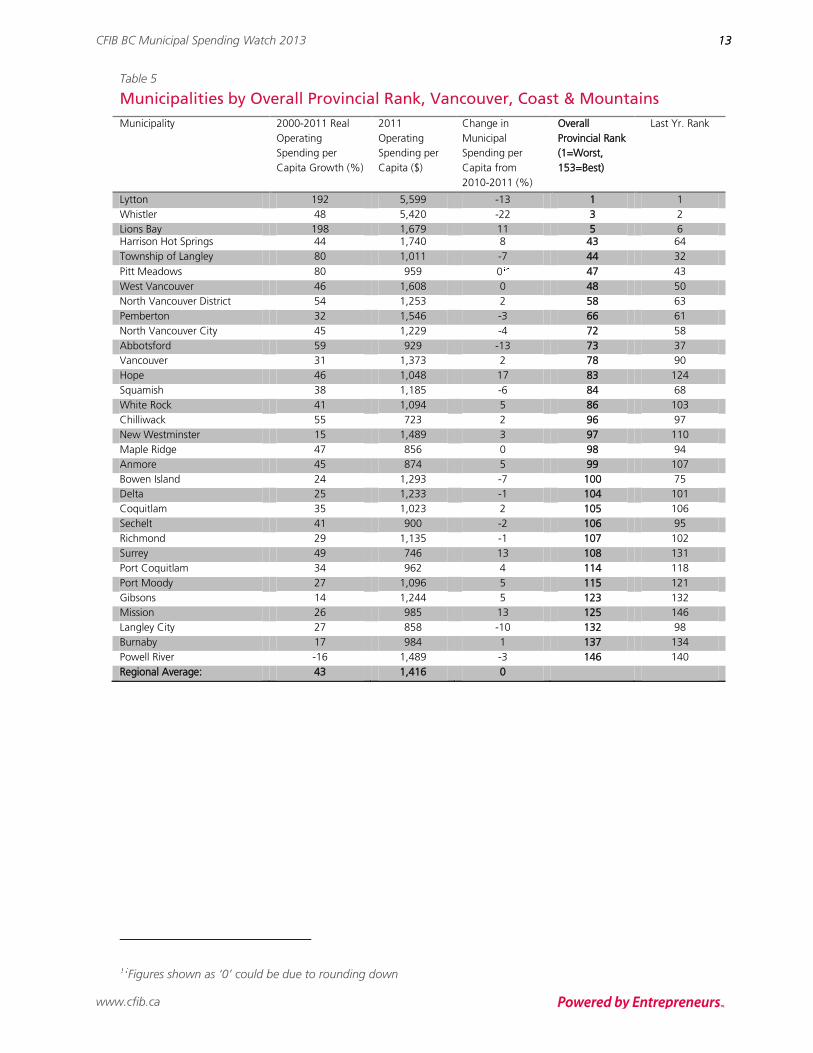
Table 5
Municipalities by Overall Provincial Rank, Vancouver, Coast & Mountains
Municipality 2000-2011 Real
Operating
Spending per
Capita Growth (%)
2011
Operating
Spending per
Capita ($)
Change in
Municipal
Spending per
Capita from
2010-2011 (%)
Overall
Provincial Rank
(1=Worst,
153=Best)
Last Yr. Rank
Lytton 192 5,599 -13 1 1
Whistler 48 5,420 -22 3 2
Lions Bay 198 1,679 11 5 6 Harrison Hot Springs 44 1,740 8 43 64
Township of Langley 80 1,011 -7 44 32
Pitt Meadows 80 959 0 47 43
West Vancouver 46 1,608 0 48 50
North Vancouver District 54 1,253 2 58 63
Pemberton 32 1,546 -3 66 61
North Vancouver City 45 1,229 -4 72 58
Abbotsford 59 929 -13 73 37
Vancouver 31 1,373 2 78 90
Hope 46 1,048 17 83 124
Squamish 38 1,185 -6 84 68
White Rock 41 1,094 5 86 103
Chilliwack 55 723 2 96 97
New Westminster 15 1,489 3 97 110
Maple Ridge 47 856 0 98 94
Anmore 45 874 5 99 107
Bowen Island 24 1,293 -7 100 75
Delta 25 1,233 -1 104 101
Coquitlam 35 1,023 2 105 106
Sechelt 41 900 -2 106 95
Richmond 29 1,135 -1 107 102
Surrey 49 746 13 108 131
Port Coquitlam 34 962 4 114 118
Port Moody 27 1,096 5 115 121
Gibsons 14 1,244 5 123 132
Mission 26 985 13 125 146
Langley City 27 858 -10 132 98
Burnaby 17 984 1 137 134
Powell River -16 1,489 -3 146 140
Regional Average: 43 1,416 0
Figures shown as ‘0’ could be due to rounding down
CFIB BC Municipal Spending Watch 2013
www.cfib.ca
14 14
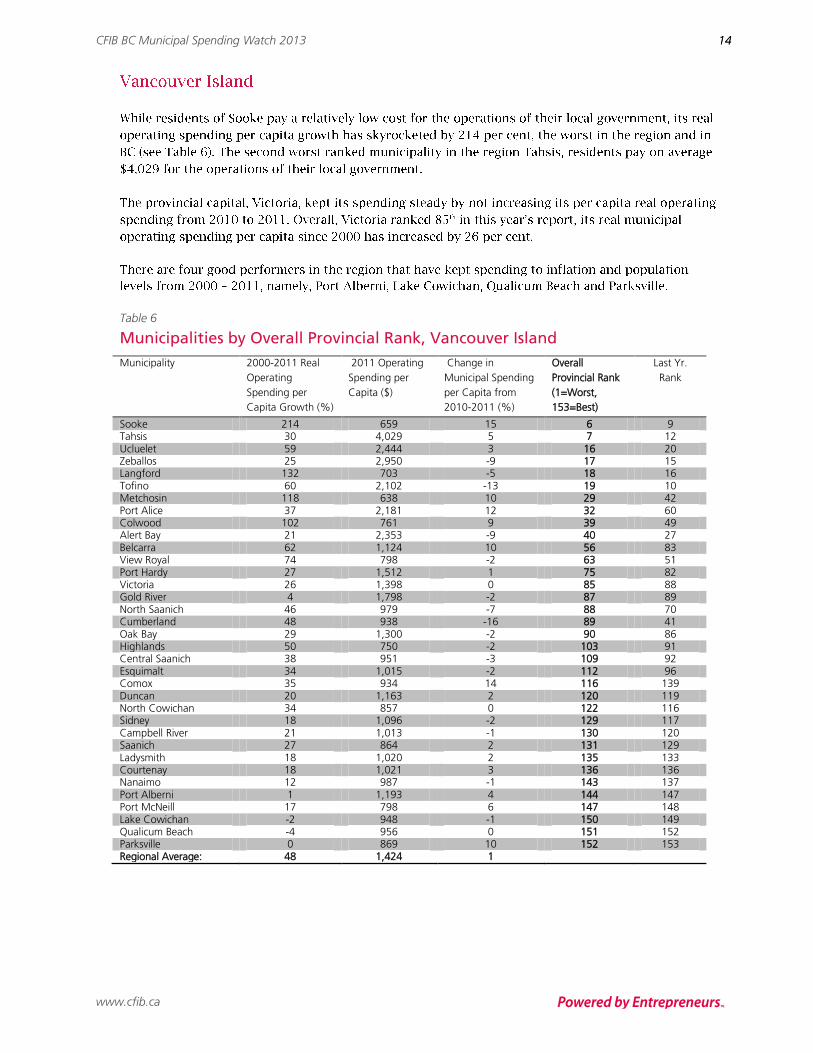
Table 6
Municipalities by Overall Provincial Rank, Vancouver Island
Municipality 2000-2011 Real
Operating
Spending per
Capita Growth (%)
2011 Operating
Spending per
Capita ($)
Change in
Municipal Spending
per Capita from
2010-2011 (%)
Overall
Provincial Rank
(1=Worst,
153=Best)
Last Yr.
Rank
Sooke 214 659 15 6 9 Tahsis 30 4,029 5 7 12 Ucluelet 59 2,444 3 16 20 Zeballos 25 2,950 -9 17 15 Langford 132 703 -5 18 16 Tofino 60 2,102 -13 19 10 Metchosin 118 638 10 29 42 Port Alice 37 2,181 12 32 60 Colwood 102 761 9 39 49 Alert Bay 21 2,353 -9 40 27 Belcarra 62 1,124 10 56 83 View Royal 74 798 -2 63 51 Port Hardy 27 1,512 1 75 82 Victoria 26 1,398 0 85 88 Gold River 4 1,798 -2 87 89 North Saanich 46 979 -7 88 70 Cumberland 48 938 -16 89 41 Oak Bay 29 1,300 -2 90 86 Highlands 50 750 -2 103 91 Central Saanich 38 951 -3 109 92 Esquimalt 34 1,015 -2 112 96 Comox 35 934 14 116 139 Duncan 20 1,163 2 120 119 North Cowichan 34 857 0 122 116 Sidney 18 1,096 -2 129 117 Campbell River 21 1,013 -1 130 120 Saanich 27 864 2 131 129 Ladysmith 18 1,020 2 135 133 Courtenay 18 1,021 3 136 136 Nanaimo 12 987 -1 143 137 Port Alberni 1 1,193 4 144 147 Port McNeill 17 798 6 147 148 Lake Cowichan -2 948 -1 150 149 Qualicum Beach -4 956 0 151 152 Parksville 0 869 10 152 153 Regional Average: 48 1,424 1
CFIB BC Municipal Spending Watch 2013
www.cfib.ca
15 15
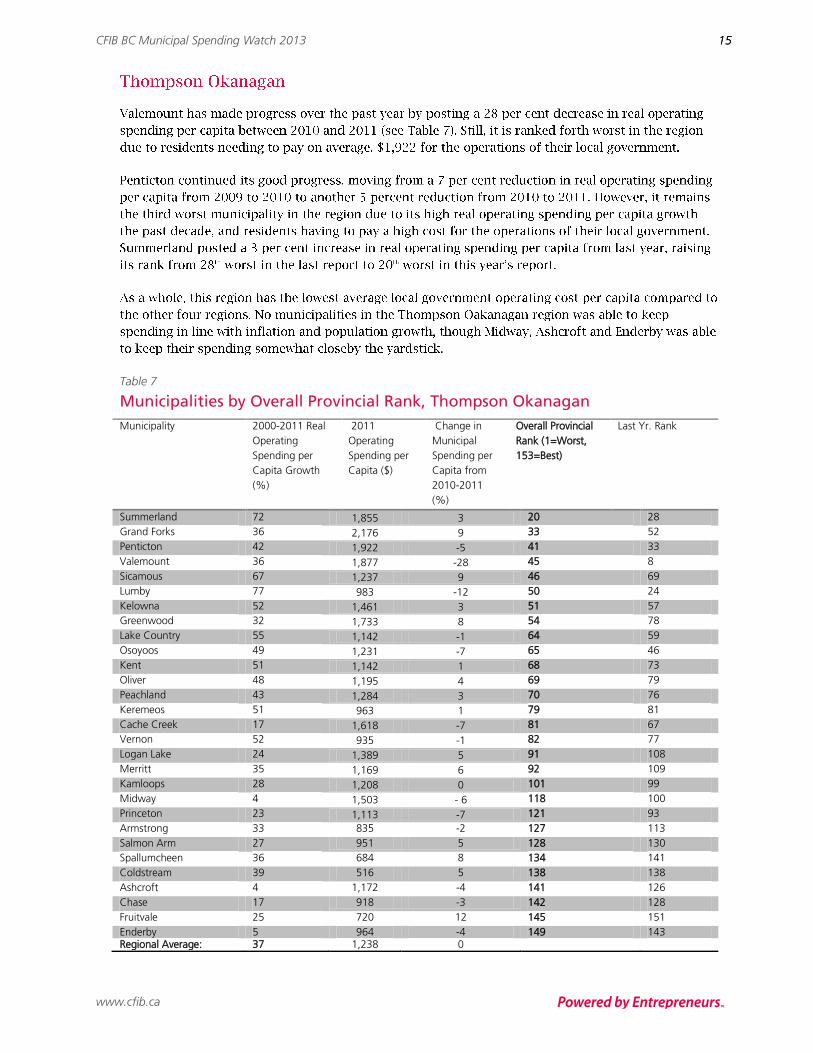
Table 7
Municipalities by Overall Provincial Rank, Thompson Okanagan
Municipality 2000-2011 Real
Operating
Spending per
Capita Growth
(%)
2011
Operating
Spending per
Capita ($)
Change in
Municipal
Spending per
Capita from
2010-2011
(%)
Overall Provincial
Rank (1=Worst,
153=Best)
Last Yr. Rank
Summerland 72 1,855 3 20 28
Grand Forks 36 2,176 9 33 52
Penticton 42 1,922 -5 41 33
Valemount 36 1,877 -28 45 8
Sicamous 67 1,237 9 46 69
Lumby 77 983 -12 50 24
Kelowna 52 1,461 3 51 57
Greenwood 32 1,733 8 54 78
Lake Country 55 1,142 -1 64 59
Osoyoos 49 1,231 -7 65 46
Kent 51 1,142 1 68 73
Oliver 48 1,195 4 69 79
Peachland 43 1,284 3 70 76
Keremeos 51 963 1 79 81
Cache Creek 17 1,618 -7 81 67
Vernon 52 935 -1 82 77
Logan Lake 24 1,389 5 91 108
Merritt 35 1,169 6 92 109
Kamloops 28 1,208 0 101 99
Midway 4 1,503 - 6 118 100
Princeton 23 1,113 -7 121 93
Armstrong 33 835 -2 127 113
Salmon Arm 27 951 5 128 130
Spallumcheen 36 684 8 134 141
Coldstream 39 516 5 138 138
Ashcroft 4 1,172 -4 141 126
Chase 17 918 -3 142 128
Fruitvale 25 720 12 145 151
Enderby 5 964 -4 149 143 Regional Average: 37 1,238 0
CFIB BC Municipal Spending Watch 2013
www.cfib.ca
16 16
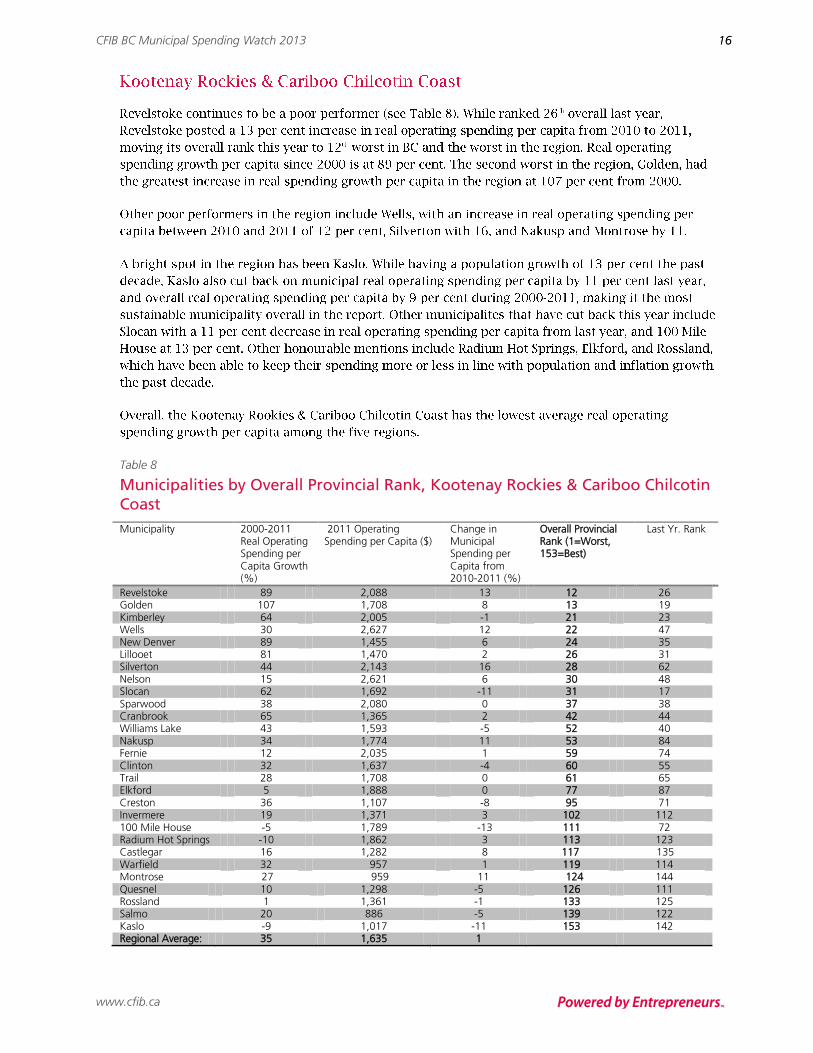
Table 8
Municipalities by Overall Provincial Rank, Kootenay Rockies & Cariboo Chilcotin
Coast
Municipality 2000-2011 Real Operating Spending per Capita Growth (%)
2011 Operating Spending per Capita ($)
Change in Municipal Spending per Capita from 2010-2011 (%)
Overall Provincial Rank (1=Worst, 153=Best)
Last Yr. Rank
Revelstoke 89 2,088 13 12 26 Golden 107 1,708 8 13 19 Kimberley 64 2,005 -1 21 23 Wells 30 2,627 12 22 47 New Denver 89 1,455 6 24 35 Lillooet 81 1,470 2 26 31 Silverton 44 2,143 16 28 62 Nelson 15 2,621 6 30 48 Slocan 62 1,692 -11 31 17 Sparwood 38 2,080 0 37 38 Cranbrook 65 1,365 2 42 44 Williams Lake 43 1,593 -5 52 40 Nakusp 34 1,774 11 53 84 Fernie 12 2,035 1 59 74 Clinton 32 1,637 -4 60 55 Trail 28 1,708 0 61 65 Elkford 5 1,888 0 77 87 Creston 36 1,107 -8 95 71 Invermere 19 1,371 3 102 112 100 Mile House -5 1,789 -13 111 72 Radium Hot Springs -10 1,862 3 113 123 Castlegar 16 1,282 8 117 135 Warfield 32 957 1 119 114 Montrose
27 959 11 124 144
Quesnel 10 1,298 -5 126 111 Rossland 1 1,361 -1 133 125 Salmo 20 886 -5 139 122 Kaslo -9 1,017 -11 153 142 Regional Average: 35 1,635 1
CFIB BC Municipal Spending Watch 2013
www.cfib.ca
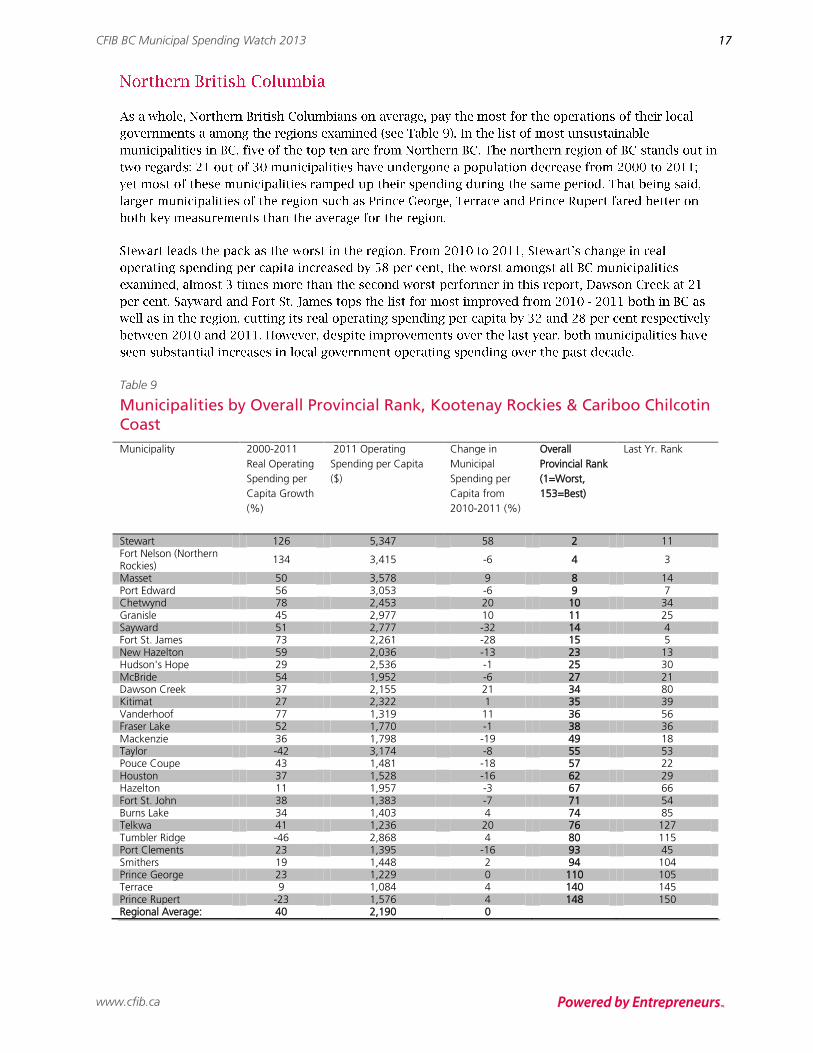
17 17
Table 9
Municipalities by Overall Provincial Rank, Kootenay Rockies & Cariboo Chilcotin
Coast
Municipality 2000-2011
Real Operating
Spending per
Capita Growth
(%)
2011 Operating
Spending per Capita
($)
Change in
Municipal
Spending per
Capita from
2010-2011 (%)
Overall
Provincial Rank
(1=Worst,
153=Best)
Last Yr. Rank
Stewart 126 5,347 58 2 11 Fort Nelson (Northern Rockies)
134 3,415 -6 4 3
Masset 50 3,578 9 8 14 Port Edward 56 3,053 -6 9 7 Chetwynd 78 2,453 20 10 34 Granisle 45 2,977 10 11 25 Sayward 51 2,777 -32 14 4 Fort St. James 73 2,261 -28 15 5 New Hazelton 59 2,036 -13 23 13 Hudson's Hope 29 2,536 -1 25 30 McBride 54 1,952 -6 27 21 Dawson Creek 37 2,155 21 34 80 Kitimat 27 2,322 1 35 39 Vanderhoof 77 1,319 11 36 56 Fraser Lake 52 1,770 -1 38 36 Mackenzie 36 1,798 -19 49 18 Taylor -42 3,174 -8 55 53 Pouce Coupe 43 1,481 -18 57 22 Houston 37 1,528 -16 62 29 Hazelton 11 1,957 -3 67 66 Fort St. John 38 1,383 -7 71 54 Burns Lake 34 1,403 4 74 85 Telkwa 41 1,236 20 76 127 Tumbler Ridge -46 2,868 4 80 115 Port Clements 23 1,395 -16 93 45 Smithers 19 1,448 2 94 104 Prince George 23 1,229 0 110 105 Terrace 9 1,084 4 140 145 Prince Rupert -23 1,576 4 148 150 Regional Average: 40 2,190 0
www.cfib.ca
18
15 Mallett, Ted. Wong, Queenie. Canadian Federation of Independent Business. 2008. Wage Watch: A Comparison of
Public-sector and Private-sector Wages 16 Armstrong, Matthew and Jones, Laura. British Columbia Municipal Spending Watch.
CFIB BC Municipal Spending Watch 2013
www.cfib.ca
19 19
,
,
,
CFIB BC Municipal Spending Watch 2013
www.cfib.ca
20 20
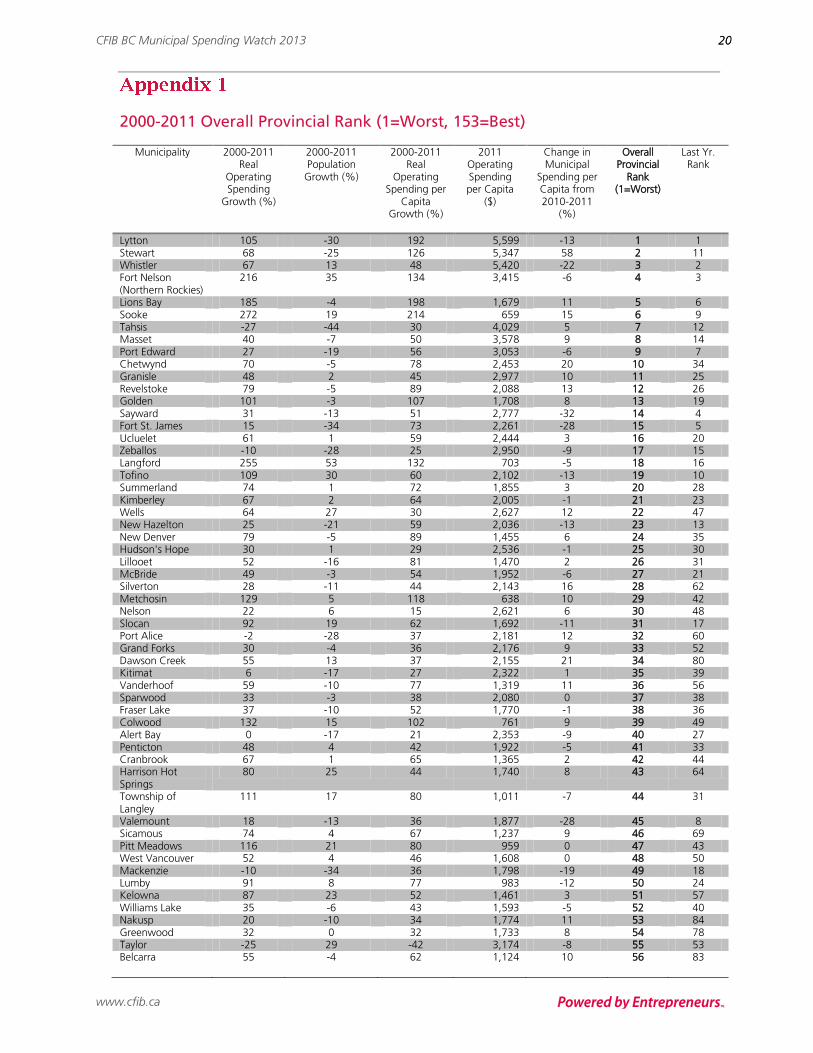
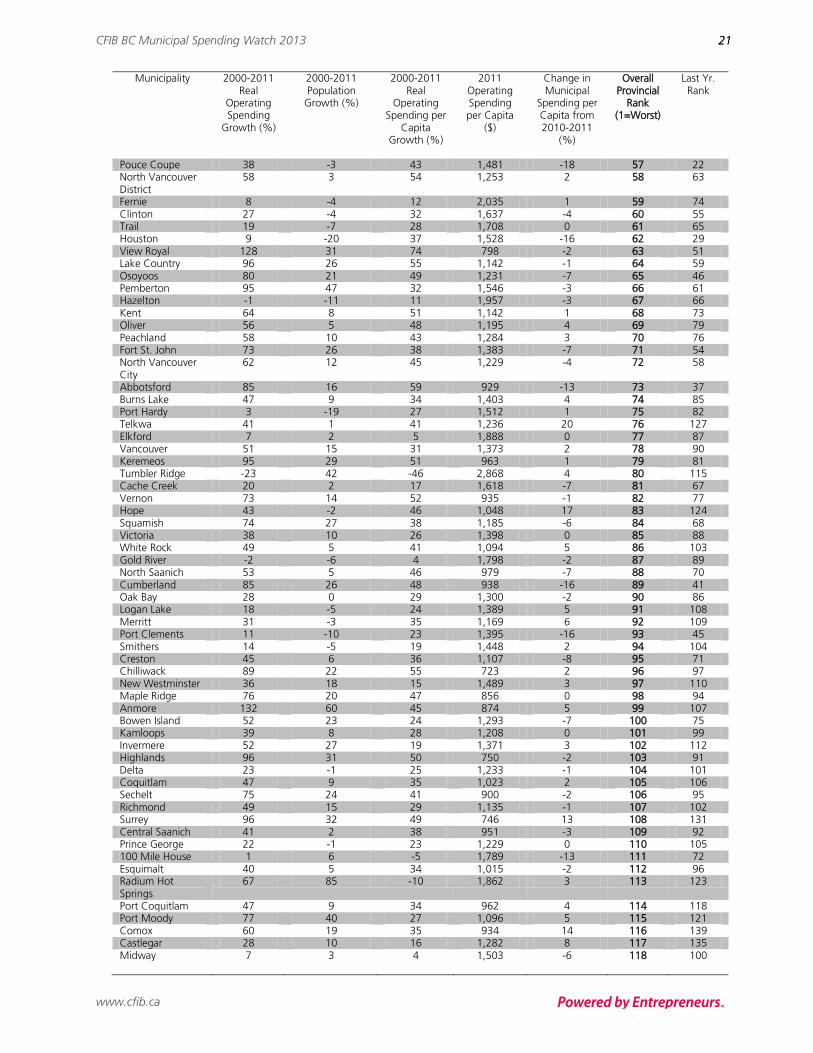
2000-2011 Overall Provincial Rank (1=Worst, 153=Best)
Municipality 2000-2011
Real Operating Spending
Growth (%)
2000-2011 Population
Growth (%)
2000-2011 Real
Operating Spending per
Capita Growth (%)
2011 Operating Spending per Capita
($)
Change in Municipal
Spending per Capita from 2010-2011
(%)
Overall Provincial
Rank (1=Worst)
Last Yr. Rank
Lytton 105 -30 192 5,599 -13 1 1 Stewart 68 -25 126 5,347 58 2 11 Whistler 67 13 48 5,420 -22 3 2 Fort Nelson (Northern Rockies)
216 35 134 3,415 -6 4 3
Lions Bay 185 -4 198 1,679 11 5 6 Sooke 272 19 214 659 15 6 9 Tahsis -27 -44 30 4,029 5 7 12 Masset 40 -7 50 3,578 9 8 14 Port Edward 27 -19 56 3,053 -6 9 7 Chetwynd 70 -5 78 2,453 20 10 34 Granisle 48 2 45 2,977 10 11 25 Revelstoke 79 -5 89 2,088 13 12 26 Golden 101 -3 107 1,708 8 13 19 Sayward 31 -13 51 2,777 -32 14 4 Fort St. James 15 -34 73 2,261 -28 15 5 Ucluelet 61 1 59 2,444 3 16 20 Zeballos -10 -28 25 2,950 -9 17 15 Langford 255 53 132 703 -5 18 16 Tofino 109 30 60 2,102 -13 19 10 Summerland 74 1 72 1,855 3 20 28 Kimberley 67 2 64 2,005 -1 21 23 Wells 64 27 30 2,627 12 22 47 New Hazelton 25 -21 59 2,036 -13 23 13 New Denver 79 -5 89 1,455 6 24 35 Hudson's Hope 30 1 29 2,536 -1 25 30 Lillooet 52 -16 81 1,470 2 26 31 McBride 49 -3 54 1,952 -6 27 21 Silverton 28 -11 44 2,143 16 28 62 Metchosin 129 5 118 638 10 29 42 Nelson 22 6 15 2,621 6 30 48 Slocan 92 19 62 1,692 -11 31 17 Port Alice -2 -28 37 2,181 12 32 60 Grand Forks 30 -4 36 2,176 9 33 52 Dawson Creek 55 13 37 2,155 21 34 80 Kitimat 6 -17 27 2,322 1 35 39 Vanderhoof 59 -10 77 1,319 11 36 56 Sparwood 33 -3 38 2,080 0 37 38 Fraser Lake 37 -10 52 1,770 -1 38 36 Colwood 132 15 102 761 9 39 49 Alert Bay 0 -17 21 2,353 -9 40 27 Penticton 48 4 42 1,922 -5 41 33 Cranbrook 67 1 65 1,365 2 42 44 Harrison Hot Springs
80 25 44 1,740 8 43 64
Township of Langley
111 17 80 1,011 -7 44 31
Valemount 18 -13 36 1,877 -28 45 8 Sicamous 74 4 67 1,237 9 46 69 Pitt Meadows 116 21 80 959 0 47 43 West Vancouver 52 4 46 1,608 0 48 50 Mackenzie -10 -34 36 1,798 -19 49 18 Lumby 91 8 77 983 -12 50 24 Kelowna 87 23 52 1,461 3 51 57 Williams Lake 35 -6 43 1,593 -5 52 40 Nakusp 20 -10 34 1,774 11 53 84 Greenwood 32 0 32 1,733 8 54 78 Taylor -25 29 -42 3,174 -8 55 53 Belcarra 55 -4 62 1,124 10 56 83
CFIB BC Municipal Spending Watch 2013
www.cfib.ca
21 21
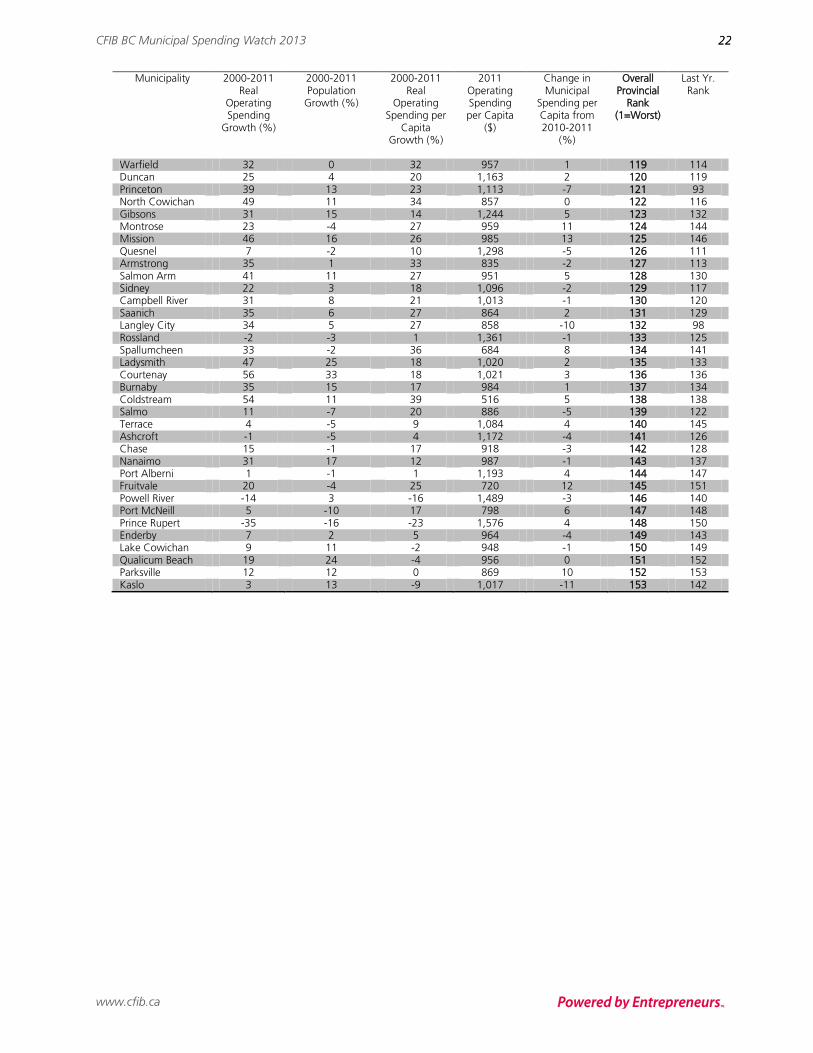
Municipality 2000-2011 Real
Operating Spending
Growth (%)
2000-2011 Population
Growth (%)
2000-2011 Real
Operating Spending per
Capita Growth (%)
2011 Operating Spending per Capita
($)
Change in Municipal
Spending per Capita from 2010-2011
(%)
Overall Provincial
Rank (1=Worst)
Last Yr. Rank
Pouce Coupe 38 -3 43 1,481 -18 57 22 North Vancouver District
58 3 54 1,253 2 58 63
Fernie 8 -4 12 2,035 1 59 74 Clinton 27 -4 32 1,637 -4 60 55 Trail 19 -7 28 1,708 0 61 65 Houston 9 -20 37 1,528 -16 62 29 View Royal 128 31 74 798 -2 63 51 Lake Country 96 26 55 1,142 -1 64 59 Osoyoos 80 21 49 1,231 -7 65 46 Pemberton 95 47 32 1,546 -3 66 61 Hazelton -1 -11 11 1,957 -3 67 66 Kent 64 8 51 1,142 1 68 73 Oliver 56 5 48 1,195 4 69 79 Peachland 58 10 43 1,284 3 70 76 Fort St. John 73 26 38 1,383 -7 71 54 North Vancouver City
62 12 45 1,229 -4 72 58
Abbotsford 85 16 59 929 -13 73 37 Burns Lake 47 9 34 1,403 4 74 85 Port Hardy 3 -19 27 1,512 1 75 82 Telkwa 41 1 41 1,236 20 76 127 Elkford 7 2 5 1,888 0 77 87 Vancouver 51 15 31 1,373 2 78 90 Keremeos 95 29 51 963 1 79 81 Tumbler Ridge -23 42 -46 2,868 4 80 115 Cache Creek 20 2 17 1,618 -7 81 67 Vernon 73 14 52 935 -1 82 77 Hope 43 -2 46 1,048 17 83 124 Squamish 74 27 38 1,185 -6 84 68 Victoria 38 10 26 1,398 0 85 88 White Rock 49 5 41 1,094 5 86 103 Gold River -2 -6 4 1,798 -2 87 89 North Saanich 53 5 46 979 -7 88 70 Cumberland 85 26 48 938 -16 89 41 Oak Bay 28 0 29 1,300 -2 90 86 Logan Lake 18 -5 24 1,389 5 91 108 Merritt 31 -3 35 1,169 6 92 109 Port Clements 11 -10 23 1,395 -16 93 45 Smithers 14 -5 19 1,448 2 94 104 Creston 45 6 36 1,107 -8 95 71 Chilliwack 89 22 55 723 2 96 97 New Westminster 36 18 15 1,489 3 97 110 Maple Ridge 76 20 47 856 0 98 94 Anmore 132 60 45 874 5 99 107 Bowen Island 52 23 24 1,293 -7 100 75 Kamloops 39 8 28 1,208 0 101 99 Invermere 52 27 19 1,371 3 102 112 Highlands 96 31 50 750 -2 103 91 Delta 23 -1 25 1,233 -1 104 101 Coquitlam 47 9 35 1,023 2 105 106 Sechelt 75 24 41 900 -2 106 95 Richmond 49 15 29 1,135 -1 107 102 Surrey 96 32 49 746 13 108 131 Central Saanich 41 2 38 951 -3 109 92 Prince George 22 -1 23 1,229 0 110 105 100 Mile House 1 6 -5 1,789 -13 111 72 Esquimalt 40 5 34 1,015 -2 112 96 Radium Hot Springs
67 85 -10 1,862 3 113 123
Port Coquitlam 47 9 34 962 4 114 118 Port Moody 77 40 27 1,096 5 115 121 Comox 60 19 35 934 14 116 139 Castlegar 28 10 16 1,282 8 117 135 Midway 7 3 4 1,503 -6 118 100
CFIB BC Municipal Spending Watch 2013
www.cfib.ca
22 22
Municipality 2000-2011 Real
Operating Spending
Growth (%)
2000-2011 Population
Growth (%)
2000-2011 Real
Operating Spending per
Capita Growth (%)
2011 Operating Spending per Capita
($)
Change in Municipal
Spending per Capita from 2010-2011
(%)
Overall Provincial
Rank (1=Worst)
Last Yr. Rank
Warfield 32 0 32 957 1 119 114 Duncan 25 4 20 1,163 2 120 119 Princeton 39 13 23 1,113 -7 121 93 North Cowichan 49 11 34 857 0 122 116 Gibsons 31 15 14 1,244 5 123 132 Montrose 23 -4 27 959 11 124 144 Mission 46 16 26 985 13 125 146 Quesnel 7 -2 10 1,298 -5 126 111 Armstrong 35 1 33 835 -2 127 113 Salmon Arm 41 11 27 951 5 128 130 Sidney 22 3 18 1,096 -2 129 117 Campbell River 31 8 21 1,013 -1 130 120 Saanich 35 6 27 864 2 131 129 Langley City 34 5 27 858 -10 132 98 Rossland -2 -3 1 1,361 -1 133 125 Spallumcheen 33 -2 36 684 8 134 141 Ladysmith 47 25 18 1,020 2 135 133 Courtenay 56 33 18 1,021 3 136 136 Burnaby 35 15 17 984 1 137 134 Coldstream 54 11 39 516 5 138 138 Salmo 11 -7 20 886 -5 139 122 Terrace 4 -5 9 1,084 4 140 145 Ashcroft -1 -5 4 1,172 -4 141 126 Chase 15 -1 17 918 -3 142 128 Nanaimo 31 17 12 987 -1 143 137 Port Alberni 1 -1 1 1,193 4 144 147 Fruitvale 20 -4 25 720 12 145 151 Powell River -14 3 -16 1,489 -3 146 140 Port McNeill 5 -10 17 798 6 147 148 Prince Rupert -35 -16 -23 1,576 4 148 150 Enderby 7 2 5 964 -4 149 143 Lake Cowichan 9 11 -2 948 -1 150 149 Qualicum Beach 19 24 -4 956 0 151 152 Parksville 12 12 0 869 10 152 153 Kaslo 3 13 -9 1,017 -11 153 142
CFIB BC Municipal Spending Watch 2013
www.cfib.ca
23 23
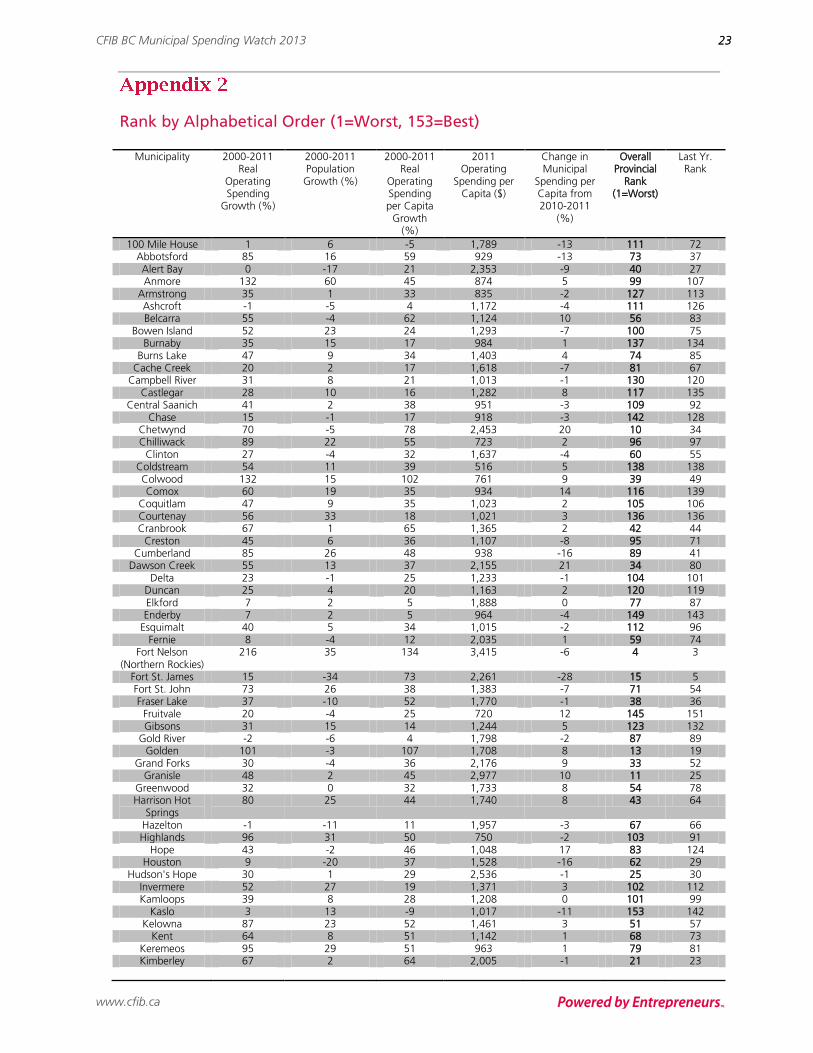
Rank by Alphabetical Order (1=Worst, 153=Best)
Municipality 2000-2011
Real Operating Spending
Growth (%)
2000-2011 Population Growth (%)
2000-2011 Real
Operating Spending per Capita
Growth (%)
2011 Operating
Spending per Capita ($)
Change in Municipal
Spending per Capita from 2010-2011
(%)
Overall Provincial
Rank (1=Worst)
Last Yr. Rank
100 Mile House 1 6 -5 1,789 -13 111 72 Abbotsford 85 16 59 929 -13 73 37 Alert Bay 0 -17 21 2,353 -9 40 27 Anmore 132 60 45 874 5 99 107
Armstrong 35 1 33 835 -2 127 113 Ashcroft -1 -5 4 1,172 -4 111 126 Belcarra 55 -4 62 1,124 10 56 83
Bowen Island 52 23 24 1,293 -7 100 75 Burnaby 35 15 17 984 1 137 134
Burns Lake 47 9 34 1,403 4 74 85 Cache Creek 20 2 17 1,618 -7 81 67
Campbell River 31 8 21 1,013 -1 130 120 Castlegar 28 10 16 1,282 8 117 135
Central Saanich 41 2 38 951 -3 109 92 Chase 15 -1 17 918 -3 142 128
Chetwynd 70 -5 78 2,453 20 10 34 Chilliwack 89 22 55 723 2 96 97
Clinton 27 -4 32 1,637 -4 60 55 Coldstream 54 11 39 516 5 138 138 Colwood 132 15 102 761 9 39 49 Comox 60 19 35 934 14 116 139
Coquitlam 47 9 35 1,023 2 105 106 Courtenay 56 33 18 1,021 3 136 136 Cranbrook 67 1 65 1,365 2 42 44
Creston 45 6 36 1,107 -8 95 71 Cumberland 85 26 48 938 -16 89 41
Dawson Creek 55 13 37 2,155 21 34 80 Delta 23 -1 25 1,233 -1 104 101
Duncan 25 4 20 1,163 2 120 119 Elkford 7 2 5 1,888 0 77 87 Enderby 7 2 5 964 -4 149 143
Esquimalt 40 5 34 1,015 -2 112 96 Fernie 8 -4 12 2,035 1 59 74
Fort Nelson (Northern Rockies)
216 35 134 3,415 -6 4 3
Fort St. James 15 -34 73 2,261 -28 15 5 Fort St. John 73 26 38 1,383 -7 71 54 Fraser Lake 37 -10 52 1,770 -1 38 36
Fruitvale 20 -4 25 720 12 145 151 Gibsons 31 15 14 1,244 5 123 132
Gold River -2 -6 4 1,798 -2 87 89 Golden 101 -3 107 1,708 8 13 19
Grand Forks 30 -4 36 2,176 9 33 52 Granisle 48 2 45 2,977 10 11 25
Greenwood 32 0 32 1,733 8 54 78 Harrison Hot
Springs 80 25 44 1,740 8 43 64
Hazelton -1 -11 11 1,957 -3 67 66 Highlands 96 31 50 750 -2 103 91
Hope 43 -2 46 1,048 17 83 124 Houston 9 -20 37 1,528 -16 62 29
Hudson's Hope 30 1 29 2,536 -1 25 30 Invermere 52 27 19 1,371 3 102 112 Kamloops 39 8 28 1,208 0 101 99
Kaslo 3 13 -9 1,017 -11 153 142 Kelowna 87 23 52 1,461 3 51 57
Kent 64 8 51 1,142 1 68 73 Keremeos 95 29 51 963 1 79 81 Kimberley 67 2 64 2,005 -1 21 23
CFIB BC Municipal Spending Watch 2013
www.cfib.ca
24 24
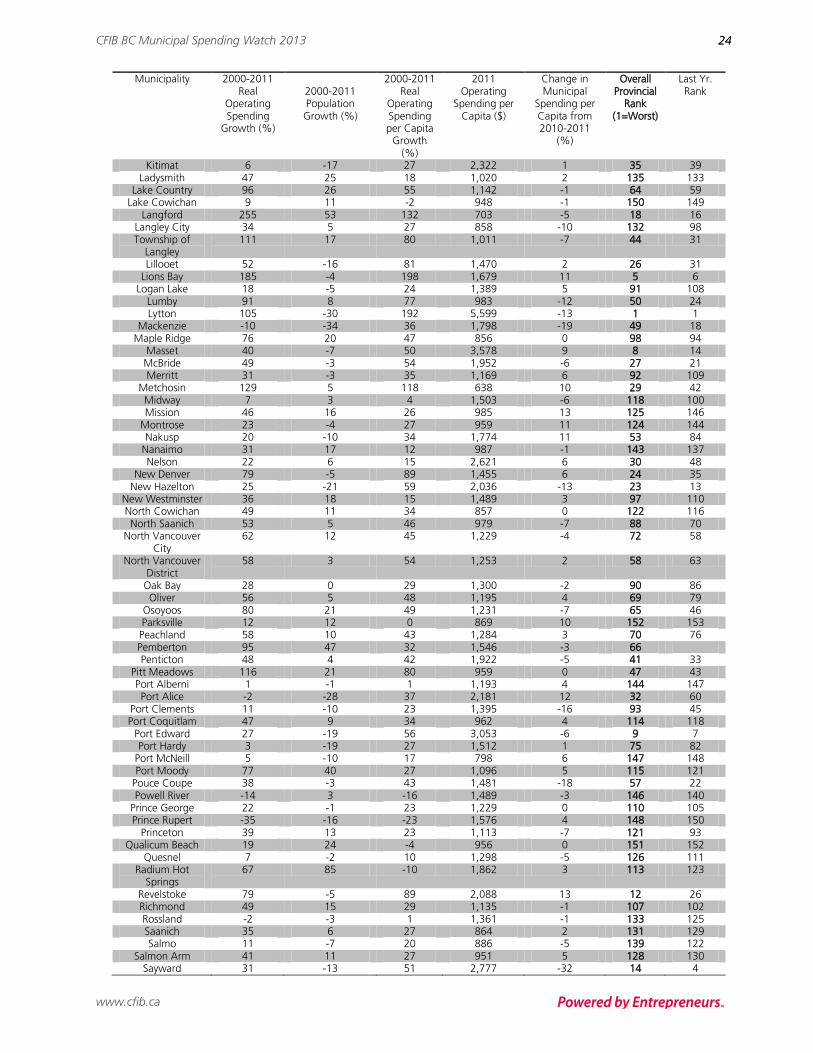
Municipality 2000-2011 Real
Operating Spending
Growth (%)
2000-2011 Population Growth (%)
2000-2011 Real
Operating Spending per Capita
Growth (%)
2011 Operating
Spending per Capita ($)
Change in Municipal
Spending per Capita from 2010-2011
(%)
Overall Provincial
Rank (1=Worst)
Last Yr. Rank
Kitimat 6 -17 27 2,322 1 35 39 Ladysmith 47 25 18 1,020 2 135 133
Lake Country 96 26 55 1,142 -1 64 59 Lake Cowichan 9 11 -2 948 -1 150 149
Langford 255 53 132 703 -5 18 16 Langley City 34 5 27 858 -10 132 98 Township of
Langley 111 17 80 1,011 -7 44 31
Lillooet 52 -16 81 1,470 2 26 31 Lions Bay 185 -4 198 1,679 11 5 6
Logan Lake 18 -5 24 1,389 5 91 108 Lumby 91 8 77 983 -12 50 24 Lytton 105 -30 192 5,599 -13 1 1
Mackenzie -10 -34 36 1,798 -19 49 18 Maple Ridge 76 20 47 856 0 98 94
Masset 40 -7 50 3,578 9 8 14 McBride 49 -3 54 1,952 -6 27 21 Merritt 31 -3 35 1,169 6 92 109
Metchosin 129 5 118 638 10 29 42 Midway 7 3 4 1,503 -6 118 100 Mission 46 16 26 985 13 125 146
Montrose 23 -4 27 959 11 124 144 Nakusp 20 -10 34 1,774 11 53 84
Nanaimo 31 17 12 987 -1 143 137 Nelson 22 6 15 2,621 6 30 48
New Denver 79 -5 89 1,455 6 24 35 New Hazelton 25 -21 59 2,036 -13 23 13
New Westminster 36 18 15 1,489 3 97 110 North Cowichan 49 11 34 857 0 122 116 North Saanich 53 5 46 979 -7 88 70
North Vancouver City
62 12 45 1,229 -4 72 58
North Vancouver District
58 3 54 1,253 2 58 63
Oak Bay 28 0 29 1,300 -2 90 86 Oliver 56 5 48 1,195 4 69 79
Osoyoos 80 21 49 1,231 -7 65 46 Parksville 12 12 0 869 10 152 153 Peachland 58 10 43 1,284 3 70 76 Pemberton 95 47 32 1,546 -3 66 Penticton 48 4 42 1,922 -5 41 33
Pitt Meadows 116 21 80 959 0 47 43 Port Alberni 1 -1 1 1,193 4 144 147 Port Alice -2 -28 37 2,181 12 32 60
Port Clements 11 -10 23 1,395 -16 93 45 Port Coquitlam 47 9 34 962 4 114 118
Port Edward 27 -19 56 3,053 -6 9 7 Port Hardy 3 -19 27 1,512 1 75 82
Port McNeill 5 -10 17 798 6 147 148 Port Moody 77 40 27 1,096 5 115 121
Pouce Coupe 38 -3 43 1,481 -18 57 22 Powell River -14 3 -16 1,489 -3 146 140
Prince George 22 -1 23 1,229 0 110 105 Prince Rupert -35 -16 -23 1,576 4 148 150
Princeton 39 13 23 1,113 -7 121 93 Qualicum Beach 19 24 -4 956 0 151 152
Quesnel 7 -2 10 1,298 -5 126 111 Radium Hot
Springs 67 85 -10 1,862 3 113 123
Revelstoke 79 -5 89 2,088 13 12 26 Richmond 49 15 29 1,135 -1 107 102 Rossland -2 -3 1 1,361 -1 133 125 Saanich 35 6 27 864 2 131 129 Salmo 11 -7 20 886 -5 139 122
Salmon Arm 41 11 27 951 5 128 130 Sayward 31 -13 51 2,777 -32 14 4
CFIB BC Municipal Spending Watch 2013
www.cfib.ca
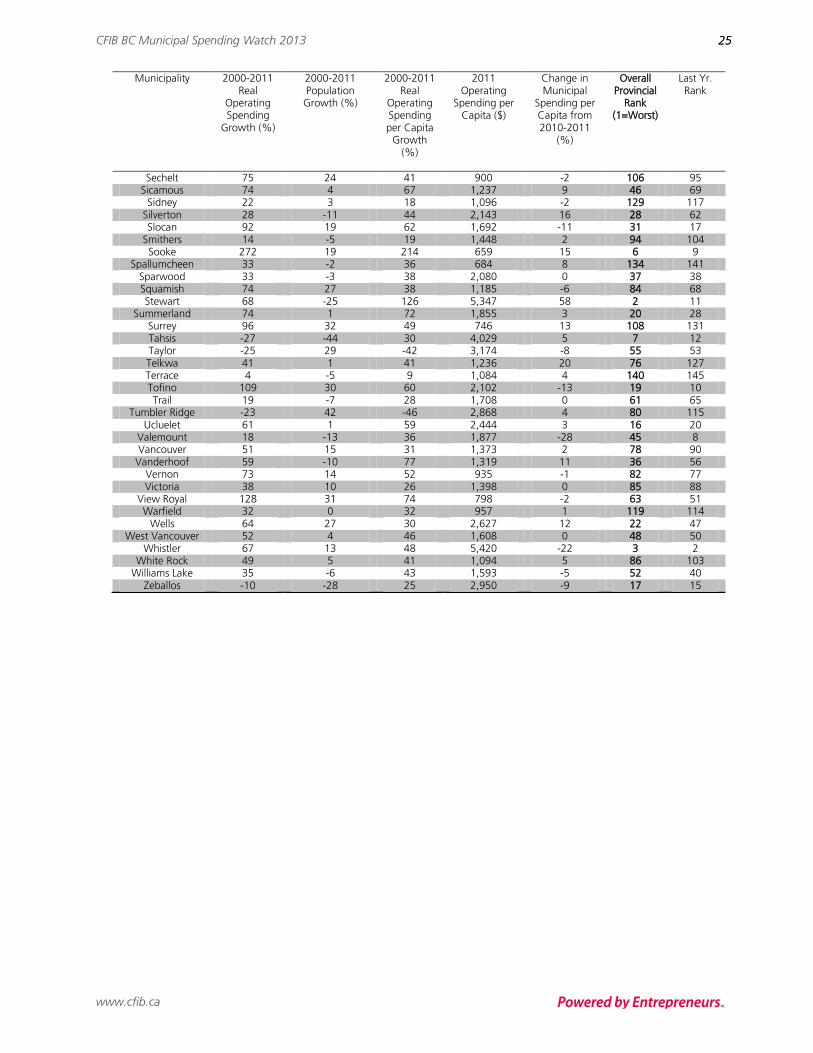
25 25
Municipality 2000-2011 Real
Operating Spending
Growth (%)
2000-2011 Population Growth (%)
2000-2011 Real
Operating Spending per Capita
Growth (%)
2011 Operating
Spending per Capita ($)
Change in Municipal
Spending per Capita from 2010-2011
(%)
Overall Provincial
Rank (1=Worst)
Last Yr. Rank
Sechelt 75 24 41 900 -2 106 95 Sicamous 74 4 67 1,237 9 46 69
Sidney 22 3 18 1,096 -2 129 117 Silverton 28 -11 44 2,143 16 28 62 Slocan 92 19 62 1,692 -11 31 17
Smithers 14 -5 19 1,448 2 94 104 Sooke 272 19 214 659 15 6 9
Spallumcheen 33 -2 36 684 8 134 141 Sparwood 33 -3 38 2,080 0 37 38 Squamish 74 27 38 1,185 -6 84 68 Stewart 68 -25 126 5,347 58 2 11
Summerland 74 1 72 1,855 3 20 28 Surrey 96 32 49 746 13 108 131 Tahsis -27 -44 30 4,029 5 7 12 Taylor -25 29 -42 3,174 -8 55 53 Telkwa 41 1 41 1,236 20 76 127 Terrace 4 -5 9 1,084 4 140 145 Tofino 109 30 60 2,102 -13 19 10 Trail 19 -7 28 1,708 0 61 65
Tumbler Ridge -23 42 -46 2,868 4 80 115 Ucluelet 61 1 59 2,444 3 16 20
Valemount 18 -13 36 1,877 -28 45 8 Vancouver 51 15 31 1,373 2 78 90
Vanderhoof 59 -10 77 1,319 11 36 56 Vernon 73 14 52 935 -1 82 77 Victoria 38 10 26 1,398 0 85 88
View Royal 128 31 74 798 -2 63 51 Warfield 32 0 32 957 1 119 114
Wells 64 27 30 2,627 12 22 47 West Vancouver 52 4 46 1,608 0 48 50
Whistler 67 13 48 5,420 -22 3 2 White Rock 49 5 41 1,094 5 86 103
Williams Lake 35 -6 43 1,593 -5 52 40 Zeballos -10 -28 25 2,950 -9 17 15