baton rouge post-katrina - syracuse...
TRANSCRIPT
Baton Rouge Post-Katrina:The Role of Critical Infrastructure Modeling
in Promoting Resilience
Laura J. Steinberg, Nicholas Santella, Corrine B. Zoli
ABSTRACT
The events of Hurricane Katrina have become a textbook example of system failures at multiple and intersecting levels. One unexplored dimension of this tragedy is the role of infrastructure performance data and modeling studies in aiding stakeholders in understanding this and future crises in order to promote resilience. This article presents results from a comparative validation study of the Department of Homeland Security (DHS) s p o n s o r e d C r i t i c a l I n f r a s t r u c t u r e Protection Decision Support System (CIPDSS) to offer an interdisciplinary and systems-level understanding of resilience. Our analysis of Baton Rouge critical infrastructures response to one of the largest population displacements recorded in U.S. history highlights the importance of integrating engineering systems and policy approaches with critical infrastructure protection, planning, and capacity b u i l d i n g . B y u s i n g i n f r a s t r u c t u r e performance data we were able to address which systems in Baton Rouge proved r e s i l i e n t a n d w h y a n d d e t e r m i n e recommendations for effective planning to increase critical infrastructure resilience.
INTRODUCTION: CIPDSS Validation Study as an Occasion for Monitoring Resilience
A common definition of resilience is “the capability of a system to maintain its
functions and structure in the face of internal and external change and to degrade gracefully when it must.”1 This deceptively simple definition, however, belies longstanding difficulties in defining, measuring, and fostering resilience in general, particularly in the p r a c t i c a l c o n t e x t o f c r i t i c a l infrastructure systems.2 In this article, the authors illustrate an approach to the chal lenges of achiev ing cr i t ica l infrastructure resilience using modeling informed by infrastructure performance data. Observations are reported from a val idat ion study of the Crit ical Infrastructure Protection Decision Support System model (CIPDSS), a simulation tool developed for the Science and Technology Directorate of the U.S. Department of Homeland Security (DHS). This validation study considered the effects of a seminal disaster for the homeland security community – Hurricane Katrina – on Baton Rouge, Louisiana.
The unprecedented increase in the population of Baton Rouge resulting from Katrina severely stressed critical infrastructures providing an ideal opportunity to exercise infrastructure modeling tools and observe factors that contribute to resilience. The results of the study are used to illustrate both the potential benefits and myriad challenges
HOMELAND SECURITY AFFAIRS, VOLUME 7, ARTICLE 7 (FEBRUARY 2011) WWW.HSAJ.ORG
of modeling critical infrastructure resilience. The article first discusses the potential role of critical infrastructure modeling in promoting resilience, as revealed by the response to Hurricane K a t r i n a . S e c o n d , w e d e t a i l t h e methodology used in the validation study and summarize the factors measured to determine the level of infrastructure resilience in Baton Rouge. Third, drawing on our own collected data, we illustrate the importance of these factors by descr ibing the performance of key infrastructure systems considered in the CIPDSS Validation Study. Last, we outline the results of our validation study and e x p l o r e r e s u l t i n g i n s i g h t s i n t o infrastructure resilience – namely, how critical infrastructure resilience can be promoted using simulation-based analyses.
As is now well known, Hurricane Katrina caused massive destruction, loss of life,3 and widespread systems-level failures in critical infrastructure, policy and political channels of communication and decis ion-making, homeland security, and disaster planning.4 The contribution of critical infrastructure failures to the disastrous conditions following Katrina has been the subject of significant study, particularly with regard to hospital,5 public health,6 and telecommunications systems.7 Because of these failures, Katrina has become a classic example of the dire consequences that accompany loss of infrastructure systems and, hence, the need for resilient infrastructure.8 In fact, the importance of resilience for critical infrastructure (much of it privately owned) has achieved greater recognition and analytical interest in large part because of recent major disruptions,
especially Katrina.9 To a certain degree these matters are
now federal policy.10 Government investigations of the response to Hurricane Katrina, such as The Federal Response to Hurricane Katrina: Lessons Learned, for instance, explicitly recognized the role that loss of critical infrastructure played in the disaster and, in turn, the ameliorative role that greater use of simulation-based analysis may play in improving disaster response.11 The document recognized “critical infrastructure and impact assessment” as one of seventeen critical challenges for improved federal r e s p o n s e , f o l l o w e d b y t h e recommendation to enhance capacities to “rapidly assess the impact of a disaster on critical infrastructure.” The report recommended that DHS revise the National Response Plan to provide a “stronger” role for the Infrastructure Support Branch in the National Operations Center, which would suggest remedial actions, based on the input of the National Infrastructure Simulation and Analysis Center (NISAC) and other entities. Also recommended was e n l a r g i n g N I S A C ’ s c a p a c i t y f o r modeling-based analysis of critical infrastructure, including greater sharing of modeling tools, analysis, and data among federal agencies. Elsewhere, the importance of infrastructure resilience has been demonstrated across federal agencies with President Obama most r e c e n t l y i s s u i n g a P r e s i d e n t i a l Proclamation declaring December 2010 “Critical Infrastructure Protection Month,” a time to focus on “delivering the necessary information, tools, and resources to areas where critical infrastructure exists in order to
MYERS, TERRORIST TO TYRANT 2
HOMELAND SECURITY AFFAIRS, VOLUME VII, NO. 1 (JANUARY 2011) WWW.HSAJ.ORG
maintain and enhance its security and resilience.” 12
G i v e n t h e c o m p l e x i t y a n d i n t e r d e p e n d e n c y o f c r i t i c a l infrastructure systems, NISAC and other ’s ef forts at modeling and simulation offer important contributions to increasing infrastructure resilience.13 While varied and important work has been undertaken, the limited availability of data on infrastructure performance during disaster conditions has been a significant challenge to modeling efforts and, thus, to analysis of resilience. This challenge has been described in recent efforts to develop data collection methodologies for natural hazards and other events.14 Moreover, while modeling and simulation are critically important in aiding decision makers’ investments in disaster preparedness, to be most useful these tools must comprise a multidisciplinary approach that integrates technological and social systems, thereby adding to their complexity.15 For example, as this study will show, the physical capacity of infrastructure may be increased during times of stress by strategic changes in the practices of the service personnel responsible for the infrastructure’s functionality. As a result, efforts to d e v e l o p p r a c t i c a l a n d u s e f u l infrastructure models for homeland security applications have attracted considerable research and government interest. 16
CIPDSS is one of the modeling and analysis tools developed for NISAC by Los Alamos, Sandia, and Argonne National Laboratories.17 The CIPDSS model differs from other modeling tools in that it represents a large number (fourteen) of critical infrastructures and key asset sectors (e.g. public health,
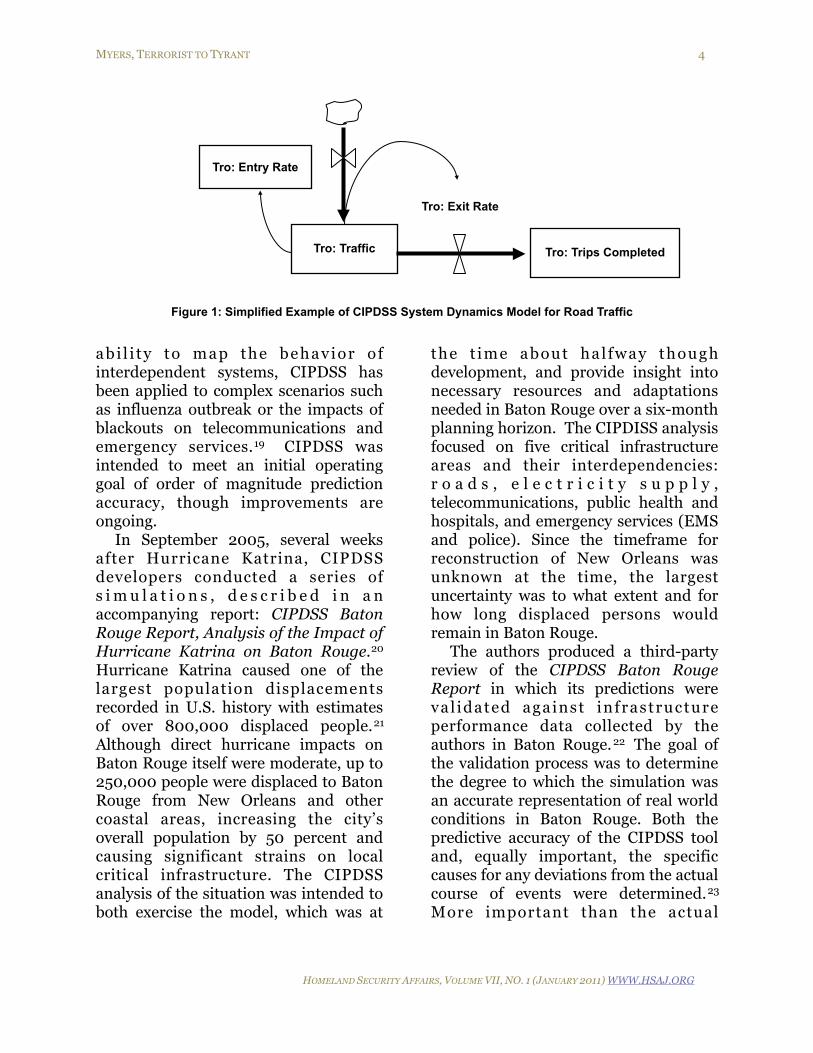
emergency services, telecom, energy, transportation).18 CIPDISS is also intended for analysis of high-level behavior of metropolitan or regional infrastructure, taking into account the way disruptions in one sector may propagate to other infrastructure systems. Modeling is performed using a system dynamics methodology where an infrastructure system is broken down into simple items and processes (feedback loops, stocks, and flows), which interact to produce complex behaviors. A simplified example of these components taken from the CIPDSS model of road traffic is illustrated in Figure 1 (below). In this sub-segment of the model, traffic volume (Tro: Traffic) is a stock controlled by flows determined by the entry and exit rate of vehicles to the roadway, which are themselves dependent on other variables not pictured. A feedback loop exists such that the entry rate decreases under heavy traffic conditions. The number of people successfully completing trips (Tro: Trips Completed) is calculated from the exit rate.
Within the CIPDSS model, each infrastructure sector is divided into subsectors (e.g., road transportation, metropolitan rail transportation) re p re s e nt e d by p ag e s o f v i s u a l programming code (i.e., “views”) describing infrastructure behavior at an aggregate level. For example, as illustrated above, all roads are treated as a single system that behaves in a fashion similar to an individual road. The total CIPDSS model consists of over 100 views, and these views are connected through variables describing major i n t e r d e p e n d e n c i e s ( e . g . r o a d transportation is less efficient without electricity for traffic control). Given its
MYERS, TERRORIST TO TYRANT 3
HOMELAND SECURITY AFFAIRS, VOLUME VII, NO. 1 (JANUARY 2011) WWW.HSAJ.ORG
abi l i ty to map the behavior o f interdependent systems, CIPDSS has been applied to complex scenarios such as influenza outbreak or the impacts of blackouts on telecommunications and emergency services.19 CIPDSS was intended to meet an initial operating goal of order of magnitude prediction accuracy, though improvements are ongoing.
In September 2005, several weeks after Hurricane Katrina, CIPDSS developers conducted a series of s i m u l a t i o n s , d e s c r i b e d i n a n accompanying report: CIPDSS Baton Rouge Report, Analysis of the Impact of Hurricane Katrina on Baton Rouge.20 Hurricane Katrina caused one of the largest population displacements recorded in U.S. history with estimates of over 800,000 displaced people.21 Although direct hurricane impacts on Baton Rouge itself were moderate, up to 250,000 people were displaced to Baton Rouge from New Orleans and other coastal areas, increasing the city’s overall population by 50 percent and causing significant strains on local critical infrastructure. The CIPDSS analysis of the situation was intended to both exercise the model, which was at
the t ime about hal fway though development, and provide insight into necessary resources and adaptations needed in Baton Rouge over a six-month planning horizon. The CIPDISS analysis focused on five critical infrastructure areas and their interdependencies: r o a d s , e l e c t r i c i t y s u p p l y , telecommunications, public health and hospitals, and emergency services (EMS and police). Since the timeframe for reconstruction of New Orleans was unknown at the time, the largest uncertainty was to what extent and for how long displaced persons would remain in Baton Rouge.
The authors produced a third-party review of the CIPDSS Baton Rouge Report in which its predictions were val idated against infrastructure performance data collected by the authors in Baton Rouge. 22 The goal of the validation process was to determine the degree to which the simulation was an accurate representation of real world conditions in Baton Rouge. Both the predictive accuracy of the CIPDSS tool and, equally important, the specific causes for any deviations from the actual course of events were determined.23 More important than the actual
MYERS, TERRORIST TO TYRANT 4
HOMELAND SECURITY AFFAIRS, VOLUME VII, NO. 1 (JANUARY 2011) WWW.HSAJ.ORG
Figure 1: Simplified Example of CIPDSS System Dynamics Model for Road Traffic
Tro: Entry Rate
Tro: Traffic
Tro: Exit Rate
Tro: Trips Completed
validation exercise, however, our research produced a body of rich data on critical infrastructure performance in Baton Rouge, which we turn to next, with implications for infrastructure resilience.
One brief word about resilience. The type of infrastructure resilience we treat here falls outside of the traditional context of physical resilience (e.g., the ability to withstand pressure waves generated by a detonation); instead we investigate resilience in its dimension of response to capacity overload or other stresses. More specifically, we look at the ability of infrastructure to adapt to external change created by sudden, unanticipated, and often dramatic events; in this particular case, an i n c r e a s e i n d e m a n d f o r t h e infrastructure function.24
In coming from this perspective, we are indebted to several dynamic areas of inquiry. This includes recent work that has emphasized resilience as a broad but practical policy and management goal useful for directing government priorities and investments, given the otherwise impossible task of defending against all the man-made or natural threats facing critical infrastructure.25 It also includes research focused on characterizing resilience by defining the core or necessary performance traits of a resilient community or system: i.e., its robustness, the degree in which it contains redundancies, the rapidity with which it can return to function, and its resourcefulness in responding to problems; increases in one or more of these characteristics of a system results, it is hypothesized, in an overall increase in resilience.26 But given our focus on critical infrastructure and modeling, we chose a necessarily multivariate notion
of resilience, one that is at once practical, policy-oriented, interested in the observable characteristics that indicate resilience in infrastructure systems, but also attentive to the complexities of interdependent systems. Our approach is equally informed by recent work, some of it focused on seismic resilience, that has highlighted the need to develop integrated measures of performance, both technological and social, to indicate the level of resilience present in a system, often through analysis or computer simulation, and so enable more effective enhancements of resilience.2 And our notion of resilience takes seriously a core insight from systems engineering – namely, the importance of redundancy in achieving resilience in crisis situations – yet, we have expanded redundancy to include the myriad ways in which elements or aspects o f a g iven system may compensate for setbacks by related mitigating factors and interventions.27 For instance, as we will show below, human capital factors – drastically increasing professional emergency service personnel and staff and their hours of work at all levels (i.e., police, fire services, ambulance) – helped mitigate and blunt any decline in emergency services in Baton Rouge in the months after Katrina.
METHODOLOGY: CIPDSS Baton Rouge Validation Study Data Collection
As part of the CIPDSS Validation Study, we collected descriptive and quantitative data in person and in phone interviews w i t h i n f r a s t r u c t u r e s y s t e m representatives and stakeholders
MYERS, TERRORIST TO TYRANT 5
HOMELAND SECURITY AFFAIRS, VOLUME VII, NO. 1 (JANUARY 2011) WWW.HSAJ.ORG
throughout the months of September and December 2007. The focus of the data collected was on the state of critical infrastructure systems in East Baton Rouge Parish (EBRP) during the six-month period post-Hurricane Katrina: Sept 2005–Feb 2006. The purpose of these interviews was twofold: to collect qualitative inputs on conditions in Baton Rouge from persons directly familiar with a given critical infrastructure sector; and to identify institutional and managerial resources for collecting quantitative data.
Participants for interviews were selected on the basis of their direct expertise and/or experience in oversight a n d m a n a g e m e n t o f c r i t i c a l infrastructure sectors considered in the CIPDSS analysis. Targeted persons included representatives from the following local, state, federal, private, a n d c o n t r a c t o r a g e n c i e s a n d organizations: LA Department of Transportation and Development (LADOTD); Baton Rouge Area Chamber (of commerce); Alliance Transportation Group, Inc (providing travel demand modeling services to Baton Rouge); Baton Rouge Police Department (BRPD); East Baton Rouge Parish Sheriff’s Office (EBRPSO), LA State Police Troop A, LA State University Police Department; Baton Rouge Emergency Medical Service (EMS); Baton Rouge Fire Department; LA Health Association; LA Hospital Association; LA Department of Health and Human Services (LDHHS); major area hospitals including Lane Regional Medical Center and Baton Rouge General Medical Center; Federal Emergency Management Agency (FEMA); Baton Rouge Emergency Operations Center; the LA Governors
Office of Emergency Management; local telecom carriers including AT&T, Verizon, and Bell South; and local electrical utility Entergy.
Interviews were semi-structured and open-ended, eliciting dialogue and f e e d b a c k i n t h e c o u r s e o f conversations.28 Individual interview time ran from approximately thirty minutes to two hours, depending on c ircumstances and respondents . Questions included some of the following: “How was your organization affected by Katrina?”; “What changes were made in the six month period after the hurricane?”; “What reports or data sets are you aware of describing conditions in Baton Rouge during that t ime?” Where possible, publicly available information was used to elicit more detai led information with questions such as: “News reports describe these specific conditions, can you comment on this and explain how your organization responded?” Notes were taken manually during the course of interviews and were transcribed and coded with annotations. When relevant quantitative data sets or reports could be identified, these were likewise retrieved in hard copy or electronic formats in follow-up communications.
Various levels of success were achieved in collecting data for each sector, largely in accord with the challenges others have identified in collecting infrastructure performance data.29 In general, public services, such as emergency services and LADOTD, were cooperative in that they were willing to share any data they had collected and often provided a wealth of data. Others, such as hospital systems, were cooperative but decentralized, so only limited data was available for
MYERS, TERRORIST TO TYRANT 6
HOMELAND SECURITY AFFAIRS, VOLUME VII, NO. 1 (JANUARY 2011) WWW.HSAJ.ORG
describing the regional hospital system as a whole . Telecommunicat ion companies were the least cooperative, in that they were unable to share any of the large quantity of operational data they collect. This resulted from strict policies discouraging data sharing based on the perceived economic risk of releasing data that might be valuable to competitors. The local electrical utility was very cooperative, perhaps because it o p e r a t e s i n a l e s s c o m p e t i t i v e environment than telecommunication providers. In addition much useful data may have been lost because it was collected only for immediate operational purposes and not archived by the organization that collected it. For example, a weekly census of patients at all Louisiana hospitals was collected by LDHHS in the months after Hurricane Katrina but these records were not retained after use.
Analysis Schema for CIPDSS Baton Rouge Validation Study
The authors approached the process of validating the CIPDSS simulation by focusing on ten model variables that summarized the simulation results in the 2005 CIPDSS Baton Rouge Report as well as a number of contributing v a r i a b l e s a n d c o n s t a n t s . T h e s e additional variables were chosen by their importance in determining the values of the output variables and the availability of data from Baton Rouge for their validation. Although the CIPDSS model consists of fourteen sectors and over 100 views, the CIPDSS Baton Rouge Report only exercised those parts of the model most salient to conditions in Baton Rouge: five sectors and a dozen
model views. Thus, many important CIPDSS model capabilities, such as modeling of disease transmission, agricultural systems, or food supplies, were not exercised by the Baton Rouge scenario and so could not be validated by our study.
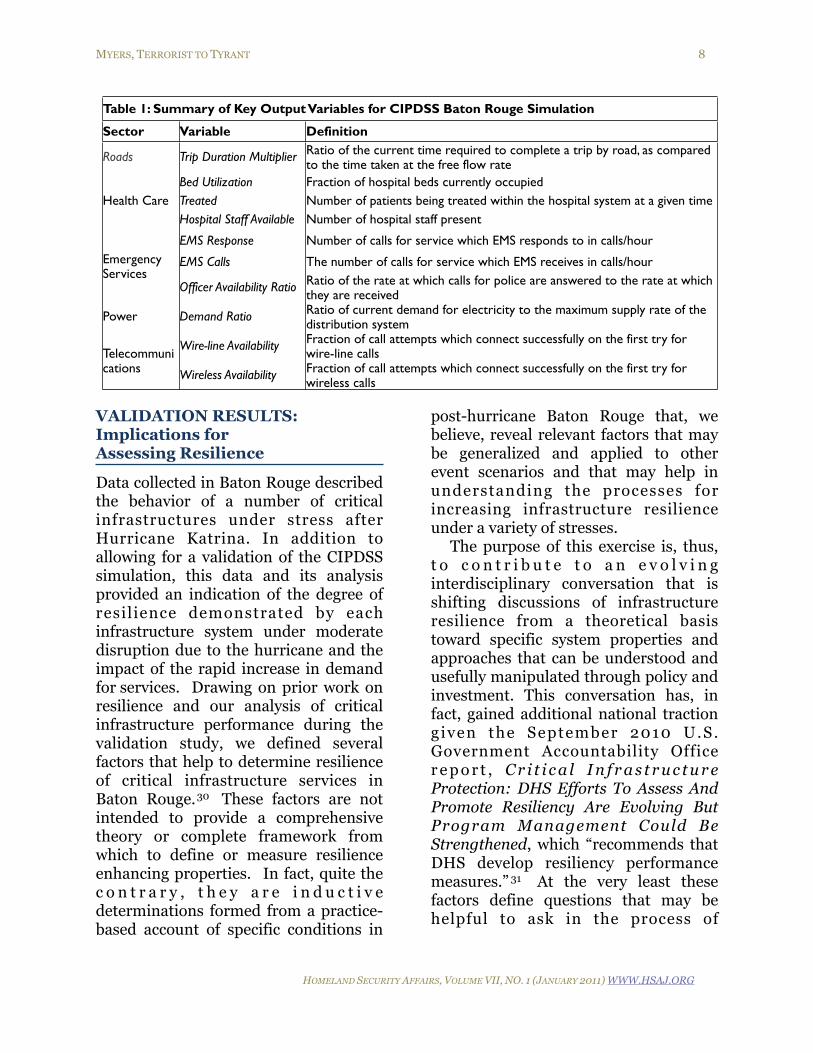
The ten output variables, hereafter, referred to as “key outputs,” are listed below (Table 1) and their significance within the model is described.
Prediction errors for the simulation were determined by direct comparison of the values for a salient feature identified in both key outputs and actual data from Baton Rouge: for example, monthly maximum electrical load or monthly total number of EMS calls serviced. In cases where real-world data could not be collected for direct comparison with key outputs, important model inputs and calculations were identified and compared to data from Baton Rouge: for example, total number of police officers or patients treated. With these comparisons as a starting point, additional model constants, calculations, and interdependencies were evaluated by comparison of constants to literature values, when available, or sensitivity analysis for constants for which authoritative values did not exist. Source code was evaluated by tracing calculations backward from key outputs to identify sources of error. Finally when calculations were well understood and sources of error were identif ied, recommendations for improvements were made.
MYERS, TERRORIST TO TYRANT 7
HOMELAND SECURITY AFFAIRS, VOLUME VII, NO. 1 (JANUARY 2011) WWW.HSAJ.ORG
VALIDATION RESULTS: Implications for Assessing Resilience
Data collected in Baton Rouge described the behavior of a number of critical infrastructures under stress after Hurricane Katrina. In addition to allowing for a validation of the CIPDSS simulation, this data and its analysis provided an indication of the degree of resilience demonstrated by each infrastructure system under moderate disruption due to the hurricane and the impact of the rapid increase in demand for services. Drawing on prior work on resilience and our analysis of critical infrastructure performance during the validation study, we defined several factors that help to determine resilience of critical infrastructure services in Baton Rouge.30 These factors are not intended to provide a comprehensive theory or complete framework from which to define or measure resilience enhancing properties. In fact, quite the c o n t r a r y , t h e y a r e i n d u c t i v e determinations formed from a practice-based account of specific conditions in
post-hurricane Baton Rouge that, we believe, reveal relevant factors that may be generalized and applied to other event scenarios and that may help in understanding the processes for increasing infrastructure resilience under a variety of stresses.
The purpose of this exercise is, thus, t o c o n t r i b u t e t o a n e v o l v i n g interdisciplinary conversation that is shifting discussions of infrastructure resilience from a theoretical basis toward specific system properties and approaches that can be understood and usefully manipulated through policy and investment. This conversation has, in fact, gained additional national traction given the September 2010 U.S. Government Accountability Office r e p o r t , C r i t i c a l I n f r a s t r u c t u r e Protection: DHS Efforts To Assess And Promote Resiliency Are Evolving But Program Management Could Be Strengthened, which “recommends that DHS develop resiliency performance measures.” 31 At the very least these factors define questions that may be helpful to ask in the process of
MYERS, TERRORIST TO TYRANT 8
HOMELAND SECURITY AFFAIRS, VOLUME VII, NO. 1 (JANUARY 2011) WWW.HSAJ.ORG
Table 1: Summary of Key Output Variables for CIPDSS Baton Rouge SimulationTable 1: Summary of Key Output Variables for CIPDSS Baton Rouge SimulationTable 1: Summary of Key Output Variables for CIPDSS Baton Rouge Simulation
Sector Variable Definition
Roads Trip Duration Multiplier Ratio of the current time required to complete a trip by road, as compared to the time taken at the free flow rate
Health CareBed Utilization Fraction of hospital beds currently occupied
Health Care Treated Number of patients being treated within the hospital system at a given timeHealth CareHospital Staff Available Number of hospital staff present
Emergency Services
EMS Response Number of calls for service which EMS responds to in calls/hourEmergency Services
EMS Calls The number of calls for service which EMS receives in calls/hourEmergency Services
Officer Availability Ratio Ratio of the rate at which calls for police are answered to the rate at which they are received
Power Demand Ratio Ratio of current demand for electricity to the maximum supply rate of the distribution system
Telecommunications
Wire-line Availability Fraction of call attempts which connect successfully on the first try for wire-line callsTelecommuni
cations Wireless Availability Fraction of call attempts which connect successfully on the first try for wireless calls
quantitatively assessing and modeling critical infrastructure response during crises.
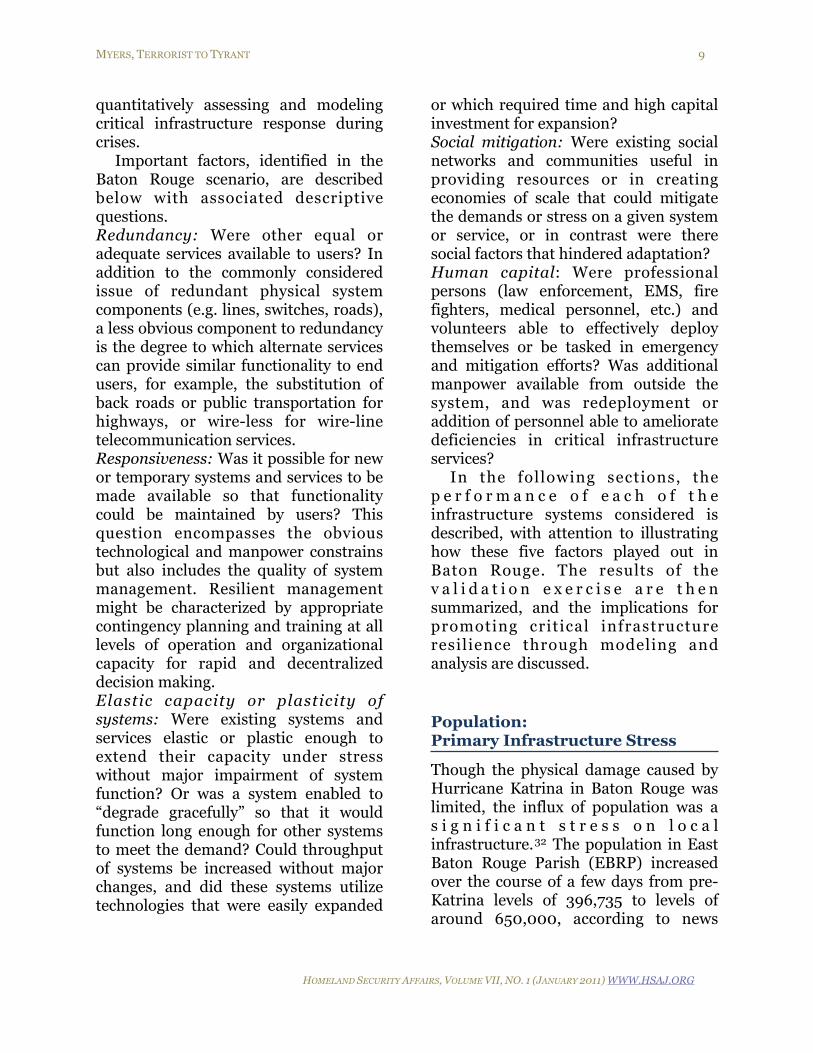
Important factors, identified in the Baton Rouge scenario, are described below with associated descriptive questions.Redundancy: Were other equal or adequate services available to users? In addition to the commonly considered issue of redundant physical system components (e.g. lines, switches, roads), a less obvious component to redundancy is the degree to which alternate services can provide similar functionality to end users, for example, the substitution of back roads or public transportation for highways, or wire-less for wire-line telecommunication services. Responsiveness: Was it possible for new or temporary systems and services to be made available so that functionality could be maintained by users? This question encompasses the obvious technological and manpower constrains but also includes the quality of system management. Resilient management might be characterized by appropriate contingency planning and training at all levels of operation and organizational capacity for rapid and decentralized decision making. Elastic capacity or plasticity of systems: Were existing systems and services elastic or plastic enough to extend their capacity under stress without major impairment of system function? Or was a system enabled to “degrade gracefully” so that it would function long enough for other systems to meet the demand? Could throughput of systems be increased without major changes, and did these systems utilize technologies that were easily expanded
or which required time and high capital investment for expansion? Social mitigation: Were existing social networks and communities useful in providing resources or in creating economies of scale that could mitigate the demands or stress on a given system or service, or in contrast were there social factors that hindered adaptation? Human capital: Were professional persons (law enforcement, EMS, fire fighters, medical personnel, etc.) and volunteers able to effectively deploy themselves or be tasked in emergency and mitigation efforts? Was additional manpower available from outside the system, and was redeployment or addition of personnel able to ameliorate deficiencies in critical infrastructure services?
In the following sections, the p e r f o r m a n c e o f e a c h o f t h e infrastructure systems considered is described, with attention to illustrating how these five factors played out in Baton Rouge. The results of the v a l i d a t i o n e x e r c i s e a r e t h e n summarized, and the implications for promoting critical infrastructure resilience through modeling and analysis are discussed.
Population: Primary Infrastructure Stress
Though the physical damage caused by Hurricane Katrina in Baton Rouge was limited, the influx of population was a s i g n i f i c a n t s t r e s s o n l o c a l infrastructure.32 The population in East Baton Rouge Parish (EBRP) increased over the course of a few days from pre-Katrina levels of 396,735 to levels of around 650,000, according to news
MYERS, TERRORIST TO TYRANT 9
HOMELAND SECURITY AFFAIRS, VOLUME VII, NO. 1 (JANUARY 2011) WWW.HSAJ.ORG
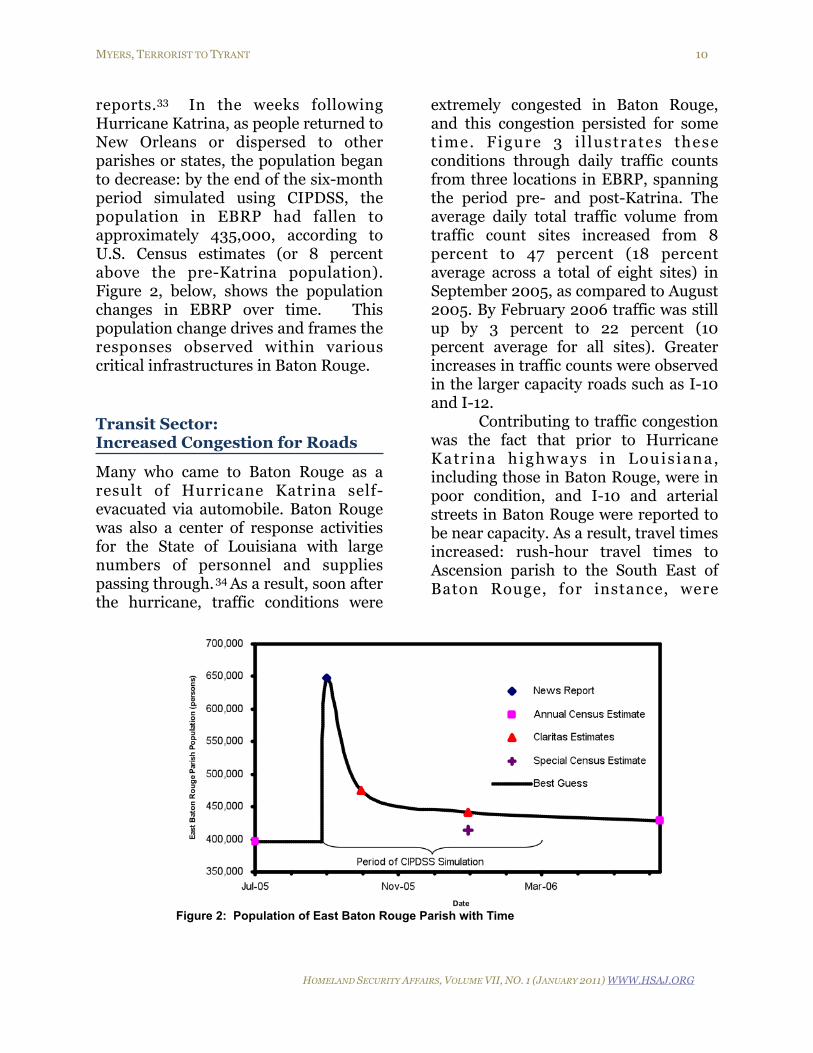
reports.33 In the weeks following Hurricane Katrina, as people returned to New Orleans or dispersed to other parishes or states, the population began to decrease: by the end of the six-month period simulated using CIPDSS, the population in EBRP had fallen to approximately 435,000, according to U.S. Census estimates (or 8 percent above the pre-Katrina population). Figure 2, below, shows the population changes in EBRP over time. This population change drives and frames the responses observed within various critical infrastructures in Baton Rouge.
Transit Sector: Increased Congestion for Roads
Many who came to Baton Rouge as a result of Hurricane Katrina self-evacuated via automobile. Baton Rouge was also a center of response activities for the State of Louisiana with large numbers of personnel and supplies passing through. 34 As a result, soon after the hurricane, traffic conditions were
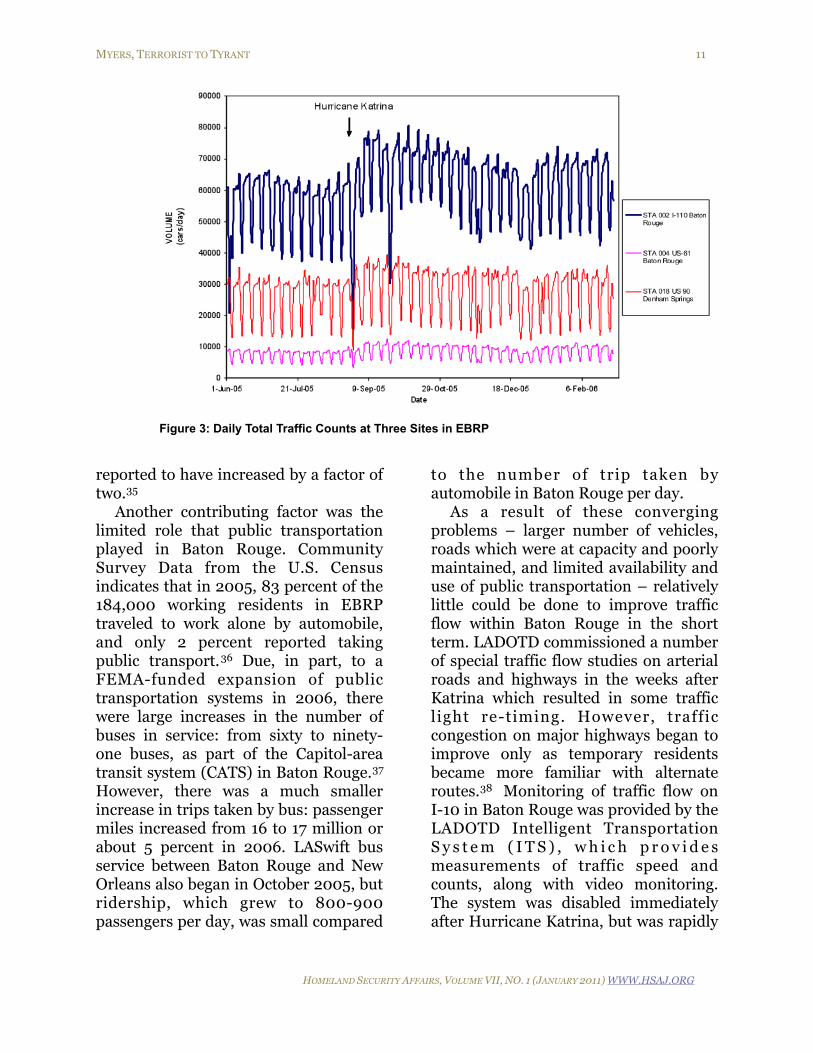
extremely congested in Baton Rouge, and this congestion persisted for some t ime. Figure 3 i l lustrates these conditions through daily traffic counts from three locations in EBRP, spanning the period pre- and post-Katrina. The average daily total traffic volume from traffic count sites increased from 8 percent to 47 percent (18 percent average across a total of eight sites) in September 2005, as compared to August 2005. By February 2006 traffic was still up by 3 percent to 22 percent (10 percent average for all sites). Greater increases in traffic counts were observed in the larger capacity roads such as I-10 and I-12.
Contributing to traffic congestion was the fact that prior to Hurricane Katr ina h ighways in Louis iana, including those in Baton Rouge, were in poor condition, and I-10 and arterial streets in Baton Rouge were reported to be near capacity. As a result, travel times increased: rush-hour travel times to Ascension parish to the South East of Baton Rouge, for instance, were
MYERS, TERRORIST TO TYRANT 10
HOMELAND SECURITY AFFAIRS, VOLUME VII, NO. 1 (JANUARY 2011) WWW.HSAJ.ORG
Figure 2: Population of East Baton Rouge Parish with Time
reported to have increased by a factor of two.35
Another contributing factor was the limited role that public transportation played in Baton Rouge. Community Survey Data from the U.S. Census indicates that in 2005, 83 percent of the 184,000 working residents in EBRP traveled to work alone by automobile, and only 2 percent reported taking public transport.36 Due, in part, to a FEMA-funded expansion of public transportation systems in 2006, there were large increases in the number of buses in service: from sixty to ninety-one buses, as part of the Capitol-area transit system (CATS) in Baton Rouge.37 However, there was a much smaller increase in trips taken by bus: passenger miles increased from 16 to 17 million or about 5 percent in 2006. LASwift bus service between Baton Rouge and New Orleans also began in October 2005, but ridership, which grew to 800-900 passengers per day, was small compared
to the number of trip taken by automobile in Baton Rouge per day. As a result of these converging problems – larger number of vehicles, roads which were at capacity and poorly maintained, and limited availability and use of public transportation – relatively little could be done to improve traffic flow within Baton Rouge in the short term. LADOTD commissioned a number of special traffic flow studies on arterial roads and highways in the weeks after Katrina which resulted in some traffic light re-timing. However, traffic congestion on major highways began to improve only as temporary residents became more familiar with alternate routes.38 Monitoring of traffic flow on I-10 in Baton Rouge was provided by the LADOTD Intelligent Transportation S y s t e m ( I T S ) , w h i c h p r o v i d e s measurements of traffic speed and counts, along with video monitoring. The system was disabled immediately after Hurricane Katrina, but was rapidly
MYERS, TERRORIST TO TYRANT 11
HOMELAND SECURITY AFFAIRS, VOLUME VII, NO. 1 (JANUARY 2011) WWW.HSAJ.ORG
Figure 3: Daily Total Traffic Counts at Three Sites in EBRP
brought back online to aid in traffic management and was fully operational by the second week of September 2005.
Using ITS data, the increase in travel t imes that resulted from traffic congestion was quantified for the five-mile stretch of I-10 passing through downtown Baton Rouge. LADOTD special studies were also used to quantify the post-Katrina travel times on other select roads in Baton Rouge.39 Traffic speeds at fifteen-minute intervals were available for fifty-four individual ITS links on I-10, and speed for all links were averaged, thereby, providing a single value for each fifteen-minute interval. The relative trip duration was calculated by taking the ratio of observed ITS speed to a free flow rate, assumed equivalent to the 65 mph speed limit. For LADOTD special studies, travel times were recorded by test cars driving a number of routes during AM and PM peak travel times. In these cases traffic speeds were calculated from travel times and route distance, and the ratio of actual speed to the posted speed limit was taken as the Trip Duration Multiplier.
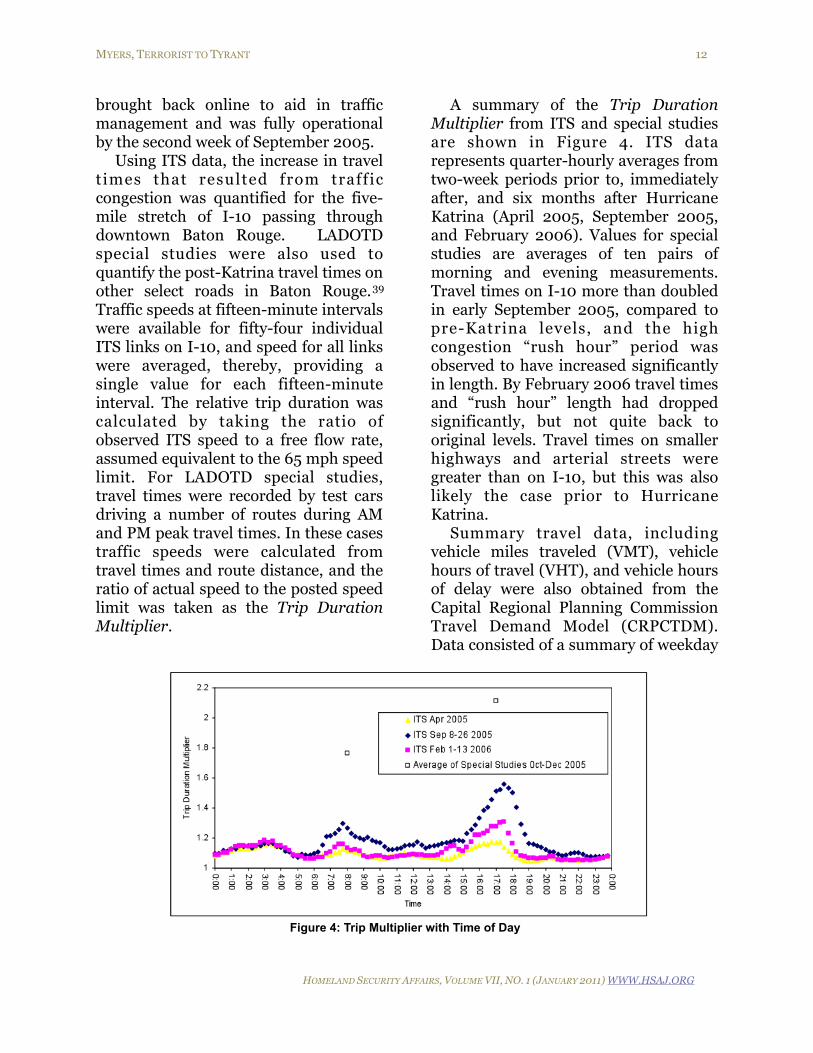
A summary of the Trip Duration Multiplier from ITS and special studies are shown in Figure 4. ITS data represents quarter-hourly averages from two-week periods prior to, immediately after, and six months after Hurricane Katrina (April 2005, September 2005, and February 2006). Values for special studies are averages of ten pairs of morning and evening measurements. Travel times on I-10 more than doubled in early September 2005, compared to pre-Katrina levels, and the high congestion “rush hour” period was observed to have increased significantly in length. By February 2006 travel times and “rush hour” length had dropped significantly, but not quite back to original levels. Travel times on smaller highways and arterial streets were greater than on I-10, but this was also likely the case prior to Hurricane Katrina.
Summary travel data, including vehicle miles traveled (VMT), vehicle hours of travel (VHT), and vehicle hours of delay were also obtained from the Capital Regional Planning Commission Travel Demand Model (CRPCTDM). Data consisted of a summary of weekday
MYERS, TERRORIST TO TYRANT 12
HOMELAND SECURITY AFFAIRS, VOLUME VII, NO. 1 (JANUARY 2011) WWW.HSAJ.ORG
Figure 4: Trip Multiplier with Time of Day
daily travel from the model under population conditions for the years 2004 and a projected 2009 population 13 percent larger than the 2004 population. This population level was reached for a brief period in December 2005, so 2009 travel parameters from the CRPCTDM may approximate the situation in EBRP at that time. Approximately 3.3 trips per person per day are assumed in both years. The model shows a 27 percent increase in hours of delay (VHD) in 2009, compared to 2004.
Overall, increased traffic volume observed in Baton Rouge rose directly in parallel to the increased population, and, as no effective means was available to deal with increased demand, the quality of service provided by the road infrastructure decreased as population increased. This finding demonstrates both a relative lack of redundancy within the system – no alternative routes or transport mechanisms were easily available – and an inability for services to respond rapidly to such
changing circumstances, mainly because of physical limitations of existing systems.
It also raises another issue. Road systems are particularly inelastic: expanding their capacity requires not only capital investment, planning, but also building and construction projects of a scale and time frame incompatible with a disaster setting. But there is a subtler social component to the problem as well. Even when bus systems were expanded through outside funding, and despite continuing traffic congestion, bus ridership only increased slightly. This suggests that lack of social acceptance of public transportation alternatives may have also been a limiting factor. It is interesting to speculate if the situation might have been more effectively mitigated by interventions into social factors which encouraged (through advertising campaigns or community efforts) greater use of car-pooling or other forms of collective transportation to bypass the p h y s i c a l l i m i t a t i o n s o f t h e
MYERS, TERRORIST TO TYRANT 13
HOMELAND SECURITY AFFAIRS, VOLUME VII, NO. 1 (JANUARY 2011) WWW.HSAJ.ORG
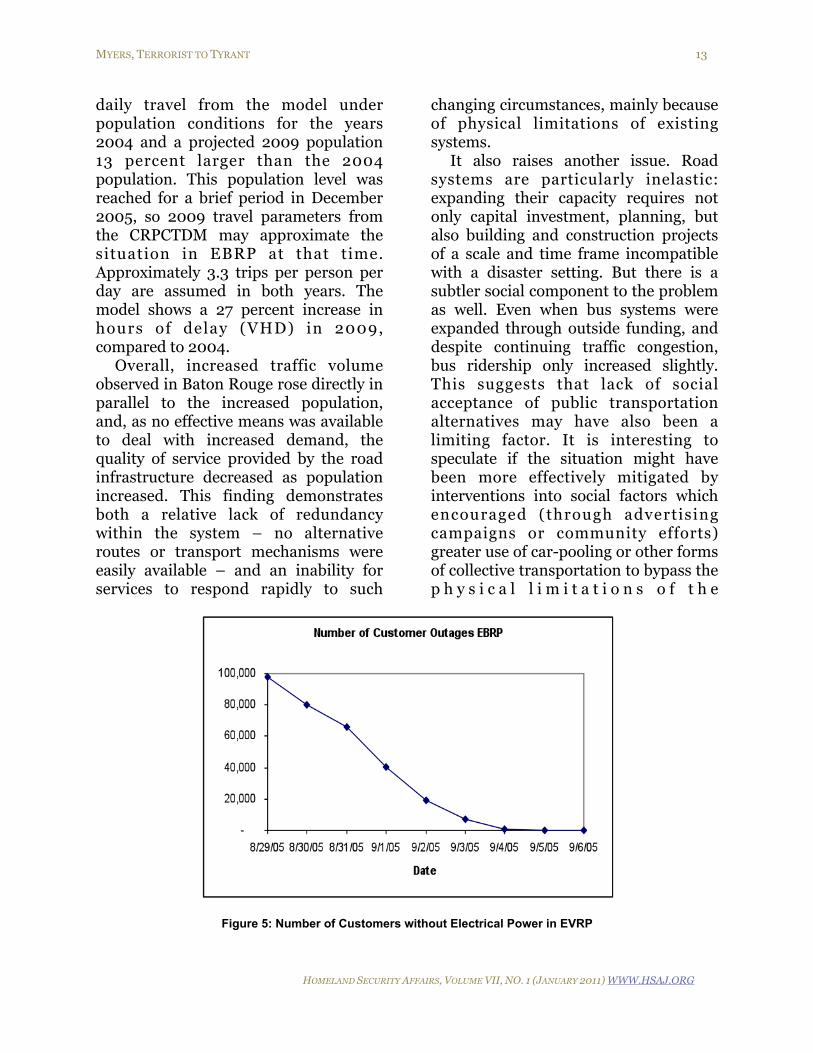
Figure 5: Number of Customers without Electrical Power in EVRP
transportation system. It is this mode of questioning and style of reasoning in approaching resilience infrastructure that what we hope to convey in this article.
Power Sector: Adequate Electricity Capacity
One local utility, Entergy, provides 90 percent of the service in EBRP. Approximately 40-60 percent of electrical demand is residential use, 20-30 percent is commercial demand, and 10-40 percent is industrial demand. The electrical power grid in Baton Rouge received only moderate damage during Hurricane Katrina. Although over 40 percent of customers were without service immediately after the storm, service was almost entirely restored within one week, as illustrated in Figure 5.
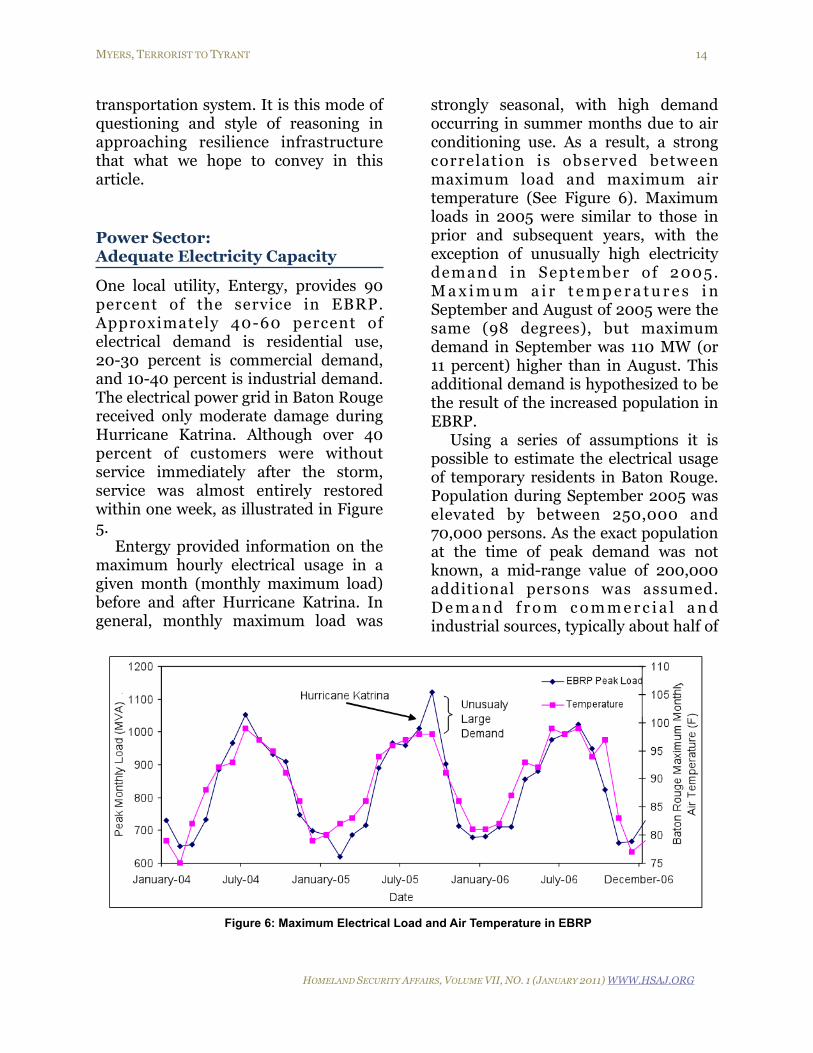
Entergy provided information on the maximum hourly electrical usage in a given month (monthly maximum load) before and after Hurricane Katrina. In general, monthly maximum load was
strongly seasonal, with high demand occurring in summer months due to air conditioning use. As a result, a strong correlation is observed between maximum load and maximum air temperature (See Figure 6). Maximum loads in 2005 were similar to those in prior and subsequent years, with the exception of unusually high electricity demand in September of 2005. M a x i m u m a i r t e m p e r a t u r e s i n September and August of 2005 were the same (98 degrees), but maximum demand in September was 110 MW (or 11 percent) higher than in August. This additional demand is hypothesized to be the result of the increased population in EBRP.
Using a series of assumptions it is possible to estimate the electrical usage of temporary residents in Baton Rouge. Population during September 2005 was elevated by between 250,000 and 70,000 persons. As the exact population at the time of peak demand was not known, a mid-range value of 200,000 additional persons was assumed. D e m a n d f r o m c o m m e r c i a l a n d industrial sources, typically about half of
MYERS, TERRORIST TO TYRANT 14
HOMELAND SECURITY AFFAIRS, VOLUME VII, NO. 1 (JANUARY 2011) WWW.HSAJ.ORG
Figure 6: Maximum Electrical Load and Air Temperature in EBRP
the total, was assumed to have remained c o n s t a n t b e t w e e n A u g u s t a n d September. Under these assumptions temporary residents in September used approximately 50 percent of the energy per capita of a permanent resident. This finding is explained by the fact that temporary residents largely stayed with friends, relatives, or volunteers in private homes or publicly or privately organized shelters, thus leading to greater efficiency in electricity usage.
Our general findings with respect to post-Katrina energy usage, then, were twofold: first, the reconnection of established customers was accomplished rapidly; and second, the electrical system had adequate capacity to meet the relatively small increase in demand, caused be the increased population. In short, the electrical supply system proved to be fairly resilient under these specific stresses. The social dimension to this systemic resilience should not be neglected. The scale of the evacuation after Katrina forced a blurring between what would typically be considered emergency or temporary shelter and longer-term temporary housing.40 As a result, hurricane evacuees in Baton Rouge made do for an extended period in established residences and various public and private shelters. This social response to limited housing stock helped to mitigate what could have been be an additional stress on the electricity system and services.
Telecommunications Sector: Rapid Recovery of Telephone Service
Although less severe than in areas closer to the coast, power loss and wind
damage initially disrupted both wire and w i r e l e s s s e r v i c e s w i t h i n E B R P . Quantitative data for describing the state of telecommunication in Baton Rouge after Hurricane Katrina, however, could not be obtained; such information (e.g. call volumes, fraction of calls lost) w a s p e rc e i ve d t o b e p r i v i l e g e d commercial information and, thus, a matter of competitive advantage amongst carriers.
One wireless carrier, however, did report that intense overloads occurred only in the first few days after Hurricane Katrina and the network was fully meeting demands within one month post-event. Moreover, the same provider cited a need for additional cell sites in Baton Rouge over the course of the following year in order to improve coverage and quality of service in response to the changing spatial distributions of population. Similar increases and growth in coverage was also required in EBRP by Bell South, a major regional wire line provider, to meet increased demand post-Katrina.41
Wireless carriers may have been able to recover more quickly than wire carriers through their use of portable cellular base stations, several of which were deployed in EBRP. Qualitative information from a number of sources suggested that displaced people relied heavily on cellular services, and increases in cellular usage have been reported in Katrina-impacted areas, including Baton Rouge. In addition, some wireless carriers provided special outreach services to displaced people and to some households (for example, free phones and service).42
Overall the telecommunication sector in Baton Rouge proved relatively resilient, largely, because of its ability to
MYERS, TERRORIST TO TYRANT 15
HOMELAND SECURITY AFFAIRS, VOLUME VII, NO. 1 (JANUARY 2011) WWW.HSAJ.ORG
rapidly repair and/or deploy auxiliary equipment. Comparing the response of transportation with telecom systems illustrates the importance of flexibility in infrastructure systems, as well as how that flexibility may correlate with the actual technologies used in each system. The ability to quickly extend or expand capacities had a significant impact on system resilience.
Emergency Services: Adjustments by Law Enforcement, Ems, Fire Service to Meet Increased Demand
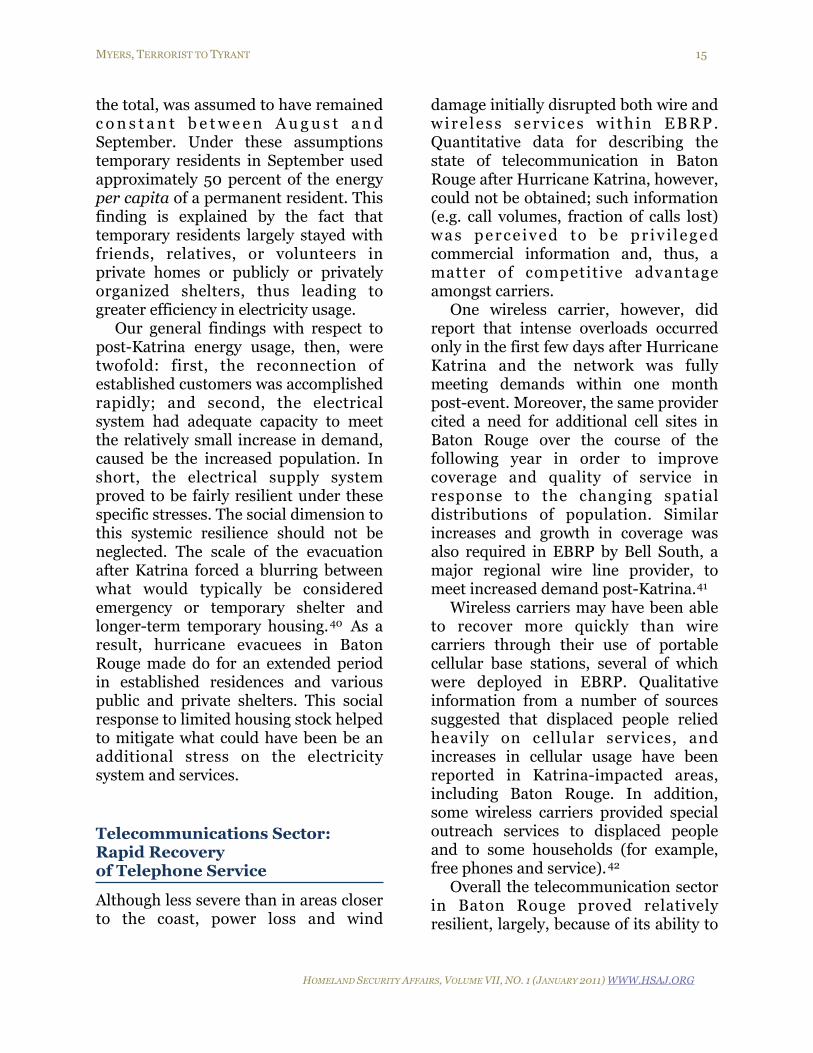
Immediately after Hurricane Katrina, demand for emergency services increased dramatically, due to both the increase in population and disruptions associated with the hurricane. The Baton Rouge Police Department (BRPD) handles calls to police within the city of B a t o n R o u g e : t h e s e n u m b e r e d
15,000-25,000 per month in the period post-Hurricane Katrina. The East Baton Rouge Parish Sheriff’s Office (EBRPSO) handled calls for police within the EBRP but outside the city limits; these numbered 2,000-3,000 per month in the post-Hurricane Katrina period. State police respond primarily to incidents on state highways, which numbered approximately 300-400 per month in the same period.
Detailed information about each call serviced during our study’s period was obtained from the BRPD Computer Assisted Dispatch (CAD) system, while the EBRPSO and state police provides only monthly total call volumes. Not considered in this analysis were the thousands of calls for assistance originating in New Orleans, which were then routed to state police in Baton Rouge, as well as to other law-enforcement jurisdictions, in the
MYERS, TERRORIST TO TYRANT 16
HOMELAND SECURITY AFFAIRS, VOLUME VII, NO. 1 (JANUARY 2011) WWW.HSAJ.ORG
Figure 7: Daily Baton Rouge Police Call Rates
immediate aftermath of Hurricane Katrina.43
The daily volume of BRPD calls before, during, and after Hurricane Katrina are illustrated in Figure 7 and divided into four classes of law enforcement issues: criminal, alarms, traffic related, and other. In general, the highest traffic-call volumes occurred on Fridays, whereas the lowest call volumes occurred on Sundays with a similar, if less dramatic, pattern also visible for criminal calls. Hurricane Katrina is identified in the time series by a sudden spike in alarm calls that resulted from alarm systems being disrupted by the storm. This spike was followed by an increase over the next two days of both criminal and traffic related police calls. Figure 7 also shows a similar, but smaller, effect on alarm and criminal call volumes (but not traffic calls) observed in the aftermath of Hurricane Rita on September 25, 2005.
Monthly totals of calls serviced by the sheriff’s office increased in a similar fashion to EBRPD calls. Calls to state
p o l i c e i n S e p t e m b e r 2 0 0 5 a l s o increased, but the number of calls, particularly for incidents on I-10 and U.S. 61 (a major road running north-south through Baton Rouge), continued to increase in October and November 2005 not dropping back to near baseline levels until February of 2006.
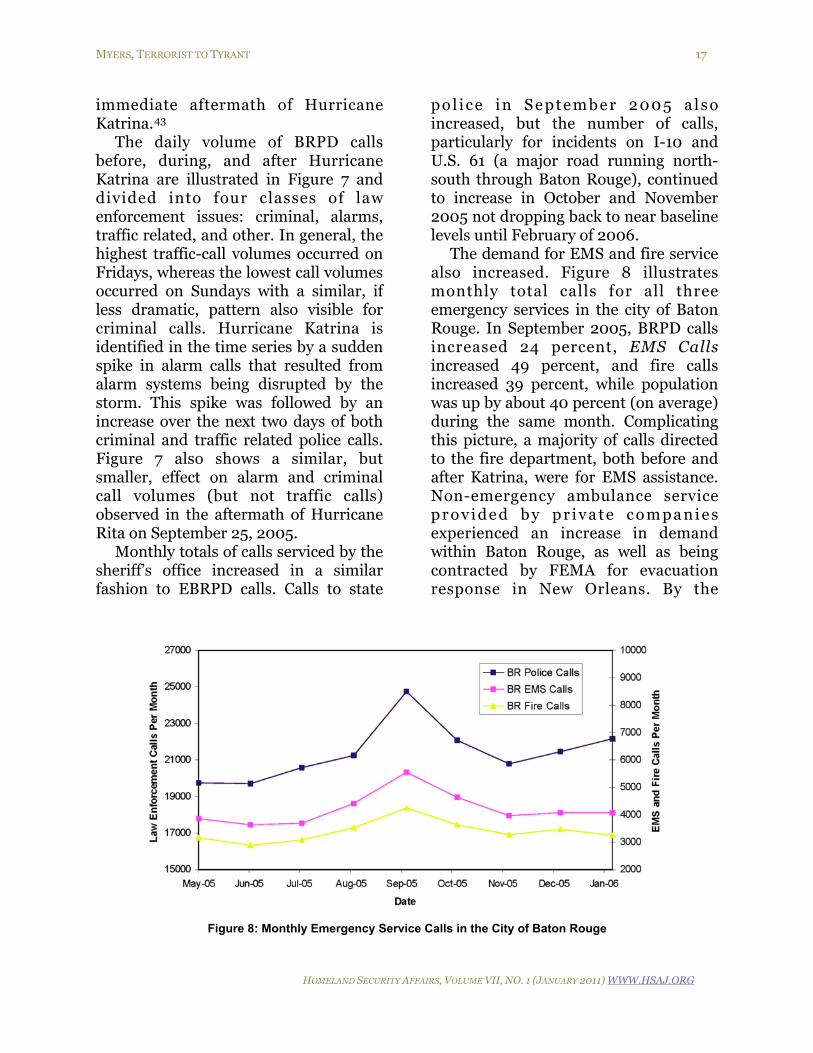
The demand for EMS and fire service also increased. Figure 8 illustrates monthly total calls for all three emergency services in the city of Baton Rouge. In September 2005, BRPD calls increased 24 percent, EMS Calls increased 49 percent, and fire calls increased 39 percent, while population was up by about 40 percent (on average) during the same month. Complicating this picture, a majority of calls directed to the fire department, both before and after Katrina, were for EMS assistance. Non-emergency ambulance service p r o v i d e d b y p r i v a t e c o m p a n i e s experienced an increase in demand within Baton Rouge, as well as being contracted by FEMA for evacuation response in New Orleans. By the
MYERS, TERRORIST TO TYRANT 17
HOMELAND SECURITY AFFAIRS, VOLUME VII, NO. 1 (JANUARY 2011) WWW.HSAJ.ORG
Figure 8: Monthly Emergency Service Calls in the City of Baton Rouge
beginning of 2006, demand for all emergency services had dropped to about 6 percent above pre-Katrina levels, in proportion to the remaindering evacuee population.
Meeting this increase in demand for emergency services required a massive redeployment of personnel. During the first week after Hurricane Katrina, all 600 BRPD officers operated under an emergency schedule with staff officers reassigned to patrol duty, twelve-hour shi f ts , seven days a week, and cancellation of scheduled leave. These twelve-hour shifts continued for approximately two months. Similarly, sheriff’s officers were redeployed so that there were approximately 200 officers assigned to patrol duty in the weeks following Katrina, as compared to 130 officers pre-Katrina. No information could be obtained on state police staff levels.
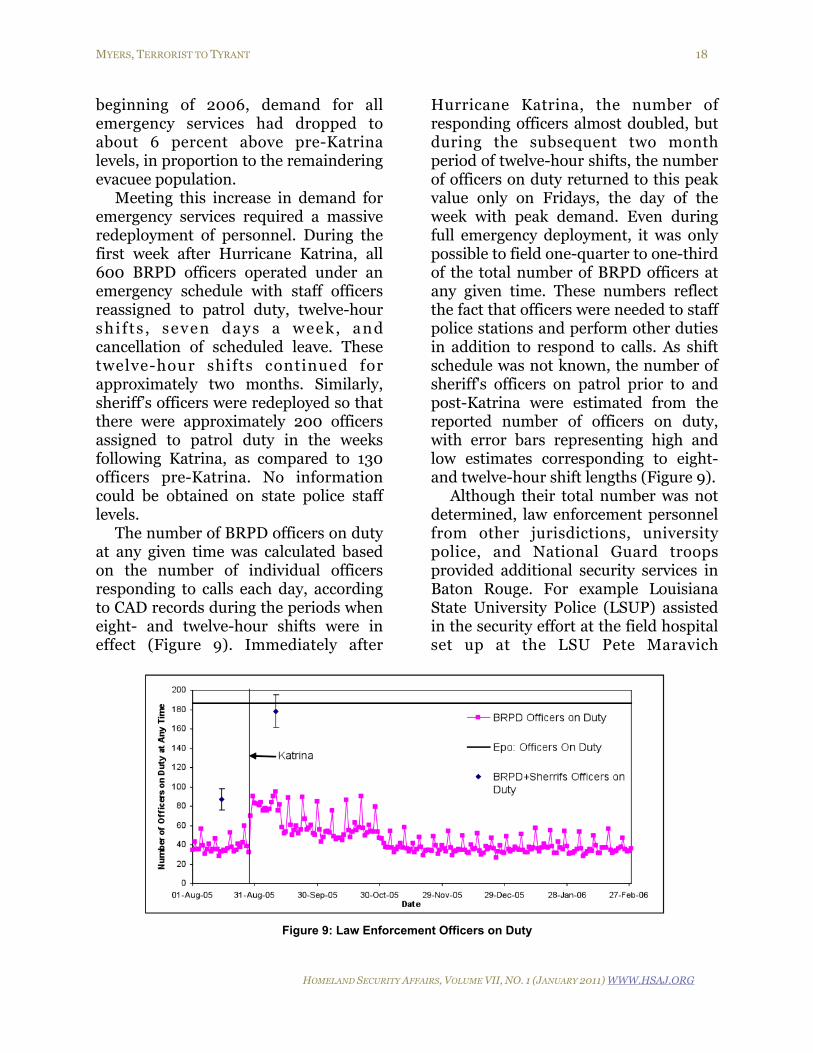
The number of BRPD officers on duty at any given time was calculated based on the number of individual officers responding to calls each day, according to CAD records during the periods when eight- and twelve-hour shifts were in effect (Figure 9). Immediately after
Hurricane Katrina, the number of responding officers almost doubled, but during the subsequent two month period of twelve-hour shifts, the number of officers on duty returned to this peak value only on Fridays, the day of the week with peak demand. Even during full emergency deployment, it was only possible to field one-quarter to one-third of the total number of BRPD officers at any given time. These numbers reflect the fact that officers were needed to staff police stations and perform other duties in addition to respond to calls. As shift schedule was not known, the number of sheriff's officers on patrol prior to and post-Katrina were estimated from the reported number of officers on duty, with error bars representing high and low estimates corresponding to eight- and twelve-hour shift lengths (Figure 9).
Although their total number was not determined, law enforcement personnel from other jurisdictions, university police, and National Guard troops provided additional security services in Baton Rouge. For example Louisiana State University Police (LSUP) assisted in the security effort at the field hospital set up at the LSU Pete Maravich
MYERS, TERRORIST TO TYRANT 18
HOMELAND SECURITY AFFAIRS, VOLUME VII, NO. 1 (JANUARY 2011) WWW.HSAJ.ORG
Figure 9: Law Enforcement Officers on Duty
Assembly Center (PMAC), as well as responded to calls on campus. Over 200 National Guard also accompanied police on routine patrols and assisted with aid distribution in the hurricane’s first weeks.44
The EMS and fire department in Baton Rouge also needed to adjust staffing to meet the increased demand for services. At the time of Hurricane Katrina, EMS personnel totaled about 117. Hurricane Katrina saw the initiation of twelve-hour shifts (with no time off), and qualified office staff was redeployed to answer calls. Ambulances were also in limited supply, with the entire available fleet, approximately thirty vehicles, brought immediately into service. Fire department staff were also redeployed: BRFD had a total staff of 575 fire fighters prior to Hurricane Katrina and a minimum of 107 fire fighters were on shift at any time; immediately after the event, that number increased to a range from 175 to 180 on shift.
Shortages of staff and conditions such as loss of power, telephone service, and road congestion may have decreased the
ability of emergency services to receive and process requests for aid. Although such effects may be difficult to measure individually, performance data can indicate if emergency services had become less effective.
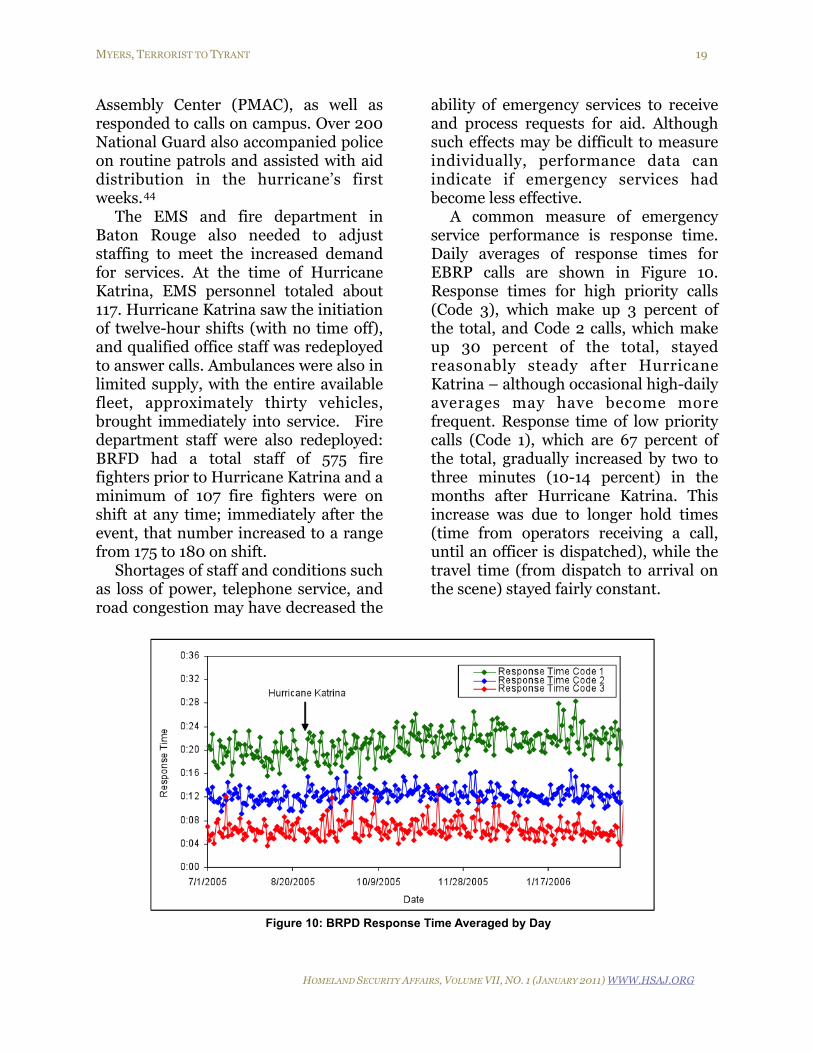
A common measure of emergency service performance is response time. Daily averages of response times for EBRP calls are shown in Figure 10. Response times for high priority calls (Code 3), which make up 3 percent of the total, and Code 2 calls, which make up 30 percent of the total, stayed reasonably steady after Hurricane Katrina – although occasional high-daily averages may have become more frequent. Response time of low priority calls (Code 1), which are 67 percent of the total, gradually increased by two to three minutes (10-14 percent) in the months after Hurricane Katrina. This increase was due to longer hold times (time from operators receiving a call, until an officer is dispatched), while the travel time (from dispatch to arrival on the scene) stayed fairly constant.
MYERS, TERRORIST TO TYRANT 19
HOMELAND SECURITY AFFAIRS, VOLUME VII, NO. 1 (JANUARY 2011) WWW.HSAJ.ORG
Figure 10: BRPD Response Time Averaged by Day
This finding suggests that, although a backlog of low-priority calls developed during periods of high demand, the ability of EBRPD to respond to calls was not noticeably compromised by the conditions in Baton Rouge. Similarly, in September of 2005, total EMS call time actually went down to a low of thirty-four minutes (as compared to a usual range prior to Hurricane Katrina of t h i r t y - s i x t o f o r t y m i n u t e s ) – presumably as a result of a larger number of staff and ambulances in service. Overall, emergency services personnel were able to redistribute personnel and resources, prioritize response to more serious incidents, and compensate for conditions that might have impacted their effectiveness (such as traffic congestion) so that the quality of service remained fairly constant after Katrina – even as the burden of response increased markedly.
In this respect, emergency service systems at all levels – police, fire services, and ambulance – showed a remarkable ability to cope with and adapt to the changing situation in EBRP. There is little doubt that, in these systems, human capital was a main source for resilience; this included the ability of leadership to make timely decisions in increasing personnel and redeploying office personnel to field duty and the personal flexibility d e m o n s t r a t e d b y s e c u r i t y a n d emergency response professionals.
Public Health Sector: Supplements to Overwhelmed Hospital System
The hospital system in Baton Rouge was particularly strained after Hurricane Katrina. In addition to an increase in
population and the resulting increase in those in need of medical services, many evacuees from New Orleans had greater-than-average medical needs.
To meet this demand there were approximately 1,770 hospital beds in five acute care hospitals within EBRP. Several smaller hospitals in the parish brought this count of staffed hospital beds up to approximately 2,000. Before Hurricane Katrina, hospital occupancy in Baton Rouge was close to the Louisiana average of 60 percent, providing approximately 800 free beds.45 An additional 800 beds for evacuees were provided for a two-week period at the LSU PMAC. In the first two months after Katrina, reports to the parish Emergency Operations Center (EOC) indicate that occupancy at EBRP hospitals was up to 96 percent.46 By February 2006 the occupancy of acute care hospitals was down to 63 percent, according to the Louisiana Hospital Association, only slightly above the pre-Katrina rates.
During the first week after Katrina, 5,700 patients were treated at the PMAC field hospital, and 2,500 evacuees were treated by one acute care hospital with about 430 beds. Estimates of the total number of displaced people treated in EBRP hospitals were not available, but the value of 2,500 treated in one hospital, when scaled proportionately to the total number of hospital beds in EBRP, gives a value of approximately 12,500 persons – who may have been treated at hospitals during the first week after Katrina. This number gives a total of approximately 18,000 displaced people treated within the parish in that period.
Although a large number, this 18,000 represents less than 10 percent of the
MYERS, TERRORIST TO TYRANT 20
HOMELAND SECURITY AFFAIRS, VOLUME VII, NO. 1 (JANUARY 2011) WWW.HSAJ.ORG
total population of evacuees. For comparison, approximately 30 percent of a population of 3,700 evacuated ( s o m e f r o m t h e N e w O r l e a n s superdome) after Katrina to Fort Worth, TX required medical care within the first week, though only 1 percent required inpatient care; similarly a sampling of those evacuated to Louisiana shelters indicates that over 34 percent required immediate medical care.47
Once the acute medical needs of evacuees had been addressed and the population began to disperse, demand for medical services decreased in proportion to population. For instance one hospital reported a 9 percent increase in emergency room visits as of February 2006, when the population was also about 9 percent elevated.
In extreme cases, a crude measure of medical care quality is the level of mortality in the population served. Limited information was available on mortality in post-Katrina Baton Rouge. The number of monthly deaths observed within EBRP was reported as part of a special study released by the Louisiana division of health and hospitals.48 The report presents deaths tabulated by the parish of permanent residence, so values for EBRP may not, particularly in the first months after Katrina, reflect mortality among evacuee populations residing temporarily in EBRP. However, the reported mortality rate in EBRP remained close to constant pre- and post-Hurricane Katrina. This result suggests that supplementary aid in the form of field hospitals, as well as the efforts of hospitals to increase the quantity of care provided, were sufficient to prevent any serious changes in the quality of medical services
available to the local population post-Katrina.
SOME CHALLENGES FOR ANALYSIS OF CRITICAL INFRASTRUCTURE RESILIENCE
Investigation of the performance of critical infrastructure systems in Baton Rouge after Hurricane Katrina provides insights into the nature of resilient infrastructure, the challenges faced in applying simulation to promoting resilience, and the need for adequate infrastructure performance data in any such attempt. In this last section, we discuss the CIPDSS validation results in terms of promoting critical resilience infrastructure, the applicable policy lessons learned from this process, and questions for further research.
Identification of Systems-Level Needs from CIPDSS Validation
As previously observed, the movement of evacuees out of Baton Rouge was not known when the CIPDSS simulation was performed, thereby, creating a high degree of uncertainty about the levels of stress placed on critical infrastructures over time. In addition, the CIPDSS model methodology was not, at the time, designed for scenarios involving dynamic population within a single model run. The Baton Rouge simulation, instead, assumed that peak population, taken as 1 .5 t imes the original population, remained in Baton Rouge permanently. Such static assumptions have the value of providing an estimate of the maximum impact possible in Baton Rouge, although the now-known
MYERS, TERRORIST TO TYRANT 21
HOMELAND SECURITY AFFAIRS, VOLUME VII, NO. 1 (JANUARY 2011) WWW.HSAJ.ORG
decrease in population over time makes it clear that this is an overestimate of actual effects. Given past experiences w i t h s i g n i f i c a n t p o p u l a t i o n displacements in the U.S. (e .g . Hurricane Andrew) and their likelihood in the future, the ability to simulate population movement and resulting impacts across all infrastructures may be critical in understanding regional resilience. While the basic ability to simulate effects of changing population has reportedly been enhanced in model updates, much remains unexplored about the behavior driving population movement. Indeed the ability to understand and model this and other behavioral and social factors (for example, institutional trust) is a major area for improvement in the analysis of infrastructure resilience.
The CIPDSS simulation of the Baton Rouge road system highlighted the need for appropriate model inputs for the characterization of infrastructure performance. The quality of road function in the simulation was described by the value of the Trip Duration Multiplier. Comparison of the Trip Duration Multiplier observed in Baton Rouge to CIPDSS predictions indicated that evening rush hour travel times were reasonably predicted, but trip duration was severely overestimated during morning rush hour periods. This overestimation resulted, in large part, from default input parameters that prescribed a higher number of trips initiated during the morning compared to evening rush hours, opposite to what was observed in Baton Rouge. In addition, comparison with the Baton Rouge Travel Demand Model indicates that the total number of trips in each d a y w a s o v e r e s t i m a t e d . S u c h
shortcomings could be easily remedied given sufficient data at the time of analys is , but as many of these parameters are unique to individual metropolitan areas, collecting data in the timeframe required for a rapid simulation is challenging.
The CIPDSS simulation of electrical power usage in Baton Rouge neglected to take into account seasonality in electricity demand, which in Baton Rouge is a significant issue. The model input also prescribed a gradual 20 percent increase in load over six months, whereas in reality an 11 percent increase occurred in the first month and disappeared as population dispersed. In addition, the dependence of the electrical supply system on the availability of fuels (coal, oil, and gas) and on transportation systems for their delivery was not reflected in the CIPDSS model at the time. Although loss of fuel supply did not impact electricity generation in Baton Rouge, the importance of this dependency is highlighted by the disruptions and price increases resulting from the breakdown in transportat ion of fuels af ter Hurricane Katrina. These shortfalls in the simulation process all highlight one of the fundamental difficulties of both broad efforts at infrastructure modeling in general and analysis of resilience in specific: defining the boundaries of the systems considered. The analysis must be limited to a scope which is feasible with available resources but also must include all major interactions, which will vary with the scenario considered and may include aspects of both the natural environment and other infrastructure systems.
Telecommunications is one of the more complex views in the CIPDSS
MYERS, TERRORIST TO TYRANT 22
HOMELAND SECURITY AFFAIRS, VOLUME VII, NO. 1 (JANUARY 2011) WWW.HSAJ.ORG
model but because of the scarcity of data for comparison many of the abilities and computational methods of this sector could not be validated. Much of the telecom simulation was dependent on constant values that dictated the length and severity of phone service overload. A ninety-day period was prescribed in CIPDSS for Wire-line and Wireless Availability to return to pre Katrina levels. Limited data from Baton Rouge indicates that phone service returned to pre-Katrina levels more quickly than e x p e c t e d . I n t h i s c a s e l i m i t e d information, due in large part to the private ownership of this critical infrastructure, prevented a meaningful analysis of infrastructure performance. This is not an incidental problem in critical infrastructure modeling for resilience.
In contrast, the models of the emergency services sectors in CIPDSS were relatively simple, and much data was available for validation, particularly f r o m l a w e n f o r c e m e n t . O f f i c e r Availability Ratio could not be directly validated. Instead an input to that variable, the Law Enforcement Service R a t e , w a s e v a l u a t e d . C I P D S S significantly underestimated the rate at which police calls were answered in Baton Rouge. The model also underestimated EMS Response during the first five weeks of the scenario. In both cases, underestimation was largely due to calculations that too heavily weighted the influence of telephone service and traffic congestion on the ability of emergency services to receive and respond to calls. This reflects the noted underestimation of the level of service within the road and telecom systems describing the impact of these conditions on emergency service
effectiveness, which may have been too pessimistic. But it also reflects an analytical gap: the diff iculty in imagining and, thus, accounting for responsiveness in a system, as well as social mitigation and human capital interventions at various levels. That is, in addition to shortcomings in the calculation of emergency service rates ( w h i c h w a s k n o w n t o C I P D S S developers but not able yet to be remedied at the time of analysis), the model did not allow for the possibility of extra personnel to compensate for lost effectiveness due to traffic, telecom, or other conditions. As a result CIPDISS p r e d i c t e d l o n g w a i t t i m e s a n d unanswered calls for all emergency services, which were not observed in Baton Rouge. This suggests that a more sophisticated emergency services model might be required which takes into consideration the factors (among others) that we have outlined here. But it also demonstrates the extreme difficulty of predicting results from even relatively s i m p l e i n t e r a c t i o n s b e t w e e n infrastructure sectors (e.g. delays to police response due to traffic, loss of EMS calls due to limited telephone service) in the absence of empirical data and the virtues of marrying empirical with qualitative analysis, as Sandia National Laboratories’ Energy and Systems Analysis Infrastructure, A Framework for Critical Infrastructure Resilience Analysis has suggested.49
Hospital occupancy rate or Bed Utilization was underestimated at the initiation of the CIPDSS simulation, due to the assumption of 85 percent occupancy (more typical of a city larger than Baton Rouge), but it was correctly predicted that hospitals would reach and stay at maximum occupancy for several
MYERS, TERRORIST TO TYRANT 23
HOMELAND SECURITY AFFAIRS, VOLUME VII, NO. 1 (JANUARY 2011) WWW.HSAJ.ORG
months. However, because the model did not include patients representing sick or injured evacuees, the number of those Treated in the hospital system w i t h i n t h e f i r s t w e e k w a s underestimated by as much as a factor of 8. This represents a failure to consider that evacuees were potentially at greater risk of illness, injury, and infectious disease through demographic factors (e.g. the elderly) as well as exposure to flood water and the stress of evacuating. Subsequently, Treated was overestimated as actual population decreased sharply in Baton Rouge, but not in the simulation. The model did correctly predict the need for an i n c r e a s e i n b e d c a p a c i t y o f approximately 1,000 beds, but did not d i f ferent iate between the rapid deployment of emergency medical facilities and the permanent expansion of the hospital system. Additionally, mortality rates calculated by CIPDSS are higher than those observed in Baton Rouge, due to the projected effects of longer wait times for ER treatment and lower staff to patient ratios. ER treatment rates within CIPDSS is estimated based on a measure of effectiveness in a similar fashion as for emergency services, and likewise effectiveness appears to have been underest imated resul t ing in an overestimate of mortality. At issue here again are two challenges already identified: the need to integrate human and social factors with analysis of the infrastructure system and the difficulty of est imating the magnitude of interactions between infrastructure components which may not have been previously observed or quantified.
Challenges in Simulation Modeling from CIPDSS Validation
Despite the extreme stress experienced by infrastructures due to the sudden increase in population in Baton Rouge, no serious loss of services occurred. This result was the product of two factors: the limited direct impacts of Hurricane Katrina on Baton Rouge and, conversely, the unanticipated and reasonable level of resilience demonstrated by its infrastructure through a variety of adaptive processes.
Given adequate resources and manpower, the hospital and emergency service systems were able to respond readily, provided that they were supplemented by temporary aids and expedients (such as the PEMAC field h o s p i t a l ) a n d l o n g e r s h i f t s f o r emergency service workers, enabling them to meet a surge in demand beyond their usual capacity. Similarly, wireless telephone service providers were also responsive, able to deploy portable wireless equipment to meet increased demand, which resulted in relatively short service interruptions given the magnitude of the changes in system load. In fact, this rapid response appeared to accelerate preexisting trends towards increased use of wireless service.
The power grid, often considered a tightly coupled and relatively brittle infrastructure system, exhibited excess capacity in Baton Rouge to meet the unusual but relatively small increase in demand from higher populations. The stress on the road system proved to be the least manageable challenge, given a fixed supply of service available, a system close to capacity prior to Katrina, and a limited infrastructure and social
MYERS, TERRORIST TO TYRANT 24
HOMELAND SECURITY AFFAIRS, VOLUME VII, NO. 1 (JANUARY 2011) WWW.HSAJ.ORG
acceptance of mass transit alternatives. As a result, despite the best efforts of infrastructure managers, there was little to be done to address increased congestion and longer travel times post-Katrina, conditions which only abated as extra population dispersed. Even though many infrastructure sectors were successful in managing the aftermath of Hurricane Katrina in Baton Rouge, almost all described challenges and lessons learned, and, under more extreme or different stresses, more damaging outcomes were certainly possible. Conversely, efforts to increase resilience might expand upon and enhance existing coping ability and focus on enabling systems to function acceptably under a broad range of conditions.
Although tools like CIPDSS can in principle contribute to a more orderly and efficient deployment of services and provide insight into effective adaptation strategies to increase resilience, val idation of the model against observations in Baton Rouge reveals some challenges facing such efforts. These challenges are particularly daunting when trying to develop modeling systems that can provide a broad view for the management of many interdependent infrastructure systems. The most immediate challenge is choosing the appropriate goals and methodology for a modeling tool – a problem evident in the fact that the degree of complexity of model sectors within CIPDSS varies widely, is influenced by the priorities of the model developers, and is not always in accord with the importance of the sector during a given simulation. For example, the electricity subsector in CIPDSS is fairly simple with a limited number of
interdependencies, but interdependence with this sector is of critical importance, as demonstrated by the impact of Hurricane Katrina on energy supply chains.50
Approximately half of the instances of prediction error observed within the simulation of Baton Rouge were due to a less than ideal choice of model input, with the rest explained by omissions or l imitat ions in assumptions and calculation methods. The significant amount of error caused by model inputs highlights the fact that large amounts of scenario or location-specific information is required to deploy CIPDSS or any model of infrastructure resilience with accuracy. This is particularly a challenge for rapid deployment of modeling tools. To address this, data on metropolitan regions of interest can be pre-compiled or more model behaviors can be parameterized, although both measures involve a trade-off with the specificity of the model scenario. One potential approach to addressing this need for reliable and validated inputs for various infrastructure sectors might be to obtain information from the wealth of existing location-specific infrastructure models, for example the Baton Rouge travel demand model.
A shortfall observed throughout the CIPDSS sectors involved in the Baton Rouge simulation was particularly noticeable in the telephone subsector. Many of the computations of the telecom model had little impact on end results because scenario-specific constant values largely determined the model’s behavior. These inputs were used to produce reasonable results during the process of rapid deployment in large part because the model was not originally designed with population
MYERS, TERRORIST TO TYRANT 25
HOMELAND SECURITY AFFAIRS, VOLUME VII, NO. 1 (JANUARY 2011) WWW.HSAJ.ORG
fluctuation in mind as a driving force for a scenario. Use of population as a driving force would, however, require the ability to predict the population dynamics of a given scenario from limited data, and such modeling of human behavior possesses its own basic and technical challenges. This reliance on choice of constants to produce reasonable results also reflects the extreme difficulty of predicting the needs of users of a simulation model intended to be applied to a variety of very different scenarios.
Another difficulty was the estimation of interdependencies where, in many cases, the strength of the interactions being modeled where overestimated. This demonstrated a particular need for calibration and validation of the functions and calculations that describe interdependencies in CIPDSS. A shortfall exists in basic knowledge about t h e b e h a v i o r o f i n t e r a c t i n g infrastructures that can only be overcome through the collection of sufficient performance data from a variety of stressful and crisis conditions across a representative selection of metropolitan areas.
Lastly, maintaining consistency of assumptions between model sectors, often programmed and set up for analysis by different operators, can also be a challenge. For example, the Baton
Rouge simulation assumed that growth takes place in road capacity over a six-month period, but the number of police officers over the same period is static.
These and other challenges in p r o m o t i n g r e s i l i e n c e t h r o u g h s i m u l a t i o n - b a s e d a n a l y s i s a r e summarized in Table 2. Both technical and conceptual difficulties are presented along with new directions in which solutions may be found in the arenas of research, implementation, and policy. It is important to recall that the Baton Rouge scenario did not exercise many important capabilities of the CIPDSS model and, thus, that all model components may display a similar mix of soft spots and promising successes, as those examined in this study. Hence, comparison of modeling efforts with real world data is a necessary step in bringing CIPDSS or any similar model to maturity, but must also be an ongoing process. Improvements to the model identified by this analysis have largely been implemented in subsequent revisions. However, shortfalls are still expected in applying the updated model to new scenarios. Development of comprehensive and multi-component modeling systems in a fashion so as to provide accurate predictions to guide resilience planning is inevitably a continuous process of refinement.
MYERS, TERRORIST TO TYRANT 26
HOMELAND SECURITY AFFAIRS, VOLUME VII, NO. 1 (JANUARY 2011) WWW.HSAJ.ORG
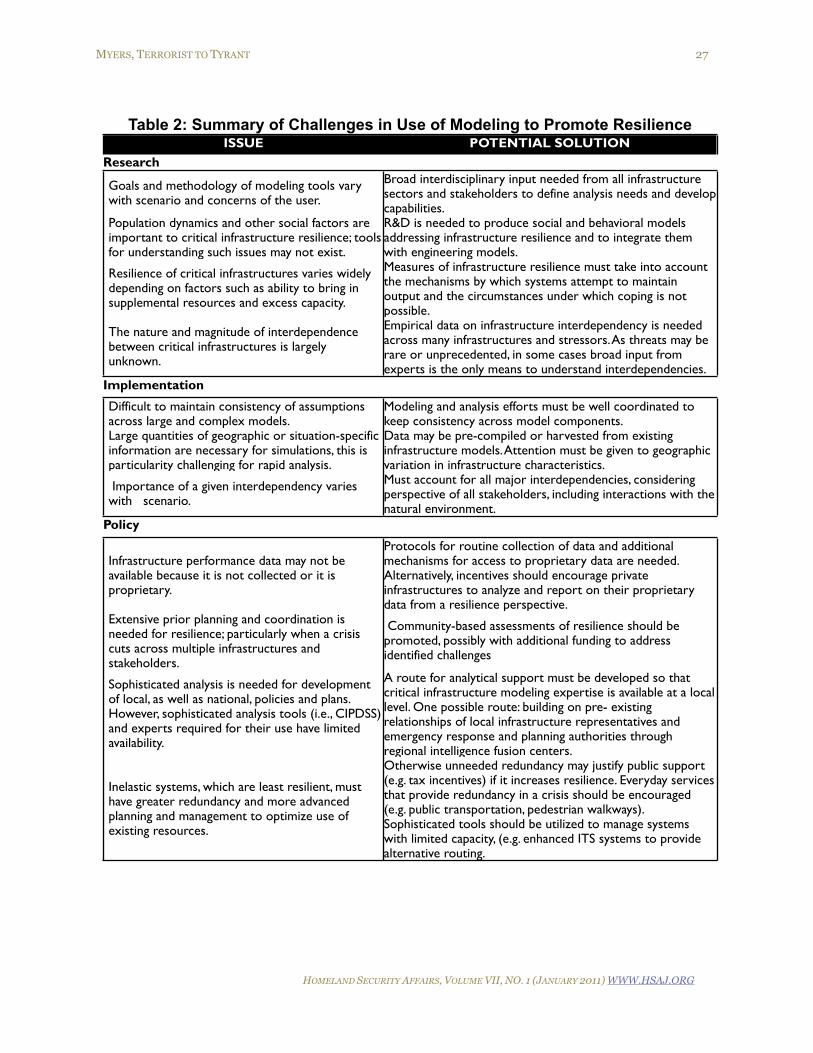
Table 2: Summary of Challenges in Use of Modeling to Promote ResilienceTable 2: Summary of Challenges in Use of Modeling to Promote ResilienceISSUE POTENTIAL SOLUTION
Research Research
Goals and methodology of modeling tools vary with scenario and concerns of the user.
Broad interdisciplinary input needed from all infrastructure sectors and stakeholders to define analysis needs and develop capabilities.
Population dynamics and other social factors are important to critical infrastructure resilience; tools for understanding such issues may not exist.
R&D is needed to produce social and behavioral models addressing infrastructure resilience and to integrate them with engineering models.
Resilience of critical infrastructures varies widely depending on factors such as ability to bring in supplemental resources and excess capacity.
Measures of infrastructure resilience must take into account the mechanisms by which systems attempt to maintain output and the circumstances under which coping is not possible.
The nature and magnitude of interdependence between critical infrastructures is largely unknown.
Empirical data on infrastructure interdependency is needed across many infrastructures and stressors. As threats may be rare or unprecedented, in some cases broad input from experts is the only means to understand interdependencies.
Implementation Implementation
Difficult to maintain consistency of assumptions across large and complex models.
Modeling and analysis efforts must be well coordinated to keep consistency across model components.
Large quantities of geographic or situation-specific information are necessary for simulations, this is particularity challenging for rapid analysis.
Data may be pre-compiled or harvested from existing infrastructure models. Attention must be given to geographic variation in infrastructure characteristics.
Importance of a given interdependency varies with scenario.
Must account for all major interdependencies, considering perspective of all stakeholders, including interactions with the natural environment.
Policy Policy
Infrastructure performance data may not be available because it is not collected or it is proprietary.
Protocols for routine collection of data and additional mechanisms for access to proprietary data are needed. Alternatively, incentives should encourage private infrastructures to analyze and report on their proprietary data from a resilience perspective.
Extensive prior planning and coordination is needed for resilience; particularly when a crisis cuts across multiple infrastructures and stakeholders.
Community-based assessments of resilience should be promoted, possibly with additional funding to address identified challenges
Sophisticated analysis is needed for development of local, as well as national, policies and plans. However, sophisticated analysis tools (i.e., CIPDSS) and experts required for their use have limited availability.
A route for analytical support must be developed so that critical infrastructure modeling expertise is available at a local level. One possible route: building on pre- existing relationships of local infrastructure representatives and emergency response and planning authorities through regional intelligence fusion centers.
Inelastic systems, which are least resilient, must have greater redundancy and more advanced planning and management to optimize use of existing resources.
Otherwise unneeded redundancy may justify public support (e.g. tax incentives) if it increases resilience. Everyday services that provide redundancy in a crisis should be encouraged (e.g. public transportation, pedestrian walkways). Sophisticated tools should be utilized to manage systems with limited capacity, (e.g. enhanced ITS systems to provide alternative routing.
MYERS, TERRORIST TO TYRANT 27
HOMELAND SECURITY AFFAIRS, VOLUME VII, NO. 1 (JANUARY 2011) WWW.HSAJ.ORG
CONCLUSION: Future Directions in Resilience Modeling and Data Collection
Resilience is a fundamental goal for critical infrastructure systems. Fostering r e s i l i e n c e i s b y n e c e s s i t y a n interdisciplinary effort involving expertise from subject-matter experts across infrastructure sectors, as well as knowledge from far outside these fields. While the resilience of individual infrastructures is a focus of significant attention by system managers, a resilient interdependent “system of systems” which comprises modern societies’ critical infrastructure is less often considered, and generally only by a small number of academics or government analysts.
The collection of performance-monitoring data is vital in the analysis and promotion of infrastructure resilience. It allows for operational adjustments during crises, and helps validate and direct research and m o d e l i n g s t u d i e s s u p p o r t i n g preparation and planning for future crises. It enables accurate after-action analysis of natural disasters and other hazards and aids in estimating the level o f r e s i l i e n c e d e m o n s t r a t e d b y infrastructures and the success of steps taken to promote resilience. This data is also useful in understanding the nature and strength of interdependence between various infrastructures, which, while identifiable with knowledge of a system, may only be apparent in their true magnitude when systems are stressed.
The choice of appropriate measures of infrastructure performance to indicate resilience is also important. Existing measures of performance are a
starting point and can be considered in a resilience framework (i.e., in Baton Rouge, these included such items as response times, relative travel time, mortality, number of customers without phone or electrical service, etc.). These types of information are currently collected, largely for short term o p e r a t i o n a l a d j u s t m e n t s ( e . g . redeployment of personnel) as well as longer term performance monitoring. This data is, however, not generally analyzed from the perspective of promoting resilience, and such efforts may require new methods of analysis outside the realm of infrastructure manager expertise. Such efforts may i n c l u d e , f o r i n s t a n c e , c o m p l e x consideration of threatening events, i n t e r d e p e n d e n c e s w i t h o t h e r infrastructures, and impact of human behavior on systems performance. In this paper, we identified five dimensions that infrastructure planners and emergency managers might consider in their efforts to ensure infrastructure resilience in their community. These include redundancy of services, responsiveness to stressors, elasticity for expansion, socially-mediated mitigation, and adaptive behavior of human capital.
In the area of infrastructure performance and resilience, simulation-based analysis, as exemplified in this work by CIPDSS, is needed. Such a n a l y s i s m a y e n c o m p a s s b r o a d perspect ives , inc luding detai led information on each infrastructure and its behavior, as well as interactions between infrastructures, and the economic, public health, or social effects of changes and disruptions. As has been d e m o n s t r a t e d b y t h i s w o r k , infrastructure performance data is critical to accurate and successful
MYERS, TERRORIST TO TYRANT 28
HOMELAND SECURITY AFFAIRS, VOLUME VII, NO. 1 (JANUARY 2011) WWW.HSAJ.ORG
modeling of infrastructures and in particularly of interdependences. C o n t i n u e d w o r k o n b o t h i n t e r d e p e n d e n c y m o d e l i n g a n d infrastructure performance data collection is expected to greatly enhance the knowledge base required to increase infrastructure resilience.
ABOUT THE AUTHORS
Laura J. Steinberg is dean of the LCS Smith Col lege of Engineering and Computer Science at Syracuse University. Her research on the effects of extreme events on infrastructure and community resilience has been published in such journals as Natural Hazards Review, Earthquake Spectra, and Urban Affairs Review. She may be contacted at [email protected]. Nicholas Santella is a consultant at Brownfied Associates Inc., West Grove, PA. His work focuses on the use of tracers to understand transport in natural and m a n m a d e s y s t e m s , e n v i r o n m e n t a l protection, and infrastructure modeling. Mr. Santella may be contacted at [email protected]. Corrine B. Zoli is a research fellow at the Institute for National Security and Counter Terrorism (INSCT), Maxwell School, Syracuse University. She has research interests in national and international security and humanitarian issues with a focus on the new war, science-technology issues, and gender, culture, and diversity. Among other aims, Zoli’s research efforts demonstrate a consistent priority: the value added to “real world” political and international issues and policy analysis by interdisciplinary academic research. She may be contacted at [email protected].
MYERS, TERRORIST TO TYRANT 29
HOMELAND SECURITY AFFAIRS, VOLUME VII, NO. 1 (JANUARY 2011) WWW.HSAJ.ORG
HOMELAND SECURITY AFFAIRS, VOLUME 7, ARTICLE 7 (FEBRUARY 2011) WWW.HSAJ.ORG
1 See B. Allenby and J. Fink, “Toward Inherently Secure and Resilient Societies,” Science 309 (August 12, 2005):1034, for this definition and its elaboration by DHS, Homeland Security Advisory Council (HSAC) Report of the Critical Infrastructure Taskforce (January 2006), http://www.dhs.gov/xlibrary/assets/HSAC_CITF_Report_v2.pdf. HSAC’s concept has underlined DHS efforts to prioritize “Critical Infrastructure Resilience (CIR)” as a supplement to Critical Infrastructure Protection (CIP).
2 D.R. Godschalk, “Urban Hazard Mitigation: Creating Resilient Cities,” Natural Hazards Review 4, no.3 (2003): 136-143; S.E. Chang and M. Shinozuka, “Measuring Improvements in the Disaster Resilience of Communities Earthquake,” Spectra 20, no. 3(2004): 739-755; A. Rose “Defining and Measuring Economic Resilience to Disasters,” Disaster Prevention and Management 13, no. 4 (2004): 307-314, http://www.emeraldinsight.com/journals.htm?issn=0965-3562; J. Cascio, “The Next Big Thing: Resilience,” Foreign Policy 88, no. 3 (May/June, 2009); Patricia H. Longstaff and others, “Building Resilient Communities: A Preliminary Framework for Assessment,” Homeland Security Affairs VI, no. 3 (Sept 2010): 1-23, http://www.hsaj.org/?article=6.3.6.
3 For specifics see: U.S. Department of Homeland Security, Office of Inspections and Special Reviews, A Performance Review of FEMA’s Disaster Management Activities In Response to Hurricane Katrina, OIG-06-32 (March 2006), http://www.dhs.gov/xoig/assets/mgmtrpts/OIG_06-32_Mar06.pdf; and R.D. Knabb, J.R. Rhome, and D.P. Brown “Tropical Cyclone Report Hurricane Katrina, 23-30 Aug 2005,” National Hurricane Center, December 20, 2005/Updated August 10, 2006.
4For example: United States Congress, House of Representatives, A Failure of Initiative: Final Report of the Select Bipartisan Committee to Investigate the Preparation for and Response to Hurricane Katrina, (February 2006), http://katrina.house.gov/full_katrina_report.htm; Hurricane Katrina: A Nation Still Unprepared, Special Report of the Senate Committee on Homeland Security and Governmental Affairs, Rpt. 109-322, (Washington, DC. 2006); T. Birkland, Lessons of Disaster: Policy Change After Catastrophic Events (Georgetown University Press, 2006); Department of Homeland Security (DHS) , The First Year After Hurricane Katrina: What the Federal Government Did (2006), http://www.dhs.gov/xfoia/archives/gc_1157649340100.shtm.
5 C. Franco and others, “Systemic Collapse: Medical Care in the Aftermath of Hurricane Katrina,” Biosecurity and Bioterrorism Biodefense Strategy, Practice, and Science 4, no. 2 (2006): 135-147; B.H. Gray and K. Hebert, “Hospitals in Hurricane Katrina: Challenges Facing Custodial Institutions in a Disaster,” Journal of Health Care for the Poor and Underserved 18, no. 2(2007): 283-298.
6 W.E. Schlenger and others, “Estimating Loss of Life from Hurricane-Related Flooding in the Greater New Orleans Area,” Health Effects of Hurricane Katrina: Final Report (May 19, 2006), https://www.abtassoc.eu/reports/IPET_9_Hurricane_Katrina_Health_Effects.pdf; K.U. Stephens and others, “Excess Mortality in the Aftermath of Hurricane Katrina: A Preliminary Report,” Disaster Med Public Health Preparedness (2007): 1 15–20.
7 A. Kwasinsk and others, “Telecommunications Power Plant Damage Assessment Caused by Hurricane Katrina – Site Survey and Follow-Up Results,” Telecommunications, Energy Conference, INTELEC '06. 28th Annual International University of Illinois at Urbana-Champaign, September 10-14, 2006; L.K. Comfort and T.W. Haase, “Communication, Coherence, and Collective Action: The Impact of Hurricane Katrina on Communications Infrastructure,” Public Works Management Policy 10 (2006); 328-343.
MYERS, TERRORIST TO TYRANT 31
HOMELAND SECURITY AFFAIRS, VOLUME VII, NO. 1 (JANUARY 2011) WWW.HSAJ.ORG
8 For example see: A. Boin and A. McConnell, “Preparing for Critical Infrastructure Breakdowns: The Limits of Crisis Management and the Need for Resilience,” Journal of Contingencies and Crisis Management 15, no. 1 (2007): 50–59. Boin and McConnell focus on “societal resilience,” defined as “the ability to ‘bounce back’ after suffering a damaging blow” (p. 54) using A.B. Wildavsky’s early definition of the term, in Searching for Safety (New Brunswick, NJ: Transaction Books, 1988), in which he balanced resilience against risk. For an updated discussion of resilience, see L.K. Comfort, “Risk, Security and Disaster Management,” Annual Review of Political Science 8 (2005):335–56. For broader interdisciplinary discussions of the ‘fuzziness’ of the resilience concept, see R. Pendall, K. Foster, and M. Cowell, “Resilience and Regions: Building Understanding of the Metaphor,” Cambridge Journal of Regions, Economy and Society 3 (2010): 71–84.
9 D. Paton and D. Johnston, Disaster Resilience: An Integrated Approach (Springfield, IL: Charles C Thomas Ltd., 2006); Homeland Security Advisory Council (HSAC) Report of the Critical Infrastructure Task Force 2006, http://www.dhs.gov/xlibrary/assets/HSAC_CITF_Report_v2.pdf; T.C. O’Rourke, “Critical Infrastructure, Interdependencies and Resilience,” The Bridge 37 (2007): 22-29; George Mason University, “Critical Thinking: Moving from Infrastructure Protection to Infrastructure Resilience,” CIP Program Discussion Paper Series (February 2007); T. McDaniels and others, “Empirical Framework for Characterizing Infrastructure Failure Interdependencies,” Journal of Infrastructure Systems 13, no. 3 (2007): 175-184 2007; Y. Sheffi, “Building a Resilient Organization,” The Bridge 37 (2007):30-36.
10 For resilience as promoted in national policy, see The White House, The National Security Strategy of the United States of America (Washington, DC: May 2010); U.S. Department of Homeland Security, Homeland Security Advisory Council, Top Ten Challenges Facing the Next Secretary of Homeland Security (Washington, DC, September 11, 2008): 11-12; U.S. Department of Homeland Security, “One Mission, Securing Our Homeland,” U.S. Department of Homeland Security Strategic Plan 2008-2013 (Washington, DC: 2008); U.S. Department of Homeland Security, National Infrastructure Protection Plan (Washington, DC: 2009); U.S. Department of Homeland Security, National Disaster Recovery Framework (Washington, DC: February 2010); President Obama’s 2010 “Presidential Proclamation declaring December, 2010 Critical Infrastructure Protection Month,” http://www.whitehouse.gov/the-press-office/2010/11/30/presidential-proclamation-critical-infrastructure-protection-month/
11 White House, The Federal Response to Hurricane Katrina: Lessons Learned (Feb 2006), http://georgewbush-whitehouse.archives.gov/reports/katrina-lessons-learned/. Hereafter: Federal Response.
12 The White House, “Presidential Proclamation – Critical Infrastructure Protection Month,” November 30, 2010, http://www.whitehouse.gov/sites/default/files/2009cip.prc_.rel_.pdf.
13 For a review of interdependent critical infrastructure modeling efforts see: P. Pederson and others, “Critical Infrastructure Interdependency Modeling: A Survey of U.S. and International Research,” INL/EXT-06-11464 (August 2006), http://www.inl.gov/technicalpublications/Documents/3489532.pdf. For examples of NISAC efforts see: S.H. Conrad and others, “Critical National Infrastructure Reliability Modeling and Analysis,” Bell Labs Technical Journal 11, no. 3(2006): 57-71; H.J. Min and others, “Toward Modeling and Simulation of Critical National Infrastructure Interdependencies,” IEEE Transactions 39 (2007): 57-71.
14 American Lifelines Alliance, Workshop on Unified Data Collection, National Institute of Building Sciences, Washington, D.C., November 2007.
15 See D.M. Simpson and others, “Holloman CO Framing a New Approach to Critical Infrastructure Modeling and Extreme Events,” International Journal of Critical Infrastructures 1, nos. 2-3 (2005):) 125-143; J.H. Kahan, A.C. Allen, and J.K. George, “An Operational Framework for Resilience,” Journal of Homeland Security and Emergency Management 6(2009): 83, http://www.bepress.com/jhsem/vol6/iss1/83/.
MYERS, TERRORIST TO TYRANT 32
HOMELAND SECURITY AFFAIRS, VOLUME VII, NO. 1 (JANUARY 2011) WWW.HSAJ.ORG
16 See for example, N. Adam (ed.) Workshop on Future Directions in Critical Infrastructure Modeling and Simulation Final Report (Department of Homeland Security, December 23, 2008) and the topics planned for the “Workshop on Grand Challenges in Modeling, Simulation, and Analysis for Homeland Security,” March 17-18, 2010, http://www.bepress.com/jhsem/vol6/iss1/83/
17 See Los Alamos National Lab, National Infrastructure Simulation and Analysis Center, description of CIPDSS, as “a computer simulation and decision analytic tool that informs users when making difficult choices between alternative mitigation measures and operational tactics, or when allocating limited resources to protect the nation’s critical infrastructures,” http://www.lanl.gov/programs/nisac/cipdss.shtml
18 See J. Moteff and P. Parfomak, Critical Infrastructure and Key Assets: Definition and Identification, RL 32631 (U.S. Library of Congress, Congressional Research Service, October 1, 2004) for a review of the evolving definitions of critical infrastructure and key assets in US policy.
19 Conrad and others, Critical National Infrastructure Reliability Modeling; J.M. Fair and others, “An Integrated Simulation of Pandemic Influenza Evolution, Mitigation and Infrastructure Response,” Technologies for Homeland Security, IEEE Conference, May 16–17 2007.
20 D.R. Powell and others, CIPDSS Baton Rouge Report, Analysis of the Impact of Hurricane Katrina on Baton Rouge (Sept 20 2005), unpublished report available on request. Hereafter, CIPDSS Baton Rouge Report
21 DHS, The First Year After Hurricane Katrina: What the Federal Government Did.
22 L.J. Steinberg, N. Santella, and K. Parks, Validation of a CIPDSS Analysis of Hurricane Katrina's Impacts on Baton Rouge LA 2007, unpublished report available on request. Hereafter, CIPDSS Validation Study.
23 Many of the shortcomings identified in the CIPDSS tool were quickly remedied in the second half of the model’s development. Personnel communication with R. LeClaire, Los Alamos National Lab, 2008.
24 As described by Sandia National Laboratories Energy and Systems Analysis Infrastructure, A Framework for Critical Infrastructure Resilience Analysis, there has been a notable shift from a traditional federal government critical infrastructure security policy focus on physical protection and “hardening” of infrastructure assets (e.g., electricity, water supply) to a DHS-initiated recognition that “protection, in isolation, is a brittle strategy” and “critical infrastructure protection policies should consider not only the prevention of disruptive events, but also the processes that infrastructure systems undergo to maintain functionality following disruptions.”
25 See for instance A. Boin and D. Smith, “Terrorism and Critical Infrastructures: Implications for Public–Private Crisis Management,” Public Money & Management 26 no. 5 (2006): 295-304; HSAC Report of the Critical Infrastructure Taskforce has observed: “The CITF believes that protection, in isolation, is a brittle strategy. We cannot protect every potential target against every conceivable attack; we will never eliminate all vulnerabilities. Furthermore, it is virtually impossible to define a desired endstate – to quantify how much protection is enough – when the goal is to reduce vulnerabilities. In contrast…[s]trategies based on resilience accept that efforts to prevent attacks (reduce threats) and to defend against those attacks (reduce vulnerabilities), albeit necessary, will inevitably prove insufficient…making resilience the top-level objective – the desired outcome – would foster development of subordinate risk management strategies that more effectively address the complexities inherent in the critical infrastructure mission” (p. 4-5). This approach also helps set federal investment parameters, not an insignificant issue given limited resources and the costs of disaster mitigation.
26 M. Bruneau and others, “A Framework to Quantitatively Assess and Enhance the Seismic Resilience of Communities,” Earthquake Spectra 19, no. 4 (2003): 733–752.
MYERS, TERRORIST TO TYRANT 33
HOMELAND SECURITY AFFAIRS, VOLUME VII, NO. 1 (JANUARY 2011) WWW.HSAJ.ORG
27 For a traditional engineering definition of resilience with a focus on physical systems and their stability see Holling, “CS Engineering Resilience versus Ecological Resilience,” in P.C. Schulze, ed., Engineering within Ecological Constraints (Washington, DC: National Academy Press, 1996). More recent system’s engineering approaches emphasize redundancy, performance measures, and the complexity of systems and context. See E. Hollnagel, C.P. Nemeth, and S. Dekker, Resilience Engineering Perspectives: Remaining Sensitive to the Possibility of Failure (Hampshire, UK and Burlington, VT: Ashgate, 2008); D. Arsenault and A. Sood, “Resilience: A Systems Design Imperative, Critical Thinking: Moving from Infrastructure Protection to Infrastructure Resilience,” in CIPP Discussion Paper Series (George Mason University School of Law, Critical Infrastructure Protection Program, January 2007); Y.Y. Haimes, K. Crowther, and B.M. Horowitz, “Homeland Security Preparedness: Balancing Protection with Resilience in Emergent Systems,” Systems Engineering 11, no. 4 (2008): 287-308. For the distinction between crisis and disaster, see Boin and McConnell, “Preparing for Critical Infrastructure Breakdowns,” 51.
28 H. Rubin and Rubin, Qualitative Interviewing: The Art of Hearing Data (Thousand Oaks, CA: Sage, 1995); R.W. Shuy, “In-Person versus Phone Interviewing,” in J.F. Bugrium and H.A. Holstein, eds., Handbook of Interview Research: Context & Method (Thousand Oaks: CA: Sage Publications, 2001), 537-555.
29 American Lifelines Alliance, Workshop on Unified Data Collection.
30 Moteff and Parfomak, Critical Infrastructure and Key Assets: Definition and Identification.
31 U.S. Government Accountability Office, Critical Infrastructure Protection: DHS Efforts To Assess And Promote Resiliency Are Evolving But Program Management Could Be Strengthened, GAO 10-772 (Washington, DC: Government Printing Office, September 2010).
32 For work on how population trends over time can provide useful information about the process of disaster recovery see, for example: S.E. Chang, “Urban Disaster Recovery: A Measurement Framework and its Application to the 1995 Kobe Earthquake,” Disasters 34, no. 2 (2010): 303−327.
33 Special population estimates were produced by Claritas, a private marketing company now part of Nielsen (Claritas, “Hurricane Katrina Adjusted Population Estimates 2006”) as well as by the U.S. Census (U.S. Census, “Special Population Estimates for Impacted Counties in the Gulf Coast Area 2006,” http://www.census.gov/newsroom/emergencies/hurricane_katrina.html). The higher Claritas (2006) estimates appeared to be more accurate, based on a comparison with the subsequent Census data.
34White House, Federal Response to Hurricane Katrina.
35 “Traffic Studies Show 20% Jump Storm’s Vehicular Surge Eases by a Third, The Advocate, June 26 2006; Baton Rouge Area Chamber (BRAC), “Solving Louisiana’s Transportation Crisis,” May 17, 2007 http://www.brac.org/uploads/TransportationIssueBrief_FINAL051707.pdf; Louisiana Recovery Authority (LRA), “East Baton Rogue Parish Needs Assessment,” 2006 http://www.louisianaspeaks-parishplans.org/IndParishHomepage_BaselineNeedsAssessment.cfm?EntID=6.
36 Census, 2005 American Community Survey, Population and Housing Narrative Profile, http://factfinder.census.gov/servlet/NPTable?_bm=y&-geo_id=05000US22033&-qr_name=ACS_2005_EST_G00_NP01&-gc_url=&-ds_name=&-_lang=en&-redoLog=false.
37 National Transit Database (2007), http://www.ntdprogram.gov/ntdprogram/.
38 Personal communication, P. Allain, Chief of Traffic Engineering Division, LADOTD, 2007.
39 Urban Systems Associates, Inc. (USA Inc.), “Baton Rouge Metro Retiming Project State Project #700-990-0279” (November 2005); unpublished report, available on request from LADOTD.
MYERS, TERRORIST TO TYRANT 34
HOMELAND SECURITY AFFAIRS, VOLUME VII, NO. 1 (JANUARY 2011) WWW.HSAJ.ORG
40 J.M. Nigg, J. Barnshaw, and M.R. Torres, “Hurricane Katrina and the Flooding of New Orleans: Emergent Issues in Sheltering and Temporary Housing,” The ANNALS of the American Academy of Political and Social Science 604, no.1 (March 2006): 113-128.
41 Testimony by William L. Smith before the Committee on Homeland Security and Governmental Affairs titled, “Hurricane Katrina: Managing Law Enforcement and Communications in a Catastrophe” February 6, 2006.
42 TELEPHIA press release June 12, 2006 available on the web at: http://www.telephia.com/html/insights_061206.html; “Katrina Lifeline Program Available for Qualified Gulf Coast Residents,” Business Wire, December 21, 2005.
43 C. Connolly, “Thousands of Katrina 911 Calls Went Astray,” Washington Post, November 8, 2005.
44 “National Guard Help to Keep Order in BR,” The Advocate, September 7, 2005.
45 Centers for Disease Control, United States Health 2007, http://www.cdc.gov/nchs/hus.htm
46 Department of Homeland Security (DHS), East Baton Rouge Parish – Hurricanes Katrina and Rita After-Action Report, 2005 (unpublished report; available on request).
47 T.D. Edwards, R.A. Young, and A.F. Lowe, “Caring for a Surge of Hurricane Katrina Evacuees in Primary Care Clinics,” Annals of Family Medicine 5, no. 2 (2007): 170-174, http://www.annfammed.org/cgi/reprint/5/2/170.pdf; P.G. Greenough and others, “Burden of Disease and Health Status Among Hurricane Katrina – Displaced Persons in Shelters: A Population-Based Cluster Sample,” Annals of Emergency Medicine 51, no. 4 (2008): 426-432.
48 Department of Health and Human Services (DHH), Mortality in the Greater New Orleans Area, Louisiana - Post Katrina (May 5, 2007, updated June 25, 2007), www.dhh.louisiana.gov/offices/miscdocs/docs-253/special%20studies/DEATHGNO110507.pdf
49 See note 23.
50 E. Chow and J. Elkind, “Hurricane Katrina and U.S. Energy Security,” Survival 47, no.4 (2005): 145–160.

Copyright © 2011 by the author(s). Homeland Security Affairs is an academic journal available free of charge to individuals and institutions. Because the purpose of this publication is the widest possible dissemination of knowledge, copies of this journal and the articles contained herein may be printed or downloaded and redistributed for personal, research or educational purposes free of charge and without permission. Any commercial use of Homeland Security Affairs or the articles published herein is expressly prohibited without the written consent of the copyright holder. The copyright of all articles published in Homeland Security Affairs rests with the author(s) of the article. Homeland Security Affairs is the online journal of the Naval Postgraduate School Center for Homeland Defense and Security (CHDS).
http://www.hsaj.org