bathymetry of the tonga trench and forearc: a map series
TRANSCRIPT

Marine Geophysical Researches21: 489–511, 2000.© 2000Kluwer Academic Publishers. Printed in the Netherlands.
489
Bathymetry of the Tonga Trench and Forearc: a map series
Dawn J. Wright1, Sherman H. Bloomer1, Christopher J. MacLeod2, Brian Taylor3 andAndrew M. Goodlife31Department of Geosciences, Oregon State University, Corvallis, OR 97331-5506 USA;2Department of EarthSciences, University of Wales, Cardiff CF1 3YE, UK;3Department of Geology & Geophysics, School of Ocean &Earth Science &Technology, University of Hawai‘i, Honolulu, HI 96822 USA
Received 24 September 1998; accepted 16 June 2000
Key words:Convergent margins, map series, multibeam bathymetry, tectonic erosion, Tonga forearc, Tonga Trench
Abstract
Four new bathymetric maps of the Tonga Trench and forearc between 14◦S and 27◦S display the important morphologic and structural featuresof this dynamic convergent margin. The maps document a number of important geologic features of the margin. Major normal faults and faultlineaments on the Tonga platform can be traced along and across the upper trench slope. Numerous submarine canyons incised in the landwardslope of the trench mark the pathways of sediment transport from the platform to mid- and lower-slope basins. Discontinuities in the trench axisand changes in the morphology of the landward slope can be clearly documented and may be associated with the passage and subduction of theLouisville Ridge and other structures on the subducting Pacific Plate. Changes in the morphology of the forearc as convergence changes fromnormal in the south to highly-oblique in the north are clearly documented. The bathymetric compilations, gridded at 500- and 200-m resolutionsand extending along∼500 km of the landward trench slope and axis, provide complete coverage of the outer forearc from the latitude of theLouisville Ridge-Tonga Trench collision to the northern terminus of the Tonga Ridge. These maps should serve as a valuable reference for othersea-going programs in the region, particularly the Ocean Drilling Program (ODP) and the National Science Foundation MARGINS initiative.
Introduction
In recent years, large, regional-scale bathymetric mapspublished inMarine Geophysical Researcheshave fo-cused on various portions of the global mid-oceanridge (Purdy et al., 1990; Macdonald et al., 1992;Cochran et al., 1992; Scheirer et al., 1996; Kee-ton et al., 1997). Here we present a regional-scalemap series of a convergent margin, consisting of fourfoldout maps (Maps 1–4, found at the back of this is-sue) of the Tonga Trench and forearc between 14◦Sand 27◦S (Figure 1). These maps provide a num-ber of insights into the geology and structure of anactive intraoceanic forearc and trench, and serve asa companion and reference for the more detailed ge-ological studies of this region appearing elsewhere(e.g., Clift et al., 1998; Kelman, 1998; Clift andMacLeod, 1999), as well as a valuable reference forother sea-going efforts, such as ODP drilling and ma-rine geological/geophysical cruises under the auspicesof the National Science Foundation’s MARGINS ini-tiative (Taylor et al., 1998). The bathymetric gridsused to create these maps are available on the World
Wide Web as binary Generic Mapping Tools (GMT;Wessel and Smith, 1995) grid files (see Appendix).
Bathymetric studies of the Tonga Trench and fore-arc have been important tools in interpretations of ge-ological processes along this margin for four decade,beginning with Raitt et al. (1955). The morphology ofthe trench slopes has been used as: (1) part of the inter-pretations of basement and sedimentologic processes(Fisher and Engel, 1969; Bloomer and Fisher, 1987;Tappin, 1994; Clift et al., 1998); (2) inferences aboutthe consequences of the subduction of the large, aseis-mic Louisville Ridge (e.g., Dupont and Herzer, 1985;Lonsdale, 1986; Ballance et al., 1989; Pelletier andDupont, 1990); and (3) interpretations of the structuralconsequences of the change in relative plate motion atthe northern end of the Tonga Trench (e.g., Hawkinsand Natland, 1975; Wright, 1992; Millen and Ham-burger, 1998). The maps presented here build on thesetypes of studies, and provide the most complete bathy-metric data to date for most of the landward slopes ofthe trench.
Most of the bathymetric data presented in this mapseries were collected during Boomerang Leg 8 aboard
490
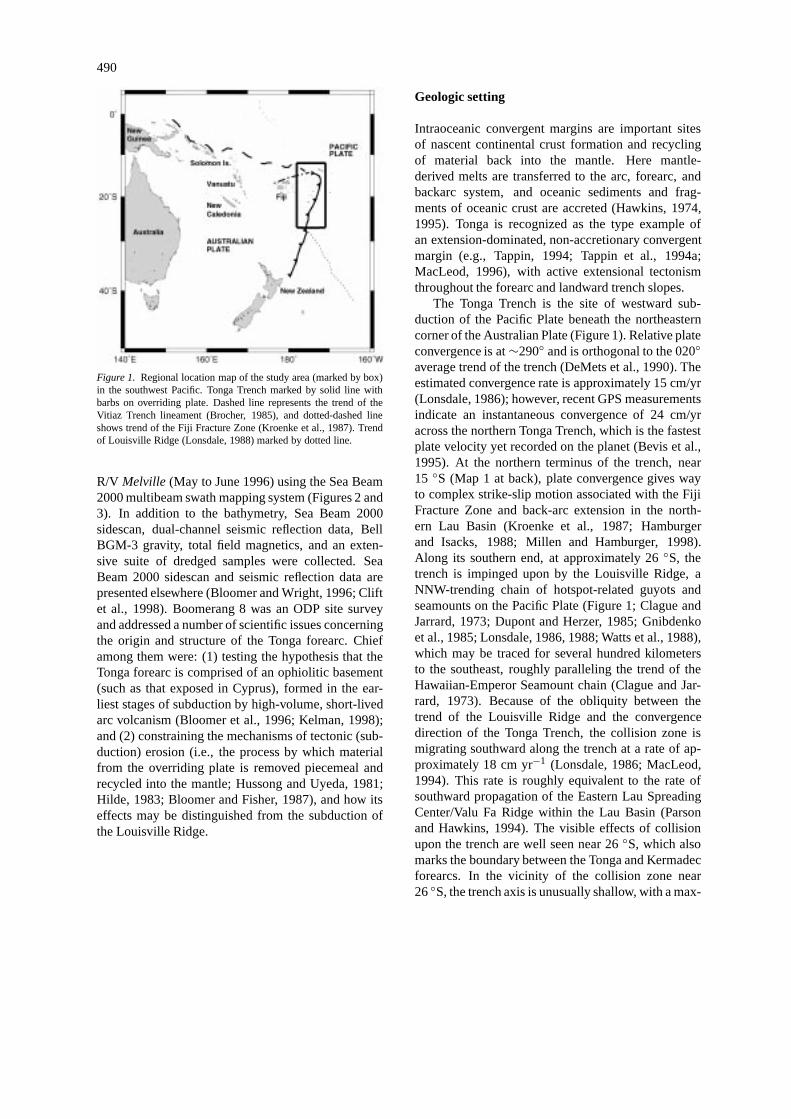
Figure 1. Regional location map of the study area (marked by box)in the southwest Pacific. Tonga Trench marked by solid line withbarbs on overriding plate. Dashed line represents the trend of theVitiaz Trench lineament (Brocher, 1985), and dotted-dashed lineshows trend of the Fiji Fracture Zone (Kroenke et al., 1987). Trendof Louisville Ridge (Lonsdale, 1988) marked by dotted line.
R/V Melville (May to June 1996) using the Sea Beam2000 multibeam swath mapping system (Figures 2 and3). In addition to the bathymetry, Sea Beam 2000sidescan, dual-channel seismic reflection data, BellBGM-3 gravity, total field magnetics, and an exten-sive suite of dredged samples were collected. SeaBeam 2000 sidescan and seismic reflection data arepresented elsewhere (Bloomer and Wright, 1996; Cliftet al., 1998). Boomerang 8 was an ODP site surveyand addressed a number of scientific issues concerningthe origin and structure of the Tonga forearc. Chiefamong them were: (1) testing the hypothesis that theTonga forearc is comprised of an ophiolitic basement(such as that exposed in Cyprus), formed in the ear-liest stages of subduction by high-volume, short-livedarc volcanism (Bloomer et al., 1996; Kelman, 1998);and (2) constraining the mechanisms of tectonic (sub-duction) erosion (i.e., the process by which materialfrom the overriding plate is removed piecemeal andrecycled into the mantle; Hussong and Uyeda, 1981;Hilde, 1983; Bloomer and Fisher, 1987), and how itseffects may be distinguished from the subduction ofthe Louisville Ridge.
Geologic setting
Intraoceanic convergent margins are important sitesof nascent continental crust formation and recyclingof material back into the mantle. Here mantle-derived melts are transferred to the arc, forearc, andbackarc system, and oceanic sediments and frag-ments of oceanic crust are accreted (Hawkins, 1974,1995). Tonga is recognized as the type example ofan extension-dominated, non-accretionary convergentmargin (e.g., Tappin, 1994; Tappin et al., 1994a;MacLeod, 1996), with active extensional tectonismthroughout the forearc and landward trench slopes.
The Tonga Trench is the site of westward sub-duction of the Pacific Plate beneath the northeasterncorner of the Australian Plate (Figure 1). Relative plateconvergence is at∼290◦ and is orthogonal to the 020◦average trend of the trench (DeMets et al., 1990). Theestimated convergence rate is approximately 15 cm/yr(Lonsdale, 1986); however, recent GPS measurementsindicate an instantaneous convergence of 24 cm/yracross the northern Tonga Trench, which is the fastestplate velocity yet recorded on the planet (Bevis et al.,1995). At the northern terminus of the trench, near15 ◦S (Map 1 at back), plate convergence gives wayto complex strike-slip motion associated with the FijiFracture Zone and back-arc extension in the north-ern Lau Basin (Kroenke et al., 1987; Hamburgerand Isacks, 1988; Millen and Hamburger, 1998).Along its southern end, at approximately 26◦S, thetrench is impinged upon by the Louisville Ridge, aNNW-trending chain of hotspot-related guyots andseamounts on the Pacific Plate (Figure 1; Clague andJarrard, 1973; Dupont and Herzer, 1985; Gnibdenkoet al., 1985; Lonsdale, 1986, 1988; Watts et al., 1988),which may be traced for several hundred kilometersto the southeast, roughly paralleling the trend of theHawaiian-Emperor Seamount chain (Clague and Jar-rard, 1973). Because of the obliquity between thetrend of the Louisville Ridge and the convergencedirection of the Tonga Trench, the collision zone ismigrating southward along the trench at a rate of ap-proximately 18 cm yr−1 (Lonsdale, 1986; MacLeod,1994). This rate is roughly equivalent to the rate ofsouthward propagation of the Eastern Lau SpreadingCenter/Valu Fa Ridge within the Lau Basin (Parsonand Hawkins, 1994). The visible effects of collisionupon the trench are well seen near 26◦S, which alsomarks the boundary between the Tonga and Kermadecforearcs. In the vicinity of the collision zone near26◦S, the trench axis is unusually shallow, with a max-

491
imum depth of less than 6000 m (Dupont and Herzer,1985; Pontoise et al., 1986; Map 4 at back). To thenorth, the post-collisional trench axis is deeper and theinner trench slope is much narrower and far steeper(with slopes of 3–10◦ at 6000–9000 m depth; Maps3 and 4 at back) than in the trench to the south ofthe intersection, where slopes average 1–2◦ and themaximum depth of the trench axis is typically 8000 m(Lonsdale, 1986). The axis of the Tonga Trench is off-set roughly 50 km to the northwest, relative to the axisof the Kermadec Trench (Figure 1). That offset hasbeen attributed to erosion of the Tonga forearc inducedby the subduction of the Louisville Ridge (Pelletierand Dupont, 1990).
Active arc volcanism is occurring along the Tofuavolcanic arc (TVA), located on the western edge ofthe shallow forearc platform of the Tonga Ridge (Fig-ures 2 and 3). The Tonga Ridge is part of a remnant arccomplex, split in the late Miocene to form the activeLau backarc basin (Karig, 1970; Parson et al., 1992;Figures 2 and 3). The very broad, shallow form of theTonga Ridge is very different from the western partof the Kermadec forearc (Pelletier and Dupont, 1990).The uplift of this platform has been attributed to theeffect of the southward propagating subduction of theLouisville Ridge (Pelletier and Dupont, 1990), but itcould also be a consequence of the original geometryof remnant arc rifting (Hawkins et al., 1984). The otherhalf of the remnant arc, the Lau Ridge, forms the west-ern margin of the actively-spreading Lau Basin. TheLau Basin has a triangular shape as a consequence ofthe clockwise rotation of the Tonga Ridge as the basinopened (MacLeod et al., 1992, 1994; Sager et al.,1994; Olbertz et al., 1997).
The Tonga forearc lies between the TVA and thetrench, including the Tonga platform, and comprisesbasement that appears to be wholly Eocene or youngerin age (Bloomer et al., 1994). This volcanic base-ment is overlain by a sedimentary sequence comprisedmainly of volcaniclastic sediments laid down during atleast three episodes of arc volcanism (Hawkins et al.,1994). The still-active TVA represents the most recentepisode. The forearc from 14◦S to 26◦S may be sub-divided latitudinally into three major blocks, basedon morphology, structure, and sediment geometry(Tappin, 1994):1. the northern block (north of∼18◦30′S; Maps 1 and
2 at back) lies in the deepest water, and includessmall islands formed by TVA volcanoes that pene-trate a relatively thin sedimentary section with no
preferential regional dip;
2. the central block (∼18◦30′ to 22 ◦S; Maps 2 and3 at back) is composed of numerous small islandswith a sedimentary section dipping mainly towardsthe east, and the TVA lying on the western marginof this part of the forearc; and
3. the southern block (∼22◦ to 26 ◦S; Maps 3 and 4at back) is entirely submarine with shallow waterdepths, a sedimentary section dipping westwardtowards the Lau Basin, and the TVA against thewestern margin of the forearc.
GPS-derived plate convergence vectors betweenthe Tonga platform and the Pacific plate suggest thatthe forearc is rapidly rotating clockwise at a rate of∼7◦ Myr−1 (Bevis et al., 1995). This is in accordwith paleomagnetic data from ODP sites on the Tongaforearc and from field studies on the islands, indicat-ing 20◦ of clockwise rotation since the late Miocene(MacLeod et al., 1992; Sager et al., 1994).
Data acquisition
The Sea Beam 2000 bathymetric mapping systemoperates at 12 kHz with 121 across-track beams (com-pared to 16 for Sea Beam), yielding a swath roughly3.46 times the water depth (Miller and Capell, 1993).The beams are automatically adjusted to be equidistanthorizontally. The data were logged into time seriesand archived into files containing 24 hours worth ofdata. Files were then run through scripts that mergedthem with 24-hour P-code Global Positioning Sys-tem (GPS) navigation. Track charts and speed/courseconsistency used in the Eotvos corrections for gravityanomaly calculations showed the P-code navigation tobe significantly better than S-code. GPS data aboardtheMelville were collected with PCODE and Trimble4000AX receivers. Any navigational errors resultingfrom a temporary malfunction of the PCODE GPSwere replaced with fixes from the Trimble 4000AX.For the majority of the 36-day cruise the PCODE re-ceiver performed flawlessly, with no editing of thenavigation needed.
Sound velocity profiles were taken every 2.5 daysduring the cruise, for a total of fourteen. Expendablebathythermographs (XBTs) deployed every few daysverified that the profiles remained within acceptablelimits. Very small spatial variations in sound speed

492
matched well with those in the temporal domain, sothe profiles that were used to calculate depths were notaltered.
It should be noted that the tracklines of Boomerang8 were not planned exclusively for a mapping program(Figures 2 and 3). The dredging and seismic programsof Boomerang 8 were also extremely important, asthey were essential for understanding the origin, com-position, and structure of the Tonga forearc. On thebasis of beam coverage alone it would have been moreefficient to run our survey lines, for the most part,parallel to the axis of the forearc and trench, witha few perpendicular lines across major off-axis fea-tures such as the Capricorn seamount. But given theimportance of the other programs, the mixture of per-pendicular and parallel tracks was the best choice, stillproviding nearly complete coverage of the outer fore-arc and the north- and southeast limbs of the King’sTriple Junction at 174◦W (Figure 2). The Boomerang8 Sea Beam 2000 data combined with Sea Beam2000 data from Westward Legs 5, 6, and 12 (Smithet al., 1998), provide complete coverage of Capricornseamount and one swath on the Pacific plate parallelto the trench axis (Figures 2 and 3; Table 1). The in-clusion of Sea Beam data from Marathon 6 (Lonsdale,1986; Table 1), consisting of one swath running downthe trench axis throughout the study area, the R/VSonne cruises SO-35, SO-48, and SO-67 (Beiersdorfand von Stackelberg, 1990; von Stackelberg and vonRad, 1990; von Rad et al., 1990; Table 1), and cen-ter beam depths from the R/VJean CharcotcruisesJC-86000211 and JC-87001211 (used to supplementthe multibeam coverage from 23◦–27 ◦S; Table 1),as well as an edited compilation of digitized contoursfrom New Zealand hydrographic charts (New ZealandHydrographic Office, 1997), yields nearly completecoverage for the entire study area.
Data processing
Data processing was accomplished using MB-System(Caress and Chayes, 1996; Caress et al., 1996), andadditional code written by D. Scheirer and the ScrippsInstitution of Oceanography (SIO) Shipboard Com-puter Group. GMT was used for shipboard displayand plotting, as well as for preparation of the finalmap series. Time series of bathymetry data were ini-tially merged with the logged navigation and then runthrough a program that unflagged beams automaticallyflagged as bad by Sea Beam Instruments software. We
found that the software often flagged 8–10% of thegood beams for deletion, particularly in the deep ter-rain of the Tonga Trench. The data were then passedthrough a despiking algorithm that filtered the un-flagged data. Care was taken to remove ping dataacquired at a ship’s speed of less than 4 knots overdredging sites. All data were then edited manuallyusing mbedit, MB-System’s visually interactive, ping-editing tool. This tool allows the user to cycle througheach ping in the data set and remove bad beams thatmay have been missed during the filtering step. Thedata were of high enough quality that we were ableto keep the editing abreast of the data collection rate.The small number of artifacts included the occasional‘curling up’ of outermost beams, ‘loss of bottom’ onvery steep slopes, and spurious depth readings re-sulting from sudden heading changes (greater than10◦/min) in deep terrain during dredging operations.
The final bathymetry grids were constructed bycombining gridded data from all of the individual sur-veys, giving priority to the more recent surveys withSea Beam 2000. Raw, ping-edited Sea Beam 2000 datafiles were readily available while the Sea Beam datafrom R/V Sonnecruises had already been gridded, andtherefore had to be resampled, edited, and regridded.Gridding was based on a Gaussian weighted averagescheme. Each data point’s contribution to a Gaussianweighted average for each nearby grid cell was calcu-lated as the point was read and added to the grid cellsums (Caress and Chayes, 1995). A weighted averagescheme was chosen because in the absence of artifacts,it does the best job of representing the gridded field.Also, the scheme is heavily biased towards those datapoints closest to the grid point and minimizes anom-alous values from outliers (Keeton et al., 1997). Gapsbetween swaths were filled using a thin plate spline(i.e., a common smoothing function; see Sandwell,1987) with a tension of infinity. The size of the in-ternal working grid was increased up to of 0.1 timesthe size of the grid to guide the spline interpolationof data gaps, which may have occurred at the edgesof the grid. The clipping dimension for the spline in-terpolation was increased by varying distances, up to10 times the grid spacing, in order to fill data gaps.For high resolution grids of small areas (thin boxes inFigures 2 and 3), a grid spacing of 200 m was chosenas this matches the footprint of each Sea Beam 2000beam at∼5000–6000 m depth. Larger, regional grids(thick boxes in Figures 2 and 3) were gridded at 500 m.
Detailed bathymetry of the Tonga platform, as dig-itized from New Zealand hydrographic charts (New

493
Figure 2. Index map showing major tectonic features and ship tracks of data used for the northern half of the map series. Tonga Trench markedby thick solid line with barbs on overriding plate, and Fiji Fracture Zone by thick dotted line. Heavy lines= King’s Triple Junction (KTJ;also known as the Mangatolu Triple Junction), axis of nascent spreading center, axis of Tofua volcanic arc (TVA), axis of Tonga Ridge (TR).Also shown are locations of Machias seamount (MS), and Capricorn seamount (CS). Thin solid line= tracks of Boomerang Leg 8; thick solidline at 17◦30′ S= Westward Leg 5; dashed line= Westward Leg 6; dotted-dashed line= Westward Leg 12; thin dotted line= Marathon 6.Thick solid boxes indicate areas of the large regional maps at the back of this issue (made primarily from 500-m Sea Beam and Sea Beam 2000grids). Thin solid boxes indicate areas and figure numbers of the more detailed, higher resolution maps that appear in the manuscript (madefrom 200-m Sea Beam 2000 grids).
Zealand Hydrographic Office, 1997), was block-median filtered before merging with the Sea Beamdata. Additional data editing control over this regionand in certain areas along the trench axis was obtainedby masking selected small areas and interpolating overthem between good data points with a pure spline so-lution. In practice, gaps smaller than 3 km were filled
in. Center-beam depths from theJean Charcotcruisesat 23◦–27◦S were manually edited to remove large ar-tifacts and then block-median filtered before mergingwith Sea Beam data.

494
Figure 3. Index map showing major tectonic features and ship tracks of data used for the southern half of the map series. Tonga Trench markedby thick solid line with barbs on overriding plate. Heavy solid lines= Eastern Lau spreading center (ELSC) within the Lau Basin, axis of Tofuavolcanic arc (TVA), and axis of Tonga Ridge (TR). Heavy dashed line= axis of Louisville Ridge. Thin solid line= tracks of Boomerang Leg8; dashed line= Westward Leg 6; dotted-dashed line= Westward Leg 12; dotted line= Marathon 6. Inset map shows tracks of Marathon 6down the trench axis (heavy line) with cruises of the R/VJean Charcot(dashed lines; see Table 1). Thick solid boxes indicate areas of the largeregional maps at the back of this issue (made primarily from 500-m Sea Beam and Sea Beam 2000 grids). Thin solid boxes indicate areas andfigure numbers of the more detailed, higher resolution maps that appear in the manuscript (made primarily from 200-m Sea Beam 2000 grids).
The maps
The map series consists of four foldout maps at theback of this issue. Each is plotted at a Mercator pro-jection using the WGS 84 spheroid. The scales ofeach map, optimized for the published format size are:Map 1= 1:500,000, Map 2= 1:560,000, Map 3=1:700,000, and Map 4= 1:670,000. The colors foreach of the maps correspond to the same depth inter-val (500 m), and the contour interval is 250 m. Maps1–3 are based on a 500-m gridded data set, whileMap 4 is based on a data set primarily of center-beam
soundings, gridded at 30seconds. Even though we en-deavored to remove all of the bathymetry artifacts, anumber of small ones remain, particularly at the tran-sitions between GPS-navigated Sea Beam 2000 andTransit satellite-navigated Sea Beam surveys (e.g., up-per right corner of Map 2). The quality of navigationof the Sea Beam surveys is variable, with an estimatednavigational accuracy of±250–300 m (Beiersdorf andvon Stackelberg, 1990; Wiedicke and Collier, 1993;Wiedicke and Habler, 1993). Depths shown on allmaps are in corrected meters.

495
Table I. Swath data sources
Cruise Dates Ship Principle Multibeam PI(s)
Objectives System
Boomerang 8 May–June 1996 Melville ODP site survey: Sea Beam 2000 Bloomer,
multibeam, Wright
dredging, seismics
Westward 12 April–May 1995 Melville transit Sea Beam 2000 –
Westward 6 Aug.–Sep. 1994 Melville OBS, seismic, Sea Beam 2000 Hildebrand,
multibeam Dorman
Westward 5 May–June 1994 Melville OBS, multibeam Sea Beam 2000 Bryden
SO-67 Feb. 1990 Sonne multibeam Sea Beam Wiedicke,
Collier, Habler
SO-48 Feb. 1987 Sonne multibeam Sea Beam Riech, von
Stackelberg,
von Rad
SO-35 Dec. 1984– Sonne multibeam Sea Beam von
Jan 1985 Stackelberg,
von Rad
Marathon 6 Aug.–Sep. 1984 Thomas multibeam, Sea Beam Lonsdale
Washington seismics
JC-87001211 Mar.–Apr. 1987 Jean bathy, magnetics, Sea Beam (only center –
Charcot gravity beam depths available)
JC-86000211 Jan. 1986 Jean bathy, magnetics, Sea Beam (only enter –
Charcot gravity beam depths available)
Discussion of bathymetric features
Here we simply summarize the primary morpholog-ical features that can be seen in the maps, startingfrom the northwest corner of the study area, mov-ing east around the ‘corner’ of the Tonga Trench andthen south. More detailed geological interpretationand analysis of these data will be presented elsewhere,in conjunction with seismic, sidescan, and geochem-ical data. Figure 4 shows the location of a series ofprofiles generated from Sea Beam 2000 center beamdepths and projected perpendicular to the trend of thetrench and forearc. The profiles were selected both toshow a regional overview of the trench and forearc,where the best Sea Beam 2000 data were available,and to be representative of the typical morphology ofan extension-dominated convergent margin. Profiles1–18 (Figures 4 and 5) cover the northern terminusof the trench, the axis of seafloor-spreading in thenortheast limb of the King’s Triple Junction, and thenorthern forearc block. Profiles 19–23 are representa-tive of the central forearc block, and profiles 24–30 arefrom the southern forearc block (Figures 4 and 6).
A primary hypothesis guiding the discussion ofbathymetric features is that vigorous tectonic erosionof the Tonga forearc is occurring at the present time(based on results from ODP Leg 135; MacLeod, 1994;Clift and MacLeod, 1999). It is also thought thaterosion may be occurring by a combination of twodistinct mechanisms: (1) a spatially restricted processresulting from subduction of the Louisville Ridge,and (2) a quasi-steady-state ‘background’ mechanismoccurring everywhere along the trench and forearc.While bathymetry can provide surficial evidence oftectonic erosion, insights into the mechanisms andcauses of the process require drilling, in order to inves-tigate the magnitude and timing of subsidence acrossthe forearc, as well as the detailed structure of theforearc basement.
Regional features
The four maps clearly show the broad, shallow Tongaplatform at the east end of the forearc. Broad, isolatedhighs that are extensions of this uplifted, old, arc base-ment can be found as far north as 15◦30′ S, thoughthe expression of the Platform is greatly subdued north

496
Figure 4. Index map of selected bathymetric profiles across the Tonga Trench and forearc.

497
Figure 5. Bathymetric profiles across the northern Tonga Trench and forearc. Profiles are from the center beam of Sea Beam 2000 swaths andhave been projected normal to the trench axis. Dashed line shows location of trench axis, and small numbers at bottom of each profile denotemaximum depths in kilometers.

498
Figure 6. Bathymetric profiles across the central and southern Tonga Trench and forearc. Profiles are from the center beam of Sea Beam 2000swaths and have been projected normal to the trench axis. Dashed line shows location of trench axis, and small numbers at bottom of eachprofile denote maximum depths in kilometers.

499
of 18◦30′ S. The forearc deepens dramatically off theeastern edge of the platform, and generally has verysteep, narrow landward slopes.
All of the maps show evidence of irregular highsalong the trench-slope break and in the mid- andlower-trench slopes. These blocks are commonlyasymmetric and all of them that were sampled yieldedaltered volcanic basement and volcaniclastic sedi-ments (Bloomer et al., 1996). These highs appear tobe structural blocks, bounded by normal faults, and arenot cored by serpentinites as are many of the trench-slope highs in the Izu-Mariana-Bonin trench (e.g.,Fryer et al., 1985, 1990). The maps identify majorcanyons that provide pathways for material to be trans-ported from the central and eastern Tonga Platform tothe trench axis and mid- to lower-slope basins.
The maps show consistent changes in the morphol-ogy of the forearc and trench as convergence changesfrom highly oblique to normal in the north and as thetime since collision of the trench with the LouisvilleRidge increases. We look briefly at some of thosechanges in the next four sections.
Map 1: A strike-slip boundary and the termination ofthe Trench
Map 1 (at back) includes the most tectonically com-plex terrain of the entire study area, including thetransition from subduction to strike-slip motion, andthe north- and southeast limbs of the King’s TripleJunction (also known as the Mangatolu Triple Junc-tion; Hawkins, 1986; Hawkins et al., 1994; Tayloret al., 1996). The northernmost edifices of the TVA(14◦57′ S, 173◦27′ W) extend to within 40 km of thetrench axis. Volcanic cross-chains in the active arccan be identified at 15◦05′ S, 174◦40′ W; 15◦20′ S,173◦40′ W; and 16◦20′ S, 173◦50′ W.
Figure 7 shows a map view of a nascent spreadingcenter, featuring a series of parallel, closely-spacedridges and troughs, a morphology reminiscent of thatobserved at slow-spreading ridges. The spreading cen-ter can be clearly identified to within about 30 kmof the trench axis, and may extend farther norththan that. Its juncture with the trench presumablyforms a ridge-transform-transform boundary betweenthe Tonga forearc, the Pacific plate, and the Aus-tralian plate. Almost directly to the south of thisfabric lies a 10-km wide caldera with a significantbreach on its southern rim. The caldera lies slightlywest of the main line of TVA volcanoes. Dredgesfrom the caldera yielded dacite lavas, which may de-
rive from both the adjacent TVA and the back-arcspreading center (Bloomer and Wright, 1996). Thespreading fabric and the caldera probably result fromcoupling between the crust of the Tonga microplateand the tearing, subducting Pacific plate, accompaniedby lateral southward flow of asthenospheric mantle(MacLeod, 1996). This is supported by the geochem-istry of lavas from northern Tonga (Falloon et al.,submitted). The spreading fabric lies roughly paral-lel and to the east of the northeastern limb of theKing’s Triple Junction, a back-arc ridge-ridge-ridgetriple junction that is developing within rifted arc crust(Figure 2). The core of the King’s Triple Junction islocated at approximately 15◦37′ S, 174◦52′ W, and ischaracterized by intense deformation and neovolcan-ism (Parson and Tiffin, 1993). The Boomerang 8 SeaBeam 2000 survey covered its northeast limb, cen-tered at∼174◦00′ W and trending NE at∼025◦ fora distance of∼50 km (Map 1 at back), as well asits lengthiest limb, extending over 200 km south from15◦37′ S to 17◦40′ S (Maps 1 and 2 at back). Futuregeochemical analyses will be required to determinewhat, if any, connection exists between the northeast-ern limb of the King’s Triple Junction and the nascentspreading center that parallels it.
To the west of the nascent spreading center (Fig-ure 8, Map 1), the trench shoals rapidly and the south-ern slope lacks any obvious lineations. The southernslope is very steep, and has large mid- and upper-slope highs (Profiles 1 and 2). This region likely linksthe Tonga Trench to the seismically defined Fiji Frac-ture Zone (Millen and Hamburger, 1998), but thenature or precise location of this plate boundary isnot at all clear. Seismicity distributions (e.g., Ham-burger and Isacks, 1988) require that the boundary bea broad (∼100 km) transfer zone, rather than a simpletransform fault.
Part of Profile 1 is located along the axis of thenascent spreading center. To the southeast, the trenchaxis becomes broad and relatively flat (Figure 5; Pro-files 4–9), with more symmetrical landward and sea-ward slopes, as first noted by Raitt et al. (1955). Thisportion of the trench (from about 14◦40′ S, 173◦30′Wto 15◦10′ S, 172◦30′ S) marks a zone either of strike-slip motion between the forearc and the Pacific Plate,based upon an inferred convergence direction of about110◦ (Pelletier and Louat, 1989), or oblique slip asinferred by Millen and Hamburger (1998).
The tearing of the Pacific plate at the northernterminus of the Tonga Trench (Figure 8) was first pro-posed by Isacks et al. (1968), with solid supporting

500
Figure 7. Histogram equalized, shaded relief bathymetric map, created from a 200-m Sea Beam 2000 grid (Boomerang 8), of a smallridge-transform-transform boundary to the west of the Tonga Trench. The bathymetry is illuminated at an azimuth of 90◦ using a shadingmagnitude of 0.4 to accentuate the spreading fabric of the ridge centered at 174◦W, as well as a back-arc caldera at∼15◦25′ S, 174◦W. Colorchange interval based on histogram equalization. Map projection is Mercator.

501
Figure 8. Histogram equalized, shaded relief bathymetric map of the northern forearc and westward bend in the Tonga Trench, created froma 200-m Sea Beam 2000 grid (Boomerang 8). Summit of Machias seamount denoted by star. The bathymetry is illuminated at an azimuth of0◦ using a shading magnitude of 0.4 to accentuate the abyssal hill fabric at the bend in the trench. Color change interval based on histogramequalization. Map projection is Mercator.

502
evidence provided by Billington (1980), and recentconfirmation supplied by the earthquake distributionsand source mechanism determinations of Millen andHamburger (1998). A possible bathymetric expressionof the plate tearing is evident at 15◦–16 ◦S wherethe landward trench slope steepens significantly, theforearc narrows, and the trench axis is ‘pinched’ bythe presence of Machias seamount (Profiles 5–11,Figure 5). Also striking are the WNW-trending lin-eaments on portions of the Pacific Plate shown inFigure 8. These can be traced at least as far southas 15◦20′ W, southwest of Machias seamount. Theselineations, first described in detail by Hill and Tiffin(1993) from GLORIA and SeaMARC II data, havebeen interpreted as hinge faults, exhibiting a com-bination of normal and shear motion (Isacks et al.,1969; Wright, 1992; Millen and Hamburger, 1998).However, between 14◦50′ and 15◦30′ S the lineationssystematically trend 280◦–285◦, even as the trenchaxis changes trend by∼60◦. In this region where thePacific Plate is subducting and the bending hinge isat a high angle to the lineations, the apparent throwof these features does not increase towards the trench.This evidence suggests that these features are relatedto abyssal hill topography on the plate. The WNWtrend of these lineations is consistent with recent worksuggesting that the seafloor east of the Tonga Trenchpreserves a fabric formed at a roughly east-west trend-ing spreading center (e.g., Castillo and Hawkins,1998). We therefore interpret these lineations to beolder Pacific Plate structures that have been reactivatedby hinge-faulting at the bend in the trench.
The strike-slip portion of the trench terminatesnear 15◦10′ S, where it truncates the mid- and lowerslopes of the trench. South of this point, the trenchnarrows, becomes asymmetrical with a steeper land-ward slope, and convergence rapidly becomes nearnormal to the trench axis as the trench assumes amore north-south azimuth (Profiles 12–15, Figure 5).There are large, elongate highs on the western trench-slope break, inferred to be bounded by normal faults(Map 1), and some evidence of trenchward tilting offault blocks (Profiles 13–15; Figure 5). There are alsobroad canyons in the landward trench slope (for exam-ple at 16◦35′ S, 16◦50′ S) facilitating the mass wastingof material into the trench (Clift et al., 1998).
Map 2: Normal convergence and seamount collision
Map 2 shows a section of the forearc that is proba-bly typical of the ‘equilibrium’ profile of the trench.
As the Louisville Ridge collision passed through thisregion from 5.5 to about 3.3 Ma, the morphology ofthe trench here presumably represents that typical oftectonic erosion. A new seamount collision is just de-veloping as Capricorn seamount (Raitt et al., 1955)enters the trench. The trench shoals west of Capri-corn (Figure 9), and there is evidence that some smallblocks may have been transferred from the subductingplate to the upper plate (as at 18◦38′ S, 172◦47′ W).Lonsdale (1986) and Clift et al. (1998) have suggestedthat a small accretionary prism exists west of Capri-corn, in contrast to the tectonic erosion that dominatesmost of the trench.
The trench axis here comprises a series of en ech-elon basins, developed as grabens in the subductingplate enter the trench. Locally, what is morphologi-cally the trench axis is structurally the axis of a grabenin the Pacific Plate, and the plate boundary is actuallywithin the landward slope (Hilde, 1983; Bloomer andFisher, 1985; Lonsdale, 1986). Sediment is clearlynot transported great distances longitudinally in thetrench, and the graben serve to trap and then subductclastic material moving down the trench slopes.
One of the most obvious features of the forearchere is the network of canyons and channels cut-ting the upper and middle slopes (as at 18◦30′ S,18◦57′ S, 19◦30′ S, 20◦10′ S). These move mater-ial from the eastern parts of the Tonga Platform tolarge mid-slope basins such as those centered at 19◦S,173◦25′ W. There are also smaller canyons (e.g.,18◦38′ S, 172◦47′ W, Figure 9) that move material tothe lower slopes and trench, but it appears that mostclastic material is trapped in mid-slope basins. Oneof the largest of these canyons (at 18◦30′ S) extendsacross the northern end of the Tonga Platform to theTofua Arc, providing a path for volcaniclastics fromthe modern arc to be redeposited on the trench slopes.The prominent linear form of some of these canyons(as at 18◦57′ S) suggests that they may have exploitedfaults that cut the forearc at high angles to the trench.Such faults may have developed in response to upliftand fracturing of the forearc during subduction of theLouisville Ridge.
The landward trench slopes in this area are steep,with prominent structural highs in the middle andlower landward slopes (Figures 5 and 6, Profiles 16–23). These structural highs are easily identifiable inMap 2, and commonly define the trench slope breakat about 4000 m water depth. Similar structural blocksare common in the outer forearc, and everywhere thatthey were sampled (generally on their steepest flanks)

503
Figure 9. Bathymetric map (200-m contour interval) of the Tonga Trench and forearc, in the vicinity of Capricorn seamount (denoted by star).Shading indicates areas deeper than 7000 m. Note the distinct submarine canyon to the west of the trench at∼19 ◦S. Map was created froma 200-m Sea Beam 2000 grid (Boomerang 8), with portions of the trench axis filled in by Sea Beam data from Marathon 6. Map projection isMercator.
the exposures comprise altered arc volcanic rocks andvolcaniclastic sediments. Unlike the trench slope highsin the Izu-Mariana-Bonin system, most of which areserpentine diapirs (e.g., Fryer et al., 1985, 1990),the highs within the Tonga forearc appear to be faultblocks. Their shape in plan view is often irregular(Figure 9), which is not what would be expected offault-bounded blocks, unless the faults are extremelylow angle. However, there are some blocks that areasymmetrical (bounded by at least one steep, trench-parallel slope as at 20◦S, 173◦30′ W and 18◦23′ S,172◦50′W), and thus appear to be fault-bounded. Andthere are some that retain a blocky form, bounded
by trench-parallel slopes, but appear to have beenpartly dissected by canyons and channels (e.g., thelarge block from 19◦15′ S, 173◦15′ W to 19◦30′ S,173◦20′ W). We suggest that most of the irregularlyshaped highs along the slope break are fault-boundedblocks that have been dissected and degraded by ero-sion. The dredging results (Bloomer et al., 1996), inany case, found no evidence of serpentine diapirismas a contributing factor in the formation of these slopehighs.

504
Map 3: Post-Louisville ridge collision geometry
Map 3 (at back) shows the widest cross-section ofthe arc and forearc (∼90–100 km) from the East LauSpreading Center in the west across the trench to thePacific Plate. This area is just north of a large west-ward embayment in the forearc that has been attributedto collapse of the forearc in response to the subductionof the Louisville Ridge (Lonsdale, 1986; Pelletier andDupont, 1990). Map 3 shows the northern edge of thisembayment, presumably marking the point at whichthe forearc has re-equilibrated itself and re-establishedits critical taper, slightly more than 2 Ma after thepassage of the Louisville Ridge.
In fact, this area shares many morphologic fea-tures in common with that in Map 2, which is alsoinferred to represent an ‘equilibrium’ profile for theforearc. The portion of the trench shown in Map 3is somewhat deeper than to the north, but also hasvery steep lower slopes (in places> 10◦ at depths>7000 m) and prominent structural highs on the mid-slopes and trench slope break. The trench axis againshows an en echelon structure, reflecting the subduc-tion of the horsts and grabens of the offshore plate.Large canyons cut the forearc (Map 3, as at 22◦30′ S,21◦55′ S, and 21◦40′ S). The structural highs along theslope break, here at about 5000 m, are more clearlyasymmetric with steep, trench-parallel eastern sides(Figure 10, for example at 21◦50′ S, 174◦10′ W and22◦25′ S, 174◦10′ W), consistent with an origin asblocks bounded by normal faults. Dredges from someof these highs also yield altered volcanic rocks andvolcaniclastic sediments. The less ‘degraded’ appear-ance of these blocks may be because they are younger,having developed after the more recent passage of theLouisville Ridge is this part of the trench.
Map 4: Horizon deep and Louisville Ridge collisionzone
Map 4 shows the portion of the forearc most recentlyaffected by the collision of the Louisville Ridge withthe Tonga forearc. The current collision is occurringat 25◦44′ S. The westward re-entrant in the trenchbeginning at 24◦30′ S and extending northwards past24◦30′ S has been interpreted as an area where theforearc has collapsed and been eroded in the wakeof the Louisville Ridge’s passage (Lonsdale, 1986;Pelletier and Dupont, 1990; MacLeod and Lothian,1996). The forearc was likely oversteepened as theLouisville Ridge was subducted and subsequently col-lapsed (Lonsdale, 1986; Pelletier and Dupont, 1990).
When the forearc re-established its critical taper, it isalso likely that the erosion of the margin left the 50–80 km arcward shift of the trench axis relative to thepre-collision geometry (Figures 1; 3).
The deep re-entrant centered near 23◦15′ S has adistinctly different geometry than the forearc to thenorth. The trench axis is more continuous, and deeperthan to the north, because the westward retreat ofthe forearc has exposed a deeper part of the bendingPacific Plate (Map 4). The mean gradient of the sea-ward slope here is greater (Lonsdale, 1986) becausethe dip of the Pacific Plate increases with depth to anaverage of 15◦ (Billington, 1980). Although the up-per slopes of the landward plate are steep, the overallgradient of the landward slope is gentler and morecontinuous than to the north (Figure 11; Figure 6,Profiles 27–29). The landward slope lacks the fault-bounded structural highs characteristic of the forearcto the north, and does not have a well-defined trench-slope break. While there are some small canyons andchannels in the forearc, there are few of the verylarge canyons common in the forearc north of 23◦S.These morphologic differences are consistent with thehypothesis that this part of the forearc has recently col-lapsed and undergone substantial erosion at its base,after oversteepening by subduction of the LouisvilleRidge. The collapse is recent enough that the largecanyons and clearly defined normal faults that are partof the ‘steady-state’ subduction erosion geometry havenot yet developed.
This re-entrant includesthe deepest spot in theentire southern hemisphere, Horizon Deep, centeredat about 23◦15′ S in the trench axis. Fisher (1954)reported a bomb sounding from Horizon Deep of10,633 m± 27 m, corrected. The maximum depthin the deep has been estimated to be at least 10,800± 2 m, corrected, based on the interpretation of per-sistent flank echos in 12-kHz echo-sounder profiles(Fisher, 1954, 1974). Lonsdale (1986) reported a depthof 10,866 m, corrected, from Horizon Deep (assuminga sound velocity of 1500 m/s), confirming the esti-mate of Fisher (1954). The error on the 10,866 mdepth must be greater than± 55 m, based on the0.5% accuracy assumed for Sea Beam center-beamdepths in optimal conditions. The deepest, corrected,center-beam sounding on Sea Beam 2000 swaths dur-ing Boomerang 8 was 10,577 m at 23◦13.60′ S,174◦43.54′ W, which is∼1.5 km north of Lonsdale’s(1986) sounding and∼3 km north of Fisher’s (1974)profiles. This depth was corrected based also on asound velocity of 1500 m s−1 from an XBT cast made

505
Fig
ure
10.B
athy
met
ricm
ap(2
00-m
cont
our
inte
rval
)of
the
Tong
aT
renc
han
dfo
rear
c,ce
nter
edat
22◦ S
,as
wel
las
apo
rtio
nof
the
Pac
ific
plat
e.S
hadi
ngin
dica
tes
area
sde
eper
than
7000
m.
Map
was
crea
ted
from
a20
0-m
Sea
Bea
m20
00gr
id(B
oom
eran
g8
and
Wes
twar
d12
).M
appr
ojec
tion
isM
erca
tor.

506
Figure 11. Bathymetric map (200-m contour interval) of the Tonga Trench in the vicinity of Horizon Deep (denoted by the star), deepest spotin the Southern Hemisphere. ODP Site 841 denoted by the circle. Shading indicates areas deeper than 7000 m. Map was created from a 200-mSea Beam 2000 grid (Boomerang 8). Map projection is Mercator.
the day of the survey; the error on the sounding mustagain be greater than± 55 m.
Collision and subduction of the Louisville Ridgeat 26 ◦S has had a significant effect on the mor-phology of the forearc (cf., Gnibdenko et al., 1985;Lonsdale, 1986; Ballance et al, 1989; Pelletier andDupont, 1990; MacLeod, 1994). The forearc has beenuplifted and oversteepened with a substantial amountof normal faulting (e.g., Profile 30 in Figure 6 and Fig-ure 12 particularly at∼26◦S, 175◦55′W and 25◦50′ S,175◦30′ W). Both trench parallel faults and faults at ahigh-angle to the trench (as marked by slopes or chan-nels like that at 25◦50′ S, 176◦20′ W) are common.
The trench shoals as the seamounts of the LouisvilleRidge are subducted, and there is morphologic andcompositional evidence for the transfer of Cretaceousseamount material to the landward slopes of the trench(Map 4, small high at 25◦45′ S, 175◦18′ W; Balanceet al., 1989). This deformation of the forearc due toseamount subduction is distinct from the background,‘steady-state’ erosion, which is characterized by large-scale subsidence of the entire forearc and a gradualregional tilt towards the trench axis (MacLeod, 1994;Clift and MacLeod, 1999).

507
Fig
ure
12.B
athy
met
ricm
ap(1
00-m
cont
our
inte
rval
)of
the
Tong
afo
rear
c,ce
nter
edat
26◦ S
,jus
tnor
thof
the
Lou
isvi
lleR
idge
colli
sion
with
the
tren
ch.
Sha
ding
indi
cate
sar
eas
deep
erth
an70
00m
.Map
was
crea
ted
from
a20
0-m
Sea
Bea
m20
00gr
id(B
oom
eran
g8)
.Map
proj
ectio
nis
Mer
cato
r.

508
Conclusion
This new compilation of bathymetry documentschanges in the morphologic characteristics of theTonga Trench and forearc in response to changes inplate convergence directions and to the subduction ofthe seamounts of the Louisville Ridge. The TongaTrench and forearc are dominated by abundant normalfaulting, and typically have numerous canyons thatallow substantial volumes of material to move fromthe Tonga platform to middle and lower slope basins.The central forearc, which is inferred to be under-going ‘steady-state’ subduction erosion, is dominatedthe most by these features, as evidenced by the manylarge, trench-parallel scarps, most of which must haveaccommodated large-scale subsidence of the forearcand a gradual, regional tilt of fault blocks toward thetrench axis. The southern forearc and trench showa different morphology and are strongly influencedby a spatially restricted and accelerated process oferosion resulting from the recent subduction of theLouisville Ridge. The causes and relative contribu-tions of these two modes of tectonic erosion can bestbe determined in concert with drilling. Such drillingcould constrain the timing of forearc subsidence fromthe litho- and biostratigraphy of the upper Eocene toRecent sediments overlying the basement (e.g., Clift,1994). Borehole data could also help determine thetiming and orientation of tectonic tilting of the forearcvia sedimentary bedding attitudes in cores, and on For-mation MicroScanner borehole logging images (e.g.,MacLeod et al., 1992); and could be combined withseismostratigraphic models of the forearc platform(e.g., Tappin, 1994).
The process of tectonic erosion is still poorly un-derstood, not least because it involves absence ofthe evidence, and is therefore difficult to document.Nevertheless, it is of vital importance as an impor-tant mechanism for delivering terrestrial material intothe mantle (at a rate estimated to be comparable tothe flux of juvenile igneous material returned to theEarth’s crust; von Huene and Scholl, 1991). Severalstudies have shown that massive subsidence of fore-arcs is a fundamental consequence of tectonic erosion(e.g., in Japan and Chile: von Huene et al., 1988; vonHuene and Culotta, 1989; von Huene and Lallemand,1990). For Tonga, too, wholesale foundering of theforearc has occurred, with at least 5.4 km of subsi-dence recorded since the late Eocene at Site 841 (Clift,1994). Clift and MacLeod (1999) have estimated that
approximately 135 km of material has been erodedfrom the Tonga forearc since the Eocene.
Acknowledgements
This research was supported by NSF grants OCE-9521023 and OCE-9521039. We wish to thank allthe scientists, officers, and crew who participated inall the cruises mentioned. We are particularly grate-ful to Captain Al Arsenault, the officers and crew ofthe R/VMelville, the SIO Shipboard Computer group,and the intrepid watchstanders of Boomerang 8. Spe-cial thanks to Stu Smith for the enormous processingeffort and support at sea. We are grateful to Uta Al-bright Peckman of Scripps and Kirsten Zellmer ofthe University of Hawai’i for help with data transferand documentation, and to David Millen of IndianaUniversity for reviewing a draft of the manuscript.The comments of 3 anonymous reviewers significantlyimproved it.
Appendix
The bathymetry grids from which the large re-gional and detailed page-size maps were cre-ated are available on the World Wide Web athttp://capnhook.geo.orst.edu/tonga/. The grids are bi-nary, Unix-compressed, GMT-style grid files. Alsoavailable are the original postscript files of the maps,color 3-D visualizations of many of the smaller bathy-metric grids, and a version of this manuscript with allfigures in color at http://dusk.geo.orst.edu/tonga.
References
Ballance, P.F., Scholl, D.W., Vallier, T.L., Stevenson, A.J., Ryan,H. and Herzer, R.H., 1989, Subduction of a Late CretaceousSeamount of the Louisville Ridge at the Tonga Trench: AModel of Normal and Accelerated Tectonic Erosion,Tectonics8: 953–962.
Beiersdorf, H. and von Stackelberg, U., 1990. Geoscientific Studiesof the Manihiki Plateau and the Lau Basin, Southwestern Pa-cific - SO 67 (in German),Jahresbericht für den FörderbereichMeeresgeowissenschaften, 1990, 67–70.
Bevis, M., Taylor, F.W., Schultz, B.E., Recy, J., Isacks, B.L., Helu,S., Singh, R., Kendrick, E., Stowell, J., Taylor, B. and Calmant,S., 1995, Geodetic Observations of Very Rapid Convergence andBack-arc Extension at the Tonga Arc,Nature374: 249–251.
Billington, S., 1990, The Morphology and Tectonics of the Sub-ducted Lithosphere in the Tonga-Fiji-Kermadec Region fromSeismicity and Focal Mechanism Solutions, Ph.D. Thesis, Cor-nell University, Ithaca, New York.

509
Bloomer, S.H. and Fisher R.L., 1987, Petrology and Geochemistryof Igneous Rocks from the Tonga Trench: Implications for itsStructure.J. Geology95: 469–495.
Bloomer, S.H. and Wright, D.J., 1996,Summary of Site SurveyCruise Results, Boomerang Leg 08, in Support of Proposal451, Ocean Drilling in the Tonga Forearc: Subduction Geody-namics, Arc Evolution, and Deformation Processes at a Non-Accretionary Convergent Margin, Ocean Drilling Program SiteSurvey Data Bank, Palisades, New York.
Bloomer, S.H., Wright, D.J., and Boomerang Leg 8 ShipboardScientific Party, 1996, Geology of the Tonga Forearc: A supra-subduction zone ophiolite,Eos Trans. AGU77: F325.
Bloomer, S.H., Ewart, A., Bryan, W. and Hergt, J., 1994, Geochem-istry and Origin of Igneous Rocks from the Outer Tonga Forearc,in J. Hawkins, Parson, L., Allan, J. et al. (eds)Proc. ODP, Sci.Results, 135, Ocean Drilling Program, College Station, Texas,625–646.
Brocher, T.M., 1985, On the Formation of the Vitiaz Trench Linea-ment and North Fiji Basin, in Brocher, T.M. (ed.),Investigationsof the Northern Melanesian Borderland, Circum-Pacific Coun-cil for Energy and Mineral Resources Earth Science Series 3,Houston, Texas, 13–33.
Caress, D.W. and Chayes, D.N., 1995, New software for process-ing sidescan data from sidescan-capable multibeam sonars,Proc.IEEE Oceans 95 Conference,997–1000.
Caress, D.W. and Chayes, D.N., 1996, Improved processing of hy-drosweep DS multibeam data on the R/VMaurice Ewing, Mar.Geophys. Res.18: 631–650.
Caress, D.W., Spitzak, S.E. and Chayes, D.N., 1996, Software formultibeam sonars,Sea Technol.37: 54–57.
Castillo, P.R. and Hawkins, J.W., 1998, The composition of the sub-ducting oceanic lithosphere mainly responsible for the chemicaland isotopic variations of the Tonga-Kermadec Arc Lavas?Eos,Trans. AGU79: F397.
Clague, D.A. and Jarrard, R.D., 1973, Tertiary plate motion de-duced from the Hawaiian-Emperor seamount chain,Geol. Soc.Am. Bull.84: 1135–1154.
Clift, P.D., 1994, Controls on the sedimentary and subsidence his-tory of an active plate margin: an example from the Tonga Arc,Southwest Pacific, in J. Hawkins, Parson, L., Allan, J. et al. (eds),Proc. ODP, Sci. Results, 135, Ocean Drilling Program, CollegeStation, Texas, 173–188.
Clift, P.D. and MacLeod, C.J., 1999, Slow rates of subduction ero-sion estimated from subsidence and tilting of the Tonga Forearc,Geology27: 411–414.
Clift, P.D., MacLeod, C.J., Tappin, D.R., Wright, D.J. and Bloomer,S.H., 1998, Tectonic controls on sedimentation in the TongaTrench and Forearc, SW Pacific,Geol. Soc. Am. Bull.110:483–496.
Cochran, J.R., Fornari, D.J., Malinverno, A., Wang, X. and Goff,J.A., 1992, Systematic variation of summit and flank morphol-ogy within a ridge segment: East Pacific Rise, 7◦S–9◦S, Eos,Trans. AGU73: 313.
DeMets, C., Gordon, R.G., Argus, D.F. and Stein, S., 1990, Currentplate motions,Geophys. J. Int. 101: 425–478.
Dupont, J. and Herzer, R.H., 1985, Effect of subduction of theLouisville Ridge on the structure and morphology of the TongaArc, in Scholl, D.W. and Vallier, T.L. (eds),Geology andOffshore Resources of Pacific Island arcs-Tonga Region,Circum-Pacific Council for Energy and Resources,Earth Science Series2: 323–332.
Falloon, T., Bloomer, S.H., Crawford, S.H. and Wright, D.J., sub-mitted, Geochemistry of dredged boninite series volcanics from
the Tongan Forearc: implications for the nature of early arcvolcanism,Earth Planet. Sci. Lett.
Fisher, R.L., 1954, On the sounding of trenches,Deep-Sea Res. 2:48–58.
Fisher, R.L., 1974, Pacific-type continental margins, in C.A. Burkand C.L. Drake (eds),The Geology of Continental Margins,Springer-Verlag, New York, 25–41.
Fisher, R.L. and Engel, C.G., 1969, Ultramafic and basaltic rocksdredged from the nearshore flank of the Tonga Trench.Geol. Soc.Amer. Bull. 80: 1373–1378.
Fryer, P., Ambos, E.L. and Hussong, D.M., 1985. Origin and em-placement of Mariana Forearc Seamounts,Geology13: 774–777.
Fryer, P., Pearce, J.A., Stokking, L.B., et al. (eds), 1990,Proc.ODP, Sci. Results, 135, Ocean Drilling Program, College Station,Texas, 1092 pp.
Gnibidenko, H.S., Anosov, G.I., Argentov, V.V. and Pushchin, I.K.,1985, Tectonics of the Tonga-Kermadec trench and OzbournSeamount,Tectonophysics112: 357–383.
Hamburger, M.W. and Isacks, B.L., 1988, Diffuse back-arc forma-tion in the southwestern pacific,Nature332: 599–604.
Hawkins, J.W., 1974, Geology of the Lau Basin, a Marginal SeaBehind the Tonga Arc, in C.A. Burk and C.L. Drake (eds),TheGeology of Continental Margins, Springer-Verlag, New York,505–524.
Hawkins, J.W., 1986, ‘Black smoker’ Vent Chimneys, Lau Basin,Eos, Trans. AGU67: 430–431.
Hawkins, J.W., 1995, Evolution of the Lau Basin–Insights fromODP Leg 135, in B. Taylor and J. Natland (eds),Active Mar-gins and Marginal Basins of the Western Pacific, AmericanGeophysical Union, Washington, D.C., 125–173.
Hawkins, J.W., Bloomer, S.H., Evans, C.A. and Melchior, J.T.,1984, Evolution of intra-oceanic arc-trench systems,Tectono-physics102: 175–205.
Hawkins, J.W. and Natland, J.H., 1975, Nephelinites and basan-ites of the samoan linear volcanic chain: their possible tectonicsignificance,Earth Planet. Sci. Lett. 24: 427–439.
Hawkins, J.W., Parson, L.M. and Allan, J.F., 1994, Introduction tothe scientific results of leg 135: Lau Basin-Tonga Ridge drillingtransect, in J. Hawkins, L. Parson, J. Allan, et al. (eds),Proc.ODP, Sci. Results, 135, Ocean Drilling Program, College Station,Texas, 3–5.
Hilde, T.W.C., 1983, Sediment subduction versus accretion aroundthe Pacific,Tectonophysics99: 381–397.
Hill, P.J. and Tiffin, D.L., 1993, Geology, sediment patterns, andwidespread deformation on the sea floor off western samoarevealed by wide-swath imagery,Geo-Marine Lett.13: 116–125.
Hussong, D. and Uyeda S., 1981, Tectonic Processes and the His-tory of the Mariana Arc: A Synthesis of the Results of Deep SeaDrilling Project Leg 60, in D.M. Hussong, S. Uyeda, et al. (eds),Initial Reports of the Deep Sea Drilling Project, 31, U.S. Govt.Printing Office, Washington D.C., 909–929.
Isacks, B.L., Oliver, J. and Sykes, L.R., 1968, Seismology and thenew global tectonics,J. Geophys. Res. 73: 5855–5899.
Isacks, B.L., Sykes, L.R. and Oliver, J., 1969, Focal mechanisms ofdeep and shallow earthquakes in the Tonga-Kermadec region andthe tectonics of Island Arcs,Geol. Soc. Am. Bull.80: 1443–1470.
Keeton, J.A., Searle, R.C., Parsons, B., White, R.S., Murton, B.J.,Parson, L.M., Peirce, C. and Sinha, M.C., 1997, Bathymetry ofthe Reykjanes Ridge,Mar. Geophys. Res.19: 55–64.
Kelman, M., 1998, Hydrothermal Alteration of a Supra-SubductionZone Ophiolite Analog, Tonga, Southwest Pacific, Master’sThesis, Oregon State University, Corvallis, Oregon.

510
Kroenke, L.W., Jarvis, P.A. and Price, R.C., 1987, Morphology ofthe Fiji fracture zone: recent reorientation of plate boundaries inthe vicinity of the north Fiji Basin,Eos, Trans. AGU68: 1445.
Lonsdale, P., 1986, A multibeam reconnaissance of the TongaTrench axis and its intersection with the Louisville Guyot Chain,Mar. Geophys. Res.8: 295–327.
Lonsdale, P., 1988, Geography and history of the Louisville Hotspotchain in the Southwest Pacific,J. Geophys. Res.93: 3078–3104.
Macdonald, K.C., Fox, P.J., Carbotte, S., Eisen, M., Miller, S., Per-ram, L., Scheirer, D., Tighe, S. and Weiland, C., 1992, The EastPacific rise and its flanks, 8◦–17 ◦N: history of segmentation,propagation and spreading direction based on SeaMARC II andsea beam studies,Mar. Geophys. Res.14: 299–334.
MacLeod, C.J., 1994, Structure of the outer Tonga Forearc at site841, in J. Hawkins, Parson, L., Allan, J. et al. (eds),Proc.ODP, Sci. Results, 135, Ocean Drilling Program, College Station,Texas, 313–329.
MacLeod, C.J., 1996, Geodynamics of the Tonga subduction zoneand Lau Backarc basin,Eos Trans. AGU77: F325.
MacLeod, C.J., Parson, L.M., Sager, W.W. and the ODP Leg 135Scientific Party, 1992, Identification of Tectonic Rotations inBoreholes by the Integration of Core Information With Forma-tion MicroScanner and Borehole Televiewer Images, in A. Hurst,C.M. Griffiths and P.F. Worthington (eds),Geological Applica-tions of Wireline Logs, Geological Society of London SpecialPublication, London65: 235–246.
MacLeod, C.J., Wright, D.J., Bloomer, S.H. and Clift, P.D. (inpreparation) Structure of the Tonga Forearc and GeodynamicEvolution of the Tonga-Lau Marginal Basin System.
Millen, D.M. and Hamburger, M.W., 1998, Seismological evidencefor tearing of the pacific plate at the northern termination of theTonga subduction zone,Geology26: 659–662.
Miller, S.P. and Capell, W.J., 1993, Multibeam sonars: families formulti-mission Vessels,Sea Technol.34: 10–15.
New Zealand Hydrographic Office, 1977, South Pacific Ocean,New Zealand to Fiji and Samoa Islands, Defense MappingAgency Hydrographic Center, Washington, D.C., 1 map sheet,1:3,500,000.
Olbertz, D., Wortel, M.J.R. and Hansen, U., 1997, Trench migrationand subduction zone geometry,Geophys. Res. Lett.24: 221–224.
Parson, L.M. and Tiffin, D.L., 1993, Northern Lau Basin: backarcextension at the leading edge of the Indo-Australian plate,Geo-Marine Lett.13: 107–115.
Parson, L.M. and Hawkins, J.W., 1994. Two-stage ridge propaga-tion and the geological history of the Lau Backarc basin, in J.Hawkins, L. Parson, J. Allan et al. (eds),Proc. ODP, Sci. Results,135, Ocean Drilling Program, College Station, Texas, 819–828.
Pelletier, B. and Dupont, J., 1990, Effets de la subduction de la ridede Louisville sur l’arc des Tonga-Kermadec,Ocean. Acta10:57–76.
Pelletier, B. and Louat, R., 1989, Mouvements relatifs des plaquesdan le sud-ouest pacifique,C.R. Acad. Sci. 308: 123–130.
Pontoise, B., Pelletier, B., Aubouin, J., Baudry, N., Blanchet, R.,Butscher, J., Chotin, P., Diament, M., Dupont, M., Eissen, J.,Ferrière, J., Herzer, R., Lapouille, A., Louat, R., d’Ozouville, L.,Soakai, S. and Stevenson, A., 1986, Subduction of the LouisvilleRidge along the Tonga Trench: preliminary results of SEAPSOcampaign (Leg V),Compte Rendu de l’Academie des Sciences,Série II10: 911–918.
Purdy, G.M., Sempéré, J.-C., Schouten, H., Dubois, D. L. andGoldsmith, R., 1990, Bathymetry of the mid-atlantic ridge,24◦–31◦N: a map series,Mar. Geophys. Res.12: 247–252.
Raitt, R.W., Fisher, R.L. and Mason, R.G., 1955, Tonga Trench,Geol. Soc. Amer. Spec. Paper62: 237–254.
Sager, W.W., MacLeod, C.J. and Abrahamsen, N., 1994, Pale-omagnetic Constraints on Tonga Arc Tectonic Rotation fromSediments Drilled at Sites 840 and 841, in J. Hawkins, L. Parson,J. Allan et al. (eds),Proc. ODP, Sci. Results, 135, Ocean DrillingProgram, College Station, Texas, 763–786.
Sandwell, D.T., 1987, Biharmonic spline interpolation of GEOS-3and seasat altimeter data,Geophys. Res. Lett.14, 139–142.
Scheirer, D.S., Macdonald, K.C., Forsyth, D.W., Miller, S.P.,Wright, D.J., Cormier, M.-H., and Weiland, C.M., 1996, A mapseries of the Southern East Pacific rise and its flanks, 15◦S to19 ◦S,Mar. Geophys. Res.18: 1–12.
Smith, G.P., Wiens, D.A., Dorman, L.M., Webb, S.C. and Fischer,K.M., 1998, Azimuthal anistotropy beneath the Lau Basin: ob-servations of shear wave splitting from local earthquakes at oceanbottom seismometers,Eos Trans. AGU79: F637.
Tappin, D.R., 1994, The Tonga Frontal-arc basin, in P.F. Ballance(eds.)South Pacific Sedimentary Basins, Elsevier, Amsterdam,157–176.
Tappin, D.R., Bruns, T.R. and Geist, E.L., 1994a, Rifting of theTonga/Lau Ridge and Formation of the Lau backarc basin: ev-idence from site 840 on the Tonga Ridge, in J. Hawkins, L.Parson, J. Allan et al. (eds),Proc. ODP, Sci. Results, 135, OceanDrilling Program, College Station, Texas, 367–372.
Tappin, D.R., Herzer, R.H. and Stevenson, A.J., 1994b, Structureand Stratigraphy of the Southern Tonga Ridge, 22◦–26◦ South,in R.H. Herzer, P.F. Ballance and A.J. Stevenson (eds),Geologyand Resources of Island Arcs - Tonga-Lau-Fiji Region,SOPACTechnical Bulletin8: 81–100.
Taylor, B., Zellmer, K., Martinez, F. and Goodliffe, A., Sea-floorspreading in the Lau Back-arc basin, 1996,Earth Planet. Sci.Lett., 144: 35–40.
Taylor, B., Coffin, M., Dietrich, W., Dixon, T., Driscoll, N., Karner,G., Klemperer, S., Kohlstedt, D., Moore, C., Nittrouer, C., Plank,T., Sawyer, D., Stern, R., Stolper, E., Underwood, M. and Wiens,D., 1998, Program Focuses Attention on Continental Margins,Eos, Trans. AGU79: 137–142.
Vallier, T.L., O’Connor, R.M., Scholl, D.W., Stevenson, A.J. andQuinterno, P.J., 1985, Petrology of rocks dredged from thelandward slope of the Tonga Trench: implications for middlemiocene volcanism and subsidence of the Tonga Ridge, in D.W.Scholl, and T. L. Vallier (eds),Geology and Offshore Resourcesof Pacific Island arcs-Tonga Region,Circum-Pacific Council forEnergy and Resources, Earth Science Series2: 109–120.
von Huene, R. and Culotta, R., 1989, Tectonic erosion at the front ofthe Japan trench convergent margin,Tectonophysics160: 75–90.
von Huene, R. and Lallemand, S., 1990, Tectonic erosion along theJapan and Peru convergent margins,Geol. Soc. Am. Bull.102:704–720.
von Huene, R. and Scholl, D.W., 1991, Observations at convergentmargins concerning sediment subduction, subduction erosion,and the growth of continental crust,Rev. Geophys.29: 279–316.
von Huene, R., Suess, E. and the ODP Leg 112 Scientific Party,1988, Ocean drilling program leg 112, Peru continental margin:Part 1, Tectonic history.Geology16: 934–938.
von Rad, U., Riech, V., Wissmann, G., Stevenson, A. J., Morton,J.L. and Sinha, M.C., 1990, Seafloor reflectivity, sediment dis-tribution, and magnetic anomalies of the Lau Basin (SW Pacific,SO35/48 cruises),Marine Mining9: 157–181.
von Stackelberg, U. and von Rad, U., 1990, Geological evolu-tion and hydrothermal activity in the Lau and North Fiji Basins,Southwest Pacific Ocean: results of SONNE Cruise SO-35,Geologisches Jahrbuch. Reihe D: Mineralogie, Petrographie,Geochemie, Lagerstaettenkunde92: 1–660.

511
Watts, A.B., Weissel, J.K., Duncan, R.A. and Larson, R.L., 1988,Origin of the Louisville Ridge and its relationship to the Eltaninfracture zone,J. Geophys. Res.93: 3051–3077.
Wessel, P. and Smith, W.H.F., 1995, New version of the genericmapping tools released,Eos, Trans. AGU76: 329.
Wiedicke, M. and Collier, J., 1993, Morphology of the Valu Faspreading ridge in the Southern Lau basin,J. Geophys. Res.98:11,769-11,782.
Wiedicke, M. and Habler, W., 1993, Morphotectonic characteristicsof a propagating spreading system in the Northern Lau Basin,J.Geophys. Res.98: 11,783–11,797.
Wright, D.J., 1992, Convergence and strike-slip motion at the north-ern terminus of the Tonga Trench, Southwest Pacific, in R.A.Geyer (ed.),CRC Handbook of Geophysical Exploration at Sea,CRC Press, Boca Raton, Florida, 35–79.