basin leakage: site studies at girgarre, … · vertical leakage paths that is moving the leakage...
TRANSCRIPT

CRC FOR CATCHMENT HYDROLOGYCSIRO LAND AND WATER
MURRAY-DARLING BASIN COMMISSION
CRC FOR CATCHMENT HYDROLOGY REPORT 00/10CSIRO LAND AND WATER TECHNICAL REPORT 16/00
August 2000
ON-FARM AND COMMUNITY-SCALE SALT DISPOSAL BASINSON THE RIVERINE PLAIN
BASIN LEAKAGE:SITE STUDIES AT GIRGARRE, VICTORIA AND GRIFFITH, NSW
Fred Leaney and Evan Christen

iCSIRO Land and Water Technical Report 16/00
Foreword
There are pressures to minimise salt leaving irrigated catchments of theMurray-Darling Basin to limit salinity increases in the River Murray. Part ofthis strategy is to manage drainage disposal water in the irrigation areas usingdisposal basins. Unfortunately, there are no existing guidelines for siting,design and management of such disposal basins. The CRC for CatchmentHydrology and CSIRO Land and Water, with support from the Murray-Darling Basin Commission, have embarked on a project with the overallobjective of producing such guidelines for the Riverine Plain of the MurrayBasin.
This report is one of several being produced in this project to support theguidelines. It describes the results of intensive field investigations at a 30 hacommunity basin near Girgarre in the Shepparton Irrigation Region (SIR),and at a 2 ha on-farm basin near Griffith in the Murrumbidgee IrrigationArea (MIA). It also includes results from less intensive investigations at afurther 13 on-farm basins in the MIA. The primary focus of these fieldinvestigations concerned leakage from the basins, believed to be a majorfactor in determining the overall viability of disposal basins as a repository forsaline drainage in the Riverine Plain.
Glen WalkerLeader, Salinity Program

iiiCSIRO Land and Water Technical Report 16/00
Summary
Two evaporation basins have been intensively studied for two years todetermine the rate and fate of leakage from them. The two basins: Girgarre(30 ha) and Nehme (2 ha) are ve ry different. The Gi r g a r re basin,commissioned in 1987, receives water from groundwater pumps in the areasurrounding the basin and has unsaturated soil beneath the basin. As such,we describe leakage from the basin as infiltration controlled because thethrottle to leakage is close to the bottom of the basin. Girgarre basin wasestablished as a demonstration basin and the basin water, and groundwatersalinity, has been monitored for most of the last 13 years. In this report, wesummarise results from earlier studies on the basin and present new resultsfrom more recent field investigations.
The Nehme basin was established in 1997 as part of the field investigationsfor this project. The basin receives drainage water from a subsurface pipe ‘tile’drain system. Initially there was a large unsaturated zone under the basin but,soon after commissioning, this became fully saturated. We describe leakagefrom this type of basin as expansion limited because the throttle to leakage isdetermined by how fast leakage can move laterally and vertically away fromthe basin.
As part of investigations of on-farm basins, a further 13 basins in the MIAwere monitored on a monthly basis, in order to provide some generalinformation on the functioning of other on-farm basins.
Leakage from the Gi r g a r re basin was found to be quite stable at 0.5-1.5 mm/d over its life to date. Leakage from the Nehme basin wasinitially high (5-9 mm/d) and reduced as the unsaturated zone filled,stabilising at about 3 mm/d. The other MIA basins had leakage from 3.5 –5.4 mm/d. Thus it would appear that the small on-farm basins have muchhigher leakage rates than the large Girgarre basin.
Investigations of flows in interception drains around the on-farm basinsfound that they accounted for 25 – 50% of the total leakage estimates. Thiswould indicate that interception drains in small basins recycle a largeamount of water.
Using natural tracers, it was found that the saline leakage plume from theNehme basin had reached 5 m below the basin and up to 20 m outside thebasin in the shallow groundwater. At the Girgarre basin, lateral leakageappeared to be the same order of magnitude, but there may be preferentialvertical leakage paths that is moving the leakage plume to deeper shoestringsands.

iv CRC for Catchment Hydrology Report 00/10
Acknowledgments
This research is part of a collaborative project between CSIRO Land andWater and the CRC for Catchment Hydrology, partially funded by theNatural Resources Management Strategy program of the Murray DarlingBasin Commission, Strategic Investigation and Education Program 17034 I.
Technical assistance for the studies at Griffith was provided by DomonicSkehan and John Townsend (CSIRO Land and Water, Griffith) and, for thestudies at Girgarre, by Megan Lefournour, Andrew Holub and Saskia Keestra(CSIRO Land and Water, Adelaide). The authors would particularly like tothank Bill Trewhella and Peter Dickenson from Goulburn Murray Water(Tatura) and Heinz Kleindienst from Sinclair Knight Merz (Tatura) whoprovided background knowledge on the Girgarre Basin. The co-operation ofMr. G. Nehme and other farmers in the MIA is gratefully acknowledged.
Our thanks also go to Ian Jolly and Glen Walker (CSIRO Land and Water,Adelaide) for useful discussions and for reviewing the manuscript, to GregRinder and Mat Gilfedder (CSIRO Land and Water, Canberra) for drafting,and to Russell Mein and David Perry (CRC for Catchment Hydrology) forediting the report.

vCSIRO Land and Water Technical Report 16/00
Table of Contents
Foreword i
1 Introduction 1
2. Methodology 5
2.1 Whole of basin estimates of leakage 5
2.1.1 Water balance 5
2.2 Salt or chloride mass balance 6
2.3 Point measurements of leakage 7
2.3.1 Natural tracers 7
2.3.2 Seepage meters 8
2.4 Movement of leakage from the basin 9
2.4.1 Direct measurements (salinity, [Cl], 2H and 18O) 9
2.4.2 Indirect measurements 10
2.5 Soil physical and biological factors 11
3. Girgarre Basin (Site and Study Description) 13
3.1 Hydrogeology 13
3.2 Basin history and construction 13
3.3 Sampling and monitoring (prior to 1997) 15
3.4 Sampling and monitoring (this study, 1997-1999) 16
3.4.1 Soil sampling and analyses 16
3.4.2 Water sampling and analyses 16
3.4.3 Seepage meters 17
4. On-farm Basins in the MIA (Site and Study Description) 19
4.1 Nehme basin 19
4.1.1 Farm description 19
4.1.2 Basin design 19
4.1.3 Soil and geology 20
4.1.4 Climatic conditions 21
4.1.5 Measurements 23
4.1.6 Sequence of major events 26
4.2 Other basins in the MIA 26

5. Results from Girgarre Basin 29
5.1 Spatial and temporal changes in basin water salinity 29
5.2 Groundwater 32
5.2.1 Groundwater salinity 32
5.3 EM39 profiles 33
5.4 Soil sampling 35
5.5 Polysaccharide analysis 37
5.6 Seepage meters 38
5.7 Chloride and Deuterium profiles beneath the basin 40
5.8 Estimation of leakage for the Girgarre basin 43
5.8.1 Whole of basin estimates 43
5.8.2 Point estimates for leakage rate 45
5.9 Preferential Flow from the Basin 47
5 . 10 Summary of leakage rate and processfor the Girgarre Basin 48
6.Results from On-farm Basins in the MIA 49
6.1 Nehme basin 49
6.1.1 Initial filling 49
6.1.2 Leakage by water and salt balance 49
6.1.3 Spatial distribution of leakage 52
6.1.4 Lateral leakage 56
6.1.5 Summary of leakage from Nehme basin 61
6.2 Other basins in the MIA 63
6.2.1 Leakage by water and salt balance 63
6.2.2 Lateral leakage 64
7. Conclusions 67
8. References 69
Appendix A 71
vi CRC for Catchment Hydrology Report 00/10

viiCSIRO Land and Water Technical Report 16/00
List of Figures
Figure 1 The Murray-Darling Basin showing the location of existing on-farm and community basins studied in the Riverine Plain. 1
Figure 2 Girgarre Basin site map and location of thesurrounding groundwater pumps. 14
Figure 3 Bores for monitoring groundwater depth and salinity at the Girgarre Basin. 15
Figure 4 Sites for seepage metres and for sampling basin water and soil at the Girgarre Basin. 17
Figure 5 Schematic of seepage meter 18
Figure 6 Characteristic Griffith Clay Loam soil profile (after Butler, 1979) 21
Figure 7. Rainfall and reference evaporation for the study period 23
Figure 8 Position of instruments and sampling sites at Nehmi Basin. 23
Figure 9 Chloride concentration vs electrical conductivity relationship for groundwater near the Girgarre Basin. 29
Figure 10 Change in basin water chloride concentration over time for Bays A,B and C at the Girgarre Basin. 30
Figure 11 Changes in salinity for monitoring boregroups in the Girgarre Basin 33
Figure 12 Apparent conductivity of soil below basin using EM39 (representative profiles shown). 34
Figure 13 Gravimetric water content for soil beneath the Girgarre Basin 35
Figure 14 Clay content for soil beneath the Girgarre Basin. 36
Figure 15 Soil water potential for soil beneath the Girgarre Basin 37
Figure 16 Polysaccharide analysis of basin soils in the Riverine Plain 38
Figure 17 Seepage estimates using seepage metersat the Girgarre Basin. 39
Figure 18 Chloride concentration of soilwater beneath the Girgarre Basin 40
Figure 19 Depth profiles for 2H composition of soil-water beneath the bays in the Girgarre Basin. 41
Figure 20 Temporal changes in groundwater chlorideconcentration beneath the bays at the Girgarre Basin. 42

viii CRC for Catchment Hydrology Report 00/10
Figure 21 Changes in 2H composition of groundwaterbeneath the bays at the Girgarre Basin the basin. 43
Figure 22 Measured and modelled changes in the chloride concentrations for water in Bays A-C at the Girgarre Basin. 44
Figure 23. Observed and modelled cumulativewater input to the Girgarre Basin. 45
Figure 24 Monthly leakage estimates for Nehme basin (1997-98) using the water balance method 49
Figure 25 Comparison between water balance and salt balance calculations for leakageestimation during 1997 at Nehme Basin. 50
Figure 26 Comparison of evaporation from pans in andaround Nehme basin with meteorologicalmeasurement of pan evaporation at Griffith. 51
Figure 27 Inlet water salinity and basin water salinity forNehme basin 52
Figure 28 Apparent conductivity (salinity) of soil belowNehme basin by EM38 survey. 54
Figure 29 Soil water chloride below Bay 2 in March 98 55
Figure 30. Monthly estimates of vertical and lateral leakage for Nehme basin 56
Figure 31 Relationship between effective leakage (total leakage less that measured in interception drains) and piezometer levels below the basin. 57
Figure 32 Temporal variation in the flow in interception drainsfor Nehme Basin 57
Figure 33 Measurements of the flow in interception drains and water level in Bay 2 at Nehme Basin. 58
Figure 34 Changes in deuterium composition of interception drain water at the Nehme basin. 59
Figure 35 Changes in salinity of interception drain water and basin water at the Nehme basin. 60
Figure 36 Deuterium composition of shallowgroundwater, transect from basin 60
Figure 37 Soil salinity transect across an 8 year old basin in the MIA using EM38 readings. 65

ix
List of Tables
Table 1 Hydraulic conductivity of Griffith Clay Loam,after van der Lely (1974) 21
Table 2. Mean monthly climate data for Griffith,(CSIRO Land and Water) 22
Table 3 EC measurements (dS/m) from varied sampling points across each bay at the Girgarre Basin. 31
Table 4 Grouping of groundwater monitoring bores and trends in groundwater salinity for the Girgarre Basin. 32
Table 5 Leakage measurements using seepage meter (three monthly intervals between Feb-Oct 1998). 39
Table 6 Leakage summary for Nehme basin 61
Table 7 Summary of on-farm evaporation basincharacteristics in the MIA. 63
Table 8 Summary leakage data from four MIA on-farm basins 64
CSIRO Land and Water Technical Report 16/00

Introduction
1
1. Introduction
The medium to long term viability of large irrigated areas in the RiverinePlain region of Victoria and New South Wales is closely linked withmanagement of high water tables. Restrictions imposed by the Murray-Darling Basin Salinity and Drainage Strategy have led to reductions in theexport of salt from the area from which it originated. These restrictions haveresulted in an increase in the number of small-scale on-farm and communitydisposal basins in irrigation areas. The existing design and management ofboth types of basin vary widely as they have been developed under differentadministrative frameworks.
CSIRO Land and Water, in collaboration with the CRC for CatchmentHydrology, the Murray Darling Basin Commission (Strategic Investigationand Education Program, Project I7034 Managing Disposal Basins for SaltStorage Within Irrigation Areas) and other agencies have been investigatingthe siting, design and management conditions under which small-scalebasins can be successfully used by individuals or groups of landowners. Thebiophysical and other technical information obtained in this project havebeen used to define a robust set of guiding "principles" and guidelines forresponsible basin use.
This report
The disposal of saline irrigation drainage water is a problem that does nothave an easy solution. Currently, disposal is mainly via drainage channels thatempty eventually into existing regional basins or, more often, the drainagewater eventually finishes up in streams or rivers. There is a growingexpectation that this practice will be reduced in the near future and that thedrainage water will be disposed at or near the irrigation site. If this is tohappen, it is probable that there will be an increase in the use of on-farm andcommunity basins in the Riverine Plain. These lead to potential risks such asgroundwater salinisation and soil salinisation of nearby areas. The fieldinvestigations for this project were initiated in order to evaluate thefunctioning of a new basin and of an established basin in the Riverine Plainin order to add to the limited data base for basins in the Riverine Plain(Figure 1).
CSIRO Land and Water Technical Report 16/00

BASIN LEAKAGE: SI TE STUDIES AT GIRGARRE AND GRIFFI TH
2 CRC for Catchment Hydrology Report 00/10
Leakage is one of the major factors that will determine whether or notdisposal basins are a viable option for the safe disposal of saline water fromirrigation areas. In this report, we concentrate on the process of leakage fromdisposal basins, both in terms of estimating the rate of leakage and withregard to the leakage plume (where the leakage water is going). We alsomeasure factors that are likely to affect leakage from the disposal basins.Results from these field investigations have been combined with those fromprevious studies on disposal basins in the Riverine Plain to produce acompanion report on the operation of disposal basins in this area (Leaneyand Christen, 2000). This forms an important basis for the production of aset of guidelines for the use of on-farm and community-scale disposal basinsin the Riverine Plain (Christen et al., 2000).
Figure 1. The Murray Basin showing the location of existing on-farm andcommunity basins studied in the Riverine Plain. The GirgarreCommunity Basin is numbered 1 and 2; basins at Griffith(including Nehme basin) are numbered 7 (numerals refer toexisting reports on the basins , see Leaney and Christen,2000).

Introduction
3
This report presents the results of field investigations conducted for:
1. Girgarre basin, a 30 ha community basin located near Girgarre in theShepparton Irrigation Region (SIR).
2. Nehme basin, a newly constructed 2 ha on-farm basin located nearGriffith in the Murrumbidgee Irrigation Area (MIA).
3. Several other on-farm basins in the MIA.
CSIRO Land and Water Technical Report 16/00

Methodology
5
2. Methodology
The key factor that governs the operation of a disposal basin is water loss byevaporation and leakage beneath the basin. In this report, we concentrateprimarily on the leakage component of water from the disposal basins. Morespecifically, we evaluate different methods for estimating the rate of leakagefrom the basins, where the leakage is likely to go (i.e. the configuration of theleakage plume), and the soil physical and biological factors that may affectthe rate and distribution of leakage from the basin.
In estimating the rate of leakage rate from the study basins we have used:
1. A water balance approach for the Nehme basin. Leakage from theGirgarre basin has also been estimated previously using water balancecalculations (Goulburn-Murray Water and Sinclair Knight Merz, 1995).
2. A chloride balance for the Girgarre basin and salt balance at Nehme basin
3. Tracing the rate of movement of saline leakage water beneath the basin(using naturally occurring [Cl], deuterium, 2H or oxygen-18, 18Ocomposition in the soilwater or groundwater).
4. Seepage meters.
The most common method used to estimate leakage is by simple waterbalance; this method has been used for several evaporation basins in theRiverine Plain. The use of salt balance estimates is less common and, in fact,only applied to one other basin apart from those in this study (Ranfurly, seeLeaney and Christen 2000). A salt balance can be done either with total saltsor, preferably, a specific salt such as chloride.
2.1.1 Water balance
Estimation of leakage using the water balance of a basin involves estimatinginput to the basin by measuring the amount of water pumped into the basinand that entering as rainfall. This is balanced with output from the basin(evaporation and leakage) and with the change in basin volume.
Evaporation is estimated from pan evaporation, either measured on site or atthe nearest suitably equipped meteorological station. Conversion of panevaporation data to that for the basin involves calculating a pan factor.Several approaches are available to estimate the pan factor depending on theavailability of data such as humidity, water temperature and wind speed. Ingeneral, the average pan factor reduces from near unity for very small basins(< 2 ha) to ~0.8 for large regional basins [Morton, 1986; see Leaney andChristen (2000) for summary].
CSIRO Land and Water Technical Report 16/00
2.1Whole of Basin
Estimates of Leakage

BASIN LEAKAGE : SI TE STUDIES AT GIRGA RRE AND GRIFFI TH
6 CRC for Catchment Hydrology Report 00/10
Leakage is estimated using the water balance equation below. It assumes thatany difference between water input to the basin and evaporation is leakage.This method is error prone, as inaccuracy in any of the measurementscompounds into in the leakage value.
Leakage is determined for any time interval using the equation
L = (I + P) – (E + V) (1)
where L is leakage, P is precipitation, I is input via drainage pumped into thebasin, E is evaporation and V is change in storage.
Water balance calculations (as described above) have been used for estimatingleakage from several evaporation basins in the Riverine Plain. A summary ofthese studies is presented in a companion report on the operation of basinsin the Riverine Plain (Leaney and Christen, 2000).
The major difficulty in using the water balance as the only method ofmeasuring leakage is that an error in any of the parameters will result in anerror of equal magnitude in the leakage estimate. The inclusion of salinity orchloride data by means of a salt or chloride balance provides a semi-independent check on whether the data used in the water balance is likely tobe correct. This is because it is possible to formulate the water and salt orchloride balances as two equations, and hence treat leakage and another waterbalance parameter as variables.
Chloride concentration [Cl] is normally used because it is conservative andnon-reactive, and hence considered to move at the same rate as the leakagewater. Providing water in the basin is not hyper-saline, [Cl] increases linearlyas evaporation progresses (i.e. if half the water in the basin evaporates then[Cl] doubles). Historically, however, electrical conductivity measurements forwater samples (EC) are more often measured than [Cl]. Salt balances fromconductivity sampling are useful at low water salinities where saltprecipitation is unlikely. This is the case for much of the historical samplesfrom the Girgarre basin. Hence, we have converted salinity data to [Cl] usingan empirical relationship developed for water samples collected from theGirgarre area. The outline below for a chloride mass balance applies equallyfor a salt mass balance.
When using a chloride mass balance to confirm leakage estimates, we assumethat the chloride entering a disposal basin as pumping input or in rainwatermust be either present in the basin water and surface sediment, or has beenlost by leakage. This is generally true because there is negligible loss of [Cl]by aerial removal (deflation) especially if the basin remains filled. Thesolubility of most common chloride salts is very high (solubility of NaCl is~357 g/L); hence, using a chloride mass balance rather than salt mass balanceeliminates estimating the amount of chloride present as a precipitate underall but extremely high salt concentrations.
2.2 Salt or Chloride MassBalance

Methodology
7
In order to use this method, temporal [Cl] needs to be measured for thedisposal basin, precipitation, and inflow to the basin (i.e. [Cl]basin, [Cl]prec and[Cl]input). For any time step, the equation relating to the water balance musthold true (Equation 1) as well as that relating to the [Cl] balance. The changein the amount of chloride in the basin ( V [Cl]basin) must equal that inputfrom inflow and rain less that removed by leakage (Equation 2).
(V[Cl]basin) = P[Cl]prec + I[Cl]input - L [Cl]basin (2)
Note that the evaporation term disappears in Equation 2 because no chlorideis removed during evaporation. Using Equations 1 and 2, it is possible tocalculate the chloride concentration in the basin after a time interval, t,using the components for the water balance and their re s p e c t i veconcentration during that time interval and hence, plot the temporal changein [Cl]basin for different leakage rates. By changing the leakage parameter, it ispossible to generate a temporal plot for [Cl]b a s i n that most closelyapproximates the observed data for a basin.
The description so far has been for the case of a single bay. An analogousapproach can be used for the case of several bays in series, with the final baybeing terminal (i.e. no outflow). This is the case for the basins at Girgarre,Nehme and numerous other basins in the Riverine Plain. A genericspreadsheet has been developed for this purpose. The required input for themodel is temporal data for input to the basin (and [Cl]basin), precipitation(and [Cl]prec), evaporation and the amount of water in each bay (often relatedlinearly with depth). The model requires that the basin does not empty.
The above methods determine leakage from the basin as a whole. Othermethods have been used to determine the leakage rate at a particular locationin the basin. These "point estimates" include tracer techniques to identifyhow far leakage has moved from the basin, and water loss from a small areain the basin using leakage meters (conventional seepage meters, and thosesimilar to what is commonly referred to as the "Idaho leakage meter").
2.3.1 Natural tracers
The best natural tracers to use are those that move at the same speed as thewater (i.e. are not retarded), are conservative, and easily identified from waterin the surrounding soil or groundwater matrix. Because the chloride ion isconservative, and usually only present in low concentrations in soils (exceptas halite in discharge areas), it satisfies these requirements. For the samereasons, the stable isotopes of water (deuterium, 2H and oxygen-18, 18O)are also excellent tracers of water movement. When water is ponding, andthus evaporating (as in a disposal basin), the water which remains in thebasin will be highly concentrated in most salts including chloride andenriched in 2H and 18O. The chloride, 2H and 18O concentration of thewater leaking from the basin will be the same as the concentration of theseelements in the basin.
CSIRO Land and Water Technical Report 16/00
2.3 Point Measurements
of Leakage

BAS IN LEAKAGE: SI TE STUDIE S AT GIRGARRE AND GRIFFI TH
8 CRC for Catchment Hydrology Report 00/10
One method to determine the chloride concentration in the leakage water isto sample soil beneath the basin, and determine the soilwater chlorideconcentration (or stable isotope composition) in the soilwater at discretedepths below the basin floor. The concentration of these elements extractedfrom the soil should be the same as those measured in the groundwater at thesame depth, if the soil is saturated. From the profile obtained by plotting thesoil water chloride concentration (or stable isotope composition) in the soilwater as a function of depth, it is possible to recognise how far the water fromthe evaporation basin has travelled in the unsaturated zone or in the saturatedzone.
If we assume piston flow occurs, the amount of water in the soil andgroundwater to the depth where chloride concentrations change from high(representing leakage) to low (representing original water) is approximatelythe amount of water that has leaked since the basin was commissioned. Theestimate may not be correct if water table fluctuations cause the soil-water todisperse or in situations when there is a throttle to vertical flow. Under theseconditions, the components to the direction of flow (vertical or horizontal)will depend on the horizontal conductivity and gradient in each directionand may result in a large component of the leakage water moving laterally.
2.3.2 Seepage meters
There are numerous designs for seepage meters, but most consist of a solidtube tapped into the soil at the base of the basin. For the most basic meter,the tube extends out of the water and is almost sealed to minimiseevaporation (except for a small airhole to equalise air pressure inside andoutside of the tube). The water level inside the tube is maintained at the samelevel as that in the basin by routinely adding water to the tube, ensuring thatthe head of water in the basin and that in the tube remain as close as possible.The leakage rate is estimated by measuring the amount of water that isrequired to maintain the water level in the tube. This type of meter was usedat Nehme basin.
If measurements are required over a longer timeframe, and/or routinemeasurement is difficult, it is possible to attach a bladder filled with water tothe tube. This is similar to the system used by McBride and Pfannkuch(1975) except, in their field studies, they were attempting to measuregroundwater inflow into the basin. The aim of this arrangement is to ensurethat the water in the tube is kept at the same pressure as the water in thebasin, to ensure there is no additional head of water increasing leakage fromthe tube beyond that of the basin. This type of system was used at theGirgarre basin. Evaporation from the tube is considered negligible for bothtypes of leakage meter. The amount of water lost from the tube (at Nehmebasin), or by the bladder (at the Girgarre basin), for any time period is equalto leakage over the area of the pipe.

Methodology
9
The greatest difficulty with using leakage meters is ensuring that the tubeseals well with the soil without compacting it. There are other technicalproblems such as blockages or puncturing of the bladders. Using pointsource estimates of leakage allows an evaluation of the spatial variability inleakage but there are rarely enough measurements to get an overall estimateof leakage from the basin.
Leakage of saline water from disposal basins has the potential to causeproblems either to the land surrounding the basin, or to shallow or deepgroundwater systems near to the basin. The only certain way that thispotential problem can be overcome is by the use of an impervious barrier toprevent leakage, and to ensure that the integrity of the barrier is maintainedfor the life of the basin. Such barriers are not recommended for disposalbasins (Leaney and Christen, 2000), primarily because of the loss inevaporative potential as the water in the basin becomes increasingly saline;therefore, much larger area of land that needs to be sacrificed for the basin.
Given that, in most situations, some leakage from basins is required (and isgoing to occur), it is essential that we develop some knowledge on whereleakage from the basin is likely to go (i.e. on the process of leakage from thebasin). For the basins studied in this report, we have looked for evidence ofleakage from the basins:
1. by analysing samples of groundwater from piezometers around the basinfor salinity, [Cl] and 2H and 18O composition (direct analysis).
2. by analysing samples of soilwater beneath the basin for salinity, [Cl] and2H and 18O composition (direct analysis).
3. by analysing water in the interception drain at Nehme for salinity, [Cl]and 2H and 18O composition (direct analysis).
4. Measuring the apparent resistivity of groundwater using a downholeEM39 in piezometers near to the Girgarre basin (indirect measurement)and surface EM38 technique at Nehme and other MIA basins (indirectmeasurement).
All samples and resistivity measurements we re made duringsampling/monitoring from the time of commissioning the basin until thetime of writing the report.
2.4.1 Direct measurements (salinity, [Cl], 2H and 1 8O)
Measurements of salinity, [Cl], 2H and 18O all provide an indicator ofwhether or not the leakage from the basin has reached the point at which thesample was collected. However, the concentration of the tracer in the leakagewater must be significantly different from that in the groundwater orsoilwater prior to the time when the leakage reached it and also different
CSIRO Land and Water Technical Report 16/00
2.4Movement of
Leakage From theBasin

BASIN LEAKAGE: SI TE STUDIES AT GIRGA RRE AND GRIFFITH
10 CRC for Catchment Hydrology Report 00/10
from any other possible sources of saline water. This is not always the case inthe situation where groundwater pumping is used as this may result invertical or lateral movement of saline groundwater adjacent to the samplingpoint. Sampling can be undertaken from piezometers, soil samples or drainflows in interception drains:
• When piezometers are used, the sampling point is the depth of the screenat the site of the piezometer (i.e. a single point defined by depth anddirection from the basin). Nested piezometers (or using open hole andpump-packer sampling if practical) will provide data for several depths.If samples are collected over a time interval, it is possible to determinewhen the leakage reaches that point. Collection of samples from thepiezometer should be such that the piezometer is pumped for longenough to ensure the sample is representative at the sampling point, butnot to induce excessive vertical or horizontal flow to the point ofsampling.
• When soil is sampled, a range of samples may be collected over the depthinterval sampled but only for a single point in time. Both soil samplingand sampling water in piezometers allow reasonable estimates of the rateof leakage to the points sampled. However, the major difficulty isdetermining how representative leakage to those points is for the wholeof the basin.
• Sampling and analysing water from the interception drain provides amethod for integrating leakage over the area in which the drain impacts.As the main aim of such drains is to minimise lateral seepage from thebasin, this method provides information on shallow lateral movementfrom the basin. Interception drains were present at both the Girgarrebasin and Nehme basin but only the drain at Nehme had sufficient flowto provide samples for analysis.
2.4.2 Indirect measurements
When using the direct methods described above, samples could be collected,analysed and the results interpreted to indicate where the leakage from thebasin is moving. The disadvantage with these methods is that the resultsrelate to where the samples were collected. Often, in an attempt to extend thespatial scale of measurement, re s e a rchers use indirect methods ofmeasurement in which a more easily measured parameter is measured andrelated to the parameter of interest. In the case of leakage from a basin,geophysical techniques measure apparent conductivity over a large area andattempt to relate that measurement to the conductivity of the soilwater.
Geophysical techniques can, to a certain extent, be quantitative providedadequate calibration/ground truthing is available (Cook et al ., 1989). This,however, is not the case for the basins studied here. We use the geophysicaldata as qualitative indicators of spatial or temporal changes in groundwater

Methodology
11
salinity and hence leakage (Goulburn-Murray Water and Sinclair KnightMerz, 1995). When using downhole EM39 data for bores near the Girgarrebasin, we are able to look at temporal and spatial differences at different sitesaround the basin. When using the EM38 data from in and around the on-farm basins, the results were analysed to determine if there were largevariations in apparent conductivity in the basin floor, possibly indicatingvarying leakage rates. Measurements outside the basins were compared tothose inside by using transect sampling to assess how far saline water leakingfrom the basin may have moved laterally. Note that EM38 data only relatesto the top 2 m of soil and thus would only reflect shallow lateral leakage.
By combining the results of direct and indirect measurements, we presentsummaries of the development of the salinity plumes at each of the sitesstudied. This data provides important background information on theprocess of leakage for basins in the Riverine Plain as presented in Leaney andChristen (2000) and Jolly et al. (2000).
The first two parts of the methodology provided ways of estimating leakagerates for disposal basins and for determining where the leakage was going.The final part of the methodology attempts to provide information onfactors likely to determine both the rate of leakage and the leakage plume fordisposal basins.
A wide spectrum of factors are likely to affect the rate of leakage fromdisposal basins. Leakage may be controlled by factors that impact at the baseor sides of the basin, and throttle flow from the basin to the underlyingunsaturated zone. The throttle-to-leakage may be at some depth below thebasin, but still at an elevation above the regional groundwater table. The rateof leakage may be determined by the rate at which the groundwater moundunder a disposal basin is able to dissipate. It is likely that, for any basin,different factors may control leakage at different stages of the basin life.
The following factors have been identified in the literature as potentiallyimportant in determining leakage from disposal basins:
1. Soil type and soil compaction (Heavier soils or compacted soils will, ingeneral, have lower rates of leakage)
2. Hydraulic head of water (Deeper basins and/or lower regional watertables may enhance leakage).
3. Soil and water sodicity (Chemical interaction of water and soil may leadto dispersion or flocculation of the soil and changed infiltration rates).
4. Algal clogging (Polysaccharide production as a result of microbiologicalactivity may reduce leakage from the basins).
5. Presence of preferential flow paths (Leakage may be enhanced if leakagefrom the basin proceeds via preferential rather than piston-type flow).
CSIRO Land and Water Technical Report 16/00
2.5Soil Physical and
Biological Factors

BASIN LEAKAGE: SI TE STUDIES AT GIRGARRE AND GRIFFI TH
12 CRC for Catchment Hydrology Report 00/10
As part of the field investigations in this study, we report the results for thefollowing parameters:
1. Clay content of soil beneath the basin.
2. Soilwater potential measurements (as an indicator of saturated orunsaturated conditions).
3. Soil sodicity.
4. Polysaccharide concentration in the soil.
5. EM39 (Girgarre) and EM38 (Nehme) profiles as indicators of spatialvariation in leakage and areas of preferential flow.
Interpretation of these results for these, and other existing basins in theRiverine Plain, is included in a companion report (Leaney and Christen,2000).

Girgarre Basin (Site and Study Description)
13
3. Girgarre Basin (Site and Study Description)
Irrigation, predominantly by flood irrigation, commenced in the SheppartonIrrigation Region (SIR) about 80 years ago providing water mainly forperennial pasture (65%) and annual pasture (25%). As is the case with mostirrigation areas in the Riverine Plain, rising water tables and shallowgroundwater salinity has been noted during the last 2-3 decades.
The Girgarre Evaporation Basin is located in the SIR, about 50 km west ofShepparton, Victoria. A comprehensive irrigation history of the area and theunderlying reasons for the development of the basin have been presented ina report by Goulburn-Murray Water in association with Sinclair KnightMerz (Goulburn-Murray Water and Sinclair Knight Merz, 1995).
The Girgarre basin is underlain by fluviatile sediments of the SheppartonFormation which extend to a depth of about 70 m below the natural surface.The Formation is predominantly clayey but comprises several sandy unitswithin the surficial 30 m (referred to as the shoestring sand aquifers in theUpper Shepparton Formation). The shoestring sand aquifers are divided intotwo aquifer groups. Group 1 aquifers are located in the top 12 m and maybe up to 10 m thick with groundwater salinity typically 2 to 4 dS/m. Thesecond aquifer group (designated Group 2), formed from prior streams, isfound between 10 and 20 m from the surface; it has salinities rangingtypically from 15 to 20 dS/m. It is present in 50% of the area andoccasionally underlies the Group 1 system.
Between 6 and 9 wellpoints were installed at each of three sites (T101, 102and 103) around the basin. The screens for all wellpoints are located in theshoestring sand aquifers at depths from 7-20 m below ground surface.Groundwater from T101 is the most saline (~15-19 dS/m; [Cl] ~5,800-7,000 mg/L) and is pumped into the basin. Groundwater from T102(salinity ~3-5 dS/m) and T103 (salinity ~3.8-6 dS/m) are considerablyfresher and are pumped into drainage channels. Numerous private pumpsalso pump groundwater into the drainage channels to lower groundwater ontheir farms.
The disposal basin was constructed in 1987, occupying an area of 42 ha inone of the most badly salt affected parts of the irrigation area. The basin itselfis divided into 3 bays totalling 30 ha and the remaining 12 ha used as a bufferzone from surrounding irrigation, Figure 2. Groundwater from T101 ispumped into Bay A (13 ha), flows by gravity feed into Bay B (13 ha) and
CSIRO Land and Water Technical Report 16/00
3.1 Hydrogeology
3.2 Basin History and
Construction

BAS IN LEAKAGE: SI TE STUDIES AT GIRGARRE AND GRIFFI TH
14 CRC for Catchment Hydrology Report 00/10
then into the terminal Bay C (4 ha). Flow to the basin is triggered whenwater levels fall by 0.1 m. Mean depths for Bays A and B have beenmaintained at ~0.3 m, occasionally rising to ~0.5 m and on one occasion(late 1993) being empty for 2-4 weeks. The base of Bay C is ~0.1 m belowthe other 2 bays resulting in it being, on average, 0.1 m deeper. Bay A hadno treatment following construction while, in Bays B and C, the soil wascompacted to see whether this would help reduce leakage.
An interception channel is located ~19 m from the northern and southernsides of the basin, and ~16 m from the eastern side; the Deacon drain islocated ~40 m from the western side. The base of the interception drain is ~0.5 -1.0 m below the base of the basin. Deep (16-19 m) and shallow(4 m) monitoring bores were drilled around the basin (called perimeterbores) and between Bays A and B and Bays A and C (called internal bores)(Figure 3).
Figure 2. Girgarre Basin site map and location of the surroundinggroundwater pumps.
The basin is primarily in the zone of influence of Pump 101. Any leakage fromthe basin reaching the shoestring sands is likely to move S/SW towards Pump 101.

Girgarre Basin (Site and Study Description)
15
The following data is available from the field investigation and monitoringprogram by Goulburn-Murray Water and Sinclair Knight Merz (prior to1997) and CSIRO Land and Water (1997 to 1999):
1. EC measurements for water in Bays A, B and C (1987-1999). Dataconverted to [Cl] concentrations using [Cl]:EC relationship for basinsand used in leakage estimation using the [Cl] mass balance technique.
2. EC measurements from monitoring bores within and around the basin.Data is used to determine the development of the leakage plume aroundthe basin.
3. EM39 profiles (downhole) for selected monitoring bores taken soon aftercommissioning the basin and every few years following. Data is used todetermine leakage flow processes under the basin (e.g. piston vspreferential)
Also presented in the following section is a brief description of how the datais used in discussions later in this paper.
Figure 3 Bores for monitoring groundwater depth and salinity at theGirgarre Basin.
All perimeter bores have screen depths of ~15 m. Internal bores have both shallow (~3-4m) and deep (~15 m) screens.
CSIRO Land and Water Technical Report 16/00
3.3 Sampling and
Monitoring (Prior to1997)

BASIN LEAKAGE: S ITE STUDIE S AT GIRGARRE AND GRIFFI TH
16 CRC for Catchment Hydrology Report 00/10
3.4.1 Soil sampling and analyses
Soil cores were taken by hand-augering in Bays A and B at a distance of ~15 m from the edge. Two cores were also collected in Bay C at the edge and~12 m from the edge (Figure 4). During coring, water from the basin wasisolated from the auger hole using a 300 mm diameter steel tube partiallyinserted into the basin bed. Samples were taken at 100-300 mm intervals todepths of 3.6, 4.4, 4.3 and 3.6 m for Bays A, B, C and C (edge) respectively.Following augering, the holes were completed as piezometers with screensplaced at the bottom 200 mm.
Soil samples were analysed for gravimetric water content and for chlorideconcentration in the soil-water. Some of the samples were analysed for stableisotopes 2H, and 1 8O after collecting the soil-water by aze o t ro p i cdistillation. Pa rticle size analyses, PSA, and soil-water potentialmeasurements (SWP) were made on most cores. Short cores up to 1 m longwere also collected from the basins and sampled at intervals (Figure 4). Inaddition to the above analyses, some of these samples were stored in aninsulated container filled with ice and later analysed for polysaccharideconcentration. Details of analytical methods are given in Appendix A.
3.4.2 Water sampling and analyses
Samples were collected from the basin water in each of the bays at similarlocations to the historical sampling. In addition, during the course of thisstudy, two sets of samples were collected from each of the three bays todetermine the degree of mixing within each bay. The first was during midwinter when inflow from groundwater pumping was low, and the secondduring summer when inflow was near its maximum. The samples werecollected at a distance of ~30 m from the edge of each bay at locations shownin Figure 4.
Groundwater was collected from beneath the bays from the piezometersdrilled during soil sampling, and also from the monitoring piezometer 4447- S and 4447-D on most of the field trips (approximately every 3-4months). The piezometers in the bays consist of 50 mm PVC tubing withslotted casing and a cloth sock at the bottom. They were drilled (as part ofthe soil sampling program) and the outside of the tube back-filled withBentonite to prevent leakage down the outside of the annulus. Samples werealso collected from many of the monitoring bores during March 1997, andas sub-samples from the monitoring bores collected during ro u t i n emonitoring by Sinclair Knight Merz (SKM) in November, 1998. Sampleswere taken from the input to Bay A, when water was being pumped into thebasin, and from the interception drain when it was flowing. These sampleswere analysed for 2H, and 18O, salinity and [Cl].
3.4Sampling and Monitoring (ThisStudy, 1997-1999)

Girgarre Basin (Site and Study Description)
17
Figure 4. Sites for seepage metres and for sampling basin water and soilat the Girgarre Basin.
3.4.3 Seepage Meters
A total of 11 seepage meters (5 in Bay A, 4 in Bay B and 2 in Bay C) wereinstalled in the basin during 1997 (sites shown in Figure 4). These metersconsisted of a 150 mm diameter PVC pipe capped at one end, and sharpenedat the other. This pipe is attached, via 6 mm diameter tubing, to a 20 Lplastic bladder. The meter is placed on the base of the basin, and tapped untila good seal is made with the clay at the bottom of the basin; the bladder issecured to the bottom of the basin nearby (Figure 5). This type of seepagemeter allows the hydraulic head of water in the bag to be the same as that atthe base of the basin. The amount of water lost by the bag for any timeperiod is equal to leakage over the area of the pipe.
At four of the sites (two in Bay A and one in each of Bays B and C), pairedseepage meters were placed within one metre of each other. In order toevaluate the effectiveness of the sludge as a retardant to leakage, one of themeters had the sludge removed prior to the pipe being inserted; the other didnot. All other sites did not have sludge removed prior to installation of theseepage meters.
CSIRO Land and Water Technical Report 16/00

BASIN LE AKAGE: SI TE STUDIES AT GIRGARRE AND GRIFFI TH
18 CRC for Catchment Hydrology Report 00/10
Initially, 20 L wine cask inserts were used as bladders. However, wave actionresulted in these bladders being punctured; hence, they were replaced withcontainers used for water storage which had thicker PVC, but were stillflexible enough to allow internal and external pressure of the water to remainequal. Initially, 15 L of water was accurately measured into each bladder andthe remaining water measured on the subsequent field trip. Several of thesebladders also punctured during the course of the study, but their success ratewas much better than for the wine casks.
Figure 5. Schematic of seepage meter

On-farm Basins in the MIA (Site and Study Description)
19
4. On-farm basins in the MIA(Site and Study Description)
The Nehme basin was on a 50 ha vineyard in the MIA, 30 km north ofGriffith. It was a newly constructed, triangular, 2 ha evaporation basin splitinto two bays. The vineyard was established in 1994 after previously beingused to grow rice up until 1989, and vegetables until 1994. This site waschosen because the newly constructed evaporation basin enabledmeasurement of initial soil and hydraulic conditions under the basin, andinitial rates of infiltration.
4.1.1 Farm description
Several red and white grape varieties were planted over a four year periodfrom 1994 to 1997. The farm was flood irrigated using broad based furrows.Irrigation occurred around every 12 to 18 days and took 2 to 3 days tocomplete. Irrigation advance times were long, with water typically takingaround 14 to 18 hours to reach the end of the 500 m long furrows. Farmdrainage ditches were formed, but were usually too few; water was held at thebottom of the furrows for long periods. Water application across the farmwas not evenly distributed as small sections of the farm were wateredindividually, depending on grape variety and age.
Subsurface pipe drainage using 100 mm corrugated pipe with gravelenvelope was installed into 25 ha of the farm at the beginning of 1997. Theremaining 25 ha of the farm was drained 9 months later, in September. Thelateral tile drain lines were 1.8 m deep at 36 m spacing, with a sealed collectormain running to the sump. All subsurface drainage was pumped from thesump into the evaporation basin.
When the basin was commissioned in January 1997, all subsurface drainageentering the sump was pumped into the evaporation basin. At the time thewatertables in the farm were within 1.5 m of the surface. The tile drain pumpwas run continuously drawing down the watertable to the drain level. Thisproved to be poor management as the basin was rapidly filled within 3 weeks.
4.1.2 Basin design
The evaporation basin was an above ground construction, consisting of 2bays of 1.07 and 1.04 ha; the gradient of the banks was 1:3. The maximumdepth of the bays was 0.95m and 1.1m respectively, with a maximumcapacity of 10.8 ML and 10.4 ML.
CSIRO Land and Water Technical Report 16/00
4.1Nehme Basin

BASIN LEAKAGE: SI TE STUDIES AT GIRGARRE AND GRIFFI TH
20 CRC for Catchment Hydrology Report 00/10
Drainage water was pumped into the first bay via a 150 mm PVC pipe fromthe pump, and overflowed into the second bay through a pipe between thebays when the water level was greater than 0.56 m. At a later date, the pipebetween the bays was removed, and a channel dug between the basin at floorlevel; this enabled both bays to fill almost simultaneously. It also allowed thewater to spread across the greatest possible area to increase evaporation.Water only left the basin by evaporation, vertical leakage and lateral leakage.There were no arrangements for overflow. Once the basin was full, pumpingof drainage water was stopped.
An interception pipe drain to collect shallow lateral seepage was installedabout 1.5 m below ground level around the perimeter of the evaporationbasin, at a distance of about 10 m from the inside bank. This drain wasconnected to a subsurface drain line in the farm that returned any interceptedleakage to the main pump sump. Two inspection pits were inserted into thisinterception drain line, which enabled measurement of the quantity andquality of lateral leakage.
The basin area was 8 % of the drained farm area initially, when only 25 haof the farm had subsurface drainage. When the remaining 25 ha of the farmwas drained, the proportion of basin area to drained area was reduced to 4%. This was well below the 10% basin area recommended by MurrumbidgeeIrrigation and the Department of Land and Water Conservation, NSW at thetime.
The basin was sited in a disused part of the farm, which was unsuitable forirrigation due to its elevation and triangular shape. This portion of land hadnever been irrigated; the water table was below 7 m when piezometers wereinserted before the basin was filled. This basin was situated approximately 50 m from a main supply canal on one side, and 20 m from a drainagechannel on the other.
4.1.3 Soil and geolog y
The site was on the edge of the Riverine Plain, against the foothills of thePalaeozoic massif of eastern Australia. On the Riverine Plain, there isgenerally a mixture lacustrine and fluviatile deposits. The plain is an alluvialfan with ancestral rivers and prior streams; these prior streams and riversdeposit coarse sediment layers in the dominant silt and clay. At this particularsite there is no influence of ancestral rivers or prior streams. Nor are there anywindblown sand drifts as found in many areas. In this area there is no shallowaquifer system, with up to 30 m of uninterrupted clay before brown coal andbedrock (van der Lely, 1974)
The soil at the site was a Griffith Clay Loam (Butler, 1979). This soil isdescribed as typically having the top 0.3 m as a clay loam that becomesprogressively heavier with depth down to about 0.9 m, and then continues asa medium clay. The deep subsoil ranges from a light to heavy clay with soft

and hard carbonate (Figure 6). Van der Lely (1974) documented hydraulicconductivity measurements of Griffith Clay Loam soils using the auger holemethod. Measurements were documented from 96 sites with varyingwatertable conditions (Table 1).
Figure 6. Characteristic Griffith Clay Loam soil profile (after Butler, 1979)
Table 1. Hydraulic conductivity of Griffith Clay Loam (after van der Lely1974)
Depth range (m) Average hydraulic conductivity (m/day)
0.5 – 0.9 0.55
0.9 –1.4 0.12
1.4 – 1.9 0.06
4.1.4 Climatic conditions
The climate in the MIA is characteristic of semi-arid areas with hot drysummers, and mild winters and occasional frosts. The average highest andlowest temperatures in the summer months are 320 C and 140 C, and 160 Cand 30 C in the winter months. Mean rainfall for the Griffith area is
On-farm Basins in the MIA (Site and Study Description)
21CSIRO Land and Water Technical Report 16/00

BASIN LE AKAGE: SI TE STUDIES AT GIRGARRE AND GRIFFI TH
22 CRC for Catchment Hydrology Report 00/10
418 mm, fairly evenly distributed throughout the year. Annual rainfall ishighly variable ranging from 140 to 700 mm. Mean potentialevapotranspiration is 1800 mm. Evapotranspiration greatly exceeds rainfall inthe summer months and closely matches rainfall in the winter monthsbetween April to August (Table 2). The study period covered two years offairly dry weather conditions (Figure 7).
Table 2. Mean monthly climate data for Griffith (CSIRO Land andWater)
Month (m) Rainfall (mm) ET (mm) Max Temp. (0C) Min Temp. (0C)
January 36 275 31.8 16.1
February 27 228 31.0 15.9
March 33 187 28.1 13.5
April 36 112 23.1 9.2
May 41 65 18.4 6.1
June 34 43 15.0 3.8
July 37 49 14.2 2.9
August 37 74 16.2 3.9
September 36 118 19.5 5.6
October 43 172 23.2 8.7
November 28 224 26.9 11.7
December 30 268 29.9 14.3
Total 418 1808

On-farm Basins in the MIA (Site and Study Description)
23
4.1.5 Measurements
A number of measurements were taken which are outlined below. Figure 8shows the placement of various instruments and the sampling sites.
Figure 8 Position of instruments and sampling sites at Nehme Basin.
CSIRO Land and Water Technical Report 16/00
Figure 7. Rainfall and reference evaporation for the study period

BASIN LE AKAGE: SI TE STUDIES AT GIRGARRE AND GRIFFI TH
24 CRC for Catchment Hydrology Report 00/10
• Basin inputs
Subsurface drainage water pumping into the basin was measured by anelectronic paddlewheel flow meter. The salinity of this water wasmeasured by collecting a 250 ml sample for laboratory analysis. Rainfallwas measured by a rain gauge on the basin bank.
• Basin water volume
The evaporation basin was surveyed at the beginning of the experimentbefore filling, and basin area and volume determined. The water level ineach of the two bays was measured using a stilling well made of 50 mmPVC pipe slotted at the bottom inserted into the basin floor.
• Basin water salinity
Basin water salinity was measured by collecting a sample in a 250 mlplastic bottle from each bay and analysing it for electrical conductivityand chloride in the laboratory. The sample was taken at the same pointeach time, from 50 to 100 mm below the water surface. Samples weretaken coinciding with input drainage samples.
• Piezometric pressures
The groundwater levels were measured using piezometers made of 90mm PVC pipe at 2, 3, 4, and 7 m depths, with the bottom 300 mmslotted and sealed with bentonite. These were positioned in a group inthe centre of Bay 1 before the basin was filled (Figure 8). When thepiezometers were being inserted the soil conditions were very dry and nowater was found at 7 m depth.
• Basin leakage - Vertical
Vertical leakage was measured indirectly using a water and salt balancefor the basin, and directly using seepage meters and piezometers installedin the basin before filling.
• Water balance method
The vertical leakage was estimated using the water balance method.Estimates of evaporation were based on the Griffith laboratory weatherstation and assuming a pan factor of 1.
• Seepage meters
Once the basins were filled with water, 11 seepage meters were installedin the basin, 6 in the first bay and 5 in the second bay. The seepagemeters were made from 150 mm diameter UPVC pipe. These pipes werehammered into the floor of the basin to a depth of 250 mm. Onceinstalled, lids were placed on the pipes to prevent water evaporation. Thewater level in the seepage meters was maintained close to basin waterlevel. Changes in water level inside these seepage meters were measuredweekly using Vernier callipers.
On-farm Basins in the MIA (Site and Study Description)
25
• Piezometers
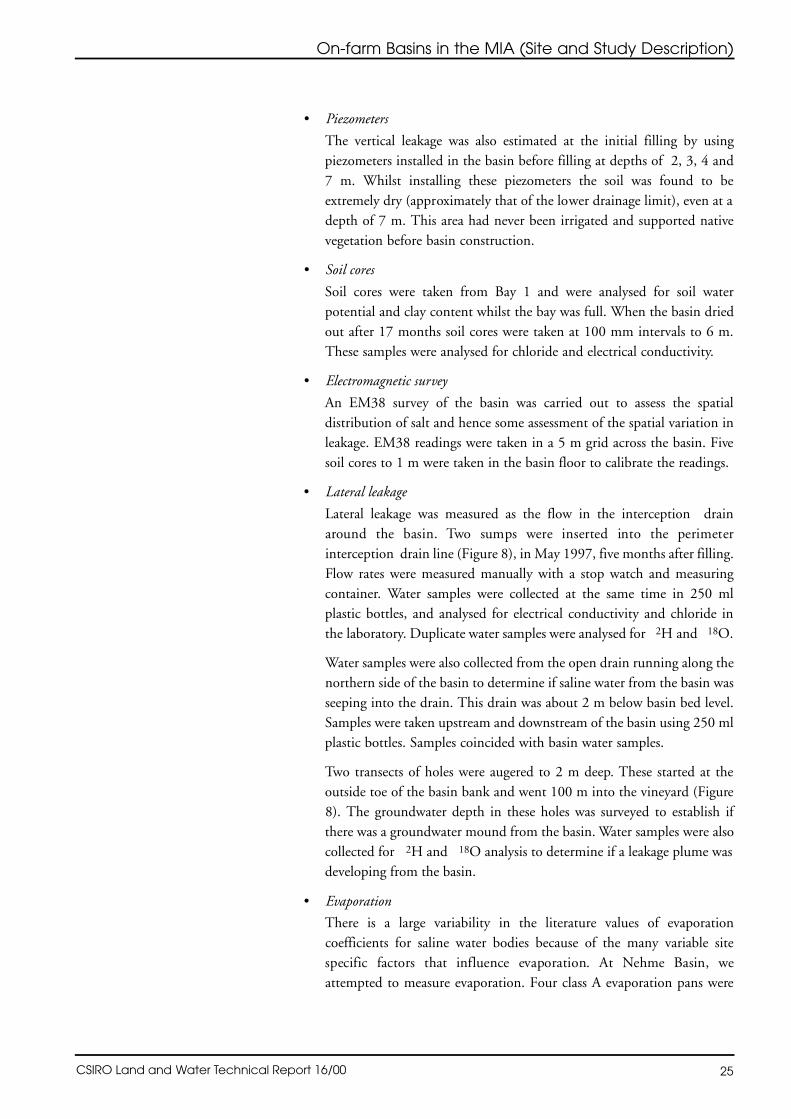
The vertical leakage was also estimated at the initial filling by usingpiezometers installed in the basin before filling at depths of 2, 3, 4 and7 m. Whilst installing these piezometers the soil was found to beextremely dry (approximately that of the lower drainage limit), even at adepth of 7 m. This area had never been irrigated and supported nativevegetation before basin construction.
• Soil cores
Soil cores were taken from Bay 1 and were analysed for soil waterpotential and clay content whilst the bay was full. When the basin driedout after 17 months soil cores were taken at 100 mm intervals to 6 m.These samples were analysed for chloride and electrical conductivity.
• Electromagnetic survey
An EM38 survey of the basin was carried out to assess the spatialdistribution of salt and hence some assessment of the spatial variation inleakage. EM38 readings were taken in a 5 m grid across the basin. Fivesoil cores to 1 m were taken in the basin floor to calibrate the readings.
• Lateral leakage
Lateral leakage was measured as the flow in the interception draina round the basin. Two sumps we re inserted into the perimeterinterception drain line (Figure 8), in May 1997, five months after filling.Flow rates were measured manually with a stop watch and measuringcontainer. Water samples were collected at the same time in 250 mlplastic bottles, and analysed for electrical conductivity and chloride inthe laboratory. Duplicate water samples were analysed for 2H and 18O.
Water samples were also collected from the open drain running along thenorthern side of the basin to determine if saline water from the basin wasseeping into the drain. This drain was about 2 m below basin bed level.Samples were taken upstream and downstream of the basin using 250 mlplastic bottles. Samples coincided with basin water samples.
Two transects of holes were augered to 2 m deep. These started at theoutside toe of the basin bank and went 100 m into the vineyard (Figure8). The groundwater depth in these holes was surveyed to establish ifthere was a groundwater mound from the basin. Water samples were alsocollected for 2H and 18O analysis to determine if a leakage plume wasdeveloping from the basin.
• Evaporation
There is a large variability in the literature values of evaporationcoefficients for saline water bodies because of the many variable sitespecific factors that influence evaporation. At Nehme Basin, weattempted to measure evaporation. Four class A evaporation pans were
CSIRO Land and Water Technical Report 16/00

BASIN LE AKAGE: SI TE STUDIES AT GIRGA RRE AND GRIFFI TH
26 CRC for Catchment Hydrology Report 00/10
installed in the basin, two into Bay 1 and two on the bank between thebays (Figure 8). The pans were filled to within 50 mm from the rim andread using rulers glued to the insides of the pans. The water level on theoutside of the pans was maintained within 50 – 100 mm of the rim bymoving the pans up or down in the basin water. Readings were takenevery 1 – 3 days, and the pan water was changed with basin water eachtime. For general calculations, evaporation was initially estimated usingdaily reference evapotranspiration data from CSIRO Griffith. These werethen corrected to a pan factor of 1 from the field measurements overMarch to May.
4.1.6 Sequence of major events
Date Event
13/12/96 Started pumping into ponds
6/1/97 Commenced intensive sampling
23/1/97 Bay 1 full
5/97 Sumps installed in perimeter line for flow measurement
5/8/97 Lateral seepage investigation using groundwater transects
12/9/97 Tile drains inserted in remaining 25 ha of farm, basin sizedecreased from 8% of drained area to 4% of drained area.
26/2/98 Basin Bay 2 dry, Bay 1 nearly dry
3/98 Soil sampling and EM38 survey of bays
10/98 Bays refilling
Further to the intensive monitoring of the Nehme basin a further 13 on-farmbasins in the MIA were monitored on a monthly basis for:
• input water - based on pump electricity readings calibrated for flow.
• salinity – monthly sample of input water salinity and basin water salinity.
• interception drain flows – occasional measurements.
• basin geometry.
These basins were sited on similar soils under similar conditions to theNehme basin. All the basins were associated with subsurface pipe drainage inthe farm and had subsurface pipe interception drains around their perimeter.Evaporation and rainfall was determined from the Griffith weather stationand assumed to represent each site.
4.2Other Basinsin the MIA

On-farm Basins in the MIA (Site and Study Description)
27
At some of these basins, EM38 surveys were undertaken as transects acrossthe basin. Readings were taken every 5 m in an attempt to detect any shallowsaline leakage plume movement. At the basins where there were open drainsnearby, samples of the drain water were taken upstream and downstream ofthe basin to assess whether the basin leakage was entering the drain.
CSIRO Land and Water Technical Report 16/00

Results from Girgarre Basin
29
5. Results from Girgarre Basin
Historical data for salinity was converted to [Cl] using empirical datacollected from the basin and piezometers during the period 1997-1999(Figure 9). By using this EC vs. [Cl] relationship, the maximum [Cl]observed for the three bays at the Girgarre basin are 10, 25 and 100 g/L forbays A-C respectively (i.e. 10,000 – 100,000 mg/L).
Figure 10 shows that all three basins initially had the same increase in salinity.Then, after half a year, the water in bay A reached a [Cl] of approximately 10g/L while that in the other two bays continued to rise. Bay B reached a steadystate [Cl] of 10 – 20 g/L within a year or two, while that in Bay C reached60 - 100 g/L by 1997. A few years of data is missing for the interval betweenthe initial sampling ceasing and the sampling for this study commencing.
Results from the spatial sampling of the salinity for the bays suggest that thebays are relatively well mixed, despite being relatively large and shallow (seeFigure 4 for sampling locations). The percentage standard deviation forsalinity analyses ranges from 0.14 (for Bay C) to 3.3% (for Bay A) for theSeptember sampling period (spring) and two to three times greater for theFebruary sampling period (summer) (Table 3).
CSIRO Land and Water Technical Report 16/00
Figure 9. Chloride concentration vs electrical conductivity relationship for groundwater near theGirgarre Basin.
5.1Spatial and temporal
changes in basinwater salinity

BASIN LE AKAGE: SI TE STUDIES AT GIRGARRE AND GRIFFI TH
30 CRC for Catchment Hydrology Report 00/10
This is due to the shorter residence time experienced in each bay duringsummer, when the evaporative potential is higher, and rainfall usually lower,than in winter. This results in more groundwater pumping to the basinduring summer months. The opportunity for water within the bay to mixthroughout the bay is greater for higher residence times, compared to periodsof lower residence times. Clearly, the size, geometry of the bays and thelocation of the water input and output also impact on the degree of mixing.
Figure 10 Change in basin water chloride concentration over time forBays A,B and C at the Girgarre Basin.
The [Cl] (and salinity) of water in Bays A and B reach a steady state concentration soon after commissioning whilethat for the terminal bay (Bay C) continues to rise for several years. Seasonal changes in salinity resulting fromdilution via winter rains and concentration via high evaporation in summer are observed for Bays B and C.

Results from Girgarre Basin
31
Samples collected by Goulburn-Murray Water and CSIRO staff werecollected at approximately the same place on each sampling occasion.Clearly, the conductivity of water collected from each of the bays is likely tobe closer to the mean of the bay during winter than during summer. As thesites where water samples were taken is nearer the input than the output forBay A, it is likely that the mean salinity for Bay A is greater than themeasured values. Conversely, for Bay B, the site where the samples weretaken is closer to the output and the mean concentration of the bay is likelyto be less than that measured. However, the difference is relatively small andhas little effect on the estimation of leakage rate (see Section 5.8).
CSIRO Land and Water Technical Report 16/00
Table 3 EC measurements (dS/m) from varied sampling points across each bay at the Girgarre Basin.
Site A1 A2 A3 A4 A5 A6 A7 Mean ± 1 S.D.
Sep 97 24.2 23.7 24.0 23.4 23.4 23.9 25.7 24.0 ± 0.8
Feb 99 23,2 24.4 24.7 20.4 23.5 25.4 26.2 24.0 ± 1.9
Site B1 B2 B3 B4 B5 Mean ± 1 S.D.
Sep 97 45.5 47.5 46.6 45.3 45.2 47.2 46.2 ± 1.0
Feb 99 62.7 52.8 57.6 61.6 63.5 60.8 59.8 ± 4.0
Site C1 C2 C3 C4 Mean ± 1 S.D.
Sep 97 138.6 139.0 139.0 139.0 138.9 ± 0.2
Feb 99 187.0 186.0 185.0 185.0 185.7 ± 1.0

BAS IN LEAKAGE: SI TE STUDIES AT GIRGARRE AND GRIFFI TH
32 CRC for Catchment Hydrology Report 00/10
The location of monitoring bores at Girgarre was given in Chapter 3 (Figure3). In order to evaluate temporal changes in the salinity of the monitoringbores, we have grouped the deep and shallow bores according to theirlocation with respect to the basin and the groundwater pumps (Table 4).
5.2.1 Groundwater Salinity
All deep bores showed very little change in salinity for the first 6 years ofpump operation suggesting that leakage from the basin did not reach theshoestring sands during this time (Figure 11). However, changes have beenobserved in the conductivity of most of the groundwater collected from themonitoring bores since sampling recommenced in 1996/7. Some bores havehad increases in conductivity while others show no difference or havedecreased.
The EC for groundwater in bores from groups 2,4,5 and internal, I, hasincreased in salinity during the monitoring period; these bores are locatedbetween the bays or in the western half of the basin. The groundwater inbores from Group 3, where no significant change in salinity has been seen,are located to the north-east of the basin. Bores from Group 1, where adecrease in salinity is observed in the groundwater, is located to the south-east.
Salinity data for the shallow bores between Bays A and B (Wide Bank) andthose between Bays A and the smaller trial bays (Narrow Bank) both showsimilar overall increases in salinity of ~20–25 dS/m from 1987 to 1998(Figure 11). However, the bores sited on narrow banks display an earlier and
5.2Groundwater
Table 4 . Grouping of groundwater monitoring bores and trends in groundwater salinity for the GirgarreBasin.
Group # Bore # Location Comments/Salinity Trend
Perimeter Deep - Group 1 4395-4398 SE corner of basin GW salinity decreasing
Perimeter Deep - Group 2 4399-4402 & 4376 SW corner of basin Closest to pumpT101GW salinity increasing after 1992
Perimeter Deep - Group 3 4389-4394 NE corner of basin GW salinity constant
Perimeter Deep - Group 4 4381,4383,4385-4387 NW corner of basin GW salinity increasing after 1992
Perimeter Deep - Group 5 4377-4380 West of basin Slight increase in GW salinity after 1992
Internal Deep - Deep 4446-4457 Internal W of bay B GW salinity increasing after 1992
Internal Shallow - Wide Bank 4446S-4451S Internal W of bay B GW salinity increasing from 1988
Internal Shallow - Narrow Bank 4452S-4457S Between bay C and A GW salinity increasing from 1988

Results from Girgarre Basin
33
more rapid rise in salinity compared to those on wider banks. Both groups ofbores have screens approximately 3-4 m from the ground surface (1-2 mb e l ow the water table). The bores on the wider banks are locatedapproximately 4 m from the edge of Bay B while the bores on the narrowerbanks are located within a metre of the water in Bay A.
At several of the monitoring bores, down-hole EM39 profiles were measured,commencing approximately one year after the commissioning of the basin,with the most recent measurements in September 1996. EM39measurements have been used to estimate absolute values for groundwatersalinity when soil physical parameters are known. We have presented theresults of EM39 profiles taken in 1988 and 1996 for three sites. The changesseen at these sites cover the range of changes seen for the basin at themonitored sites over the 8 year period. This data is interpreted as relativechanges in the groundwater salinity at different depths below the basin forthis period (Figure 12).
CSIRO Land and Water Technical Report 16/00
Figure 11. Changes in salinity for monitoring bore groups in the Girgarre Basin
The change in salinity of monitoring bores surrounding (perimeter) and within (internal) the basin suggests thatleakage from the basin reached a depth of 3-4 m within a year or two after the basin filled (solid lines). Leakage fromthe basin did not reach the shoestring sand aquifer until 6-9 years after filling and is mainly observed in areas wherethe monitoring bores are between the basin and Pump T101 (dotted lines). Groundwater pumping is causing lateralflow, in the shoestring sands beneath the basin. The increase in salinity of soilwater(~20 dS/m) and groundwater(<10 dS/m) is reasonably small compared to the salinity of the water in the basin (10–70 dS/m).
5.3EM39 Profiles

BAS IN LEAKAGE: SI TE STUDIE S AT GIRGARRE AND GRIFFI TH
34 CRC for Catchment Hydrology Report 00/10
All of the EM39 profiles for the basin have higher values near the surface andat the bottom of the bores (in the shoestring sands). If the soil had similartexture throughout the profile, this would suggest higher salinity levels atthese depths. The higher salinity levels near the surface correspond to thehigh salinity values observed from soil cores, for depths of up to a few metresbelow the basin; these clearly represent leakage via matrix flow from thebasin.
For most of the bores, there is a marked increase in the salinity of thegroundwater at the level of the shoestring sands. At intermediate depths,most profiles show little change in salinity (as shown in profile 4451)although, occasionally, salinity increases are seen throughout the profile (e.g.4449) or there is no change in the groundwater at all (e.g. 4458).
Figure 12. Apparent conductivity of soil below basin using EM39 (representative profiles shown).
The salinity of soilwater and groundwater beneath the basin indicates that leakage from the basin is spatiallyvariable. The most common profile, as shown for Bore 4451, suggests that leakage from the basin affects the salinityof the soil and groundwater immediately beneath the basin and that in the shoestring sands. Soil and groundwaterat intermediate depths are less affected. Less commonly, there is evidence of leakage affecting the whole of the soilmatrix (4449) or, alternatively, none of the soil matrix (4448).

Results from Girgarre Basin
35
Soil-physical measurements of water content ( g), particle size and soil-waterpotential (SWP) were undertaken to assist in determining factors that maybe controlling leakage.
A layer of black silty material was found at the base of each of the bays, thedepth of which ranges from ~100 mm to ~400 mm. The layer varied indepth within each bay and from bay to bay. The layer of silty material appearsto be less in Bay C than the other two bays. All of the cores appear saturatedthroughout, and for a distance of ~30 mm below the silty material. Belowthat depth, the samples appear unsaturated to the water table.
The soil in Bay A was categorised as Goulburn loam (with colour 7.5YR3/4)and that in Bays B and C as Congupna clay loam (10YR3/3). Thegravimetric water content for soil beneath the basin ranges from ~0.2 to~0.35 with a mean ~0.25 (Figure 13). Clay content for the soil ranges from ~20 to ~70% with a heavy clay layer ~0.5 m beneath the basin floor (Figure14). The range in the water content for the soil is, in part due to the differentclay content of the soil.
Figure 13. Gravimetric water content for soil beneath the Girgarre Basin
SWP measurements were made on core samples collected from beneath BayA (January 1997) and from short cores from each of the bays in February1998. The water table was ~1.5 m below the basin bottom when both sets ofcores were collected. Most samples are very close to saturated but, assuggested from visual observation, the samples are not saturated between thesilty material at the base of the bays and the water table (Figure 15).
CSIRO Land and Water Technical Report 16/00
5.4Soil Sampling

BAS IN LEAKAGE: SI TE STUDIES AT GIRGARRE AND GRIFFI TH
36 CRC for Catchment Hydrology Report 00/10
Figure 14. Clay content for soil beneath the Girgarre Basin.
There appears to be considerable variation in the SWP for the different cores,regardless of whether they are in the same bay or in different bays. Thevariation is most probably due to spatial variation in leakage rates betweenbays and within each bay. However, leakage from basin water while samplingthe cores may have resulted in erroneously low values for SWP for some ofthe cores (i.e. the soil may be less saturated than indicated from the analyses).
Clay contents in the soil are more than 30 % for most of the soil profile but highest at 0.5 – 1.0 m beneath the baseof the bays.

Results from Girgarre Basin
37
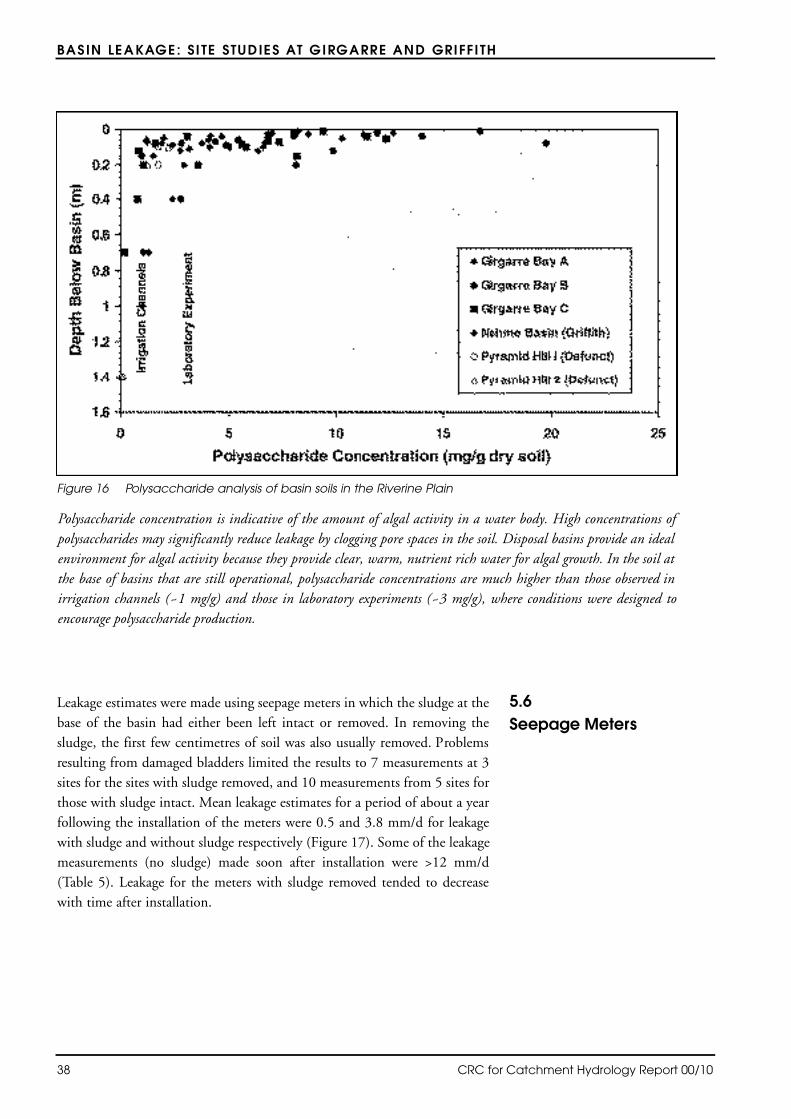
We measured the polysaccharide concentration of sediment in the soil at thebase of the bays at the Girgarre and Nehme (Griffith) basins (shown as solidpoints) and from soil at defunct basins at Pyramid Hill (shown as openpoints). For basins that are still operational, the polysaccharideconcentrations from the base of the basin to a depth of ~0.1 m. ranged from~1 to 20 mg/g dry sediment. The concentration decreased to <2 mg/g drysediment at a depth of 0.7 m. For comparison, we also show the results forsediment in irrigation channels and for a laboratory column experiment byRagusa et al. 1994, in which they seeded the soil with algal material. Thepolysaccharide concentrations are considered very high, reaching values ~4 to10 times than that found in irrigation channels and, in many cases, areg reater than the concentrations measured in the laboratory (seeded)experiments (Figure 16).
For the defunct basins, no samples were collected at depths less than 0.1 m.At depths greater than ~0.2 m, the polysaccharide concentrations wereusually less than those measured in the laboratory experiments and from thesediment in the irrigation channels.
CSIRO Land and Water Technical Report 16/00
Figure 15 Soil water potential (SWP) for soil beneath the Girgarre Basin
The throttle for leakage at the Girgarre Basin is close to the soil/basin water interface near to the base of the basin asevidenced by the permanent unsaturated zone beneath the basin. The unsaturated zone ranges from ~0.5 m to > 1.5m thick. Water table fluctuations beneath the basin are similar to those around the basin for areas within influenceof the groundwater pumps.
5.5 Polysaccharide
Analysis
BASIN LEAKAGE: SI TE STUDIES AT GIRGARRE AND GRIFFI TH
38 CRC for Catchment Hydrology Report 00/10
Figure 16 Polysaccharide analysis of basin soils in the Riverine Plain
Leakage estimates were made using seepage meters in which the sludge at thebase of the basin had either been left intact or removed. In removing thesludge, the first few centimetres of soil was also usually removed. Problemsresulting from damaged bladders limited the results to 7 measurements at 3sites for the sites with sludge removed, and 10 measurements from 5 sites forthose with sludge intact. Mean leakage estimates for a period of about a yearfollowing the installation of the meters were 0.5 and 3.8 mm/d for leakagewith sludge and without sludge respectively (Figure 17). Some of the leakagemeasurements (no sludge) made soon after installation were >12 mm/d(Table 5). Leakage for the meters with sludge removed tended to decreasewith time after installation.
Polysaccharide concentration is indicative of the amount of algal activity in a water body. High concentrations ofpolysaccharides may significantly reduce leakage by clogging pore spaces in the soil. Disposal basins provide an idealenvironment for algal activity because they provide clear, warm, nutrient rich water for algal growth. In the soil atthe base of basins that are still operational, polysaccharide concentrations are much higher than those observed inirrigation channels (~1 mg/g) and those in laboratory experiments (~3 mg/g), where conditions were designed toencourage polysaccharide production.
5.6Seepage Meters

Results from Girgarre Basin
39
Figure 17 Seepage estimates using seepage meters at the Girgarre Basin.
Seepage is considerably higher if the sludge is removed from the base of the basin. In most cases, particularly whenthe sludge was removed, seepage rate reduced a few months after installation.
CSIRO Land and Water Technical Report 16/00
Table 5 Leakage measurements using seepage meter (3 monthly intervals between Feb-Oct 1998).
Site # Comments Leakage 1 Leakage 2 Leakage 3 Average(mm/d) (mm/d) (mm/d) (mm/d)
A1 No Sludge 11.3 6.5 8.9
A3 Sludge 0 0 0 0
B1 No Sludge 6.2 1.3 3.7
B1 Sludge 2.6 0 1.3
B2 Sludge 0.5 0.5
B3 Sludge 0.9 0.5 0.7
C1 No Sludge 0 0.3 0.8 0.4
C1 Sludge 0 0.1 < 0.1
Average No Sludge 3.8
Average Sludge 0.5

BASIN LE AKAGE: SI TE STUDIES AT GIRGARRE AND GRIFFI TH
40 CRC for Catchment Hydrology Report 00/10
For all of the bays, there is a decrease in the soil-water chloride concentrationfrom the base of the basin (depth = 0 m) to a depth of ~2 m (Figure 18). Atthat depth, the soil-water chloride concentration is steady at ~3 g/L for BayA, at ~4.7 g/L for Bay B, and at ~6.2 g/L for Bay C. Results for [Cl] profilesfor the shorter cores are similar to those for longer cores in the same bay. Thewater level fluctuates by a metre or more beneath the basin but has not beenrecorded to drop below ~2 m below the basin base (i.e. the soil below 2 m ispermanently saturated).
Most of the salt build-up beneath the basin, at least for these sites, is withinthe top few metres of the base of the basin. Given that the water ranges from~0.5 to ~1.5 m table beneath the basin, this means that most of the increasein salinity of the groundwater is restricted to the top metre of the shallowgroundwater, and to the unsaturated zone above it.
Chloride data was also measured on soilwater for the deep cores in Bay Cfrom a site only covered with water during times when climatic conditions(high rainfall and low evaporation) result in the basin being >0.1 m deeperthan its design depth. At this site, the maximum soilwater chloride measurednear the base of the basin is lower than that measured at the sites in Bay Cwith permanent water cover. This is consistent with the leakage occuringduring periods of high rainfall when the basin salinity has been diluted.However, the chloride concentration of the soilwater tends to be higherthroughout most of the top 2 m of soil at the site with periodic wetting. Thissuggests maybe leakage is greater under these circumstances.
Figure 18 Chloride concentration of soilwater beneath the GirgarreBasin
At sites in the basin where there is permanent water coverage, most of the salineseepage is evident in the top metre of soil beneath the basin. At a site where water
5.7 Chloride andDeuterium ProfilesBeneath The Basin

Results from Girgarre Basin
41
cover is restricted to periods of high rainfall, saline seepage has progressed to twometres beneath the basin. Soilwater salinity for soil at depths greater than twometres are similar for all bays despite the large salinity range for the water in thebays overlying the soil.
For Bays A and C, the depth profiles of the 2H composition of soil-water asa function of depth are similar to [Cl] profiles of soil-water (Figure 19). Thesoil-water is enriched in 2H at the base of the basin, and decreases to aconstant value at a depth of about 2 m. For Bay B, the 2H composition ofsoil-water at depths below 2 m is enriched by at least 10%, compared to thatfor the soil-water in the other bays at the same depth. This may or may nothave resulted from contamination during sampling. It would require ~12%contamination of the soilwater by basin water to give the results for Bay Band a lesser amount (~4%) for the other bays. However, contamination ofthis magnitude is unlikely and hence, the results probably indicate a greaterrate of leakage at site B compared to that at the other sites. This conclusionis supported by data from groundwater sampling under the basin (Figure21).
Under saturated conditions, the chloride concentration of the soil-watershould be the same as the chloride concentration of the groundwater at thesame depth, providing sufficient time has elapsed to allow equilibrationbetween the smaller pores in the interstitial clay layers and the larger pores ofthe soil. Similarly, the 2H composition of the soil-water should be the sameas that in the groundwater. For the sampling period from August 1997 toFebruary 1999, the [Cl] for groundwater from bore samples beneath bays Aand C is relatively consistent (Figure 20).
CSIRO Land and Water Technical Report 16/00
Figure 19 Depth profiles for 2H composition of soil-water beneath the bays in the Girgarre Basin.
Soilwater in the top metre of soil beneath the basin is enriched in 2H (indicating a component of seepage from thebasin) compared to that at greater depths. For the soil under Bay B, the enriched 2H signature extends to at leasta depth of 4 m indicating seepage to greater depths at that site.

BASIN LE AKAGE: SI TE STUDIES AT GIRGARRE AND GRIFFI TH
42 CRC for Catchment Hydrology Report 00/10
The [Cl] concentration from bores beneath Bay C is only slightly greaterthan that beneath Bay A, while that for Bay B ranges from ~4,000 mg/L to~ 10,000 mg/L (i.e. from significantly less than to significantly greater thanthe other sites). This suggests that [Cl] in the groundwater under Bay B is notas homogenous as that for the other two bays, and that seasonal fluctuationsin the groundwater is causing groundwater of different [Cl] to move. Overall,a higher rate of leakage at the Bay B site ([Cl]Bay B = 10,000-20,000 mg/L) isprobably responsible for the groundwater not being homogeneous.
The 2H composition of groundwater shows similar fluctuations. In thiscase, groundwater beneath Bay B is enriched by ~10% compared to the othersites, this suggests that a component of leakage from the basin has reachedthe piezometer screen depth in Bay B (Figure 21).
Figure 20 Temporal changes in groundwater chloride concentration beneath the bays at the GirgarreBasin.
The chloride concentration of groundwater beneath Bays A and C (~4 m deep) is temporally constant for the studyperiod while that for bay B fluctuates by more than 6,000 mg/L. This suggests more movement of groundwater atthat site than at the other sites. The movement may be associated with the interaction of leakage water with thatpresent in rising and falling water tables.
(Middle)
(Middle)
(Middle)
(Edge)

Results from Girgarre Basin
43
Several approaches have been used to estimate leakage from the GirgarreBasin. "Whole of bay" estimates have been made using the chloride massbalance approach while tracer techniques and seepage meters have been usedfor "point estimates" of leakage. Results from these studies are as follows.
5.8.1 Whole of basin estimates
Chloride concentration was modelled for the three bays in the Girgarre Basinfor the period August 1987 to June 1998 using the spreadsheet modeldescribed earlier. Data for the model consisted of pan evaporation andrainfall measurements (from monitoring at Girgarre and at Shepparton) andchloride data for the input water to the basin. Input to the basin wascalculated from the water balance of the basin and leakage was chosen as avariable in the modelling exercise.
The theoretical chloride values were compared to the measured data (eithercalculated from EC data, pre 1995 or measured directly, post 1997) fordifferent combinations of leakage rate for the basins. The best-fit estimate forleakage was a constant leakage rate of 0.7 mm/d for Bay C and an initialleakage rate for Bays A and B of 1.5 mm/d from 1987 to early 1993 reducingto 0.7 mm/d from then to present (Figure 22).
CSIRO Land and Water Technical Report 16/00
Figure 21 Changes in 2 H composition of groundwater beneath the bays at the Girgarre Basin thebasin.
The temporal changes for 2H are similar to those observed for the groundwater chloride concentration. Theenriched composition under Bay B is consistent with higher leakage rates at that site.
5.8Estimation of
Leakage for theGirgarre Basin
(Middle)(Middle)(Middle)(Edge)

BAS IN LEAKAGE: SI TE STUDIE S AT GIRGARRE AND GRIFFI TH
44 CRC for Catchment Hydrology Report 00/10
The mean leakage rate for the basin for the period 1987-1993 is 1.4 mm/dand reduces by 30% for the period 1993-1998 (i.e. ~1 mm/d over the life ofthe basin). The leakage rate for the period 1987-1993 was estimated usingwater balance calculations to be 1.8 mm/d (Goulburn-Murray Water andSinclair Knight Merz, 1995), ~30 % higher than that estimated in this studyfor the same period.
Modelled cumulative pumped input to the basin was determined for the lifeof the basin, assuming the best-fit leakage scenario (above) and assumingconstant leakage rate throughout the life of the basin (Figure 23). Clearly,there has been a large reduction in leakage for the two larger bays of the basinsince early 1993. The reason for this is not clear although, at that time, aproblem with monitoring of the basin resulted in the bays approachingdryness. Why (or if) this should lead to a reduction in leakage for the next 5years to values close to that in Bay C is not known.
From 1987 to present, ~23,500 t of chloride (~ 41,200 t of salt) has beenpumped into the basin. In this case, the difference in leakage estimate usinga water balance approach, and that using changes in bay salinity, is about25%. The accuracy in the water balance measurement reflects the care andeffort taken during the study. However, it is possible to foresee situations
Figure 22. Measured and modelled changes in the chloride concentrations for water in bays A-C at theGirgarre Basin.
Using a chloride mass balance approach allows accurate estimation of leakage for the three bays in the Girgarre Basin.Leakage for Bay C (0.7 mm/d) was half that estimated for the other two bays (1.5 mm/d) until early 1993. Sincethen, all basins have had similar leakage rates of ~0.7 mm/d.

Results from Girgarre Basin
45
where the reliability of data used in the water balance may not be as accurateand larger errors may arise. The likelihood of large errors is increased forbasins with low leakage. Using a combined chloride/water balance approachwill uncover any such discrepancies.
5.8.2 Point estimates for leakage rate
Point estimates for leakage were determined, for the period of operation ofthe basin until the time of core sampling (1987-1997), by using the enriched[Cl] and 2H composition as a tracer of the movement of leakage, and forintervals of a few months during 1998 using seepage meters.
The methodology for estimating leakage from a basin using naturalabundance tracers such as chloride or 2H was described earlier in thisreport. It assumes that:
1. Leakage water has a different tracer concentration than the water intowhich the leakage is moving.
2. The depth of leakage is the same as the depth of tracer movement andthat depth is easily identified.
3. There is no contamination during sampling
4. Leakage is via piston-flow.
5. There is no lateral movement of leakage.
CSIRO Land and Water Technical Report 16/00
Figure 23. Observed and modelled cumulative water input to the Girgarre Basin.
The observed input to the Girgarre Basin decreases slightly post 1993 as a result of the reduction in leakage from BaysA and B. It is not clear why this occurs although the timing coincides with a period when the basins were nearly dryand basin salinity increased markedly.

BASIN LE AKAGE: SI TE STUDIES AT GIRGA RRE AND GRIFFI TH
46 CRC for Catchment Hydrology Report 00/10
For the studies in the Girgarre Basin, Assumptions 1 and 2 are justified,particularly for Bays B and C, but there are potential problems with theremaining three assumptions. T h e re is considerable potential forcontamination of soil samples as a result of seepage from the basin waterwhen coring through the base of the basin. This would lead to an over-estimation in leakage rate. Leakage may take place via preferential pathwaysor may move laterally upon entering the saturated zone. This would lead tounder-estimation of leakage rate.
The soil water chloride concentration and 2H composition profiles for eachof the basins are highest immediately below the soil surface. Except for the
2H composition profile in Bay B, the [Cl] concentration and 2Hcomposition of the soil-water (and groundwater) are near pre-basin levels ata depth of 1.0 to 2 m below the basin (Figure 18 and Figure 19). The shapesof the profiles suggest that either diffusion or mixing is occurring between theleakage from the basin and the existing groundwater. The seasonal changes inwater table as a result of groundwater pumping would tend to enhance themixing process.
Assuming that leakage has reached a depth half way along the zone ofdiffusion/mixing, then ~400 to 800 mm of water (the cumulative amount ofwater in the soil profile to a depth of 1 and 2 m respectively) has leaked fromthe basin since it was commissioned. Hence, using this approach, the leakagefor each of these bays since mid 1988 is estimated to be about 400 - 800 mmin 9 years. This equates to about 44-90 mm/yr (0.12 to 0.24 mm/d)assuming a constant leakage rate during that time. If we consider the resultsfrom the 2H composition profile in Bay B as valid (and not the result ofcontamination during sampling), the depth of leakage at that site may bedouble that seen at the other sites (i.e. ~0.5 mm/d).
The mean rate of leakage for the bays during this period, as determined fromthe whole of basin measurements, is ~3-10 times the point estimates. Thismay be because the spatial heterogeneity in leakage for the basin is notreflected in the limited number of sites sampled. Alternatively, one or moreof the assumptions is not valid.
Seepage measurements for sites with the sludge present ranged from 0.0 to2.6 mm/d (average 0.5 mm/d). The mean value for the seepagemeasurements (0.5 mm/d) agrees with the estimate for whole of basinleakage, using the chloride mass balance approach for the corresponding timeperiod (0.7 mm/d). However, given the limited number of measurements,this is more likely the result of good fortune than a statistically soundobservation. Nevertheless, the mean estimate for leakage using seepagemeasurements is 2–4 times the mean estimate using tracer techniques. Inaddition, there is a considerably larger range when using the seepagemeasurement. It is possible, therefore, that the assumptions that result inunder-estimation of leakage rate using tracer techniques are not valid in thissituation, and that preferential flow and/or lateral flow from the Girgarrebasin are significant and can not be ignored.

Results from Girgarre Basin
47
Results presented in this chapter clearly show that leakage from the Girgarrebasin does not proceed via a piston flow process in a well-defined plumebeneath the basin. Seepage through the base of the basin, as measured via theseepage meters, ranged from 0 to close to 3 mm/d. Beneath the basin, theevidence for piston type flow extends to a depth of 0.5 to 1.0 m for Bays Aand B and less for Bay C. At these depths, the soilwater salinity is similar tothat of the water in the basin. In fact, this is for areas with permanent watercover. In areas of periodic water coverage, the differences are even greater(Figure 19).
Once the leakage water reaches the zone at which the water table fluctuates(0.5 – 2 m beneath basin base), diffusion and lateral movement of the leakageresults in large temporal and spatial differences in water salinity. The extentof this is such that leakage measurements determined by tracer techniquesonly account for 25 – 50% of leakage from the basin (as determined bywhole of basin studies).
The remaining leakage clearly must diffuse laterally or leak vertically. Resultsfrom EM studies clearly show that much of the soil matrix is bypassed byleakage from the basin. Similar conclusions for secondary porosity were madeby Ife (1984) who found that vertical conductivities were extremely variableand, for some sites, much higher than expected given the soil classification.The amount of soil bypassed is difficult to determine; from an evaluation ofthe EM data, it is likely to represent 50-80% of the total soil matrix for thesoil matrix from 1-15 m beneath the basin. This is based on the overallfraction of EM data where there is an observed increase during the period ofmonitoring. We assume piston flow for the first metre of soil immediatelybeneath the basin in the following calculations.
The amount of pore space involved in the leakage process is therefore equalto the volumetric water content of the soil to a depth of ~15 m, multipliedby the fraction of the soil involved in the leakage process (unity for 0-1 mand 0.2-0.5 for 1-15 m). (estimated fraction of preferential flow). Using anestimate of 0.4 for volumetric water content, we suggest that approximately1.5-3 m of water has leaked vertically from the basin from the time fillingcommenced until the time when the salinity of groundwater was first noticed(6-10 years). Approximately 0.4 m of this leaked water is still within a metreof the base of the basin. In the first 6-10 years after filling commenced,approximately 3-4 m of water has leaked from the basin. In other words,depending on the values used in these calculations, it is possible that at littleas 30% or, at most, 100% of the leakage could be deep vertical leakage.
When all of these factors are considered, it makes definition of the plumedifficult. What is clear is that, due to preferential lateral and vertical flow,there will be a component of leakage extending well beyond the basin andinto the groundwater much sooner than would be expected if flow werepredominantly piston flow. This will result in a gradual increase in thesalinity of groundwater beside, and in the shoestring sand, beneath the basin.
CSIRO Land and Water Technical Report 16/00
5.9Preferential Flow
from the Basin

BASIN LEAKAGE : S ITE STUDIES AT GIRGA RRE AND GRIFFI TH
48 CRC for Catchment Hydrology Report 00/10
In summary, we suggest that the leakage for the Girgarre Basin:
• Has an average rate of ~1 mm/d over the 10+ year life of the basin.
• Has halved in rate for the second half of its operation.
• Has a spatial variability of several mm/d within bays and from bay to bay(at least spanning the range from 0 to 3 mm/d).
• Is "infiltration limited". There is an unsaturated zone beneath the basinfor most of the year.
• Moves by piston flow through the unsaturated zone and into the topmetre or two of the groundwater beneath the basin.
• Has mostly remained within a few metres of the water table and spreadslaterally within this zone possibly enhanced by water table fluctuations.
• Has a vertical component as little as 30 % or, in fact, most of the totalleakage. Vertical leakage by-passes most of the soil matrix beneath thebasin and then progresses in the direction of the groundwater pumps.
• The shallow open interception drain does not/can not intercept thelateral leakage occuring at greater than 2 m depth.
5.10Summary of LeakageRate and Process forthe Girgarre Basin

Results from On-farm Basins in the MIA
49
6. Result from On-farm Basins in the MIA
6.1.1 Initial filling
The initial vertical leakage of water from the basin was extremely rapid; waterentering the 7 m deep piezometer only 18 days after basin fillingcommenced. This can be equated to a mean leakage rate over that period ofabout 77 mm/day, if the volumetric soil water content moved from fieldcapacity (~0.22), to saturation (~0.42). It is probable, however, that this is anupper estimate, because preferential flow will result in part of the soil matrixbeing bypassed during the initial stage of leakage from the basin.Nevertheless, the rate of leakage is likely to be very high rate and beattributed to the dryness and well developed structural properties of the soilbefore basin filling.
6.1.2 Leakage by water and salt balance
Water balance estimates were started a month after basin filling, monthlyestimates are given in Figure 24. These values vary quite markedly frommonth to month due to errors in the water balance method, to give a clearerindication the results can be lumped into 4 time periods.
CSIRO Land and Water Technical Report 16/00
6.1Nehme Basin
Figure 24. Monthly leakage estimates for Nehme basin (1997-98) using the water balance method
Leakage from the Nehme Basin was high for the first month following filling but quickly reached a steady-stateleakage rate of ~3 mm/d after a few months use. After a few months when the basin was dry, the basin was refilledand continued to leak at ~3 mm/d.

BAS IN LEAKAGE: SI TE STUDIES AT GIRGARRE AND GRIFFI TH
50 CRC for Catchment Hydrology Report 00/10
For the first 3 months February-April the mean leakage rate was about 6.1 mm/d, for the subsequent 6 months (May-October) the mean leakagerate was 2.9 mm/d. In the following 4 months (November-February) themean leakage rate was 3.0 mm/d, at which point the ponds dried out for 6 months. In the 2 months (November-December) after subsequent refilling,the leakage rate did not appear to have changed much, at 2.6 mm/d.
These results can be compared with those obtained by salt balances over thesame periods (Figure 25). For the first two periods (when the basins are full)they give reasonably good agreement; however, in the drying phases andfilling phases, there is a greater difference between the measurements. In thedrying phase this is probably due to an inappropriate assessment of theinfiltrating water salinity; when drying occurs, the basin water salinityincreases rapidly, and also the assessment of the salt stored in or on thetopsoil, when the basin dries out. In the filling phase, there is difficulty inassessing the initial salt stored at the soil surface, which can either haveaccumulated over the dry period or, if it has rained, been leached.
Overall, these results point to initially very high leakage rates which havethen stabilised around 3 mm/day. These rates compare with infiltration testson similar soils by McIntyre et al (1982) who measured 14-31 mm/day inearly ponding to 0.15 - 0.5 mm/day 70 days later. Infiltration rates under ricein the MIA have also been measured by van der Lely and Talsma (1977) at0.3 and 1.7 mm/day, for transitional red brown earths and clay soilsrespectively. Both these workers, however, used water of low salinity (about0.2 dS/m), whereas the water entering the basin was about 11 dS/m.
Figure 25. Comparison between water balance and salt balance calculations for leakage estimationduring 1997 at Nehme Basin.

Results from On-farm Basins in the MIA
51
When conducting water balances for a basin to assess leakage it is importantthat measurements are as accurate as possible. In order to compute the waterbalance, 5 separate measurements are required. If each of these measurementsis in 10% error, without any compensation between errors, the derivedleakage rate can easily be in error by 20-80%.
A key difficulty arises from assessing the change in volume of ponds. Tominimise errors resulting from this, it is important to derive a volume: depthrelationship for the basin. When allowing for evaporation it is important toknow the water area contributing; thus a depth: area relationship is alsorequired. In estimating evaporation, an appropriate pan factor is required. AtNehme basin, the two pans in the water were found to be very close to ClassA pan evaporation, 1.04 and 1.06, whereas the two pans on the bank wereconsiderably higher, 1.22 and 1.32 (Figure 26). These results agree with theassessment of Morton (1986) that small water bodies should evaporate atabout the rate of a Class A pan, although they may actually evaporate at ahigher rate if the edge effects, as measured by the pans on the bank, aresignificant.
• Concentration factorsTracking basin water salinity, compared with the drainage water salinity,provides another gross measure of leakage. This works best over long periods,when there is little change in storage. For the Nehme basin, a period of 389days has been used when the ponds did not dry out. The salinity of thepumped and basin waters have been regularly monitored over that time(Figure 27).
CSIRO Land and Water Technical Report 16/00
Figure 26. Comparison of evaporation from pans in and around Nehme basin with meteorologicalmeasurement of pan evaporation at Griffith.
pan

BASIN LEAKAGE: SI TE STUDIES AT GIRGA RRE AND GRIFFITH
52 CRC for Catchment Hydrology Report 00/10
The average inlet salinity for that period was 12.9 dS/m, and for Bays 1 and2 was 15.3 and 21.9 dS/m respectively. Dividing the bay salinity by the inletsalinity gives concentration factors of 1.2 and 1.7 for Bays 1 and 2respectively. The pan evaporation from the Griffith weather station for thisperiod was 1953 mm, and rainfall 332 mm, giving a net evaporation of 1621 mm. Thus, dividing the net evaporation by the number of days givesan average net daily evaporation of 4.2 mm/d. Dividing this by theconcentration factor gives the leakage rate over that time; 4.2 / 1.2 = 3.5mm/d for Bay 1. For Bay 2 the concentration factor is 1.7 resulting in aleakage rate of 2.5 mm/d, an average of both bays giving 3 mm/d. This verysimple procedure can give a relatively accurate assessment of leakage rates. Inoverall terms for basins in the Riverine Plain, this procedure can be used as acheck of probable leakage rates, and is a fundamental method in trackinglong term changes in basin behaviour. Also importantly, as discussed earlierwith salinity data, basin leakage can be modelled.
6.1.3 Spatial distribution of leakage
• Seepage meters Together with the water balance studies, eleven seepage meters were used forpoint measurement of leakage during March and April, the 3rd and 4thmonths after filling. During this period the water balance estimate for totalleakage was ~5 mm/d. The seepage meters gave readings in the order of 0.1-1.2 mm/day with many negative values also. These readings wereconducted on a weekly basis; as such the time interval was inadequate and
Figure 27. Inlet water salinity and basin water salinity for Nehme basin.

Results from On-farm Basins in the MIA
53
associated errors large. A further trial with the seepage meters was conductedover a 140 day period, starting at the end of October. All the seepage meterswe re filled and left for the whole period. This yielded results from 0.4-5.2 mm/d (average 1.3 mm/d, standard deviation 1.6 mm/d). Duringthe same period, the water balance estimate for leakage was 3.0 mm/d. Soilparticle size analysis at various positions indicated that the high leakageseepage meter had about 10% less clay, 40% compared to 50% at the otherpositions, and that this was accompanied by a 10% increase in sand.Whether this small reduction in clay content would be responsible for anorder of magnitude increase in leakage is uncertain.
The seepage meter results indicate that point measurements tend tounderestimate leakage from a basin; there is a wide variability in leakageacross a basin, with tenfold differences possible. This shows that it isimportant to understand heterogeneity of soils when siting basins in order toa void localised areas of ve ry high leakage. This is best done by anelectromagnetic survey of the site e.g. using the Geonics EM31 or EM38, toassess the variability of the site.
CSIRO Land and Water Technical Report 16/00

BAS IN LEAKAGE: SI TE STUDIES AT GIRGARRE AND GRIFFI TH
54 CRC for Catchment Hydrology Report 00/10
• Electromagnetic surveyAn EM38 survey was conducted on the basin during a dry period after about17 months of ponded water. The results of the survey are plotted as apparentconductivity contours in Figure 28.
This EM38 survey found large variation in apparent conductivity across thebasin, up to a sixfold difference from highest to lowest conductivity areas.This could be reflecting variation in leakage across the basin, with lowerapparent conductivity indicating higher leakage. The lower conductivityareas are around the periphery of the basin, and may be due to greater leakagein these areas, or merely lower salinity in the bank and margins due to lessponding of water. However, there is large variation even in the base of thebasin indicating that leakage is non-uniform. It would have been useful toundertake EM surveys before basin construction to assess the variability insoils.
Figure 28. Apparent conductivity (salinity) of soil below Nehme basin by EM38 survey

Results from On-farm Basins in the MIA
55
• Soil samplingLeakage can also be assessed by the change in soil water quality below thebasin. After some period the soil water below the basin will take on thecharacteristics of the infiltrating basin water. The rate at which this occursdepends upon the rate of salt exchange between the pores and the soilsolution. However, the general movement of water can be assessed byconsideration of the differential between the upper and lower soil waterquality. Figure 29 shows soil water quality below the basin after 377 days ofponding.
The general soilwater chloride profile under the bay indicates high soilwaterchloride at the base of the basin, with much lower values between depths of~0.3 and ~4 m. At depths greater than ~4 m, the soilwater chlorideconcentration increases again. The mean salinity of the water in Bay 2 upuntil sampling was ~19 dS/m ([Cl] @ 4,400 mg/L). However, much of theleakage (particularly vertical leakage) occurred during the first few weeks,after filling the basin when the soil in the unsaturated zone became saturated.During this time, the mean salinity of water in Bay 2 was ~10 dS/m m ([Cl]@ 2,000 mg/L). This is approximately the salinity of soilwater for the depthrange 1.5 – 4 m beneath the basin floor.
Soilwater deeper than ~4 m is more saline than basin water. Hence, it appearslikely that, in this case, the leakage water from the basin ([Cl]soilwater <4,400 mg/L) is less saline than the soilwater immediately beneath the basin(soilwater chloride > 5,000 mg/L), and that leakage from the basin isfreshening the shallow soilwater. If this is the case, then it is probable that, atleast for this site, most of the deep vertical leakage resulted from leakageduring the filling of the basin when there was an unsaturated zone beneaththe basin. Whether or not this is the case for the rest of the basin is notknown.
CSIRO Land and Water Technical Report 16/00
Figure 29. Soil water chloride below Bay 2,Nehme basin,in March 98

BASIN LE AKAGE: SI TE STUDIES AT GIRGARRE AND GRIFFI TH
56 CRC for Catchment Hydrology Report 00/10
6.1.4 Lateral leakage
During the water balance periods, the flows from the interception drainsaround the basin were also monitored. Figure 30 shows the total leakageestimate split into that intercepted in the drains (termed lateral leakage) andthe remainder (termed vertical leakage). However the interception drainswill not intercept all the lateral leakage; thus, this will be an underestimate oflateral seepage, and hence an overestimate of vertical leakage.
In the initial 3 months, the component of total leakage that was collected inthe interception drains was about 23%; this was the period when thegroundwater mound was developing below the basin (Figure 31), whenvertical leakage was dominating. In the subsequent 6 month period (May-October), the total leakage decreased but lateral leakage remained at similarlevels; this accounted for 54% of the total leakage. In the drying down phaseof the subsequent 4 months (Nove m b e r - Fe b ru a ry), the total leakageremained similar; that intercepted in the drains was reduced to about 24 %of the total. This can be attributed to the reduction in basin water level andhence reduced heads for lateral flow (Figures 32 and 33).
These results indicate that a significant proportion (~25%), of leakage isrecycled in the interception drains, and that the subsurface pipe drainagesystem in the farm would also have the potential to recycle a significantproportion of the basin leakage. In the refilling phase of November-December, the total leakage was similar to the drying phase; however, thelateral leakage has dropped to only 12% of the total. This may be attributedto greater vertical leakage again, as in the first filling as the unsaturated zonebecomes saturated and the groundwater mound redevelops.
Figure 30. Monthly estimates of vertical and lateral leakage for Nehme basin

Results from On-farm Basins in the MIA
57CSIRO Land and Water Technical Report 16/00
Figure 31 Relationship between effective leakage (total leakage less that measured in interceptiondrains) and piezometer levels below the basin.
As the unsaturated zone beneath the basin approaches saturation and the water table rises, vertical leakage from thebasin decreases.
Figure 32 Temporal variation in the flow in interception drains for Nehme Basin
The interception drain ceases flowing when the basin is empty. This suggests that the drain is intercepting leakageprimarily from the basin and not groundwater.

BASIN LEAKAGE: SI TE STUDIES AT GIRGA RRE AND GRIFFITH
58 CRC for Catchment Hydrology Report 00/10
• Isotope analysis for determining leakage plumeThe leakage plume from the basin has been monitored since the soil belowthe basin became saturated. This was done by measuring changes in thesalinity and isotopic signature of water in piezometers sited beneath thebasin, in the interception drain around the basin, and for shallowgroundwater in a transect away from the basin. The isotopic signature of thewater in the basin is considerably enriched compared to that of thegroundwater, while there is less of a difference in the salinity of the basin andthe groundwater. In fact, for much of the time that the basin has beenmonitored, the basin water (and hence leakage water) has been less salinethan the groundwater beneath the basin. For this reason, we havep redominantly used the results of isotopic analyses in the follow i n ginterpretation.
Prior to the filling of the basin, the soil beneath the basin was unsaturated toa depth of at least 7 m. Immediately after filling commenced, piezometersbeneath the basin indicated that the unsaturated zone beneath the basin thebasin was becoming saturated. The process did not involve wetting from thebottom up or from the top down but rather a change in saturation statusthroughout the profile. After a period of two months, the zone beneath thebasin was saturated and a permanent groundwater table established.
After the soil became saturated beneath the basin, the leakage rate from thebasin decreased significantly to ~3 mm/d. During that time, the deuteriumcomposition of the water increased from –15 to +25 and from 0 to +60%V-SMOW in the first and second bays respectively. For the correspondingperiod, the deuterium composition of the water increased from –22 to –1and from –14 to –1% V-SMOW for the interception drains along side thefirst and second bay respectively (Figure 34). Clearly, this demonstrates thata component of leakage is collected by the interception drain, and that thereis a lag time for the leakage to reach the drain.
Figure 33. Measurements of the flow in interception drains and water level in Bay 2 at Nehme Basin.
Flow to the interception drain is primarily determined by the height of water in the basin.

Results from On-farm Basins in the MIA
59
During the same period, there was very little change in the salinity of thewater in the interception drains and, for most of the time, not much changein the salinity of the water in the bays in the basin (Figure 35). During thesummer months (December 1997-January 1998), there was an increase inthe salinity of the water in the second bay. This was not reflected in anincrease in the salinity of the water in the interception drain. This suggeststhat, in this case, the isotopes are providing a more sensitive indicator ofleakage to the interception drains. This is probably because the salinity ofwater leaking from the basin is similar to that already present in the soilwater,while there is significantly greater differentiation between the isotopes of thesoilwater and the leakage.
In August 1998, samples of groundwater were collected from shallowgroundwater (~0.5 m below the water table), in a transect perpendicular tothe basin extending outward 100 m into the vineyard. Deuterium analyseson these samples were most enriched close to the basin and decreased withdistance from the basin (Figure 36). At distances greater than ~20 m, thewater samples from both transects had similar levels of deuterium.
CSIRO Land and Water Technical Report 16/00
Figure 34. Changes in deuterium composition of interception drain water at the Nehme basin.
The 2H signature of water in the interception drains provides a good indication of the amount of basin waterintercepted because of the significant differential between the 2H composition of existing soilwater and water in thebasin. A small component of the leakage water is evident in the intercepted water, clearly mixing with existingsoilwater.

BAS IN LEAKAGE: SI TE STUDIES AT GIRGARRE AND GRIFFI TH
60 CRC for Catchment Hydrology Report 00/10
Figure 35. Changes in salinity of interception drain water and basin water at the Nehme basin.
Unlike 2H, EC measurements do not provide a good indicator of whether or not basin water is being interceptedby the interception drain. The EC of basin water and that in the soilwater is similar for most of 1997
Figure 36. Deuterium composition of shallow groundwater, transect from basin.
Basin water values
Interception drain valuesHigher values due tolateral leakage

Results from On-farm Basins in the MIA
61
When this data is combined with the deuterium data from the bays in thebasin and the interception drains near to the bays, it is clear that there isevidence of a component of lateral leakage extending ~20 m from the basin.The shallow layer of lateral leakage has taken place in the eight month periodfollowing the filling of the basin. However, flow was not via piston flow,because the isotopic signature of the groundwater was still considerablydepleted when compared to that of the water in the basin.
6.1.5 Summary of leakage from Nehme basin
• Total leakageA summary of all the leakage measurements from the basin over time and fordifferent techniques is given in Table 6.
It is apparent that the initial leakage from the basin was very high for a periodup to 18 days after the basin commenced filling. At that time, water reachedand started to fill a 7 m deep piezometer. Due to the very deep unsaturatedlayer initially, the leakage rate over that period was estimated at up to 77 mm/day, assuming that there was no preferential flow and estimates ofp refilling soil moisture content are valid. These assumptions arequestionable, given the observed soilwater chloride profiles beneath thebasin.
Subsequent salt and water balance estimates found that basin leakagestabilised at about 3 mm/day.
Point estimates by seepage meter were extremely variable, ranging from 0.4 – 5.2 mm/d. During the same period the water balance estimates werethat leakage was 3.0 mm/d. This indicates that leakage is highly variableacross the basin, a figure supported by a sixfold variation in apparent soilconductivity from EM38 survey.
CSIRO Land and Water Technical Report 16/00
Table 6 Leakage summary for Nehme basin
Period Technique Leakage rate (mm/d)
Initial 18 days after filling Filling of 7 m deep piezometer up to 77 (probably considerably less)
Months 2 –4 after filling Water and salt balance 6 - 7
Months 4-14 Water and salt balance 2.9 – 3.0
Refilling after 6 months dr y Water and salt balance 2.6
Months 2 – 13 Concentration factor 3
Months 6 - 9 Seepage meter 0.4 – 5.2 (Av. 1.3, S.D. 1.6)

BASIN LEAKAGE : SI TE STUDIES AT GIRGA RRE AND GRIFFI TH
62 CRC for Catchment Hydrology Report 00/10
The water balance method estimated leakage to average 3.7 mm/d. However,this does not account for the initial very high leakage period. The leakage bywater and salt balance account for 1439 mm of leakage, not including thefirst 24 days of basin filling. The soil sampling suggests a total leakage of1594 mm. The 155 mm difference may be due to initial leakage beforei n t e n s i ve water balance analysis started; if so, the leakage over this 24 day period would equate to about 6.5 mm/d leakage. This is similar to the5-9 mm/d measured by salt and water balance in the first three months.These results would indicate that the initial estimates of leakage by waterreaching a piezometer are inaccurate. If this is so, then it is probable that notall of the profile became saturated during the early stages following filling;preferential flow has resulted in leakage reaching the deepest piezometerearlier than expected via piston flow.
The soil water chloride leakage analysis is clearly in the same order ofmagnitude as the water and salt balance estimates, and thus provides anindependent check on leakage values derived by calculation. It is interestingthat the results from the two soil cores are similar, despite having been takennear the highest and lowest leakage values measured by the seepage meters.This may indicate that leakage is highly variable in the surface layers, but thisvariation is ‘smoothed out’ with depth, due possibly to less variation in soilparameters and potentials in the deeper layers.
• Lateral leakageLateral leakage is taken as that measured in the interception drains. Thesedrains, however, are unlikely to collect all the lateral leakage, as indicated bythe stable isotope analysis of shallow groundwater outside the interceptiondrains.
Initially, during the period when the groundwater mound was developingbelow the basin, the component of total leakage that was collected in thei n t e rception drains was about 23%. Su b s e q u e n t l y, the total leakagedecreased, but lateral leakage remained at similar levels; this accounted forabout 50% of total leakage. The changes in flows in the interception drainare strongly related to the head of water in the basin, when the groundwatermound is fully developed under a basin.
Over the period of monitoring, the mean disposal rate to the basin was 5 mm/d. Of this, it would appear that 0.5-1 mm/d was water from theinterception drains, representing 10-20% of the total input to the basin.

Results from On-farm Basins in the MIA
63
• Leakage plume
The volume of groundwater/soilwater that has been influenced by leakagefrom the basin appears to be about 5 m depth below the basin (by soil waterchloride analysis), and about 20 m from the edge of the basin in the shallowgroundwater (by deuterium analysis). However, it is possible that most of thisvolume may have been influenced during the short time frame followingfilling, when the soil beneath the basin became saturated. Thus, overall, itwould appear that under the 2 ha of basin the groundwater has been affectedto 5 m, and about an additional 1 – 2 ha has been affected around the basinin the shallow (<2 m depth interval) groundwater. For much of this area,there has only been a small component of leakage mixing with the existingwater (i.e. the salinity and isotopic signature of the soilwater andgroundwater is much closer to that for the pre-existing water than that forthe leakage). The depth to which leakage has impacted on the groundwateraround the basin is not known.
In the MIA there are at present 14 on-farm evaporation basins. These varymarkedly in shape, size, drainage water salinity and management (Table 7).However, they are all sited on clay soils and receive water from subsurfacepipe drainage schemes; all have interception drains around their perimeter.
Table 7. Summary of on-farm evaporation basin characteristics in theMIA.
Average Minimum Maximum
Basin area (ha) 4 0.6 14
Drained area (ha) 80 22 257
Percent of drained area 4 2 9
Percent of basin area utilised 37 0 100
Drainage water salinity (dS/m) 12 2 25
Basin water salinity (dS/m) 23 6 80
6.2.1 Leakage by water and salt balance
Measurements were only taken on a monthly basis, for a period of 18months, so that of these 14 basins there were only four that providedsufficient data for estimates of leakage. The key difficulty was that manybasins dried out intermittently which, when only monthly measurements aremade, makes estimates of leakage impossible. Leakage for the four basins wasestimated by water balance using electricity readings from the pumps and
CSIRO Land and Water Technical Report 16/00
6.2Other Basins in
the MIA

BASIN LEAKAGE: SI TE STUDIES AT GIRGA RRE AND GRIFFITH
64 CRC for Catchment Hydrology Report 00/10
also by salt balance on the basis of salt additions and change in salt stored. Afurther gross estimate of leakage was made using the concentration factormethod, which took average drainage and basin salinities with the panevaporation and rainfall measured at Griffith for 560 day period (Table 8).
The water balance estimates of leakage in most cases appear very high, andare considerably higher than the salt balance estimates. This can be attributedto problems in the estimation of evaporation due to variations in the basinarea, errors in basin area estimates and also variation in rainfall. In the saltbalance, only the pumping, drainage salinity, starting and finishing volumeand average basin salt concentration over the period are required. This limitserrors, although the starting and finishing volumes may be a problem, andthe volume pumped into the basin can be a considerable problem. Theestimates by concentration factor tend to agree closely with the salt balanceestimates. The salt concentration factor method had a distinct advantage insuch a survey in that knowledge of pumping or storage volumes was notrequired.
6.2.2 Lateral leakage
For two of the ponds, flow in the interception drains was measuredoccasionally and was found to represent a very high proportion (82-88%) ofthe total estimated leakage. Both of these ponds had relatively deep water,800-1000 mm, and poorly constructed banks that allowed rapid lateralseepage. These lateral flows represent 26-32% of the total water additions tothe ponds. As such, in these ponds, it would appear that a very highproportion of the leakage is being rapidly recycled. The high rate of recyclingis not beneficial, as it increases cost of operation and reduces pump systemcapacity for drainage from the farm.
Table 8. Summary leakage data from four MIA on-farm basins
Farm Leakage by Leakage by Concentration Leakage by Interceptionwater balance salt balance factor concentration factor flow
(mm/d) (mm/d) (mm/d) (m3/d/m)
A 5.9 3.5 1.30 3.8 2.9 0.09
B 7.5 4.4 1.26 3.9 3.9 0.11
C 7.9 4.8 1.01 4.8 NA NA
D 6.3 5.4 1.14 4.3 NA NA
Average 6.9 4.5 1.2 4.2
Nehme 3.7 3.0 1.45 3.0 1.5 0.05
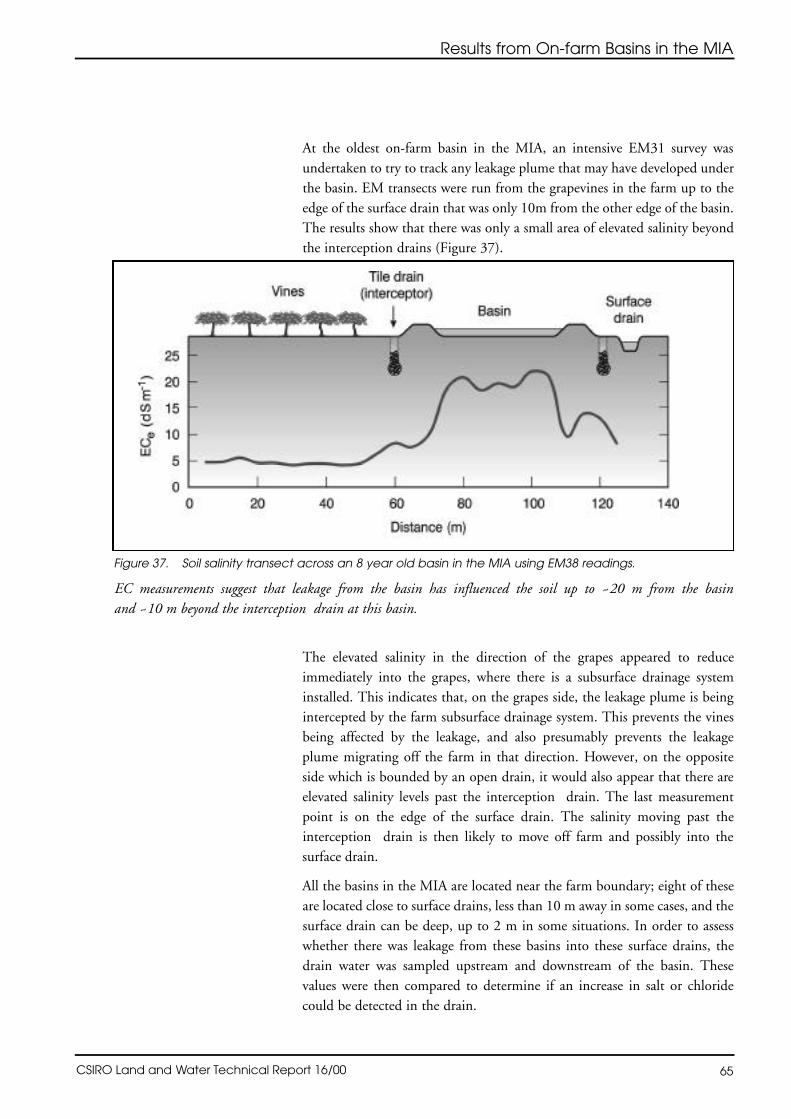
Results from On-farm Basins in the MIA
65
At the oldest on-farm basin in the MIA, an intensive EM31 survey wasundertaken to try to track any leakage plume that may have developed underthe basin. EM transects were run from the grapevines in the farm up to theedge of the surface drain that was only 10m from the other edge of the basin.The results show that there was only a small area of elevated salinity beyondthe interception drains (Figure 37).
The elevated salinity in the direction of the grapes appeared to reduceimmediately into the grapes, where there is a subsurface drainage systeminstalled. This indicates that, on the grapes side, the leakage plume is beingintercepted by the farm subsurface drainage system. This prevents the vinesbeing affected by the leakage, and also presumably prevents the leakageplume migrating off the farm in that direction. However, on the oppositeside which is bounded by an open drain, it would also appear that there areelevated salinity levels past the interception drain. The last measurementpoint is on the edge of the surface drain. The salinity moving past theinterception drain is then likely to move off farm and possibly into thesurface drain.
All the basins in the MIA are located near the farm boundary; eight of theseare located close to surface drains, less than 10 m away in some cases, and thesurface drain can be deep, up to 2 m in some situations. In order to assesswhether there was leakage from these basins into these surface drains, thedrain water was sampled upstream and downstream of the basin. Thesevalues were then compared to determine if an increase in salt or chloridecould be detected in the drain.
CSIRO Land and Water Technical Report 16/00
Figure 37. Soil salinity transect across an 8 year old basin in the MIA using EM38 readings.
EC measurements suggest that leakage from the basin has influenced the soil up to ~20 m from the basin and ~10 m beyond the interception drain at this basin.

BASIN LEAKAGE: SI TE STUDIES AT GIRGA RRE AND GRIFFITH
66 CRC for Catchment Hydrology Report 00/10
Of the eight basins, an increase in the downstream water salinity was onlydetected for three. These three basins increased the surface drain watersalinity by 1.3 to 2.6 times on average across the period of monitoring.However, the maximum increases measured at the basins ranged from 5.5 to7.5 times. The worst two basins showed average increases in salinity from 2 dS/m upstream to 5 dS/m downstream, and 0.3 dS/m upstream to 1 dS/mdownstream. The salt load discharging into these drains from the evaporationbasins is not known. The basins that were discharging into the surface drainshad several factors in common: edge of basin less than 15 m from the surfacedrain, surface drain 1 to 2m deep, basin kept very full, pump turned off forperiods when basins very full and thus interception drains not functioning.

Conclusions
67
7. Conclusions
These field studies show that leakage from evaporation basins va r i e stemporally and spatially. The Girgarre system has been functioning for 13 years and appears to have prolonged periods during which the leakage ratehas been quite stable. For the first half of its life to date (6 or 7 years), theleakage rate for the basin was ~1.3 mm/d. For the second half of its life todate, the leakage rate decreased by approximately half.
The Nehme basin, by contrast, has displayed varied leakage rates over a shorttime interval. Leakage rates were very high at filling, then stabilised aftersome months to about 3 mm/d. The leakage rate remained stable for about12 months until drying out. It is not known if this will be the long termleakage rate.
The leakage rate from small (< 5ha) evaporation basins in the MIA was in therange of 3.5 –5.4 mm/d, considerably higher than that for the much larger(30 ha) Girgarre basin (~1 mm/d).
Salt balance estimates are more reliable in estimating leakage than using awater balance. The method of comparing drainage water salinity to basinwater salinity "concentration factor" is simple and useful for stable basinsystems. The use of a salt and water balance model can be used to assess andtrack leakage rates accurately in the long term.
If the groundwater mound below a basin is not fully developed, it is likelythat vertical leakage will dominate and lateral leakage will be much less. Thisis likely to be the case soon after a basin is filled, and may also be the case forareas where water control is via groundwater pumping. Under tile drainsystems, once the groundwater mound is developed, vertical leakage isreduced and lateral leakage becomes at least 50% of the leakage for the smallbasins in the MIA. A significant proportion of leakage is recycled in theinterception drains. It is likely therefore that the subsurface pipe drainagesystem in the farm will also have the potential to recycle a significantproportion of the basin leakage (however, this has not been demonstrated inthis study).
Piezometers and natural tracers can be used to track the development of thesaline leakage plume below and around a basin. It would appear that acomponent of leakage in the Nehme basin has reached 5 m below the basinand up to 20 m outside the basin. At Girgarre, the main part of the salinityplume has moved 2-4 m deep below the basin. However, there is strongevidence of leakage impacting in the shoestring sands, 10-15 m below thebasin. This contamination must have occurred primarily by preferential flow.
CSIRO Land and Water Technical Report 16/00

BAS IN LEAKAGE: SI TE STUDIES AT GIRGARRE AND GRIFFI TH
68 CRC for Catchment Hydrology Report 00/10
In the shoestring sands, the saline leakage plume has moved a short distanceoutside the basin (20-50m), predominantly in the direction of thegroundwater pump. Thus, this leakage should be eventually captured by thegroundwater pump.
From the results of these studies, it is clear that evaporation basins should besited a suitable distance away from surface drains. For tile drainage systems,the interception drains around the basin should be on a separate pump fromthe main subsurface drainage pump. A separate pump ensures that theinterception drains will continue to function, even if the main subsurfacedrainage pump is turned off. Where a groundwater pump is used, then thebasin should be positioned such that leakage will be in the capture zone ofthe pump.
These results also show that basins sited within the drainage system have thebest possibility for containment of the saline leakage. Basins sited on theedge, or away from, the drainage system run the risk of not containing thesaline leakage that may migrate off farm and contaminate groundwater orsurface water features.
The results from these site investigations, when combined with those fromprevious studies on basins in the Riverine Plain, provide the basis forestimates of the disposal capacity for disposal basins in the Riverine Plain (aspresented in the companion report, Leaney and Christen, 2000).

References
69
8. References
Butler, B.E (1979). A soil survey of the horticultural soils in the MurrumbidgeeIrrigation Areas, New South Wales. Bulletin No. 289, CSIRO, Melbourne.
Cook, P.G., Hughes, M.W., Walker, G.R. and Allison, G.B. (1989) Thecalibration of frequency-domain electromagnetic induction meters and theirpossible use in recharge studies. J. Hydro., 107:251-265.
Dighton, J.C., Leaney, F.W., Herczeg, A.L., Allison, G.B. and Hughes, M.W.(1997) A rapid and robust method for the preparation of isotopically unalteredhydrogen gas from water for stable isotope mass spectrometry. 6th Australian-New Zealand En v i ronmental Isotope Conference, Wellington, NewZealand, 2-4 April, 1997
Goulburn-Murray Water and Sinclair Knight Merz (1995) Girgarre salinitycontrol project draft June 1995.
Greacen, E.L., Walker, G.R. and Cook, P.G. (1987) Evaluation of the filterpaper method for measuring soil suction. Proc. Int. Conf. Meas. Soil and Plantwater Status, Utah State Uni, July, 1987.
Ife D. (1984) Salinisation and groundwater studies in the Shepparton Region,Project Report for Master of Applied Science, Melb Uni, 1984.
Jolly, I., Christen, E., Gilfedder, M., Leaney, F. and Walker, G. (2000)Guidelines for basin use. Technical Report CRC for Catchment Hydrology00/7, CSIRO Land and Water 12/00.
Leaney, F.W.J. and Christen, E. (2000) Evaluating basin leakage rate, disposalcapacity and plume development. Technical Report CRC for CatchmentHydrology 00/11, CSIRO Land and Water 17/00.
Lewis, D.W. (1983) Practical Sedimentology, Hutchinson Ross, Pennsylvania.
Morton, F.I. (1986). Practical estimates of lake evaporation. Journal of Climateand Applied Meteorology, 25(3), 371-387.
McBride and Pfannkuch (1975) The distribution of seepage within lakebeds.J.Res.US Geol Surv. 3: 505-512
McIntyre, D.S., Loveday, J. and Watson, C.L. (1982). Field studies of waterannd salt movement in an irrigated swellling clay soil. 1 Infiltration duringponding. Australian Journal of Soil Research 20:90-91
CSIRO Land and Water Technical Report 16/00
BASIN LEAKAGE : SI TE STUDIES AT GIRGA RRE AND GRIFFI TH
70 CRC for Catchment Hydrology Report 00/10
Ragusa, S.R., De Zoysa, D.S. and Rengasamy, P.R. (1994) The effect ofmicroorganisms, salinity and turbidity on hydraulic conductivity of irrigationchannel soil et al. Irrigation Science 15: 159-166.
Revesz, K. and Woods, P.H. (1990) A method to extract soil-water for stableisotope analysis. J. Hydrol. 115:397-406.
Taras, M.J., Greenberg, A.E., Hoak, R.D. and Rand, M.C. (eds) (1975)Standard methods for the examination of water and waste water. AmericanPublic Health Assoc., USA 14th Ed. pp 613-614.
Van der Lely, A. (1974) A statistical survey of hydraulic conductivity valuesobtained by the auger hole method in the MIA. Water Conservation andIrrigation Commission, Leeton, NSW.
Van der Lely, A. and Talsma, T. (1977) Infiltration and water movement inRiverine Plain soils used for rice growing. In The Hydrology of the RiverinePlains of South-East Australia. Conference of the Riverina Branch of theASSSI. Eds R.R. Storier and I.D. Kelly.

Appendix A
71
Appendix A. Analytical Methods for Soil Analyses
Gravimetric water content
Calculated from the difference in weight of the soil sample and the sampledried at 1050 C for 24 h divided by the dry weight of soil.
Soilwater chloride concentration (as per Taras et al., 1975)
The amount of chloride in the soil (soil chloride ie. mg of Cl per kg of drysoil) was determined by extracting the chloride from soil samples using a 5:1dilution with water. Soilwater chloride (mg of Cl per Litre of water) wascalculated by dividing the soil chloride by the gravimetric water content.
Soilwater potential (as per Greacen et al., 1987)
Soilwater potential measurements were made by placing three 55 mmWhatman 42 filter papers at three levels in a 500 ml glass jar filled with soilcompacted using a rubber plunger. The SWP of the soil equilibrates with thefilter paper. The amount of water in the filter paper indicates the SWP of thefilter paper and hence, the soil.
Particle size analysis (as per Lewis 1983)
The percentage of different particle size fractions was determined using thepipette method (Lewis, 1983) using air dried soil samples. Sand is consideredto be coarser than 0.02 mm, silt between 0.02 and .002 mm and clay to befiner than 0.002 mm (2000 micron).
Analysis of stable isotopes
Water was extracted from ~100 g of soil by azeotropic distillation withkerosene (Revesz and Woods, 1990). Saline water samples were similarlytreated to produce water suitable for isotopic analysis.
The deuterium composition of water ( 2H) was measured by standardisotope ratio mass spectrometry. 2H was measured after reduction of waterover hot uranium (Dighton et al., 1997).
CSIRO Land and Water Technical Report 16/00