assessing the risk of co2 leakage & induced seismicity ... · assessing the risk of co 2...
TRANSCRIPT

Assessing the Risk of CO2 Leakage & Induced Seismicity Across the Illinois Basin
Mark Person & Yipeng Zhang; NM Tech Mike Celia, Karl Bandilla, Tom Elliott; Princeton University John Rupp, Kevin Ellet; Indiana Geological Survey Brenda Bowen, Purdue University (University of Utah) Carl Gable, Los Alamos National Lab
Aquifer Porosity, Knox Formation, Illinois Basin
Power Plant Locations, Illinois Basin

Goals of Study DE-FC26-FE001161
• Develop & Test New Multi-Layer Sharp-Interface Models of Basin Scale CO2 Sequestration
• Build 3D Hydrostratigraphic Framework model for Illinois Basin
• Represent Spatial Variations in Reservoir & confining unit Petro-physical Properties
• Test Petro-physical model by: a) Matching drawdown patterns in Cambro-Ordovician Aquifers using historical pumping data b) Matching regional salinity & stable Isotope patterns which have developed on geologic time scales • Apply Model to Illinois Basin to Assess:
a) Potential for CO2 Leakage through wells and fault zones due to basin wide CO2 injection b) Potential for induced seismicity

Sharp-Interface Model Approach
• Multi-Layer (7-10 layers represented in Illinois Basin)
• Transmissivity Based Flow Equations, one for each fluid Phase (3D 2D)
• Position of the Sharp-Interface are the Unknown Variables
• Leakage up Wells and Faults
• Governing Equations solved both Analytically & Numerically

Critical Pressure (Pcrit) & Failure Criteria (FC)
v - vertical loading, h - hydraulic head z - elevation,
- fluid density g - gravitational acceleration
1 – maximum horizontal stress
3 – minimum horizontal stress
Pcrit v(3 1)/2
critPgzhFC )(
Assumptions: Fault plane has no cohesion Fault is critically stressed Maximum horizontal stress( ) is close to vertical loading ( v ) Coefficient of friction ( ) is 0.6
Variables: 2
),(
3 Pcrit
Pcrit
1 Pcrit
S
S
arctan
PHydrostatic
Nicolson & Wesson (1990)

7 Layer Model of Illinois Basin Aquifer-Confining Unit System
Indiana Geological Survey

Develop Petrophysical Models
log10(k) a b
o exp e ir
porosity
Irreducible porosity
rock compressibility
permeability fit coefficients
initial porosity at sediment- water interface

Example of Heterogeneity Represented in Model: Mt. Simon (AQ1)
Depth (m) Thickness (m) Permeability (mD)
Bandilla et al (2012)

Model Calibration to Historical Pumping of Cambro-Ordovician Aquifer around Chicago
Regional Salinity Patterns
Model Calibration
- obs
- Model
- Observed
Location Observation Points
Cross Section Location
Person et al (2012)

Simulated Injection Pressure
208 MT/yr CO2 Injection after 50 Years
Illinois Basin CO2 Sources
Bandilla et al (2012)

Simulated CO2 Footprint & Leakage Estimates
50 Years 100 Years
Bandilla et al. (2012)

Wells Completed in Mt. Simon
CO2 Leakage into St. Peter
Bandilla et al. (2012)

Key Findings
• Pore pressure envelope propagation on the order of 50 km laterally
• Pore pressures in Knox may approach Frac Limit if Injection rates are high, many wells would be needed
• Risk of CO2 leakage along abandoned wells is minimal
• Risk of Lateral Brine Migration is Low
• From the Perspective of Upward Leakage, the Mt. Simon appears to be a Good Choice for CCS
But What About the Risk of Induced Seismicity?

Data sources: Zoback and Zoback (1989); Nicholson and Wesson (1990); Wheeler and Cramer (2002); Person et al. (2010) Ohio Natural Resource Department (2012); Horton (2012); Baker Hughes, http://gis.bakerhughesdirect.com/RigCounts/default2.aspx
Midcontinent Seismicity
Zhang et al. (2012)
Additional Collaborators: Jim Evans, Tom Dewers, Peter Mozley

Key Observations of Injection Schemes Associated with Induced Seismicity
1. Largest induced Earthquakes always occur in crystalline basement
2. Injection is typically into basal aquifer with no bottom seal separating the injection horizon from crystalline basement (Ashtabula, Ohio, Guy, Arkansas)
3. In some instances, injection was directly into crystalline basement (e.g. Youngtown Ohio, Rocky Mountain Arsenal, Colorado).
Zhang et al. (2012)

Key Observations on Injection Pressures Associated with Induced Seismic Events
1. Injection Pressures were well below the frac limits (80% of lithostatic pressure)
2. These are Pressures at the injection site. Pressures at the earthquake foci (up to 10 km away) were much lower.
1. This indicates faults that
failed must have been critically stressed (typically the orientation of 1 ~ 30o to failure plane).
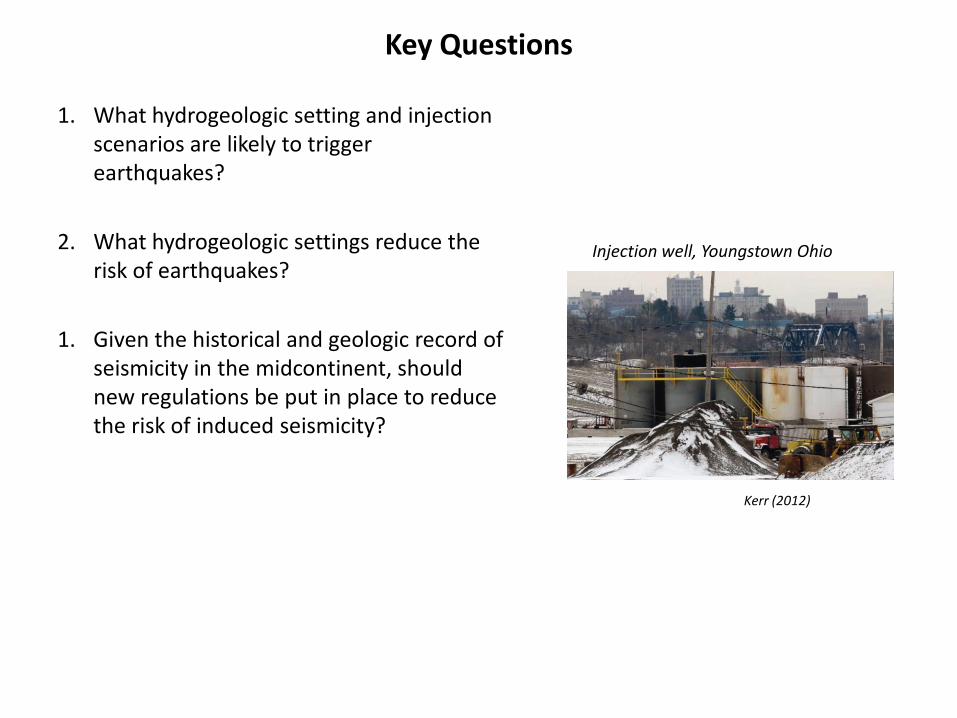
Key Questions
1. What hydrogeologic setting and injection scenarios are likely to trigger earthquakes?
2. What hydrogeologic settings reduce the risk of earthquakes?
1. Given the historical and geologic record of seismicity in the midcontinent, should new regulations be put in place to reduce the risk of induced seismicity?
Kerr (2012)
Injection well, Youngstown Ohio

Sensitivity Analysis

Effect of Petrophysical Properties
Vary Permeability of Basal Aquifer (A1), the Crystalline Basement (C1) and Top Seal (C2)
(C1) (A1) (C2)
Crystalline Basement Permeability

Comparison of Permeability Range Used in Sensitivity Study to Core Permeability-Porosity Data from Illinois Basin
Blue or red dots denote the observed permeability values of carbonates and sandstone respectively. Green and purple dots denote observed permeability values of shale. The strata that we have observed permeability data available are indicated in the left plot. Single black dots indicate the permeability value we used in our model, black bars denote the range we varied and black dots in the middle of the bar denote the base case value used in our model

Varying Crystalline Basement Permeability
Varying Reservoir Permeability
Varying Top Confining Unit Permeability
Low K High K
Low K High K
Low K High K
What conditions promote Induced seismicity?

Basal Aquifer Injection
Middle Aquifer Injection
Effect of Injection Scheme

Effect of Proterozoic Normal Faults
Low K Fault Intermed. K Fault High K Fault
Low K Fault Intermed. K Fault High K Fault
Fau
lt 2
5 m
fro
m In
ject
ion
Wel
l Fa
ult
5 k
m f
rom
Inje
ctio
n W
ell

Basal Aquifer Injection
Middle Aquifer Injection
Paleozoic Faults that Cut Sedimentary Units

Thrust fault with low permeability contrast to basement Thrust fault with high permeability contrast to basement & connected to normal fault
Effect of Thrust Faults

Lake, Ohio Case
(Nicholson et al., 1988)
Model
Field Observations
How do Proterozoic normal fault model results compare to cases of induced seismicity?

(Horton, 2012)
How do thrust fault model results compare to cases of induced seismicity?
Guy, Arkansas Case
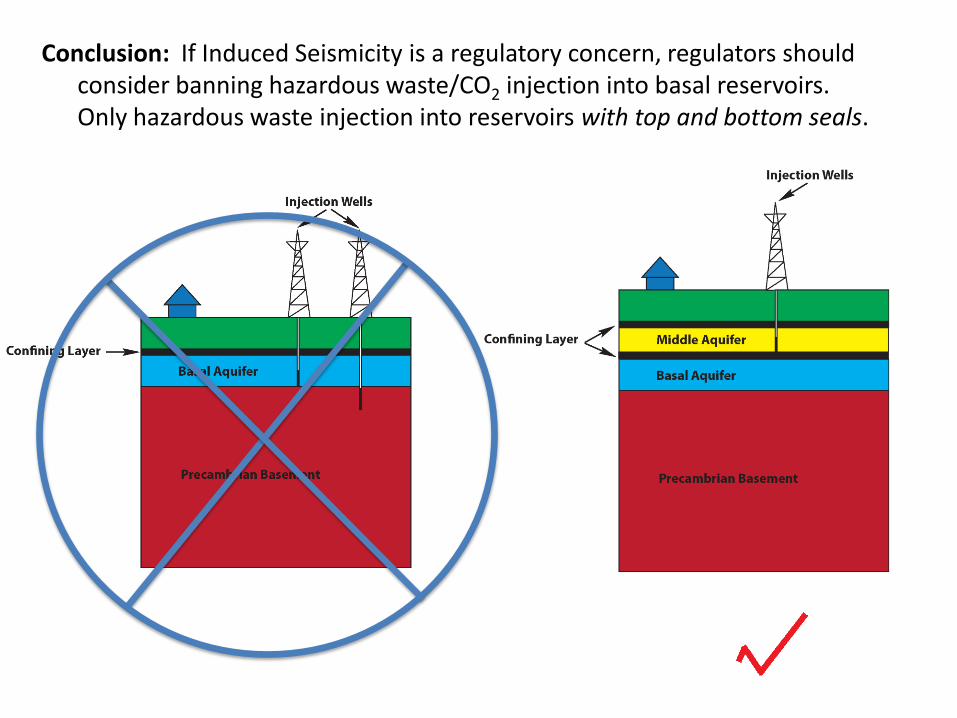
Conclusion: If Induced Seismicity is a regulatory concern, regulators should consider banning hazardous waste/CO2 injection into basal reservoirs. Only hazardous waste injection into reservoirs with top and bottom seals.

New Regulations
• In order to minimize the chance of inducing earthquakes near injection sites, detailed Seismic Analysis of basement should be done looking for basement faults.
• Stress analysis & shut in tests (e.g. Lucier et al. 2006) should be preformed in basement rocks.
McBride et al. (2007)


Base Case Parameters Run the model with a injection rate of 1000 gallon per minute for 10 years

Model Validation
We tested our model by comparing the simulation results of pore pressure changes due to CO2 injection in an idealized multilayer aquifer/aquitard system of our model with that produced by TOUGH2 in Birkholzer et la. (2009) study.

Model Validation
Deviatoric pressure in bars, 0.1 bar = 1 m excess head, red dashed – this study, black solid – Birkholzer et al. (2009)

Analytical solution using the online ELSA program of Princeton Group

No Flux Boundary vs
Constant Head Boundary
No flux boundary on the right edge of the domain
Constant head boundary on the right edge of the domain

Did we violate assumptions of analytical solution?
Add flux figure and observations…