banka koper d. d....banka koper is the first slovenian bank to be nominated for the “financial...
TRANSCRIPT


Koper, march 2013
Banka Koper d. d.
AnnuAl RepoRt 2012


TABLE OF CONTENTS
BANKA KOPER AT A GLANCE
MILESTONES IN THE BANK’S CORPORATE HISTORY
SIGNIFICANT EVENTS IN 2012
MANAGEMENT OVERVIEW01. Report of the management board02. Report of the supervisory board03. Bodies of corporate governance04. General economic and banking environment05. An overview of the bank’s operations in 2012 5.1 Lending operations 5.2 Deposits 5.3 Other services 5.3.1 Card business 5.3.2 New products 5.3.3 Electronic banking 5.3.4 Marketing mutual funds 5.3.5 Distributing insurance policies 5.3.6 Leasing operations 5.3.7 Open-ended mutual pension fund managed by
Banka Koper (OVPS)06. The bank’s organic growth and development 6.1 Capital investments 6.2 Information technology and technological development 07. Human resources08. Positioning business for growth in 2013
ORGANISATIONAL CHART AS AT 31 DECEMBER 2012
INTERNAL ORGANISATION CHART
INDEPENDENT AUDITORS’ REPORT ON FINANCIAL STATEMENTS
STATEMENT OF MANAGEMENT’S RESPONSIBILITIES
FINANCIAL STATEMENTS01. Statement of income02. Statement of comprehensive income03. Statement of financial position04. Unconsolidated statement of changes in shareholders´ equity05. Consolidated statement of changes in shareholders´ equity06. Statement of cash flows
NOTES TO FINANCIAL STATEMENTS01. General information02. Summary of significant accounting policies 2.1 Basis of preparation 2.2 Consolidation 2.3 Reporting on operating segments 2.4 Foreign currency translation 2.5 Investments in subsidiaries and goodwill
09
10
12
15151719202020222222232323242424
2525252728
30
32
37
39
40404142444546
4949495055565656
3Banka Koper annual report 2012 • business report

2.6 Related parties 2.7 Financial assets 2.8 Offsetting 2.9 Derivative financial instruments 2.10 Hedge accounting 2.11 Interest income and expense 2.12 Fees and commission income 2.13 Sale and repurchase agreements 2.14 Impairment of financial assets 2.15 Intangible assets 2.16 Investment property 2.17 Property, plant and equipment 2.18 Accounting for leases 2.19 Cash and cash equivalents 2.20 Financial liabilities 2.21 Provisions 2.22 Inventories 2.23 Financial guarantee contracts 2.24 Taxation 2.25 Employee benefits 2.26 Share capital 2.27 Fiduciary activities 2.28 Comparatives
03. Risk management organisation 3.1 Risk management structure 3.2 Capital adequacy and own funds (capital) management 3.2.1 Fulfilment of regulatory capital requirements 3.2.2 Internal capital adequacy assessment (icaap) 3.3 Credit risk 3.4 Financial instrument`s breakdown by country risk 3.5 Liquidity risk 3.6 Equity risks of banking book 3.7 Market risk 3.7.1 Derivative instruments 3.7.2 Currency risk 3.7.3 Interest rate risk 3.8 Operational risk 3.9 Fair value of assets and liabilities
04. Net interest income05. Dividend income06. Net fee and commission income07. Gains less losses from financial assets and liabilities not recognised at
fair value through profit and loss08. Gains less losses from financial assets and liabilities held for trading09. Fair value adjustments in hedge accounting10. Gains less losses on derecognition of non-current assets other
than held for sale11. Other operating gains less losses12. Administrative expenses13. Amortisation and depreciation14. Provisions15. Impairment losses16. Income tax expense17. Earnings per share18. Incomes and expenses achieved on foreign markets19. Cash and balances with central banks20. Trading assets
5757 606060616162626363646465656565656666666767
67676868717279859092929295
100101
105105106
106107107
107107108109109109110110111111111
4 Banka Koper annual report 2012 • business report

21. Derivative financial instruments and trading liabilities (banka koper and consolidated)
22. Investment securities (available for sale and held to maturity securities)23. Loans and advances to banks24. Loans and advances to customers25. Advances26. Goodwill27. Property, plant and equipment28. Investment property29. Intangible assets30. Investment in subsidiaries31. Other assets 32. Liabilities to central bank33. Deposits from banks34. Due to customers35. Other borrowed funds from banks36. Other borrowed funds from other customers37. Other financial liabilities38. Provisions for liabilities and charges39. Retirement benefit obligations40. Deferred income taxes41. Other liabilities42. Share capital43. Revaluation reserves44. Reserves from profit and retained earnings45. Dividends per share46. Cash and cash equivalents47. Contingent liabilities and commitments48. Related party transactions49. Events after the reporting period
111112 114114115118118119120121122122122122123123123124124125126127127128129130130131132133
5Banka Koper annual report 2012 • business report

HuMAnItYAlways there when you need it
Peace in the Home, Soleirolia soleirolii or Helxine soleirolii

BuSIneSS RepoRt2012


BANKA KOPER AT A GLANCE
Shareholder structure of Banka Koper d.d.
equity holding in %
Shareholder 31. 12. 2012 31. 12. 2011
1. Intesa Sanpaolo S. P. A. 97.6% 97.5%
2 Elektro Primorska d.d 0.7% 0.7%
3 Kraški vodovod Sežana d.o.o. 0.3% 0.3%
4. Minority shareholders 1.4% 1.5%
Banka Koper, established back in 1955, is the eight largest banking institution in Slovenia in terms of total assets and it operates through a network of 54 branch offices throughout the country with more branches concentrated in Primorska – the coastal region. Banka Koper is a universal bank offering a comprehensive roster of banking services including commercial and custodian banking, retail banking, international banking operations, as well as financial and operating leasing, mutual funds marketing and selling insurance products. Banka Koper has been increasing its visibility in the Slovenian market of bespoke services for small and medium-sized enterprises and sole proprietors, and it has safeguarded its market share of corporate banking. It boasts over 160 thousand customers and it is a leading Slovenian financial institution in the area of modern electronic banking operations.
Mission and vision
Stability, imagination, humanity and hope are the values connecting Banka Koper with the Intesa Sanpaolo international banking group. To accept and observe these values means to fulfil the mis-sion of Banka Koper. All the four values are also related to the colours representing the logo of Banka Koper. Orange stands for sun and energy, a symbol of humanity. Green symbolises plants, growth, future and responsibility toward the environment. Blue represents the sea, air, movement, and with that proactivity and innovation, which is reflected in efficient banking products and services. Earth golden represents soil and work, symbolising stability.
9Banka Koper annual report 2012 • business report
MILESTONES IN THE BANK’S CORPORATE HISTORY
1955 • Foundation of Istrska komunalna the bank1961 • Komunalna the bank Koper is established to serve banking needs of several coastal munici-
palities1965 • Venturing into new lines of business results in establishing Kreditna banka Koper.1978 • LB Splošna the bank Koper is created by the amalgamation of Kreditna banka Koper and the
branch office of Ljubljanska banka in Koper; the new bank is part of Ljubljanska banka – As-sociated Bank.
1989 • The Bank is transformed into a public limited company and establishes a subsidiary – Finor.1992 • The Bank leaves the bank group parented by Ljubljanska the bank and develops the first Slov-
enian payment card – Activa.1997 • New corporate image and new name – Banka Koper.1998 • The branch network expands.
Intesa Sanpaolo international banking group, the majority shareholder of Banka Koper, was founded in 2007 with the merger of Banca Intesa and Sanpaolo IMI. Intesa Sanpaolo is one of the leading banking groups in the eurozone and the leading bank in Italy operating with individuals, corporate banking and asset management. Its international operation focuses on Central and Easter Europe and the Mediterranean.
The international connection with the Group delivers knowledge transfer, experience sharing and the development of innovative products and services, which places Banka Koper among the most successful Slovenian banks.
International ratings
The international rating agency – Fitch Ratings London – downgraded the credit rating for Banka Ko-per: its long-term credit rating from A- to BBB+, its short-term credit rating remained unchanged on the level F2, the viability rating dropped from BB+ to BB. Fitch Ratings downgraded the Bank’s credit rating for external support from 1 to 2.
Despite the downgrade, in 2012 Banka Koper keeps the highest credit rating among the Slovenian banks as it stands out from Slovenian banks in terms of bank performance, capital base and benefits of having the Italian Bank Intesa Sanpaolo among its shareholders.
The short-term and the long-term credit ratings are founded on the strong link between Banka Koper and its parent undertaking - Intesa Sanpaolo. Fitch Ratings believes that there is a high degree of probability that the Bank’s parent undertaking will provide funding to its Slovenian subsidiary should it be necessary. In addition, Fitch Ratings assesses that Banka Koper has adequate liquidity, a well-developed retail network, and an adequate capital adequacy ratio. At the same time it assesses that Banka Koper is a strategically important bank in Intesa Sanpaolo Group.
Rating 2012 Rating 2011
Long-term BBB+ A-
Short-term F2 F2
Viability BB BB+
Support 2 1
10 Banka Koper annual report 2012 • business report

1999 • Banka Koper takes over M the bank.2000 • The Bank is run by a two-man management board. The Bank’s shares are listed on the Ljublja-
na Stock Exchange.2001 • Preparations start for the strategic alliance with the Sanpaolo IMI Group.2002 • The Bank joins the Sanpaolo IMI Group – its majority shareholder. The sale of Finor is finalised.
The Bank’s branch offices spread to all Slovenian regions.2003 • The Bank’s shares are delisted from the Ljubljana Stock Exchange organised market.2004 • Finor d.o.o. is bought back and registered as the Bank’s subsidiary for the lease business.2005 • Consolidation of the Bank’s leading position in developing card operations, introduction of
the first business debit card in Slovenia and first intercontinental SecureCode transaction with an Activa Maestro card to be carried out in the world.
2006 • Sanpaolo IMI acquires additional shares of the Bank, thus obtaining a stake of 66.21 per cent of the Bank. The smart-card family features two more smart cards: Activa Visa and Visa Electron. Banka Koper is the first Slovenian bank to be nominated for the “Financial Sector Technology Awards”.
2007 • Creation of the Intesa Sanpaolo banking group which obtains a stake of 91.21 per cent in the Bank. On 1 January, Slovenia adopts the euro. The American Express card joins the Activa family. The Activa system celebrates its fifteenth anniversary.
2008 • The banking group Intesa Sanpaolo S.p.A increases its equity holding in Banka Koper to 97.22 per cent. The rebranding project is completed at Banka Koper and the Bank’s corpo-rate image is changed to transpose the new visual identity shared by the parent bank and its subsidiary banks. The Bank’s retail network expands by opening six new branches.
2010 • The focus of Banka Koper is on risk management, deposit gathering, launching new prod-ucts. Within the framework of the Group-wide EDU The programme for Listening 100% - Banka Koper pencilled in an important action plan for improvements in the customer service area that started with training sessions for all employees.
2011 • Banka Koper introduces three new products in the area of retail lending with clear benefits for households borrowing from Banka Koper in terms of the purpose of borrowing, maturity and borrower protection. The electronic banking via the Internet - Banka IN – is further ad-justed to the users of mobile devices and the new application is born for Mobilna Banka IN. By keeping abreast with the high-tech advances, Banka Koper is aligned with the latest trends and responds quickly to the demands of more demanding users of banking services. In the very centre of Ljubljana Banka Koper opens its first “green branch office” where payment or withdrawal slips are signed electronically without using paper forms. This means that banking transactions are executed virtually at the teller’s window or at a desk of a bank officer. The customer is asked to sign an electronic document using his/her smart bank card with a chip with the digital certificate and by punching in his/her PIN code using a special touch screen.
2012 • Banka Koper executes the reorganisation of its branch network in effort to be more friendly to the segment of small and medium-sized enterprises and in line with commitment to step up efficiency and expertise of its staff working with small and medium-sized enterprises (SMEs). Banka Koper celebrates the 10th anniversary of membership of the international banking group Intesa Sanpaolo. To highlight the occasion, the bank becomes a sponsor of the con-cert of the world-famous pianista Giovanni Allevi. Banka Koper spins out the provision of investment and ancillary investment services to the management company ALTA Invest. This strategic move is taken in order to enable the bank to enable the customers to make higher returns on their assets on the one hand and to enhance the bank’s position in the area of the custodian banking. The card system Activa celebrates the 20th anniversary in business and undisputed success in the payment cards market. The process serving to reinvent the bank’s branch offices within the framework of its retail network to become “green branch offices” is completed.
11Banka Koper annual report 2012 • business report

SIGNIFICANT EVENTS IN 2012
Customers
Increasing operating efficiency with small and medium-sized enterprisesWith the aim to enable Banka Koper to come even closer to the segment of small and medium-sized enterprises, at the beginning of the year 2012, the bank’s business (branch office) network was trans-formed and as a result, the bank created ten specialized enterprise centres for small and medium-sized enterprises (SMEs), which are distributed in the western part of the country, in Slovenia’s central part and in the eastern part of Slovenia. By making this move, Banka Koper has established a business model with which it strives to achieve a higher degree of efficiency and expertise of its employees for serving the specific needs of small and medium-sized enterprises (SMEs).
The provision of banking services to the financially sensitive segment of population Banka Koper offers to the customers a wide array of products and services, which meet various needs for financing. While doing so, Banka Koper takes into consideration also that segment of Slovenia’s population, which is either faced with important points in life or are disadvantaged when it comes to gaining access to financing they need to meet their needs. This segment of Slovenia’s population includes pupils and students to whom the bank offers loans at a more favourable interest rates and at lower charges - lower costs of loan approval. By launching marketing campaigns and tailored offers, Banka Koper also caters for the needs of young people who wish to buy their own home. With the new loan for retired people, Banka Koper has come closer to the segment of Slovenia’s population often turned down by credit institutions since their age and low personal income create a barrier to getting a loan.
Driven by a wish to provide as high financial security to borrowers during the repayment of a loan as possible, Banka Koper wraps up the credit products with insurance products. In addition to the traditional loan insurance coverage, the bank also offers a combination of insurance coverage for the borrower and loan insurance. It is a special form of insurance, which provides an individual the financially security by making it possible for the borrower to take put insurance coverage for death, inability to work and/or being laid off, while at the same time the borrower takes out insurance for its obligations vis-à-vis the bank arising from the loan taken.
The quality of customer relationship Banka Koper has been striving all along to raise the level of quality of its relations with the customers, and it has carried out on more than one occasion the activities, which are not of purely commercial nature. During the year under review, Banka Koper carried out for natural persons certain educa-tional activities such as:
• How the internet banking works within the framework of education “Digitalno opismen-jevanje starejših” – whowing the way through the cyberspace to senior citizens organised in collaboration with Ljudska univerza in Koper.
• Education for the retired staff of Banka Koper (former employees of Banka Koper) with the aim to recruit the bank’s former employees to win new customers for the bank and market the bank’s services and products for a fee.
• By means of video recording to educate the wider public through the internet portal of Banka Koper and the expanded internet portal Youtube on the use of the electronic Banka IN.
In the area of legal persons and sole proprietors, the bank:
• organised specialised seminars for the customers - legal persons – regarding the migration from direct debits to SEPA direct debits (SEPA DD).
• Started with breakfast sessions organised for its existing and potential new business partners/ customers, where hot topics are discussed (such as expectations regarding interest rate fluctu-ations in the market, presentation of the possibilities for insuring claims on customers – trade receivables).
12 Banka Koper annual report 2012 • business report
• organised educational day for exporters and importers and for enterprises, which are only pre-paring to make an entry into the international markets, where it presented the services provid-ed by TradeWay – a comprehensive information solution suited for a personal presentation in international markets, seeking new business partners and obtaining other useful information.
• in collaboration with Intesa Sanpaolo Eurodesk, Banka Koper organised an expert seminar for the existing and potential customers interested in obtaining direct non-refundable funds/grants from the European Union.
The natural and business enivornment
Banka Koper continued in the course of 2012 with the activities undertaken with the aim to achieve alignment of its branch offices with the new environmental standards followed by the Intesa San-paolo group and the in-house standard, the bank set itself within the framework of represented per-formance values. During the year under review, almost all SME branch offices were already equipped with the technology for carrying out paperless banking transactions, and by cutting back on paper slips, these branch offices were transformed into the green, environment-friendly branch offices.
Also in other areas the bank continued with the activities within the framework of the project ti-tled «Trajnostni razvoj spogledom 360 stopinj« - sustainable development with a 360 degree vision. Banka Koper within the framework of office material (stationery) uses only FSC paper (A4 format), its car fleet now features also hybrid vehicles, in certain business premises sensor for lights have been installed to cut down on electricity consumption and last but not least, Banka Koper has been mak-ing continuous efforts for awareness of the importance of sustainable development of employees as well as the general public.
Within the framework of the celebrations of the Work day of the environment, the bank organised a press conference where the media could learn about all the activities undertaken by the bank in the area of the environment protection and sustainable development. At the same time, through the in-ternal communication channels (ATMs, direct mail and LCD screens), the customers could learn about the bank’s achievements and about the activities in the area of the protection of the environment.
For its strivings made in the area of the environment protection within the framework of the project »Trajnostni razvoj s pogledom 360 stopinj«, Banka Koper was nominated last year for the prestig-ious first prize awarded within the framework of the best European projects in the area of energy efficiency, renewable energy sources and clean transport – 2012 Sustainable Energy Europe Awards.
Local community
Having to live with the slashed budget for the marketing activities, the bank continued to invest the same degree of enthusiasm and zest the applications received for sponsorships and donations. To this end, Banka Koper focused attention on those projects and individual initiatives, which strive to keep alive the social activities in the towns and cities in which Banka Koper operates with a particu-lar stress on the activities designed for young people and for the societies active in culture, arts and charity work.
The media
The bank has been building its reputation also through transparent collaboration with the media. The organisation of press conferences, informing the media about important events in relation to the bank and informing journalists about the important aspects of the banking operations and co-operation with the prominent public institutions, particularly when the economic situation becomes difficult, are the regular communication activities with the stakeholders. Banka Koper organised in the course of 2012 several press conferences and info events and sent out a number of messages for the media. Two events have to be underlined as very important ones: the meeting of the Slovenian banks with the representatives of the media with the analysis of the financial results posted by the banks as the topic where the bank participated actively with the Banking Association of Slovenia in the organisation of the event, and the key-note interview given by the president of the management board of Banka Koper, Mr. Giancarlo Miranda in Sobotna priloga – the supplement to the daily news-paper Delo published on Saturdays.
13Banka Koper annual report 2012 • business report

ReSponSIBIlItYGrowth is a responsible step by step path
Money Plant, Crassula ovata

MANAGEMENT OVERVIEW 2012
The drop in economic activity and in household demand is but a piece in the puzzle of the stressful circumstances Banka Koper was facing in 2012. Another very important piece was a drastic drop in Euribor rates, which exceeded our expectations, and, looking at the domestic environment, the sud-den failure of several of Slovenia’s leading construction companies. The consequence of the Euribor drop was a negative effect on interest rate revenue, amounting to EUR 6 million, while poor macr-oeconomic conditions prompted the bank to make more impairments and build reserves compared to the previous year. Despite these extremely unfavourable conditions, Banka Koper has yet again proven to be a solid institution, remaining among the few profitable banks in the Slovenian banking system. We have mainly achieved this by maintaining a strict control of operating costs and risks. Thus, we managed to achieve net profits for 2012 in the amount of EUR 7.2 million.
The worsening of the debt crisis and the deterioration of the conditions in the Slovenian banking sector have led to a drop in the scope of loans in the entire system. In spite of this, Banka Koper was one of the few banks that managed to achieve definite growth in the field of loans. In 2012, gross loans to clients who are not from the banking sector increased by EUR 46.7 million (+ 2.4 per cent), while the banking system saw a 3.5 per cent decrease in credit activity), which means that the Bank’s market share in the non-banking credit sector increased from 5.4 to 5.7 per cent.
In 2012, the Bank earmarked no less than 31.8 per cent of all loans to the non-banking sector for the needs of the households, i.e. ordinary citizens and sole traders. Household loans increased by EUR 26.2 million (+ 4.3 per cent), owing chiefly to the competitive offering of housing loans, which translated to an increase from 6.5. to 7.1 per cent.
We are proudest of the considerable increase in the scope and market share in the field of customer deposits. This proves that a growing number of Slovenes and companies trust Banka Koper and consider it to be a stable and reputable bank. The Bank has thus seen a considerable increase in the collected deposits of clients from the non-banking sector, EUR 172.3 (+12.8 per cent), and from a 5.5 per cent market share in 2011 to 6.3 per cent in 2012. We first detected this trend in non-financial companies, where the volume of deposits increased by 29.7 per cent. The Bank also saw a growth of deposits from citizens, accounting for the largest part of non-banking sector deposits. Among citizen deposits, long-term deposits increased the most, by 9.0 per cent. This constant growth in deposits has enabled us to improve our loan vs. deposit ratio, which is today considerably lower than the Slovenian banking system average. The aforementioned ratio improved by 13 percentage points and was 1.23 on the last day of 2012; on the same day in 2011, the ratio was 1.36. This positive trend has continued in the first months of 2013. Constantly lowering the loan vs. deposit ratio means that the Bank is less dependent on other sources to fund its operations. The Slovenian banking system reached a ratio 1.30 in 2012, while the indicator at the end of 2011 was 1.36.
In spite of the increased volume of loans to customers, the Bank further increased its credit adequacy. The end of 2012 showed a high capital adequacy ratio of 13.53 per cent. It should be pointed out that the Tier 1 capital ratio is 3.14 and increased by 0.45-percentage points compared to 2011.
On the last day of 2012, the long term credit rating of Banka Koper was BBB+, the highest among rated Slovenian banks, due mainly to prudent business results, adequate regulatory capital and the positive effects the Bank enjoys thanks to support from its parent group, Intesa Sanpaolo. Banka Koper’s affiliation with the Intesa Sanpaolo banking group, which is profitable, liquid and very solid in terms of capital, gives us strength and boosts our confidence in our operations.
RepoRt oF tHe MAnAGeMent BoARD 01.
15Banka Koper annual report 2012 • business report

In addition to focusing on credit and deposit operations, Banka Koper was very active in 2012 in the field of developing new products and distribution channels, in the improvement of customer relation-ships and in exercising its principles in the field of social responsibility.
With a great deal of attention to the times and the conditions in which we currently operate, we have created a selection of new products for the most vulnerable population segment. For secondary school and higher education students, the Bank has created a special offer of loans with advanta-geous interest rates and lower granting costs. In order to ensure better financial security for our borrowers, Banka Koper, in cooperation with Generali Insurance Group, has broadened its offer of life insurance for its borrowers (CPI), even for consumer loans. We have also created a special loan type for retired citizens because age and low income are frequently the factors in why pensioners are refused loans. Pensioners also benefit from lower bill payment commissions at selected Banka Koper branch offices.
In the field of bank card operations, Banka Koper has reconfirmed its leading status by issuing the first stored value card in the Slovenian market, offering card users a new payment tool that is espe-cially handy for online shopping and travelling.
It would also be safe to say that Banka Koper is the leader when it comes to electronic banking. In addition to the online ‘Banka IN’, it has developed a mobile version serving four mobile operating systems. Both versions have received rave reviews in Monitor, Slovenia’s leading IT magazine.
A special turning point of 2012 is surely the transfer of investment and ancillary investment services to be managed by ALTA Invest Company. Banka Koper and ALTA Invest have thus managed to take advantage of optimum synergy effects and improve the quality of their integral offer. For the Bank, the collaboration with ALTA Invest meant it could start providing trust services for their mutual funds, consolidating Banka Koper’s position and moving to the very foreground in the field of trust banking.
The mission of “Posluh 100 per cent” project (“Hearing 100 per cent”), which the Bank has been implementing with success for several years, is continuous improvement of client relations. In 2012, several activities were carried out as part of this project, but special mention should be made of the effects of the latest business network reorganisation, which prompted the most positive reaction in the SME sector. The increased satisfaction in this client category was confirmed in our latest cus-tomer satisfaction review where the satisfaction levels were determined according to the European Customer Satisfaction Index – ECSI.
Of course, our placement among the country’s best business institutions comes with the responsibil-ity of looking beyond the confines of banking operations in the strict sense and, taking into account various factors, trying to improve everything associated with them. When it comes to social respon-sibility, what really counts is not only the number of sponsorship or donation contributions, but, first and foremost, the creation of a shared environment where it will be more pleasurable to live. We may say that we make small but determined and important steps in this direction. And so, for instance, in 2012, we completed the refurbishment of our branch offices according to the standards of environ-mentally friendly offices: their main characteristic being that they are equipped with technology al-lowing us to provide paperless banking transactions. All transactions (cash withdrawal, bill payments, deposit contracts, etc.) can be made without using paper, using a smart payment card and a special touch-sensitive screen, either at the counter or in a bank representative’s office. For our environmen-tal protection endeavours that were part of the ‘Sustainable Development with a 360 Degree View’ Project, Banka Koper was nominated for the prestigious main award within the framework of the 2012 Sustainable Energy Europe Concourse. The fact that we never cease to pursue our ethical principles, carefully manage risks and operating expenses, introduce new technologies and train our employees, to whom we are extremely grate-ful for their contribution and sense of responsibility, is the solid foundation of Banka Koper’s past achievements in the Slovenian market. These are also the key factors behind Banka Koper’s positive business figures in 2012 and what has placed it among the country’s few profitable banks, allowing us to face 2013 with great confidence.
16 Banka Koper annual report 2012 • business report
02. RepoRt oF tHe SupeRVISoRY BoARD on tHe eXAMInAtIon oF tHe AnnuAl RepoRt FoR tHe FInAnCIAl YeAR 2012
In accordance with the third paragraph of Article 272 of the Companies Act (ZGD), the Management Board of Banka Koper d.d. has prepared and forwarded to the members of the Supervisory Board the following documents for review and approval:
The Audited Annual Report for the Financial Year 2012,The Auditor’s Report drawn up by the independent auditor KPMG Ljubljana, andThe proposal for the appropriation of profit.
Pursuant to the provisions laid down in Article 282 a of the Companies Act, the Supervisory Board has examined the received documents and hereby presents its findings to the Annual General Meet-ing of Shareholders of Banka Koper d.d. as follows
Report
1. The way and scope of verification of the management of Banka Koper during the financial year 2012
In the course of the financial year 2012, the Supervisory Board of Banka Koper d.d. met five times at regular sessions and four times at correspondence sessions and examined the strategic and operat-ing matters in relation to the Bank’s development, implementation of the business policy and current results posted by the Bank, annual and other reports of the Management Board, as well as other important issues relevant to the Bank’s business. The Supervisory Board voted on proposed business deals where due to being in excess of the limit on exposure determined for a particular customer, the Supervisory Board of Banka Koper has to grant its approval and on other matters of interest. The materials for the sessions were forwarded to the members of the Supervisory Board in compliance with the Rules of Procedures governing the discharging of the functions of the Supervisory Board and those functions were discharged in line with the aforementioned enactment.
The composition of the Supervisory Board of Banka Koper d.d. was not changed in 2012.
The Supervisory Board performed its duties in accordance with its principal function, i.e. supervision of the Bank’s business run by the Management Board and the Bank’s performance in accordance with its powers and focused attention to the following areas: • monitoring and assessing on a regular basis the compliance with the Bank’s business policy for
2012 and the fulfilment of the goals set out within the policy framework;• examining the annual report on the carrying out of internal control and the measures that
arise from the Money Laundering Prevention Act for the year 2011; • examining and approving the Annual Report of the Internal Audit Department for 2011;• verifying the activities and reviewing the findings of the Internal Audit Department during the
current year;• examining the Report on external examinations carried out within the framework of supervi-
sion of Banka Koper in the year 2011;• monitored the Bank’s capital adequacy;• took note of a given letter of resignation by Mario Henjak, member of the management board,
on taking on other duties and tasks outside the country of Slovenia from 01.01.2013 on.• addressing other issues in accordance with powers conferred upon it under law and the Arti-
cles of Association.
The Supervisory Board assesses that it had at its disposal timely and adequate data, reports and infor-mation, as well as additional clarifications and explanations when required at sessions it held, so as to be able to monitor throughout the financial year the Bank’s operations with due attention, as well as the internal audit function and supervise the running of the Bank. In March 2013 the members of the Supervisory Board examined the extensive report on the performance and the results posted by the Bank in 2012, arising from the audited accounting statements.
17Banka Koper annual report 2012 • business report

The Supervisory Board hereby states that all its members have examined carefully the Annual Report, the Report of the Certified Auditor, Financial Statements, Notes to the Financial Statements, and oth-er notes presented therein. Furthermore, the Supervisory Board assesses that the Annual Report of the Management Board gives a true and fair view of the business events and provide comprehensive information as to operations during the past financial year, and thus complements and expands the information already presented to the Supervisory Board in the course of the financial year. The Bank has safeguarded a high level of operational safety and effectively manages risks it is exposed to in the course of its day-to-day business. Therefore, the Supervisory Board has assessed that considering the circumstances under which the Bank conducted business, the Bank’s management and performance were successful during the period under review.
Furthermore, the Supervisory Board also assessed that the work of the Internal Audit Department was well planned and effective, since it supports the activities of the Management Board and an aid to the Supervisory Board when forming opinions and making assessments.
2. The position with regard to the Auditor’s Report
The Supervisory Board hereby concludes that the external auditor has expressed in the Report the opinion in relation to the financial statements prepared by Banka Koper d.d.. Therefore, the Supervi-sory Board hereby adopts the following
Positionthat the Supervisory Board has no objection to the Report of the auditor KPMG Ljubljana.
3. Approval of the Annual Report for the financial year 2012
On the basis of the insight into operations carried out by the Bank in the course of the financial year and after due examination of the audited Annual Report and the unqualified opinion stated in the external auditor’s report, the Supervisory Board hereby
Approves and adoptsThe Annual Report of Banka Koper d.d. for the Financial Year 2012.
4. Approval of the proposal on profit appropriation
The members of the Supervisory Board have analysed the proposal regarding the appropriation of the balance-sheet profit. They have found the proposal for the adoption of the distributable profit, to be in line with the dividend policy of the bank. After due examination of the proposal, the Supervisory Board hereby fully
Agreeswith the Management Board’s proposal on the appropriation of the profit.
Koper, 7 May 2013
Chairman of the Supervisory Board Vojko Čok
18 Banka Koper annual report 2012 • business report

03. BoDIeS oF CoRpoRAte GoVeRnAnCe
Supervisory Board The supervisory board of Banka Koper is chaired by the former President of the Bank’s management board. Its members are external experts and representatives of the Bank’s majority shareholder and its parent undertaking, the Intesa Sanpaolo Group.
In 2012 there were no changes in the composition of the Supervisory Board.
Supervisory Board as at 31 December 2012:
Vojko Čok > Chairman Ivan Šramko > Deputy ChairmanFabrizio Centrone > Member Elena Breno > Member Roberto Civalleri > Member Ph.D. Borut Bratina > Member
Management Board The Management Board is composed of seven members and chaired by Mr. Giancarlo Miranda.
In 2012 there were no changes in the composition of the Management Board.
The composition of the management board as at 31 December 2012:
Giancarlo Miranda, M.Sc. > PresidentIgor Kragelj > Deputy PresidentRado Grdina > MemberAleksander Lozej, M.Sc > MemberAleksander Milostnik > MemberFrancesco Del Genio > MemberMario Henjak, M.Sc. > Member
19Banka Koper annual report 2012 • business report

04. GeneRAl eConoMIC AnD BAnKInG enVIRonMent
The European economic activity was modest during the year under review. The situation was deteri-orating in the labour market and, at the same time the expectations that the economic crisis would come to an end in the year 2013 were becoming more distant. The difficult situation in the interbank market did not improve even though the conditions in the financial and equity markets somewhat improved in the face of the crisis. The International Monetary Fund issued its estimate for 2012 saying that the already lame economic activities were set to deteriorate even further also in the year 2013. The agreement achieved to form a European banking union was well accepted by the markets and slightly reduced the uncertainty regarding public finances in the countries at the periphery of the EU and contributed at the end of 2012 to a rise in the exchange rate of the euro vis-à-vis most important currencies.
The situation in the Slovenian economy remained relatively good in the industry and in other sectors, predominately linked to exports, but deteriorated in the sectors mostly dependent on domestic de-mand, markets and the service activity. The relatively favourable activity in industry/manufacturing in comparison with the euro area was still mostly a consequence of the shift to sales to the markets in other currencies. At the end of 2012, the indicators of business sentiment and confidence slightly increased in all types of economic activities, but still remained below the average values for many years.
The difficult situation in the labour market and consequently lower possibilities for employment led during the fourth quarter of 2012 to the registered unemployment rate of 12.1 per cent. The number of people in the so-called active population in the private sector was visibly falling down during the last months of 2012 as a result od the measures aimed at cost cutting and consolidation dragging down also employment in the public sector. At the end of December 2012, the number of the regi-stered unemployed persons took at 118 thousand persons and it was a record high figure after the year 1999.
The weak activities in the private sector and the savings measures undertaken by the government took a toll on average salaries and their sluggish growth.
In Slovenia, the inflation rate for the year 2012 was 2.7 per cent, as opposed to a year earlier what this figure was 2.1 per cent. As it was the case throughout the euro area, the main reasons for a hig-her inflation rate also in Slovenia were price hikes for fuels, foodstuffs and services. The rise in excise duty on petroleum products and tobacco contributed to the annual inflation 0.9 percentage point. Despite the rise, the core inflation remains below the average for the euro area.
During the year under review, the deterioration and shrinking of the balance sheet assets of banks continued. The shrinking was mostly affected by the banks’ repayments of the funds borrowed abro-ad. After several months when the volume of deposits of the non-banking sector was decreasing, in October 2012 it increased, mostly owing to the deposits placed by the government. The instable economic conditions and the falling confidence in banks’ operations continued to fuel the rise of ho-usehold deposits withdrawn from the banks. A decrease in the lending activities to the non-banking sector slowed down slightly in October as lending to the government increased. The negative annual dynamics of lending to the non-financial companies gained momentum at the end of 2012, while the volume of lending to households stagnated. The banks posted losses before tax until the end of October 2012 in the amount of 155 million euros, mostly due to higher costs of impairments and provisions. These costs accounted for nearly two thirds of the gross income generated by the banks.
05. An oVeRVIeW oF tHe BAnK’S opeRAtIonS In 2012
5.1 Lending operations
The fall in the volume of lending of the Slovenian banking system to the non-banking sectors was highly pronounced in 2012. The bigger portion of these decreases was a consequence of deleverag-ing by enterprises and the non-financial institutions, households also repaid more loans, while loans extended to the government somewhat increased. During the year under review, the volume of
20 Banka Koper annual report 2012 • business report
0
500,000
1,000,000
1,500,000
2,000,000
1,357,357
1,336,840
633,811
607,646
440,304
477,614
1,550,864
1,466,872
1,943,996
1,891,386
47,172
53,100
1,991,168
1,944,486
31. 12. 2012
31. 12. 2011
Legal entities
Long-term
Short-term
Foreign currency
Total
Households
Domestic currency
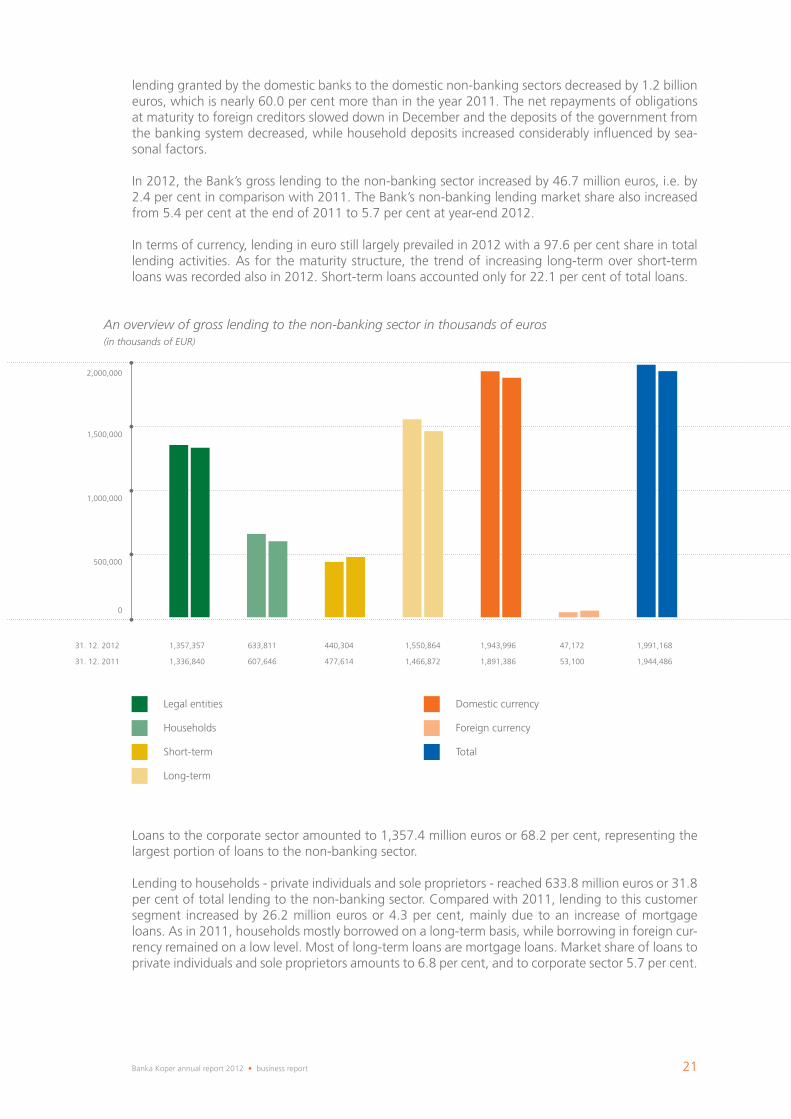
An overview of gross lending to the non-banking sector in thousands of euros (in thousands of EUR)
lending granted by the domestic banks to the domestic non-banking sectors decreased by 1.2 billion euros, which is nearly 60.0 per cent more than in the year 2011. The net repayments of obligations at maturity to foreign creditors slowed down in December and the deposits of the government from the banking system decreased, while household deposits increased considerably influenced by sea-sonal factors.
In 2012, the Bank’s gross lending to the non-banking sector increased by 46.7 million euros, i.e. by 2.4 per cent in comparison with 2011. The Bank’s non-banking lending market share also increased from 5.4 per cent at the end of 2011 to 5.7 per cent at year-end 2012.
In terms of currency, lending in euro still largely prevailed in 2012 with a 97.6 per cent share in total lending activities. As for the maturity structure, the trend of increasing long-term over short-term loans was recorded also in 2012. Short-term loans accounted only for 22.1 per cent of total loans.
Loans to the corporate sector amounted to 1,357.4 million euros or 68.2 per cent, representing the largest portion of loans to the non-banking sector.
Lending to households - private individuals and sole proprietors - reached 633.8 million euros or 31.8 per cent of total lending to the non-banking sector. Compared with 2011, lending to this customer segment increased by 26.2 million euros or 4.3 per cent, mainly due to an increase of mortgage loans. As in 2011, households mostly borrowed on a long-term basis, while borrowing in foreign cur-rency remained on a low level. Most of long-term loans are mortgage loans. Market share of loans to private individuals and sole proprietors amounts to 6.8 per cent, and to corporate sector 5.7 per cent.
21Banka Koper annual report 2012 • business report

0
500,000
1,000,000
1,500,000
422,876
311,938
1,090,967
1,029,618
644,151
568,513
544,553
521,723
325,139
251,320
1,444,196
1,269,324
1,513,843
1,341,556
69,647
72,232
31. 12. 2012
31. 12. 2011
Legal entities
Short-term Total
Sight
Domestic currency
Foreign currency
Households
Long-term
An overview of deposits and loans from the non-banking sector in thousands of euros(in thousands of EUR)
5.2 Deposits
5.3 Other services
5.3.1 Card businessActiva payment systemDuring the year under review, the Activa System reached a new milestone – the 20th anniversary of operation and the issuance of the first Slovenian payment card Activa. To mark the occasion, the Activa system issued a gift card Activa in the value of 10 euros and the participants of the business conference »The trends and innovations in the area of card operations« could make a donation to the Association of Blind persons and persons with impaired eyesight.
In the area of new card products and services, the system Activa has introduced a debit business card Activa Maestro and offered to all card holders the services of security SMS messages for payment transactions with the cards of the Activa family.
The Activa System also continued during the year under review with the promotional and award giv-ing campaign – My Activa card benefits from its use with the slogan “More Activa for less cash”. The
Customer deposits and received loans increased by 12.8 per cent or 172.3 million euros in 2012 meaning that the Bank gained 0.8 basis points of its market share. At the end of 2012, Banka Koper achieved a 6.3 per cent market share measured by deposits placed by the non-banking sector.
The sight deposits accounted for a 42.4 per cent share of all deposits followed by short-term deposits (38.9 per cent) and long-term deposits trailing at 18.7 per cent. The deposit structure in terms of currency was dominated by deposits denominated in euro with 94.6 per cent.
The volume of the deposits placed by legal persons increased by 35.6 per cent (by 110.9 million eu-ros) comparing with 2011. The sight deposits increased by 13.3 per cent, short-term deposits by 4.4 per cent, and long-term deposits by 29.4 per cent compared to the previous year. Also in 2012, the deposit structure in terms of currency was dominated by deposits denominated in euro.
Household deposits account for 72.1 per cent of all non-bank deposits and at the end of 2012 to-talled 1,091 million euros, i.e. 61.4 million euros more year-on-year. Household deposits were mainly denominated in local currency.
22 Banka Koper annual report 2012 • business report

objective of this promotional and award giving campaign is to encourage the use of payment cards instead of using cash to pay for goods and services, to stress the advantages of paying with payment cards and to increase the activation of the use of cards and the cementing of the visibility and loyalty of the Activa brand by giving away practical awards.
Banka KoperDuring the year under review, Banka Koper issued the first prepayment card Activa Visa Electron called »MOJA« (my). It is the first such card in the Slovenian market that does not require a person to be a customer of the bank with a bank account opened with Banka Koper d.d. in order to become a holder of the card. The card has been designed for wider use and the target group comprises savers, internet shoppers and travellers.
During the year under review, the integration of the card scheme American Express in the portfolio with the offers of card products of Banka Koper continued and to that end, the card offering was expanded and the card portfolio of this type of products was enriched with one of the most visible brands in the world.
In line with the strategy of the banking group Intesa Sanpaolo, Banka Koper joined the development of the joint debit payment card Activa Visa Debit named »Inspire«, which will be launched on the Slovenian market in the course of 2013.
5.3.2 New productsDuring the year under review, Banka Koper offered to its customers more products in its offer de-signed by taking into account customers’ expectations, market conditions and regulatory require-ments. The products that proved to be the most interesting were the following:
• The investment deposit with maturity of 2,5 years, where the higher yield is connected to the movement in the 6-month Euribor;
• The provision of the domestic SEPA direct debits;• The offer made to enterprises for adjusting to SEPA direct debits through an interface;• Offering life insurance to borrowers for consumer credits;• Offering loans for debt restructuring;• The services for small and medium-sized enterprises from the group Intesa Sanpaolo within
the framework of the project »Easy SMEs«;• Offering the instrument called »Izvršnica« that serves to enforce overdue payments in accord-
ance with law;• Offering a package designed for loyal customers – MOJ Paket – which provides benefits for
the bank’s long-term customers.
5.3.3 Electronic bankingBanka IN – it is more than a common website of Banka Koper – it is the first personal bank on the Internet that enables customers of Banka Koper to attend to their banking needs in a fast and easy way without having to pay a visit to the Bank’s brick-and-mortar branches. It is an advanced channel for communication between the bank and the customer, all the bank’s products and services are at the customer’s finger tips and it is a versatile bank, so it does not take long to get used to it With its ground-breaking solutions Banka IN stands out from the crowd of e-banking providers. Also during the year under review, the number of users of the electronic bank on the internet - Banka IN kept increasing and exceeded 40.000. In addition, also the new service - the mobile Banka IN developed for the modern mobile devices attracted many customers and thus fulfilled the bank’s goal: to make the internet bank Banka IN more popular. The new Banka IN has been winning customers in all age groups, since the mobile Banka IN is user friendly and enables the bank to develop a number of use-ful operations.
5.3.4 Marketing mutual fundsDuring the year under review, the negative trend experienced a year earlier in the area of mutual funds marketing continued. The values of the stock exchanges indices in most international markets increased, but it failed to convince Slovenian investors. The net outflow from the Slovenian mutual funds was record high during the year under review. This disappointing result was also attributable to the overall deterioration in the economic situation forcing savers to withdraw their nest eggs despite good results posted by the mutual funds.
23Banka Koper annual report 2012 • business report

Due to the unfavourable climate for selling the mutual funds, the results fall short of expectations, since Banka Koper experienced more than 1.3 million euros in net outflows from foreign funds it of-fers to customers (Eurizon Manager Selection Fund, Eurizon EasyFund and Franklin Templeton Invest-ment Fund) in the course of 2012. Lacklustre results were achieved also in the saving scheme deposits on the basis of contracts concluded for monthly payments in funds.
During the year under review, the bank concluded a contract for the marketing of mutual funds with the Slovenian management company Alta skladi.
5.3.5 Distributing insurance policiesAt Banka Koper, we act as an intermediary for taking out insurance coverage by borrowers (CPI), for purchasing car insurance, for non-life insurance, for life insurance and for life insurance with discre-tionary participation feature – unit linked policies. Banka Koper collaborates with Generali Zavarov-alnica d.d. and with the insurance company Adriatic Slovenica d.d. During the year under review, special marketing activities were carried out for providing insurance for borrowers (CPI) and the marketing campaign for purchasing a policy for home loans taken earlier. This campaign took place during the period from April to July 2012 and there was another marketing campaign: to take out insurance coverage for consumer credits arranged in earlier periods, which lasted from October to December 2012.
5.3.6 Leasing operationsThe company Finor leasing specialised in selling all types of leasing in the area of the entire Slovenia, both for natural persons and for legal persons. In its branch offices in Koper, Ljubljana and Maribor, Finor leasing has 12 employees. In 2012, Finor Leasing d.o.o. concluded 1,106 contracts in the aggre-gate amount of 48.7 million euros. The majority of contracts were concluded for commercial vehicles - 470 contracts in the amount of 12.8 million euros, followed by passenger cars - 415 contracts in the amount of 7.8 million euros, manufacturing and other equipment - 173 contracts in the amount of 10.3 million euros, real estate, the strongest group in value terms - 34 contracts in the amount of 17.1 million euros, and the smallest group of contracts for the purchase of yachts - 8 contracts in the amount of 0.7 million euros.
During the year under review, Finor leasing achieved in the segment of newly concluded leasing con-tracts a 5.02 per cent market share and among 16 leasing companies, it climbed to the 8th place. In terms of total assets, which total 110,4 million euros, its market share stands at 2.35 per cent.
5.3.7 Open-ended mutual pension fund managed by Banka Koper (OVPS)Banka Koper has been a pro-active player in the voluntary supplementary pension insurance system since 2001 when it established the Open-ended Mutual Pension Fund of Banka Koper d.d. (the OVPS of Banka Koper). The OVPS is intended both for collective and individual supplementary pension insurance.
As at 31 December 2012, the OVPS posted total assets of 31.34 million euros, which means a 7.11 per cent decrease with regard to year-end 2011. This decrease is mostly a consequence of the ag-gregate effect of the world economic crisis and the expiry of the 10-year membership of the OVPS supplementary pension scheme. In addition, most of the former employees in companies which are in bankruptcy proceedings drew down the saved funds from the pension fund OVPS, even though the personal income tax bill is to soar due to the “windfall” income.
At the end of 2012, the OVPS of Banka Koper had 5,963 members or 4.18 per cent less than a year earlier, of which 5,325 persons were collectively insured and 638 were individually insured. The number of companies – sponsors of the collective schemes fell by one company; hence, at the end of 2012, the OVPS had 104 companies.
The unit asset value increased by 4.41 per cent year-on-year and reached 8.5715 euros at the end of 2012. It is worth mentioning that the value of asset unit has practically doubled over the long-term horizon, and the return on the funds’ assets has surged since it was established to 105.41 per cent by the end of 2012.
24 Banka Koper annual report 2012 • business report

The biggest portion of capital investments (gross capital formation) – 2.0 million euros or 63.7 per cent of all investments - was allocated in 2012 to the computerisation of banking operations, of which the biggest portion for the development of the banking applications for managing liquidity risk and for the preparation of the system of internal credit rating systems. Substantial investments in the area of card operations were inevitable in order to meet ever-stricter security requirements in this area.
In 2012 Banka Koper allocated only 0.8 million euros, that is, 24.1 per cent of total investments to renovation and refurnishment of premises and modern state-of-the-art banking service, as well as the refurbishment of its branches to be in line with the corporate image of the parent banking group.
6.2 Information technology and technological development
During the year under review, Banka Koper continued with the implementation of the »Green branch offices«, which, among other things, enable our customers to use electronic signing of docu-ments. The customers have been using for electronic signing the already existing payment cards with a chip on which also a digital certificate is downloaded. The customer signs a transaction using his/her PIN code right after agreeing with the cintent of the transaction, that is, of the contract. There is also a system for electronic archiving of documents.
The project is an additional element within the framework of the environmental project »Trajnostni razvoj s pogledom 360 stopinj«, where also with a series of other activities executed by the bank together with our customer we demonstrate that we do care for a better tomorrow.
During the year under review, there was the intensive development of the electronic bank Banka In for business entities, which will provide in the course of 2013 with its new solution new functionali-ties and advanced approaches in the direction of paperless banking transactions. With the comple-tion of the project, the overhaul of the bank’s internet operations will be completed both for legal persons and for natural persons. The comprehensive solution has value added also in mobility, since with practically all its functionalities is can be reached also on the phone sets with iOS, Android, Win-dows and Java operating systems.
tHe BAnK’S oRGAnIC GRoWtH AnD DeVelopMent
6.1 Capital investments
Also in 2012, Banka Koper continued with the implementation of the long-term development pro-gramme and invested 3.2 million euros in the computerisation of its operations, in office space and in other equipment. Bank’s capital investments in 2012 were lower by 38.1 per cent or 2.0 million euro compared to 2011.
06.
Structure of capital investments in 2012
Business computerisation 63.7%
Other equipment 12.2 %
Business premises 24.1 %
25Banka Koper annual report 2012 • business report

During the year under review, the bank prepared and implemented for its loyal customers a package of benefits (MOJ PAKET) with which it is offering more favourable conditions for doing business to all those customers, which have a bank account (TRR) opened with Banka Koper and at least one form of long-term savings.
In the area of the provision of payment services, Banka Koper completed successfully the migra-tion of direct debits to the SEPA DD scheme and implemented the possibilities for mass payments to be compatible with the latest version of the XML standards. Furthermore, the bank in the area of payment transactions and e-invoices continued with the B2B linking of major enterprises; hence, the bank was able to provide a larger volume of mass transactions and a direct connection to the ERP environment of the enterprises, which enables a more optimal and more rational provision of busi-ness processes for the bank and for the enterprises.
During the year under review, the bank offered its customers a new card MOJA Activa Visa Electron. It is the international prepayment card, which enables safe shopping from various points of sale (also on the internet) and withdrawing cash in Slovenia and abroad. The card is tailored for the customers and also for non-customers, so it offers an opportunity to increase the number of customers, step up cross-selling and boost the number of transactions.
In the area of lending and deposit taking operations, the bank offered to the customers a few new products, with which it also covered the specific needs of its customers.
In collaboration with the parent bank, the activities were carried out in the area of establishing the system for the management of liquidity risks. The project will be completed in the course of 2013.
The activities were highly intensive on the project for providing an IT platform for the process of ap-proving loans and the process for leading the so-called soft debt collection both for natural persons and for legal persons. Both projects will be wrapped up in the first half of 2013 and will enable ef-ficient management of the bank’s claims, making records of all contacts made with the customers, monitoring the execution of the agreements made and, at the end of the day, achieving a higher degree of and faster financial effects.
In accordance with the guidelines issued by the parent bank, during the year under review, the project for the establishment of the central data base and the adequate processes for the needs of the area of credit risks were carried out. The result of the environment prepared as described above are the standardised reports, which enable to get an insight into the credit risks and also serve as a tool for taking adequate measures at the level of the bank.
the technological support for the support for sales (CRM) as well as also the central Data warehouse was amended with new content and functionalities with the aim to enable comprehen-sive data/information at a daily level for various needs of the bank and of external regulators.
During the year under review, Banka Koper established a new technological solution for the intranet, which enables all the employees a better insight into the functioning, that is, developments in Banka Koper, the possibility of access to all internal information and documents necessary for carrying out the work processes at one place. In addition, the new solution takes into account the common guidelines of the group from the position of the functional approach and the active participation of all the employees in creating the content and this in turn serves to raise the level of the satisfaction of the employees.
During the year under review, in the area of the technical infrastructure, the bank completed the project for the migration of the workstations to the MS Windows 7 operating system, it carried out the renewal of the switches in the DMZ network of the bank and in the area of the virtual server environment, it migrated to a newer system version making it possible for the bank to exploit some new functionalities.
26 Banka Koper annual report 2012 • business report

The structure
As at 31 December 2012 Banka Koper had 770-strong staff, of which 184 male and 586 female em-ployees. Two employees come from the Intesa Sanpaolo group. We hired 30 persons and 45 persons left Banka Koper.
HuMAn ReSouRCeS07.
Number of employees by educational level
level of education In or lower VI VII or higher total
Number of employees 327 91 352 770
Share (in %) 42.5% 11.8% 45.7% 100%
Education and training
Despite harsh economic conditions and the cost cutting measures performed at all levels, among other areas also in the education and training area, Banka Koper paid particular attention during the year under review also to training its employees. The portion of funds allocated to education and training in 2012 was 1.3 per cent of the total expenditure of Banka Koper (without labour costs). In the course of 2012, 1,831 participants had 15,549 hours of education and/or training. The average number of hours the Bank’s employee spent at a seminar or a workshop in 2012 was 20.2 hours.
The training sessions organised within the Bank prevailed in 2012 with as much as 87.6 per cent of training delivered of which the internal lecturers and coaches accounted for a 46.2 per cent share and the external (outsourced) lecturers/coaches delivered 41.3 per cent of training. Following the re-organisation of the area of business (retail) network, in collaboration with the parent bank, extensive training was carried out for the sales staff dealing with customers - natural persons in the area of sales skills, while through the year Banka Koper also took care of making all the employees aware of the significance of the prevention of money laundering and terrorist financing, and the compliance function for the entire bank and its operations.
The development of key personnel
During the year under review, in the area of the development of the bank’s staff with a high potential, certain modifications were made with the aim to enable a more systematic key staff management in Banka Koper. In the area of the development of such key staff, Banka Koper will have two separate programmes and namely:
• The programme for the development of the highly perspective staff: for the young potential that currently occupies expert workposts with a potential for managerial positions in the sales or in the professionals segments.
• The programme for the development of managers: tailored to meet the needs of the employ-ees occupying managerial positions up to the level of a coordinator and project leaders..
THE PROGRAMME FOR THE DEVELOPMENT OF STAFF WITH HIGH POTENTIALBack in 2009, Banka Koper embarked on the project for the development of its promising employ-ees with the aim to establish a system for timely spotting, development and retention of the best people in Banka Koper seen as being the backbone of the Bank’s human resource management at present and in the future so that its employees can be readily promoted when necessary. Through the project, the candidates of the first generation could develop in the professional and personal areas and through the process obtain knowledge and experience for their present positions, that is, for their future positions. During this period, these employees attended the general and specific training courses tailored to meet the needs of their development course, that is, the career for which these talented people were chosen. The set objective was also achieved for the first generation, since starting with the project launch, whenever there was a vacancy in managerial ranks, potential
27Banka Koper annual report 2012 • business report

incumbents were first look for in the so-called »pool« of eligible employees. In the pool there were the employees identified by Banka Koper as meeting the requirements and also trained to take over more demanding positions.
At the end of the year 2012, the development of the perspective staff included a new round of the second generation of candidates. The programme for the staff development was improved and Banka Koper took the necessary steps to harmonise it with the prescribed competence model, pre-scribed by the ISP group. The programme is composed of two parts: the on-the-job development and systematic training.
THE PROGRAMME FOR MANAGER DEVELOPMENTIn addition to the care for the career and personal development of young staff with a perspective, it is also very important to groom another group of key staff – managers. In the programme for the development of managers, all employees at the positions from being a head to the coordinator and project leaders are included, since for the purpose of introducing changes in the area of interpersonal relations it is of paramount importance that all heads/managers are included in the training process. The training programme for management comprises the same elements as the training programme for staff with high potential groomed for future managers. Every year the managerial staff in Banka Koper will attend a workshop about management to take them to the next management level.
poSItIonInG BuSIneSS FoR GRoWtH In 2013
By being closely knitted with the banking group Intesa Sanpaolo, Banka Koper can benefit from nu-merous advantages and synergies both in the area of the transfer of knowledge, technology and the use of the international subsidiary network, as well as in the area of winning new business partners. Banka Koper will continue to foster the concept of a universal bank and it plans also to continue to expand its business at a steady pace in all lines of business.
Banka Koper will continue also in the future with the organic growth of its operations. Banka Koper will focus effort on the maintenance of a high quality of its credit portfolio. Personal attention will be paid to the segment of individuals and small and micro enterprises.
Objectives of Banka Koper in 2013:• the strengthening of the market share: Banka Koper is committed to improving its market
position and increasing its market share in 2013. The Bank still clinches most business deals in the Coastal and Karst zones, where it is the market leader. Nevertheless, over the past few years, it has built a widespread retail network with 54 branches in effort to win clients also in other parts of Slovenia. For the year 2013, Banka Koper is planning a rationalisation of its business network and strengthening of its commercial activities across the territory.
• launching new products: It is the aim of Banka Koper to continue with the launch of new products and services expected to expand its sources of income. In the year 2013, in the area of card business, a new debit card will be issued - Visa Inspire (the common debit card for all banks in the Intesa Sanpaolo group) and the VIP black card Activa Visa Infinite. Banka Koper will continue to provide housing loans at a favourable interest rate, as well as housing loans with the capped interest rate that shelter borrowers against hikes in the ECB key refinancing rate. The idea is to reach out to a wide range of customers in various segments by offering standard products and by diversifying a number of different products with a special emphasis on the products tailored to meet the needs of small and micro enterprises.
• to become a market leader in the area of custodian banking: Banka Koper currently has a 36 per cent market share in the area of custodian banking. In the year 2013, Banka Koper is planning to continue to attract clients in that area with the aim to increase the existing market share.
08.
28 Banka Koper annual report 2012 • business report

• Monitoring customers and customer relationship management: for a number of years Banka Koper has been implementing the project Listening 100% with the slogan »Ask us, only together with you we can grow«, within the framework of which more than one improvement has been made. To listen to what the customers have to say is the rule followed in the bank’s business serving for the bank to improve the quality of its services and develop successful cooperation to mutual satisfaction. The opinions of the customers are a valuable contribution and help in developing the bank’s products, the quality of the services offered and the bank’s operations in general. Also in the course of 2013, the care for the customers remains at the centre of the banking operations with the emphasis on the advising functions and personal-ised treatment of customer in line with the commitment made by Banka Koper.
29Banka Koper annual report 2012 • business report

ORGANISATIONAL CHART AS AT 31 DECEMBER 2012
Small business (retail) network
Banking groupIntesa Sanpaolo
Finor Leasing d. o. o.
ISP Card d. o. o.
BankaKoper d. d.
97.5%
100%
15.3%
SMALL BUSINESS (RETAIL) NETWORK
WEST REGIJA EAST REGIJACENTRAL REGIJA
Business center Koper
Business center Postojna
Business center Nova Gorica
Business center Ljubljana
Business center Kranj
Business center Novo Mesto
Business center Maribor
Business center Celje
Business center Slovenj Gradec
Business center Murska Sobota
30 Banka Koper annual report 2012 • business report

Retail network
RETAIL NETWORK
RETAIL CENTER KOPER
Branch Koper
Branch Markovec
Branch Olmo
Branch Galeb
Branch Ankaran
RETAIL CENTER NOVA GORICA
Branch Nova Gorica
Branch Idrija
Branch Tolmin
Branch Ajdovščina
RETAIL CENTER NOVO MESTO
Branch Novo Mesto
Branch Trebnje
Branch Sevnica
Branch Črnomelj
Branch Brežice
RETAIL CENTER MURSKA SOBOTA
Branch Murska Sobota
RETAIL CENTER SLOVENJ GRADEC
Branch Slovenj Gradec
Branch Radlje ob Dravi
Branch Ravne na Koroškem
RETAIL CENTER LJUBLJANA
Branch Ljubljana Center
Branch Trzin
Branch Kamnik
Branch Logatec
Branch Brdo
Branch Grosuplje
Branch Kočevje
Branch Slovenska
Branch Dunajska
RETAIL CENTER KRANJ
Branch Kranj
Branch Radovljica
Branch Jesenice
Branch Globus
RETAIL CENTER CELJE
Branch Celje
Branch Velenje
Branch Žalec
Branch Šentjur
RETAIL CENTER LUCIJA
Branch Lucija
Branch Portorož
Branch Piran
RETAIL CENTER POSTOJNA
Branch Postojna
Branch Pivka
RETAIL CENTER MARIBOR
Branch Maribor
Branch Ptuj
Branch Lenart
Branch Ormož
Branch Miklavž
Branch Slovenska BistricaRETAIL CENTER ILIRSKA BISTRICA
Branch Ilirska Bistrica
Branch Trnovo
Branch Podgrad
RETAIL CENTER SEŽANA
Branch Sežana
Branch Kozina
Branch Komen
Branch Divača
RETAIL CENTER IZOLA
Branch Izola
31Banka Koper annual report 2012 • business report

INTERNAL ORGANISATION CHART
MANAGEMENT BOARD
RETAILDIVISION
CORPORATE AND CAPITAL
MARKETS DIVISION
COO DIVISION
CRO DIVISIONCFO DIVISION
Customer RelationshipManagement
Voices of theCustomers
Customer ServiceCenter
Micro Business andIndividuals
Small Business
Retail NetworkMicro Business and individuals
Products Development
CustodyALM
Planning & Controlling
Accounting& Global Reconc.
Credit Control
Accounting
TreasuryMedium and Large Corporate
Brokerage
Funding &Corresp. Banking
Money Market &Propriet. Portfolio
Middle Office
Retail Network SmallBusiness
SecurityOrganization &Business Processes
Operations
PMO
Credit Accounts
Payments & Docum.Business
Information Tecnology
IT Development
General Services,Premises & Procurement
CreditAnalysis
Risk Policy andMethodology
Credit Collection
General Ledger
Reporting
Small Businessand Retail CreditAnalysis
Medium and LargeCorporate CreditAnalysis
IT Operations and Architecture
Help DeskDeposit Accounts &Paym. Enforc.
Trade Accounts
Central Vault & CashFlow Management
Legal Office
Compliance Office
Marketing and Corporate Communication Office
Internal Audit
HR & General Secretariat
32 Banka Koper annual report 2012 • business report

MANAGEMENT BOARD
RETAILDIVISION
CORPORATE AND CAPITAL
MARKETS DIVISION
COO DIVISION
CRO DIVISIONCFO DIVISION
Customer RelationshipManagement
Voices of theCustomers
Customer ServiceCenter
Micro Business andIndividuals
Small Business
Retail NetworkMicro Business and individuals
Products Development
CustodyALM
Planning & Controlling
Accounting& Global Reconc.
Credit Control
Accounting
TreasuryMedium and Large Corporate
Brokerage
Funding &Corresp. Banking
Money Market &Propriet. Portfolio
Middle Office
Retail Network SmallBusiness
SecurityOrganization &Business Processes
Operations
PMO
Credit Accounts
Payments & Docum.Business
Information Tecnology
IT Development
General Services,Premises & Procurement
CreditAnalysis
Risk Policy andMethodology
Credit Collection
General Ledger
Reporting
Small Businessand Retail CreditAnalysis
Medium and LargeCorporate CreditAnalysis
IT Operations and Architecture
Help DeskDeposit Accounts &Paym. Enforc.
Trade Accounts
Central Vault & CashFlow Management
Legal Office
Compliance Office
Marketing and Corporate Communication Office
Internal Audit
HR & General Secretariat
33Banka Koper annual report 2012 • business report

STABILITY A global bank with a local touch.
Olive Tree – Olea europaea

FInAnCIAl StAteMentS 2012


INDEPENDENT AUDITORS’ REPORT ON FINANCIAL STATEMENTS


STATEMENT OF MANAGEMENT’S RESPONSIBILITIES
The management is responsible for preparing financial statements for each financial year that present fairly the state of affairs of the Bank and its subsidiaries as at the end of the financial year and of the profit or loss for that period.
The management confirms that suitable accounting policies have been used and applied consistently and reasonable and prudent judgments and estimates have been made in the preparation of the financial statements for the year ended 31 December 2012. The management also confirms that the financial statements have been prepared on the going concern basis and in accordance with the ap-plicable laws and International Financial Reporting Standards, as adopted by the EU.
The management is responsible for keeping proper accounting records, for taking reasonable steps to safeguard the assets of the Bank and its subsidiaries and to prevent and detect fraud and other irregularities.
In accordance with local regulations, the tax authorities may at any time inspect the Bank’s books and records within 5 years subsequent to the reported tax year and may impose additional tax assess-ments and penalties. The Bank’s management is not aware of any circumstances, which may give rise to a potential material liability in this respect.
Koper, 15 March 2013
Member Aleksander Milostnik
MemberAleksander Lozej, M.Sc
Deputy presidentIgor Kragelj
MemberRado Grdina
PresidentGiancarlo Miranda, M.Sc
MemberFrancesco Del Genio
Banka Koper annual report 2012 • financial statements 39

FINANCIAL STATEMENTS
StAteMent oF InCoMe01.
The following notes on pages 45 to 129 form an integral part of these financial statements.
all amounts expressed in thousands of EUR
Year ended 31 December notes Banka Koper Consolidated
2012 2011 2012 2011
Interest income 4 79,955 86,273 83,435 89,509
Interest expense 4 (29,525) (26,408) (30,632) (27,819)
net interest income 50,430 59,865 52,803 61,690
Dividend income 5 1,572 1,038 972 638
Fee and commission income 6 40,446 40,456 41,136 40,888
Fee and commission expense 6 (15,811) (13,515) (15,848) (13,550)
net fee and commission income 24,635 26,941 25,288 27,338
Gains less losses from financial assets and liabilities not recognised at fair value through profit and loss 7 (896) 1,495 (896) 1,495
Gains less losses from financial assets and liabilities held for trading 8 247 1,652 247 1,652
Gains and losses on financial assets and liabilities designated at fair value through profit or loss 70 - 70 -
Fair value adjustments in hedge accounting 9 234 29 234 29
Gains less losses from foreign exchange transactions (31) (1,330) (34) (1,324)
Gains less losses on derecognition of non-current assets other than held for sale 10 87 (232) 133 (214)
Other operating gains less losses 11 1,043 1,192 1,680 1,868
Administrative expenses 12 (39,393) (42,100) (40,342) (42,980)
Amortisation and depreciation 13 (5,143) (5,034) (5,618) (5,477)
Provisions: (1,285) 456 (1,319) 403
- provisions 14 (865) 701 (894) 655
- retirement benefit obligations 14 (420) (245) (425) (252)
Impairment losses on loans and advances 15 (22,758) (22,204) (23,752) (22,935)
operating profit 8,812 21,768 9,466 22,183
Income tax expense 16 (1,627) (4,095) (1,863) (4,247)
net profit for the period 7,185 17,673 7,603 17,936
Attributable to:
Equity holders of the parent 7,185 17,673 7,603 17,936
Non-controlling interest - - - -
7,185 17,673 7,603 17,936
Earnings per share (basic and diluted)
(expressed in EUR per share) 17 13.55 33.32 14.33 33.82
Banka Koper annual report 2012 • financial statements 40

StAteMent oF CoMpReHenSIVe InCoMe(all amounts expressed in thousands of EUR)
02.
Banka Koper Consolidated
Year 2012 Year 2011 Year 2012 Year 2011
NET PROFIT OR LOSS FOR THE FINANCIAL YEAR AFTER TAX 7,185 17,673 7,603 17,936
OTHER COMPREHENSIVE INCOME NET OF TAX 6,478 (10,568) 6,478 (10,568)
Available-for-sale financial assets 7,701 (13,211) 7,701 (13,211)
- valuation gains (losses) taken to equity 3,793 (15,310) 3,793 (15,310)
- transferred to profit or loss 3,908 2,099 3,908 2,099
Income tax relating to components of other comprehensive income (1,223) 2,643 (1,223) 2,643
TOTAL COMPREHENSIVE INCOME FOR THE FINANCIAL YEAR AFTER TAX 13,663 7,105 14,081 7,368
a) Attributable to owners of the parent 14,081 7,368
b) Attributable to non-controlling interests - -
Banka Koper annual report 2012 • financial statements 41

StAteMent oF FInAnCIAl poSItIon03.(all amounts expressed in thousands of EUR)
As at 31 December Banka Koper Consolidated
notes 2012 2011 2012 2011
ASSETS
Cash and balances with Central Banks 19 29,388 35,463 29,388 35,463
Financial instruments held for trading: 290 3,318 290 3,318
- trading assets 20 - 1,292 - 1,292
- derivative financial instruments 21 290 2,026 290 2,026
Financial assets designated at fair value through profit or loss 282 - 282 -
Investment securities available for sale 22 304,090 288,218 304,090 288,218
Loans and advances: 1,941,582 1,878,871 1,986,394 1,938,636
- to banks 23 58,308 44,889 58,308 44,889
- to customers 24 1,863,839 1,824,563 1,913,776 1,883,362
- advances 25 19,435 9,419 14,310 10,385
Goodwill 26 - - 905 905
Property, plant and equipment 27 26,333 27,785 27,567 29,081
Investment property 28 1,028 1,112 6,445 1,112
Intangible assets 29 4,236 4,229 4,337 4,230
Investments in subsidiaries 30 3,688 3,688 - -
Income tax assets 4,681 5,857 5,244 6,292
- current income tax 3,229 - 3,229 -
- deferred income tax 40 1,452 5,857 2,015 6,292
Other assets 31 888 1,249 10,491 1,489
total assets 2,316,486 2,249,790 2,375,433 2,308,744
LIABILITIES
Liabilities to Central Bank 32 201,750 150,042 201,750 150,042
Financial instruments held for trading: 184 1,135 184 1,135
- derivative financial instruments 21 184 1,135 184 1,135
Liabilities carried at amortised cost: 1,823,723 1,811,794 1,880,275 1,868,606
- deposits from banks 33 75,359 233,741 75,359 233,741
- due to customers 34 1,507,316 1,332,896 1,507,301 1,332,894
- other borrowed funds from banks 35 214,170 207,551 270,211 263,636
- other borrowed funds from other customers 36 6,527 8,660 6,527 8,660
- other financial liabilities 37 20,351 28,946 20,877 29,675
Derivatives – Hedge accounting 21 1,573 992 1,573 992
Provisions: 11,386 10,451 11,454 10,485
- provisions for liabilities and charges 38 8,220 7,483 8,202 7,436
- retirement benefit obligations 39 3,166 2,968 3,252 3,049
Income tax liabilities: - 5,078 64 5,190
- current income tax - 1,535 64 1,647
- deferred income tax 40 - 3,543 - 3,543
Other liabilities 41 1,415 2,207 1,567 2,510
total liabilities 2,040,031 1,981,699 2,096,867 2,038,960
Banka Koper annual report 2012 • financial statements 42

SHAREHOLDERS´ EQUITY
Ordinary shares 42 22,173 22,173 22,173 22,173
Share premium 42 7,499 7,499 7,499 7,499
Revaluation reserves 43 8,788 2,310 8,788 2,310
Reserves from profit 44 225,209 224,847 225,209 224,847
Treasury shares 42 (49) (49) (49) (49)
Retained earnings (including income from the current year) 44 12,835 11,311 14,946 13,004
Non-controlling interest - - - -
total shareholders´ equity 276,455 268,091 278,566 269,784
total equity and liabilities 2,316,486 2,249,790 2,375,433 2,308,744
The following notes on pages 45 to 129 form an integral part of these financial statements.
Banka Koper annual report 2012 • financial statements 43

* Retained earnings in the amount of EUR 6,009 thousands arose from accounting differences in transition from local accounting standards to IFRS. Under the Management Board’s decision this part of retained earnings it is not available for distribution to shareholders. ** Including income from the current year.
The following notes on pages 45 to 129 form an integral part of these financial statements.
unConSolIDAteD StAteMent oF CHAnGeS In SHAReHolDeRS´ eQuItY (all amounts expressed in thousands of EUR)
04.
In theyear 2012 – unconsolidated notes
ordinary shares
Sharepremium
Revalua-tion
reserves
Reservesfrom
profit
Retainedearnings
or loss **
treasuryshares
(equitydeduction
item)total
equity
openInG BAlAnCe FoR tHe RepoRtInG peRIoD 22,173 7,499 2,310 224,847 11,311 (49) 268,091
Comprehensive income for the financial year after tax 43 - - 6,478 - 7,185 - 13,663
Appropriation of (accounting for) dividends 44 - - - - (5,299) - (5,299)
Transfer of net profit to reserves from profit 44 - - - 362 (362) - -
CloSInG BAlAnCe FoR tHe RepoRtInG peRIoD 22,173 7,499 8,788 225,209 12,835 (49) 276,455
pRoFIt AVAIlABle FoR DIStRIButIon - - - - 6,826 - 6,826
In theyear 2011 – unconsolidated openInG BAlAnCe FoR tHe RepoRtInG peRIoD 22,173 7,499 12,878 212,476 11,271 (49) 266,248
Comprehensive income for the financial year after tax 43 - - (10,568) - 17,673 - 7,105
Appropriation of (accounting for) dividends 44 - - - - (5,262) - (5,262)
Transfer of net profit to reserves from profit 44 - - - 12,371 (12,371) - -
CloSInG BAlAnCe FoR tHe RepoRtInG peRIoD 22,173 7,499 2,310 224,847 11,311* (49) 268,091
pRoFIt AVAIlABle FoR DIStRIButIon - - - - 5,302 - 5,302
Banka Koper annual report 2012 • financial statements 44

* Retained earnings in the amount of EUR 6,009 thousands arose from accounting differences in transition from local accounting standards to IFRS. Under the Management Board’s decision this part of retained earnings it is not available for distribution to shareholders. ** Including income from the current year
The following notes on pages 45 to 129 form an integral part of these financial statements.
ConSolIDAteD StAteMent oF CHAnGeS In SHAReHolDeRS´ eQuItY (all amounts expressed in thousands of EUR)
05.
In theyear 2012 – Consolidated notes
ordinary share
Sharepremium
Revalua-tion
reserves
Reservesfrom
profit
Retainedearnings
or loss **
treasuryshares
(capitaldeduction
item)
equityattributable
to ownersof theparent
totalequity
openInG BAlAnCe FoR tHe RepoRtInG peRIoD 22,173 7,499 2,310 224,847 13,004 (49) 269,784 269,784
Consolidated Comprehensive Income for the financial year after tax 43 - - 6,478 - 7,603 - 14,081 14,081
Appropriation of (accounting for) dividends 44 - - - - (5,299) - (5,299) (5,299)
Transfer of net profit to reserves from profit 44 - - - 362 (362) - - -
CloSInG BAlAnCe FoR tHe RepoRtInG peRIoD 22,173 7,499 8,788 225,209 14,946 (49) 278,566 278,566
In theyear 2011 – Consolidated
openInG BAlAnCe FoR tHe RepoRtInG peRIoD 22,173 7,499 12,878 212,476 12,701 (49) 267,678 267,678
Consolidated Comprehensive Income for the financial year after tax 43 - - (10,568) - 17,936 - 7,368 7,368
Appropriation of (accounting for) dividends 44 - - - - (5,262) - (5,262) (5,262)
Transfer of net profit to reserves from profit 44 - - - 12,371 (12,371) - - -
CloSInG BAlAnCe FoR tHe RepoRtInG peRIoD 22,173 7,499 2,310 224,847 13,004* (49) 269,784 269,784
Banka Koper annual report 2012 • financial statements 45

StAteMent oF CASH FloWS (all amounts expressed in thousands of EUR)
Banka Koper Consolidated
notes 2012 2011 2012 2011
CASH FLOWS FROM OPERATING ACTIVITIES
Total profit or loss before tax 8,812 21,768 9,466 22,183
Depreciation 5,143 5,034 5,618 5,477
Net (gains) / losses from exchange differences (725) 2,301 (722) 2,295
Net (gains) / losses from sale of tangible assets and investment properties (87) 232 (133) 214
Unrealised (gains) / losses from financial assets measured at fair value (2) 46 (2) 46
Net unrealised gains in revaluation reserves from financial assets available for sale (excluding effect of deferred tax) 7,700 (13,210) 7,700 (13,210)
Other adjustments to total profit or loss before tax (30) (456) 4 (403)
Cash flow from operating activities before changes in operating assets and liabilities 20,811 15,715 21,931 16,602
(Increases) / decreases in operating assets (excl. cash & cash equivalents) (45,231) 9,839 (45,151) 7,494
Net (increase) / decrease in balances with central banks 12,835 (1,064) 12,835 (1,064)
Net (increase) / decrease in financial assets held for trading 1,810 (1,878) 1,810 (1,878)
Net (increase) / decrease in financial assets designated at fair value through profit or loss (282) - (282) -
Net (increase) / decrease in financial assets available for sale (15,872) 24,758 (15,872) 24,758
Net (increase) / decrease in loans and receivables (33,718) (11,744) (24,339) (13,697)
Net (increase) / decrease in other assets (10,004) (233) (19,303) (625)
Increases / (decreases) in operating liabilities 63,846 (15,936) 63,645 (13,479)
Net increase / (decrease) in financial liabilities to central bank 51,708 150,042 51,708 150,042
Net increase / (decrease) in financial liabilities held for trading (951) 616 (951) 616
Net increase / (decrease) in deposits and loans measured at amortised cost 20,974 (174,519) 15,153 (172,206)
Net increase / (decrease) in liability – derivatives – hedge accounting 581 992 581 992
Net increase / (decrease) in other liabilities (8,466) 6,933 (2,846) 7,077
Cash flow from operating activities 39,426 9,618 40,425 10,617
Income taxes (paid) / refunded (6,708) (3,503) (7,007) (3,690)
net cash flow from operating activities 32,718 6,115 33,418 6,927
CASH FLOWS FROM INVESTING ACTIVITIES
Receipts from investing activities 103 656 313 847
Receipts from the sale of tangible assets and investment properties 103 330 313 521
Receipts from matured financial assets held to maturity - 326 - 326
Cash payments on investing activities (2,228) (6,277) (3,125) (7,284)
Cash payments to acquire tangible assets and investment properties (1,162) (3,198) (2,059) (4,205)
Cash payments to acquire intangible fixed assets (1,066) (3,069) (1,066) (3,069)
Cash payments to acquire held to maturity investments - (10) - (10)
net cash flow from investing activities (2,125) (5,621) (2,812) (6,437)
CASH FLOWS FROM FINANCING ACTIVITIES
Cash proceeds from financing activities - - - -
Cash payments on financing activities (5,299) (5,259) (5,299) (5,259)
Dividends paid (5,299) (5,259) (5,299) (5,259)
net cash flow from financing activities (5,299) (5,259) (5,299) (5,259)
Effects of change in exchange rates on cash and cash equivalents (756) 971 (756) 971
net increase in cash and cash equivalents 25,294 (4,765) 25,307 (4,769)
opening balance of cash and cash equivalents 44 33,285 37,079 33,287 37,085
Closing balance of cash and cash equivalents 44 57,823 33,285 57,838 33,287
06.
Banka Koper annual report 2012 • financial statements 46

Operational cash flows of interest and dividends (all amounts expressed in thousands of EUR)
Banka Koper Consolidated
2012 2011 2012 2011
Interest paid (13,156) (28,606) (14,263) (30,017)
Interest received 79,980 85,038 83,460 88,274
Dividends Received 1,572 1,038 972 638
Operational cash flows of interest and dividend is part of total profit before tax. As at 31st December 2012, the Bank and Group had undrawn credit lines and loans already commit-ted of EUR 370,000 thousand (2011: EUR 430,000 thousand).
The Bank and the Group have credit lines and other facilities of EUR 370,000 thousand that are avail-able for financing future business operations without any restrictions.
The following notes on pages 45 to 129 form an integral part of these financial statements.
Banka Koper annual report 2012 • financial statements 47

eFFeCtIVeneSSSimplicity is the way to effectivenes
Flaming Katy - Kalanchoe blossfeldiana

NOTES TO FINANCIAL STATEMENTSGeneRAl InFoRMAtIon
Banka Koper is a universal bank with the full range of banking services: commercial banking, invest-ment banking, custody banking, private banking, international operations and financial and operat-ing leasing through its subsidiary Finor Leasing d.o.o..
Banka Koper is a public limited company with its head office in Pristaniška 14, Koper. Finor Leas-ing is a limited liability company, 100 % owned by the Bank, with share capital of 2,045 thousand EUR and its head office in Pristaniška 14, Koper. Since the end of February 2007, the Bank owned 75 % of Centurion finančne storitve d.o.o. Ljubljana, a financial company operating in the credit card business. Centurion finančne storitve d.o.o. Ljubljana is a limited liability company with share capital of 1,648 thousand EUR and its head office in Slovenčeva 24, Ljubljana. In June 2009, the company Centurion finančne storitve d.o.o. Ljubljana, was renamed to ISP Card d.o.o., Ljubljana. From 1st August 2009 Banka Koper d.d., on the initiative of the parent bank, spun off its credit card processing activity. As a result, the credit card business, that is tangible and intangible fixed assets, contract obligations and employees, was transferred to ISP Card d.o.o., Ljubljana. The fair value of the transferred intangible and tangible fixed assets represented an additional stake of Banka Koper in ISP Card d.o.o., which on 31st December 2009 amounted to 92,67 %. According to the initiative of the parent Bank, Banka Koper sold the investment in ISP Card d.o.o. Ljubljana to ISP Card d.o.o. Zagreb in March 2010.
Since 2002, Banka Koper is a part of the banking group Intesa Sanpaolo (originally SanpaoloIMI), one of the leading banking groups in Italy. As at January 1st 2007 the banking group Sanpaolo IMI merged with Banca Intesa. Banka Koper is owned directly by the ultimate parent bank Intesa San-paolo. It has a head office in Piazza San Carlo 166, Turin, Italy and a secondary office in Via Monte di Pietá 8, Milano, Italy.
Banka Koper has the status of a significant subsidiary bank, and therefore is required to disclose in-formation related to the 3rd and 4th item of article 207 of the Banking act and articles 12 and 13 of the Decree of necessary disclosures of financial institution, which is about capital and internal capital on a consolidated basis. According to article 23. c and d of the Changes in Decree of necessary dis-closures of financial institution, Banka Koper is required to make disclosures about information of significant business contacts and other rules and politics for avoiding conflicts of interest of members of the Management Board and Supervisory bodies of subsidiary financial entities with headquarters outside the Republic of Slovenia.
According to the Slovene Companies Act, the Bank has to prepare separate and consolidated finan-cial statements.
The date of the Management Board statement quoted ahead of the Financial Statements is to be considered as the approval date of the financial statements.
SuMMARY oF SIGnIFICAnt ACCountInG polICIeS
The principal accounting policies adopted for the preparation of the separate and consolidated finan-cial statements are set out below:
01.
02.
Banka Koper annual report 2012 • financial statements 49

2.1 Basis of preparation
Presentation of financial statements
The financial statements are prepared in accordance with International Financial Reporting Standards (IFRS) as adopted by the EU.
Basis of measurement
The financial statements are prepared under the historical cost convention and modified by the re-valuation of available for sale investment securities, financial assets and financial liabilities at fair value through profit or loss, all derivative contracts and investment property.
Use of estimates and judgements
The preparation of financial statements in conformity with IFRS as adopted by the EU requires the use of estimates and assumptions that affect the reported amounts of assets and liabilities and dis-closure of contingent assets and liabilities at the date of the financial statements and the reported amounts of revenues and expenses during the reporting period. Although these estimates are based on management’s best knowledge of current events and actions, actual results ultimately may differ from those estimates.
Use of estimates and judgements are applied for:
• Impairment of loans and advances• Fair value of financial instruments• Impairment of instruments available of sale
More detailed discloser is shown under chapter 2.14 Impairment of financial assets.
The accounting policies used are consistent with those applied in the previous year.
Standards issued but not yet effective and not early adopted
The following new Standards and Interpretations are not yet effective for the annual period ended 31 December 2012 and have not been applied in preparing these financial statements:
Banka Koper annual report 2012 • financial statements 50

Standard/Interpretation nature of impending change in accounting policy
example wording regarding the possible impact on financial statements
Amendments to IFRS 7 Disclosures - Offsetting Fi-
nancial Assets and Financial Liabilities
(Effective for annual periods beginning on or after
1 January 2013 and interim periods within those
annual periods; to be applied retrospectively.)
The Amendments contain new disclosure require-
ments for financial assets and liabilities that are:
• offset in the statement of financial position;
or
• subject to master netting arrangements or
similar agreements.
The entity does not expect the Amendments to
have any impact on the financial statements since
it does not apply offsetting to any of its financial
assets and financial liabilities and it has not entered
into master netting arrangements.
IFRS 10 Consolidated Financial Statements and IAS
27 (2011) Separate Financial Statements1 2
(Effective for annual periods beginning on or after
1 January 2014; Earlier application is permitted if
IFRS 11, IFRS 12, IAS 27 (2011) and IAS 28 (2011)
are also applied early.)
This Standard is to be applied retrospectively when
there is a change in control conclusion.
IFRS 10 provides a single model to be applied in the
control analysis for all investees, including entities
that currently are SPEs in the scope of SIC-12. IFRS
10 introduces new requirements to assess control
that are different from the existing requirements in
IAS 27 (2008). Under the new single control mod-
el, an investor controls an investee when:
• it is exposed or has rights to variable returns
from its involvements with the investee;
• it has the ability to affect those returns
through its power over that investee; and
• there is a link between power and returns.
The new Standard also includes the disclosure re-
quirements and the requirements relating to the
preparation of consolidated financial statements.
These requirements are carried forward from IAS
27 (2008).
The Group does not expect the new standard to
have any impact on the financial statements, since
the assessment of control over its current investees
under the new standard is not expected to change
previous conclusions regarding the Group’s control
over its investees.
IFRS 11 Joint Arrangements1
(Effective for annual periods beginning on or after
1 January 2014; to be applied retrospectively sub-
ject to transitional provisions. Earlier application is
permitted if IFRS 10, IFRS 12, IAS 27 (2011) and IAS
28 (2011) are also applied early.)
IFRS 11, Joint Arrangements, supersedes and re-
places IAS 31, Interest in Joint Ventures. IFRS 11
does not introduce substantive changes to the
overall definition of an arrangement subject to
joint control, although the definition of con-
trol, and therefore indirectly of joint control, has
changed due to IFRS 10.
Under the new Standard, joint arrangements are
divided into two types, each having its own ac-
counting model defined as follows:
• a joint operation is one whereby the jointly
controlling parties, known as the joint opera-
tors, have rights to the assets, and obligations
for the liabilities, relating to the arrangement.
• A joint venture is one whereby the jointly
controlling parties, known as joint venturers,
have rights to the net assets of the arrange-
ment.
IFRS 11 effectively carves out from IAS 31 jointly
controlled entities those cases in which, although
there is a separate vehicle for the joint arrange-
ment, separation is ineffective in certain ways.
These arrangements are treated similarly to jointly
controlled assets/operations under IAS 31, and are
now called joint operations. The remainder of IAS
31 jointly controlled entities, now called joint ven-
tures, are stripped of the free choice of equity ac-
counting or proportionate consolidation; they must
now always use the equity method in its consoli-
dated financial statements.
The Group does not expect IFRS 11 to have mate-
rial impact on the financial statements since it is
not a party to any joint arrangements.
Banka Koper annual report 2012 • financial statements 51

Standard/Interpretation nature of impending change in accounting policy
example wording regarding the possible impact on financial statements
IFRS 12 Disclosure of Interests in Other Entities 1 3
(Effective for annual periods beginning on or after
1 January 2014; to be applied retrospectively. Ear-
lier application is permitted.
IFRS 12 requires additional disclosures relating to
significant judgements and assumptions made in
determining the nature of interests in an entity
or arrangement, interests in subsidiaries, joint ar-
rangements and associates and unconsolidated
structured entities.
It is expected that the new Standard, when initially
applied, might have a significant impact on the
level of disclosure in the financial statements. How-
ever, the Group is not able to prepare an analysis
of the impact this will have on the financial state-
ments until the date of initial application.
IFRS 13 Fair Value Measurement
(Effective prospectively for annual periods begin-
ning on or after 1 January 2013. Earlier application
is permitted.)
IFRS 13 replaces the fair value measurement guid-
ance contained in individual IFRSs with a single
source of fair value measurement guidance. It
defines fair value, establishes a framework for
measuring fair value and sets out disclosure re-
quirements for fair value measurements. IFRS 13
explains ‘how’ to measure fair value when it is re-
quired or permitted by other IFRSs. The standard
does not introduce new requirements to measure
assets or liabilities at fair value, nor does it eliminate
the practicability exceptions to fair value measure-
ments that currently exist in certain standards.
The standard contains an extensive disclosure
framework that provides additional disclosures to
existing requirements to provide information that
enables financial statement users to assess the
methods and inputs used to develop fair value
measurements and, for recurring fair value meas-
urements that se significant unobservable inputs,
the effect of the measurements on profit or loss or
other comprehensive income.
The entity does not expect IFRS 13 to have material
impact on the financial statements since manage-
ment considers the methods and assumptions cur-
rently used to measure the fair value of assets to be
consistent with IFRS 13.
Amendments to IAS 1 Presentation of Financial
Statements: Presentation of Items of Other Com-
prehensive Income
(Effective for annual periods beginning on or after
1 July 2012; to be applied retrospectively. Earlier
application is permitted.)
The amendments:
• require that an entity presents separately the
items of other comprehensive income that
may be reclassified to profit or loss in the fu-
ture from those that would never be reclassi-
fied to profit or loss. If items of other compre-
hensive income are presented before related
tax effects, then the aggregated tax amount
should be allocated between these sections.
• change the title of the Statement of Compre-
hensive Income to Statement of Profit or Loss
and Other Comprehensive Income, however,
other titles are also allowed to be used.
The impact of the initial application of the amend-
ments will depend on the specific items of other
comprehensive income at the date of initial appli-
cation. If the entity were to adopt the amendments
from 1 January 2012, then any amount and item
of other comprehensive income would never be re-
classified to profit or loss.
1 The transition guidance (Amendments to IFRS 10, IFRS 11 and IFRS 12) issued 28 June 2012 by the IASB has not been en-dorsed by the eu as at 7 January 2013. The Transition guidance adds further paragraphs to the transitional provisions of IFRS 10 and IFRS 11 and IFRS 12 providing further relief from full retrospective application.
2 Also Investment entities (Amendments to IFRS 10, IFRS 12 and IAS 27) issued on 31 October 2012 by the IASB has not been endorsed by the eu as at 7 January 2013. This amendment provides consolidation relief for qualifying investment entities.
3 Providing some of the disclosures required by IFRS 12 before the effective date does not compel the entity to comply with all the requirements of IFRS 12 or to apply IFRS 10, IFRS 11, IFRS 12, IAS 27 (2011) and IAS 28 (2011) early.)
Banka Koper annual report 2012 • financial statements 52

Standard/Interpretation nature of impending change in accounting policy
example wording regarding the possible impact on financial statements
Amendments to IAS 12: Deferred Tax: Recovery of
Underlying Assets
(Effective for annual periods beginning on or after
1 January 2013; to be applied retrospectively. Ear-
lier application is permitted.)
The amendments introduce a rebuttable presump-
tion that the carrying value of investment property
measured using the fair value model would be
recovered entirely by sale. Management’s inten-
tion would not be relevant unless the investment
property is depreciable and held within a business
model whose objective is to consume substantially
all of the asset’s economic benefits over the life of
the asset. This is the only instance in which the pre-
sumption can be rebutted.
The amendments are not relevant to the Group’s fi-
nancial statements, since the Group does not have
any investment properties measured using the fair
value model in IAS 40.
IAS 19 (2011) Employee Benefits
(Effective for annual periods beginning on or af-
ter 1 January 2013; to be applied retrospectively.
Transitional provisions apply. Earlier application is
permitted.)
The amendment requires actuarial gains and losses
to be recognised immediately in other comprehen-
sive income. The amendment removes the corridor
method previously applicable to recognising ac-
tuarial gains and losses, and eliminates the ability
for entities to recognise all changes in the defined
benefit obligation and in plan assets in profit or
loss, which currently is allowed under the require-
ments of IAS 19. The amendment also requires the
expected return on plan assets recognised in profit
or loss to be calculated based on rate used to dis-
count the defined benefit obligation.
The amendments are not relevant to the entity’s
financial statements, since the entity does not have
any defined benefit plans.
IAS 27 (2011) Separate Financial Statements
(Effective for annual periods beginning on or after
1 January 2014. Earlier application is permitted if
IFRS 10, IFRS 11, IFRS 12 and IAS 28 (2011) are also
applied early.)
IAS 27 (2011) carries forward the existing account-
ing and disclosure requirements of IAS 27 (2008)
for separate financial statements, with some mi-
nor clarifications. As well, the existing require-
ments of IAS 28 (2008) and IAS 31 for separate
financial statements have been incorporated into
IAS 27 (2011). The Standard no longer addresses
the principle of control and requirements relating
to the preparation of consolidated financial state-
ments, which have been incorporated into IFRS 10,
Consolidated Financial Statements.
[In separate financial statements] The Company
does not expect IAS 27 (2011) to have material im-
pact on the financial statements, since it does not
results in a change in the entity‘s accounting policy.
[In consolidated financial statements there is no
need to separately disclose the change in IAS 27
since the remaining portion of IAS 27 relates only
to separate financial statements and the portion
of IAS 27 that relates to the consolidated financial
statements should be addressed as part of the IFRS
10 discussion.]
Banka Koper annual report 2012 • financial statements 53

Standard/Interpretation nature of impending change in accounting policy
example wording regarding the possible impact on financial statements
IAS 28 (2011) Investments in Associates and Joint
Ventures
(Amendments effective for annual periods begin-
ning on or after 1 January 2014; to be applied ret-
rospectively. Earlier application is permitted if IFRS
10, IFRS 11, IFRS 12 and IAS 27 (2011) are also
applied early.)
There are limited amendments made to IAS 28
(2008):
• Associates and joint ventures held for sale.
IFRS 5, Non-current Assets Held for Sale and
Discontinued Operations applies to an invest-
ment, or a portion of an investment, in an
associate or a joint venture that meets the
criteria to be classified as held for sale. For
any retained portion of the investment that
has not been classified as held for sale, the
equity method is applied until disposal of the
portion held for sale. After disposal, any re-
tained interest is accounted for using the eq-
uity method if the retained interest continues
to be an associate or a joint venture.
• Changes in interests held in associates and
joint ventures. Previously, IAS 28 (2008) and
IAS 31 specified that the cessation of sig-
nificant influence or joint control triggered
remeasurement of any retained stake in all
cases, even if significant influence was suc-
ceeded by joint control. IAS 28 (2011) now
requires that in such scenarios the retained
interest in the investment is not remeasured.
The entity does not expect the amendments to
Standard to have material impact on the financial
statements since it does not have any investments
in associates or joint ventures that will be impacted
by the amendments.
Amendments to IAS 32 – Offsetting Financial As-
sets and Financial Liabilities
(Effective for annual periods beginning on or after
1 January 2014; to be applied retrospectively. Earli-
er application is permitted, however the additional
disclosures required by Amendments to IFRS 7 Dis-
closures - Offsetting Financial Assets and Financial
Liabilities must also be made.)
The Amendments do not introduce new rules for
offsetting financial assets and liabilities; rather they
clarify the offsetting criteria to address inconsisten-
cies in their application.
The Amendments clarify that an entity currently
has a legally enforceable right to set-off if that
right is:
• not contingent on a future event; and
• enforceable both in the normal course of
business and in the event of default, insol-
vency or bankruptcy of the entity and all
counterparties.
The entity does not expect the Amendments to
have any impact on the financial statements since
it does not apply offsetting to any of its financial
assets and financial liabilities and it has not entered
into master netting arrangements.
Banka Koper annual report 2012 • financial statements 54

Standard/Interpretation nature of impending change in accounting policy
example wording regarding the possible impact on financial statements
IFRIC 20 Stripping Costs in the Production Phase of
a Surface Mine
(Effective for annual periods beginning on or after
1 January 2013. It applies prospectively to produc-
tion stripping costs incurred on or after the begin-
ning of the earliest period presented. Earlier appli-
cation is permitted.)
The Interpretation sets out requirements relating to
the recognition of production stripping costs, initial
and subsequent measurement of stripping activity
assets.
To the extent that benefits from production strip-
ping are realised in the form of inventory pro-
duced, the related production stripping costs are
accounted for in accordance with IAS 2 Inventories.
Production stripping costs that improve access to
ore to be mined in the future are recognised as a
non-current asset if, and only if, all of the following
criteria are met:
• it is probable that future economic benefits
will flow to the entity;
• the entity can identify the component of
the ore body for which access has been im-
proved; and
• the costs relating to the stripping activity as-
sociated with that component can be meas-
ured reliably.
The stripping activity asset shall be accounted for
as an addition to, or as an enhancement of, an ex-
isting asset.
The stripping activity asset shall initially be recog-
nised at cost while after initial recognition, it shall
be carried at either its cost or its revalued amount,
less depreciation or amortisation and impairment
losses, in the same way as the existing asset of
which it is a part.
The Interpretation also requires that when the costs
of the stripping activity asset and of the inventory
produced are not separately identifiable, the entity
allocates production stripping costs between the
two based on a ‘relevant’ production measure.
The entity does not expect the Interpretation to
have any impact on the financial statements since
it does not have any stripping activities.
The Bank and Group are reviewing the impact of standards and interpretations which are not yet mandatory and have not yet been endorsed by the EU and, for the time being, have not assessed the impact of new pronouncements on its financial statements. The Bank and Group will apply new standards and interpretations in accordance with their requirements, if endorsed by the EU.
2.2 Consolidation
The consolidated financial statements comprise the financial statements of the Bank and its subsidiar-ies as at 31 December 2012.
Subsidiaries are fully consolidated from the date of acquisition, being the date on which the Group obtains control, and continue to be consolidated until the date when such control ceases. The finan-cial statements of the subsidiaries are prepared for the same reporting period as the parent bank, us-ing consistent accounting policies. All intra-group balances, transactions, unrealised gains and losses resulting from intra-group transactions and dividends are eliminated in full.
Banka Koper annual report 2012 • financial statements 55

Losses within a subsidiary are attributed to the non-controlling interest even if that results in a deficit balance. A change in the ownership interest of a subsidiary, without a loss of control, is accounted for as an equity transaction. If the Group loses control over a subsidiary, it:
• Derecognises the assets (including goodwill) and liabilities of the subsidiary• Derecognises the carrying amount of any non-controlling interest• Derecognises the cumulative translation differences, recorded in equity• Recognises the fair value of the consideration received• Recognises the fair value of any investment retained• Recognises any surplus or deficit in profit or loss• Reclassifies the parent’s share of components previously recognised in other comprehensive
income to profit or loss or retained earnings, as appropriate.
2.3 Reporting on operating segments
The Bank has chosen not to report operating segment information. Its securities are not publicly traded.
2.4 Foreign currency translation
Functional and presentation currencyItems included in the financial statements of each of the Group’s entities are measured using the currency of the primary economic environment in which the entity operates. All entities included in consolidation use Euro as functional currency. Financial statements are presented in Euro, which has been the Group’s presentation currency since 1 January 2007.
Transactions and balancesForeign currency transactions are translated into functional currency at the exchange rates prevailing at the dates of transactions. Foreign exchange gains and losses resulting from the settlement of such transactions and from the translation of monetary assets and liabilities denominated in foreign cur-rencies are recognised in the statement of income. Translation differences on non-monetary items, such as equities at fair value through profit or loss, are reported as part of the fair value gain or loss. Translation differences on non-monetary items, such as equities classified as available for sale, are included in the fair value reserve in equity.
Income and expenses arising on foreign currencies are translated at the official rates of exchange as at the transaction date.
Gains and losses resulting from foreign currency purchases and sales for trading purposes are in-cluded in the statement of income as net gains or losses from dealing in foreign currencies.
2.5 Investments in subsidiaries and goodwill Investments in subsidiaries in the standalone financial statements are measured and accounted for at the cost of acquisition. The cost of acquisition is measured as the fair value of the assets given, equity instruments issued and liabilities incurred or assumed at the date of exchange, plus costs directly at-tributable to the acquisition.
In the consolidated financial statements business combinations are accounted for using the acquisi-tion method. The cost of an acquisition is measured as the aggregate of the consideration trans-ferred, measured at acquisition date fair value and the amount of any non-controlling interest in the acquiree. For each business combination, the acquirer measures the non-controlling interest in the acquiree either at fair value or at the proportionate share of the acquiree’s identifiable net assets. Acquisition costs incurred are expensed and included in administrative expenses.
When the Group acquires a business, it assesses the financial assets and liabilities assumed for ap-propriate classification and designation in accordance with the contractual terms, economic circum-
Banka Koper annual report 2012 • financial statements 56

stances and pertinent conditions as at the acquisition date. This includes the separation of embedded derivatives in host contracts by the acquiree.
If the business combination is achieved in stages, the acquisition date fair value of the acquirer’s pre-viously held equity interest in the acquiree is remeasured to fair value at the acquisition date through profit or loss. Any contingent consideration to be transferred by the acquirer will be recognised at fair value at the acquisition date. Subsequent changes to the fair value of the contingent considera-tion which is deemed to be an asset or liability, will be recognised in accordance with IAS 39 either in profit or loss or as a change to other comprehensive income. If the contingent consideration is classified as equity, it should not be remeasured until it is finally settled within equity.
Goodwill is initially measured at cost being the excess of the aggregate of the consideration trans-ferred and the amount recognised for non-controlling interest over the net identifiable assets ac-quired and liabilities assumed. If this consideration is lower than the fair value of the net assets of the subsidiary acquired, the difference is recognised in profit or loss.
After initial recognition, goodwill is measured at cost less any accumulated impairment losses. For the purpose of impairment testing, goodwill acquired in a business combination is, from the acquisition date, allocated to each of the Group’s cash-generating units that are expected to benefit from the combination, irrespective of whether other assets or liabilities of the acquiree are assigned to those units.
Where goodwill forms part of a cash-generating unit and part of the operation within that unit is dis-posed of, the goodwill associated with the operation disposed of is included in the carrying amount of the operation when determining the gain or loss on disposal of the operation. Goodwill disposed of in this circumstance is measured based on the relative values of the operation disposed of and the portion of the cash-generating unit retained.
2.6 Related parties
For the purposes of the financial statements, related parties include all the enterprises that directly or indirectly through one or more intermediaries, control or are controlled by, or are under common control with the reporting enterprise (this includes parents, subsidiaries and fellow subsidiaries), asso-ciated companies, managers and directors of the Bank and enterprises in which managers and direc-tors of the Bank are able to exercise significant influence (participation in the financial and operating policy decisions of an enterprise).
2.7 Financial assets
Classification
a) Financial assets at fair value through profit or lossThis category has two sub-categories: financial instruments held for trading and financial instruments designated at fair value through profit or loss at inception. Financial instruments are classified in this group if acquired principally for the purpose of selling in the short term or if so designated by man-agement. Derivatives are also categorised as held for trading.
b) Loans and receivables Loans and receivables are non-derivative financial instruments with fixed or determinable payments that are not quoted in an active market, other then:
• those that the entity intends to sell immediately or in the short term, which are classified as held-for-trading and those that the entity designates at fair value through profit or loss upon initial recognition;
• those that the entity designates as available for sale upon initial recognition; or • those for which the holder may not recover substantially all of its initial investment, other than
because of credit deterioration
Banka Koper annual report 2012 • financial statements 57

In general the loans are collateralised with one or more type of collateral. The decision on the ad-equateness of the type and value of the collateral depends on the creditworthiness of the customer and the type, value and maturity of the credit transaction. The customer manager monitors the ef-ficiency of the collateral in relation to the possible increase in the risk or decrease of the value of the collateral and, if necessary, request that the customer provide extra collateral (of another type or of more value).
The revaluation of the collateral shall be carried out with respect to the type of collateral:
• the market value of securities and investment fund assets units taken as collateral is deter-mined on daily basis,
• the revaluation of real estate (housing unit) should be carried out at least every three years,• the revaluation of real estate (business premises) shall be carried out at least once a year,• movable property should be revaluated at least once a year.
c) Held-to-maturityHeld to maturity assets are non-derivative financial instruments with fixed or determinable payments and fixed maturity that the Bank or Group has the positive intention and ability to hold to maturity.
d) Available-for-saleAvailable-for-sale financial assets are non-derivative financial assets that are designated as available-for-sale or that are not classified as loans and receivables, held-to-maturity investments or financial assets at fair value through profit or loss.
Recognition and measurement
a) Date of recognitionRegular way purchases and sales: Purchases and sales of financial instruments at fair value through profit and loss, held to maturity and available for sale are recognised on trade date. Loans are recog-nised when cash is advanced to the borrowers.
b) “Day 1” profitWhere the transaction price in a non-active market is different to the fair value from other observ-able current market transactions in the same instrument, or based on a valuation technique whose variables include only data from observable markets, the Bank or Group immediately recognise the difference between the transaction price and fair value (a “Day 1” profit) in the statement of income in “Net trading income”. In cases where use is made of data which is not observable, the difference between the transaction price and model value is only recognised in the statement of income when the inputs become observable, or when the instrument is derecognised.
c) Value of recognition and subsequent measurement Financial assets are initially recognised at fair value plus transaction costs for all financial assets not carried at fair value through profit and loss.
Financial assets at fair value through profit and loss and financial assets available for sale are subse-quently measured at fair value. Gains and losses from changes in the fair value of the financial assets at fair value through profit and loss are included in the statement of income in the period in which they arise. Gains and losses from changes in the fair value of available for sale financial assets are recognised in other comprehensive income, until the financial asset is derecognised or impaired, at which time the effect previously included in other comprehensive income is recognised in the state-ment of income. However, interest calculated using the effective interest method and foreign cur-rency gains and losses on monetary assets classified as available for sale are recognised in the state-ment of income. Dividends on available-for-sale equity instruments are recognised in the statement of income when the entity’s right to receive payment is established.
Loans and held to maturity financial assets are carried at amortised cost.
Banka Koper annual report 2012 • financial statements 58

Renegotiated loans
Where possible, the Bank and Group seek to restructure loans rather than to take possession of col-lateral. This may involve extending the payment arrangements and the agreement of new loan condi-tions. Once the terms have been renegotiated, the loan is no longer considered past due, however, the rating of the client cannot be improved only based on the restructuring. The management con-tinuously reviews renegotiated loans to ensure that all criteria are met and that future payments are likely to occur. The loans continue to be subject of an individual impairment assessment, calculated using the loan’s original effective interest rate.
Derecognition of financial instruments
A financial asset is derecognised when the contractual rights to the cash flows from the financial as-set expire or the financial asset is transferred and the transfer meets criteria for derecognition.
A financial asset (or, where applicable a part of a financial asset or part of a group of similar financial assets) is derecognised when:
• The rights to receive cash flows from the asset have expired; or• The Bank or Group has transferred its rights to receive cash flows from the asset or has as-
sumed an obligation to pay the received cash flows in full without material delay to a third party under a ‘pass-through’ arrangement; and either:• the Bank or Group has transferred substantially all the risks and rewards of the asset, or• the Bank or Group has neither transferred nor retained substantially all the risks and
rewards of the asset, but has transferred control of the asset.
When the Bank or Group has transferred its rights to receive cash flows from an asset or has entered into a pass-through arrangement, and has neither transferred nor retained substantially all the risks and rewards of the asset nor transferred control of the asset, the asset is recognised to the extent of the Bank’s continuing involvement in the asset. In that case, the Bank also recognises an associated liability. The transferred asset and the associated liability are measured on a basis that reflects the rights and obligations that the Bank has retained.
Continuing involvement that takes the form of a guarantee over the transferred asset is measured at the lower of the original carrying amount of the asset and the maximum amount of consideration that the Bank could be required to repay.
A financial liability is derecognised when the obligation under the liability is discharged or cancelled or expires. Where an existing financial liability is replaced by another from the same lender on sub-stantially different terms, or the terms of an existing liability are substantially modified, such an exchange or modification is treated as a derecognition of the original liability and the recognition of a new liability, and the difference in the respective carrying amounts is recognised in profit or loss.
Fair value measurement principles
The fair value of financial instruments is based on their quoted market price at the reporting date. If a quoted market price is not available, the fair value of the instruments is estimated using discounted cash flow techniques or pricing models.
Where discounted cash flow techniques are used, estimated future cash flows are based on the management’s best estimates and the discount rate is a market related rate at the reporting date for an instrument with similar terms and conditions. Where pricing models are used, inputs are based on market related measures at the reporting date, where possible, but where this is not feasible, a degree of judgement is required in establishing fair values.
IFRS 7 states that each company should disclose the inputs used to evaluate the investments at fair value (assets held for trading or available for sale), classifying these financial instruments in three levels of fair value:
Banka Koper annual report 2012 • financial statements 59

• level 1. Fair values measured using quoted prices (unadjusted) in active markets for identical assets or liabilities.
• level 2. Fair values measured using inputs other than quoted prices included within Level 1 that are observable for the asset or liability, either directly (i.e. as prices) or indirectly (i.e. de-rived from prices).
• level 3. Fair values measured using inputs for the asset or liability that are not based on ob-servable market data (i.e. unobservable inputs).
More detailed disclosure is shown under chapter 3.9 Fair value of assets and liabilities, held for trad-ing and available for sale financial instruments.
2.8 Offsetting
Financial assets and liabilities are offset and the net amount reported in the statement of financial position when there is a legally enforceable right to set off the recognised amounts and there is an intention to settle on a net basis, or to realise the asset and settle the liability simultaneously.
2.9 Derivative financial instruments
Derivative financial instruments, including forward and futures contracts, and swaps and options, are initially recognised on the statement of financial position at fair value. Derivative financial instruments are subsequently remeasured at their fair value. Fair values are obtained from quoted market prices, discounted cash flow models or pricing models, as appropriate. All derivatives are carried at their fair value as assets when favourable to the Bank, and as liabilities when unfavourable to the Bank.
Certain derivative financial instruments, while providing effective economic hedges, do not qualify for hedge accounting under the specific accounting rules and are therefore treated as derivatives held for trading.
The best evidence of the fair value of a derivative at initial recognition is the transaction price (the fair value of the consideration given or received) unless the fair value of that instrument is evidenced by comparison with other observable current market transactions in the same instrument (without modification or repackaging) or based on a valuation technique whose variables include only data from observable markets. When such evidence exists, the Bank or Group recognise profits on day 1; if not, profits are not recognised on day 1, but if and when such evidence becomes available or when the derivative is derecognised.
Derecognition of the derivatives occurs only when through a legal transaction that transfers owner-ship of a financial instrument to the buyer, the seller also transfers substantially all the risks and future rewords of ownership of the financial instrument.
2.10 Hedge accounting
The Bank and the Group use derivative financial instruments to manage exposures to its interest rate risk. Such derivative financial instruments are initially recognized at fair value on the date on which they are entered to and are subsequently remeasured at fair value. Derivatives are carried as financial assets when the fair value is positive and as financial liabilities when the fair value is negative. For the purpose of hedge accounting, hedges are classified as:
• Fair value hedges when hedging the exposure to changes in the fair value of a recognized as-set or liability or an unrecognized firm commitment;
• Cash flow hedges when hedging the exposure to variability in cash flows that is either attrib-utable to a particular risk associated with a recognized asset or liability or a highly probable forecast transaction;
• Hedges of a net investment in a foreign operation.
Banka Koper annual report 2012 • financial statements 60

At the inception of a hedge relationship, the Bank and the Group formally designate and document the hedge relationship to which the Bank or the Group wishes to apply hedge accounting and the risk management objective and strategy for undertaking the hedge. The documentation includes identification of the hedging instrument, the hedged item or transaction, the nature of the risk be-ing hedged and how the Bank or the Group will assess the effectiveness of changes in the hedging instrument’s fair value in offsetting the exposure to changes in the hedged item’s fair value or cash flows attributable to the hedged risk. Such hedges are expected to be highly effective in achieving offsetting changes in fair value or cash flows and are assessed on an ongoing basis to determine that they actually have been highly effective throughout the financial reporting periods for which they are designated.
Hedges that meet the strict criteria for hedge accounting are accounted for as described below:
a) Fair value hedgesHedging transactions are aimed at neutralising potential losses on a specific item or group of items, attributable to a certain risk, if such a risk should actually occur.
The following types of hedging transactions are used:
• fair value hedge, which has the objective of covering exposure to changes in the fair value (attributable to the different risk categories) of assets and liabilities in the balance sheet, or on a portion of these, of groups of assets/liabilities, of binding commitments and portfolios of financial assets and liabilities, including “core deposits”, as permitted by IAS 39 endorsed by the European Commission.
2.11 Interest income and expense
Interest income and expense are recognised in the statement of income for all interest bearing instru-ments on an accrual basis using the effective interest method based on the actual purchase price. Interest income includes coupons earned on fixed income investments and accrued discounts and premium on securities. Once a financial asset or group of similar financial assets has been written down as a result of an impairment loss, interest income is recognised using the rate of interest used to discount the future cash flows for the purpose of measuring the impairment loss.
The effective interest method is a method of calculating the amortised cost of a financial asset or a financial liability and of allocating the interest income or interest expense over the relevant period. The effective interest rate is the rate that exactly discounts estimated future cash payments or receipts through the expected life of the financial instrument or, when appropriate, a shorter period to the net carrying amount of the financial asset or financial liability. When calculating the effective interest rate, the Group estimates cash flows considering all contractual terms of the financial instrument (for example, prepayment options) but does not consider future credit losses. The calculation includes all fees and points paid or received between parties to the contract that are an integral part of the ef-fective interest rate, transaction costs and all other premiums or discounts.
2.12 Fees and commission income
Fees and commission are generally recognised when the service has been provided. Fees and com-missions consist mainly of fees received from payment and from the managing of funds on behalf of legal entities and citizens, together with commissions from guarantees.
Fees receivable that represent a return for services provided are credited to income when the related service is performed.
Banka Koper annual report 2012 • financial statements 61

2.13 Sale and repurchase agreements
Securities sold under sale and repurchase agreements (repos) are retained in the financial statements, with the counterparty liability included in deposits from banks or customers as appropriate. Securities sold, subject to sale and repurchase agreements are reclassified in the financial statements as pledged assets when the transferee has the right by contract or custom to sell or repledge the collateral. Se-curities purchased under agreements to resell (reverse repos) are recorded as loans and advances to other banks or customers as appropriate.
The difference between the sale and repurchase price is treated as interest and accrued over the life of the repo agreements using the effective interest rate method.
2.14 Impairment of financial assets
a) Assets carried at amortised costThe Bank or Group assess at each reporting date whether there is objective evidence that a financial asset or group of financial assets is impaired. A financial asset or group of financial assets is impaired and impairment losses are incurred only if there is objective evidence of impairment as a result of one or more events that occurred after the initial recognition of the asset (‘a loss event’) and that loss event (or events) has an impact on the estimated future cash flows.
The Bank or Group first assess whether objective evidence of impairment exists for financial assets that are individually significant. If the Bank or Group determines that no objective evidence of im-pairment exists for an individually assessed financial asset it includes the asset in a group of financial assets with similar credit risk characteristic and collectively assesses them for impairment. Assets that are individually assessed for impairment and for which an impairment loss is or continues to be rec-ognised are not included in a collective assessment.
If there is objective evidence that an impairment loss on loans and receivables or held to maturity investment has been incurred, the amount of the loss is measured as the difference between the as-set’s carrying amount and the present value of estimated future cash flows discounted at the financial asset’s original effective interest rate (in case of a variable interest rate, the last effective interest rate is taken). The carrying amount of the asset is reduced through an allowance account and the amount of the loss is recognised in the statement of income.
The calculation of present value of the estimated future cash flows of collateralised financial assets reflects the cash flows that may result from foreclosure less costs for obtaining and selling the col-lateral, whether or not foreclosure is probable.
For the purpose of collective evaluation of impairment, financial assets are grouped on the basis of similar credit risk characteristics (on the basis of the Group’s internal grading process that considers all relevant factors).
Future cash flows in a group of individual significant financial assets that are collectively evaluated for impairment are estimated on the basis of the contractual cash flows and historical loss experience for assets with credit risk characteristics similar to those in the group. The methodology and assumptions used for estimating future cash flows are reviewed regularly.
If the amount of the impairment subsequently decreases due to an event occurring after the write down, the reversal of loss is credited as a reduction of an allowance for loan impairment.
When a loan is uncollectible, it is written off against the related provision for loan impairment. In the case that the provision for loan impairment does not exist the write off is recognised directly in the statement of income under gains less losses from financial assets and liabilities not recognised at fair value through profit and loss. Such loans are written off after all the necessary procedures have been completed and the amount of the loss has been determined. Subsequent recoveries of amounts previously written off are shown as income in the statement of income.
Banka Koper annual report 2012 • financial statements 62

b) Assets carried at fair valueThe Bank or Group assesses at each reporting date whether there is objective evidence that a fi-nancial asset or group of financial assets is impaired. In the case of equity investments classified as available for sale, a significant or prolonged decline in the fair value of the security below its cost is considered in determining whether the assets are impaired. In line with Bank or Group accounting policies, a significant decrease is when financial instrument’s fair value decreases by more than 30 % below average cost. Prolonged decline in the fair value is generally when the fair value of a financial instrument is below its average cost for at least 24 months. If any such evidence exists for available for sale financial assets, the cumulative loss – measured as the difference between the acquisition cost and current fair value, less any impairment loss on that financial asset previously recognised in profit or loss – is removed from other comprehensive income and recognised in the statement of income. Impairment losses recognised in the statement of income on equity instruments are not reversed through the statement of income. If, in a subsequent period, the fair value of a debt instru-ment classified as available for sale increases and the increase can be objectively related to an event occurring after the impairment loss was recognised in profit or loss, the impairment loss is reversed through the statement of income.
2.15 Intangible assets
Intangible assets, which relate to software licences and development, are stated at cost, less accumu-lated amortisation and impairment losses.
Costs associated with researching or maintaining computer software programs are recognised as an expense as incurred. Costs that are directly associated with the production of identifiable and unique software products controlled by the Group, and that will probably generate economic benefits ex-ceeding costs beyond one year, are recognised as intangible assets. Direct costs include software development employee costs and an appropriate portion of relevant overheads.
Amortisation is provided on a straight-line basis at rates designed to write off the cost of software over its estimated useful life. Assets in the course of transfer or construction/implementation are not amortised until they are brought into use.
The amortization period and the amortization method for an intangible asset with a finite useful life are reviewed at each financial year-end.
Intangible assets estimated useful lives (in years)
Licences 3−5
Investments in research and development 3
Software 3
Gains or losses arising from derecognition of an intangible asset are measured as the difference be-tween the net disposal proceeds and the carrying amount of the asset.
Intangible assets are assessed for impairment whenever there is an indication that the intangible as-set may be impaired. The assessment for impairment is done at least at each reporting date.
2.16 Investment property
Investment property is property (land or a building – or part of a building – or both) held to earn rentals and/or for capital appreciation or both, rather than for administrative purposes or sale in the ordinary course of business.
Investment property is initially recognised at its historical cost plus transaction costs. After initial rec-ognition, investment property of the Bank or Group is carried at cost less accumulated depreciation and accumulated impairment losses, if any.
Banka Koper annual report 2012 • financial statements 63

The recognition and derecognition policies and methods of accounting for depreciation are defined under property, plant and equipment (Note 2.17).
2.17 Property, plant and equipment
All property, plant and equipment are initially recorded at cost/purchase price. Costs which can be attributed to the acquisition of property, plant and equipment increase the purchase price (such as imports and unrefundable charges/levies, commissions, employee benefits, cost related to removal and restoration…). Interest expenses from the acquisition of fixed assets are included in the cost value and amortized during the life period of the asset.
The purchase price of property, plant and equipment, swapped with another asset, is measured at fair value.
The Group assesses the impairment each year whether there are indications that assets may be im-paired. If any such indication exists, the Group estimates the recoverable amount. The recoverable amount is the higher of the net selling price and value in use. If the recoverable amount exceeds the carrying value, the assets are not impaired.
Subsequent costs are included in the asset’s carrying amount when it is probable that future eco-nomic benefits associated with the item will flow to the Group. All other repairs and maintenance are charged to expenses during the financial period in which they are incurred.
Depreciation is provided on a straight-line basis at rates designed to write off the cost or valuation of buildings and equipment to their residual values over their estimated useful lives.
Assets in the course of transfer or construction are not depreciated until they are brought into use. The assets’ residual values and useful lives are reviewed, and adjusted if appropriate, at each balance sheet date.
property, planet and equipment estimated useful lives (in years)
Buildings 16,6–33,3
Other investment in intangibles 16,6-33,3
Equipment 5
Motor vehicles 5-8
Computers and software 3
Gains and losses on disposal of property and equipment are determined by reference to their carrying amount and are taken into account in determining operating profit.
2.18 Accounting for leases
The determination of whether an arrangement is a lease or it contains a lease, is based on the sub-stance of the arrangement and requires an assessment of whether the fulfilment of the arrangement is dependent on the use of a specific asset or assets and the arrangement conveys a right to use the asset.
The Bank or a Group company is the lesseeLeases which do not transfer to the Bank or Group substantially all the risks and benefits incidental to ownership of the leased items are operating leases. Operating lease payments are recognised as an expense in the statement of income on a straight line basis over the lease term. Contingent rents payable are recognised as an expense in the period in which they are incurred.
A finance lease is a lease which transfers substantially all the risks and rewards of ownership to the
Banka Koper annual report 2012 • financial statements 64

lessee. Property, plant and equipment acquired by way of finance lease is stated at an amount equal to the lower of its fair value and the present value of minimum lease payments at inception of the lease, less accumulated depreciation and any impairment losses. Property, plant and equipment ac-quired under finance lease are depreciated over the useful life of the asset. If there is no assurance that the lessee shall take over the ownership of the leased asset until the end of the lease term, the leased asset is depreciated entirely during the shorter of the term of the lease or its useful life.
The Bank or a Group company is the lessorWhen assets are leased out under a finance lease, the present value of the lease payments is recog-nised as a receivable. Income from finance leasing transactions is apportioned systematically over the primary lease period, reflecting a constant periodic return on the lessor’s net investment outstanding.When assets are leased out under an operating lease, payments made under operating leases are recognised as income on a straight-line basis over the period of the lease.
2.19 Cash and cash equivalents
For the purpose of the statement of cash flows, cash and cash equivalents comprise cash and bal-ances with central banks except for obligatory reserves, securities held for trading, loans to banks and debt securities not held for trading with contractual maturity up to 90 days.
2.20 Financial liabilities
Borrowings are recognised initially at ‘cost’, being their issue proceeds (fair value of the consideration received) net of transaction cost incurred. Borrowings are subsequently stated at amortised cost and any difference between net proceeds and the redemption value is recognised in the statement of income over the period of the borrowings using the effective interest method.
If the Group purchases its own debt, it is removed from the statement of financial position.
2.21 Provisions
Provisions are recognised when the Bank or Group has a present legal or constructive obligation as a result of past events; it is probable that an outflow of resources embodying economic benefits will be required to settle the obligation; and a reliable estimate of the amount of the obligation can be made.
2.22 Inventories
Inventories are stated at cost plus all corresponding direct costs of purchase, or net realizable value. Cost is determined using the weighted average cost formula. Inventories are carried at “first in first out” (FIFO) method.
2.23 Financial guarantee contracts
Financial guarantee contracts are contracts that require the issuer to make specified payments to reimburse the holder for a loss it incurs because a specified debtor fails to make payments when due, in accordance with the terms of a debt instrument. Such financial guarantees are given to banks, financial institutions and other bodies on behalf of customers to secure loans, overdrafts and other banking facilities.
Financial guarantees are initially recognised in the financial statements at fair value on the date the guarantee was given. Subsequent to initial recognition, the bank’s liabilities under such guarantees are measured at the higher of the initial measurement, less amortisation, calculated to recognise in the statement of income the fee income earned on a straight line basis over the life of the guarantee, and the best estimate of the expenditure required to settle any financial obligation arising at the re-
Banka Koper annual report 2012 • financial statements 65

porting date. These estimates are determined based on experience of similar transactions and history of past losses, supplemented by the judgment of Management.
2.24 Taxation
Income tax is calculated by each Group member according to local legislation. For 2012 the income tax rate was 18 % (2011: 20 %). According to new tax legislation income tax rate will be diminished by 1 % on yearly basis until reaching 15 % tax rate.
Deferred income tax is provided, using the liability method, for all temporary differences arising be-tween the tax bases of assets and liabilities and their carrying values for financial reporting purposes. Tax rates currently enforced are used to determine deferred income tax. The principal temporary dif-ferences arise from the valuation of financial assets and liabilities including derivatives and provisions for employees. For the year 2012 deferred tax was calculated using a 17 % or 16 % or 15 % tax rate, depending on residual maturity of financial instruments which generate temporary differences as the base for deferred tax.
Deferred tax assets are recognised where it is probable that future taxable profit will be available against which the temporary difference can be utilised.
Deferred tax related to fair value re-measurement of available for sale investments is charged or credited directly to other comprehensive income and is subsequently recognised in the statement of income together with the deferred gain or loss.
Deferred income tax is provided on temporary differences arising on investments in subsidiaries, asso-ciates and joint ventures, except where the timing of the reversal of the temporary difference can be controlled, and it is probable that the temporary difference will not reverse in the foreseeable future.
2.25 Employee benefits
Employee benefits include jubilee benefits, retirement indemnity bonuses and other long – service benefits. Valuations of these obligations are carried out by independent qualified actuaries. The main actuarial assumptions included in the calculation of the obligation for other long – term employee benefits are:
• Discount rate of 5.2 % (2011: 5.2 %) and• Future salary increases of 3.5 % (2011: 3.5 %) p.a..
The Bank and its Slovene subsidiaries make contributions to a defined contribution plan according to Slovenian legislation. Once contributions have been paid, the Bank or Group has no further payment obligation. The regular contributions constitute net periodic costs for the year in which they are due and such are included in staff costs.
According to Slovenian legislation, employees retire after 40 years of working life, when, if fulfilling certain conditions, they are entitled to an indemnity paid in a lump sum. Employees are also entitled to long service bonuses for every ten years of employment with the Bank or in her subsidiary. These obligations are measured at the present value of the future cash outflows. All gains and losses are recognised in the statement of income.
2.26 Share capital
Dividends on ordinary sharesDividends on ordinary shares are recognised in equity in the period in which they are approved by the Bank’s shareholders.
Banka Koper annual report 2012 • financial statements 66

Treasury sharesWhere the Bank or other members of the consolidated Group purchases the Bank’s shares, the con-sideration paid is deducted from total shareholders’ equity as treasury shares until they are cancelled. Where such shares are subsequently sold, any consideration received is included in shareholders’ equity.
2.27 Fiduciary activities
The Bank or Group manage assets on behalf of legal entities and citizens. A fee is charged for this service. These assets are not shown in the consolidated statement of financial position.
2.28 Comparatives
The same accounting policies as for the reporting period have been applied for comparative figures.
RISK MAnAGeMent oRGAnISAtIon
The risk management process includes internal organizational requirements, risk management proce-dures at the level of the Group’s products and activities as well as measurement and control of every single type of Group level risk. The strategic orientation and characteristics of business segments in which the Group operates, define the risk profile of the Group. On this ground the most important risks are identified and the risk management approaches established.
The most important risks in terms of exposure are credit risk, banking book financial risks and opera-tional risk. The two most important banking book financial risks are interest rate and liquidity risk. Other important risks for the Group are strategic risk, reputational risk, market risk, credit concentra-tion risk and equity investment risk.
The objective of risk management is to control risk according to the risk appetite and derived will-ingness of the Group managing and ownership structures to assume risk. Since the Group is part of the larger Banking Group Intesa Sanpaolo, the methodologies and risk management processes are gradually being harmonized with the Parent Group’s approaches.
3.1 Risk management structure
Risk management process
The adequateness of the risk management activity of the Group is the responsibility of Risk manage-ment division. The person responsible for the division is a member of the Management Board.
03.
RISK DIVISION
RISK POLICY AND METHODOLOGY
DEPARTMENT
CREDIT ANALYSISDEPARTMENT
Small Business andRetail Credit Analysis
Office
Medium and LargeCorporate CreditAnalysis Office
CREDIT CONTROLDEPARTMENT
CREDIT COLLECTIONOFFICE
The organisation scheme of the Risk Management Division:
Banka Koper annual report 2012 • financial statements 67

The Risk Policy and Methodology Department is responsible for operational, financial and market risks, capital adequacy and implementation of risk measurement methodologies. In the credit risk area it proposes credit risk policies and carries out control over the quality of the credit portfolio.
The Small Business and Retail Credit Analysis Office carries out the assessment and monitoring over the credit soundness of individuals and small entities.
The Medium and Large Corporate Credit Analysis Office evaluates and monitors credit soundness of large and medium-sized entities.
The Credit Control Department monitors the portfolio of high- risk exposures, manages the process of handling with high-risk exposures and defines the recovery strategy for high-risk exposures.
The Collection Office ensures a reduction of the losses of the bank by means of setting up adequate measures for the collection of the unsettled claims in the course of legal collection.
According to the internal statute and risk management policies, the following internal roles are de-fined:
Supervisory Board approves the strategic decisions regarding risk management policies and verifies the efficiency and adequacy of the overall risk process within the Group.
Management Board is responsible for the approval of risk management policies and internal con-trols; it ensures organizational and other conditions for execution of those policies and controls.
Asset and liability Committee (AlCo) evaluates the exposure to main financial risks and deliber-ates on important banking operations or decisions that have a significant impact on risk exposure.
Asset Quality Board monitors the loan portfolio and its quality and takes necessary measures in order to prevent and mitigate lending losses.
Internal Audit Department verifies processes, policies and general performing of activities, with the aim to evaluate the efficiency and effectiveness of internal controls and risk management.
Compliance office assesses and manages the compliance risk in relation to domestic and interna-tional rules and internal regulation or enacting of Supervisory and Management Board, in order to prevent legal penalties, financial losses and reputational risk.
3.2 Capital adequacy and own funds (capital) management
Own funds include all liability components that are designed to absorb the Bank’s or Group’s losses and safeguard ordinary creditors. It plays an important role as a buffer against potential losses.
The own funds management and capital adequacy are governed by regulatory capital adequacy and internal capital adequacy assessment.
3.2.1 Fulfilment of regulatory capital requirementsRegulatory capital adequacy is the ratio between the Bank’s or Group’s own funds and risk-weighted assets that has to be at least 8 %. The components of risk-weighted assets are credit risk, market risk and operational risk.
The Bank or Group maintains the capital adequacy by drawing up a strategic plan, which projects the own fund growth in line with the increasing risk activities. The past bank activity increase has been sustained by a proportional distribution of net profit into Bank`s or Group’s capital reserves. Capital adequacy is regularly monitored by the Bank or Group managing bodies.
Banka Koper annual report 2012 • financial statements 68

Balance sheet/ nominal amount Risk weighted amount Capital Requirements
2012 2011 2012 2011 2012 2011
EXPOSURES TO BANKING BOOK
Exposures to state and central bank 449,136 345,454 8 9 1 1
Exposures to local municipalities 65,340 43,741 12,938 8,476 1,035 678
Exposures to public sector 11,555 4,392 4,074 1,946 326 156
Exposures to development banks 503 718 - - - -
Exposures to institutions 130,961 169,905 43,536 67,877 3,483 5,430
Exposures to enterprises 1,032,079 954,904 891,015 842,569 71,281 67,406
Exposures to retail banking 973,536 927,088 603,743 573,718 48,299 45,897
Past due exposures 22,487 105,192 25,826 136,653 2,066 10,932
Exposures to highly risk exposures 87,540 67,187 101,240 85,551 8,099 6,844
Exposures to investments funds 31,454 33,832 31,454 33,832 2,516 2,707
Exposures to other assets 92,166 92,484 80,156 77,558 6,412 6,205
total 2,896,757 2,744,897 1,793,990 1,828,189 143,518 146,256
Credit risk weighted assets 1,793,990 1,828,189 143,518 146,256
Market risk weighted assets 913 3,088 73 247
Operational risk weighted assets 154,625 163,588 12,370 13,087
total risk weighted assets 1,949,528 1,994,865 155,961 159,590
REGULATORY CAPITAL
Ordinary shares 22,173 22,173
Share premium 7,499 7,499
Treasury shares (49) (49)
Legal reserves 13,198 12,839
Statutory reserves 211,962 211,959
Treasury shares fund reserves 49 49
Retained earnings 6,009 6,009
Revaluation reserve (100% of negative revaluation of AFS shares) - (1,221)
Less intangible assets (4,236) (4,228)
total qualifying tier 1 capital 256,605 255,030
Revaluation reserve (80% of positive revaluation of AFS shares) 7,440 10,990
total qualifying tier 2 capital 7,440 10,990
DIMINUTION OF CAPITAL
- less investment in subsidiaries - (3,688)
total diminution of capital - (3,688)
total regulatory capital 264,045 262,332
Capital Adequacy ratio 13.54 13.15
Capital adequacy as at 31 December 2012– unconsolidated(all amounts expressed in thousands of EUR)
Banka Koper annual report 2012 • financial statements 69

Capital adequacy as at 31 December 2012 – Consolidated(all amounts expressed in thousands of EUR)
Balance sheet/ nominal amount Risk weighted amount Capital Requirements
2012 2011 2012 2011 2012 2011
EXPOSURES TO BANKING BOOK
Exposures to state and central bank 450,224 345,930 8 9 1 1
Exposures to local municipalities 68,540 47,128 13,578 9,153 1,086 732
Exposures to public sector 11,714 4,421 4,153 1,961 332 157
Exposures to development banks 503 718 - - - -
Exposures to institutions 130,961 169,905 43,536 67,877 3,483 5,430
Exposures to enterprises 1,008,585 952,001 868,907 842,146 69,513 67,372
Exposures to retail banking 1,015,651 963,923 635,330 601,344 50,826 48,108
Past due exposures 38,645 118,951 49,494 156,578 3,960 12,526
Exposures to highly risk exposures 91,707 68,273 107,443 87,164 8,595 6,973
Exposures to investments funds 31,454 33,832 31,454 33,832 2,516 2,707
Exposures to other assets 104,680 96,595 87,138 81,668 6,971 6,533
total 2,952,664 2,801,677 1,841,041 1,881,732 147,283 150,539
Credit risk weighted assets 1,841,041 1,881,732 147,283 150,539
Market risk weighted assets 913 3,088 73 247
Operational risk weighted assets 158,238 166,538 12,659 13,323
total risk weighted assets 2,000,192 2,051,358 160,015 164,109
REGULATORY CAPITAL
Ordinary shares 22,173 22,173
Share premium 7,499 7,499
Treasury shares (49) (49)
Legal reserves 13,198 12,839
Statutory reserves 211,962 211,959
Treasury shares fund reserves 49 49
Retained earnings 6,009 6,009
Revaluation reserve (100 % of negative revaluation of AFS shares) - (1,221)
Less intangible assets (4,337) (4,230)
less goodwill (905) (905)
Minority interest - -
total qualifying tier 1 capital 255,599 254,123
Revaluation reserve (80 % of positive revaluation of AFS) 7,440 10,990
total qualifying tier 2 capital 7,440 10,990
total regulatory capital 263,039 265,113
Capital Adequacy ratio 13.15 12.92
Banka Koper annual report 2012 • financial statements 70

3.2.2 Internal capital adequacy assessment (ICAAP)ICAAP is a process, introduced by the new Basel II regulation, which determines the minimum re-quirements of managing risk, encompassing the internal organization, systems and self-evaluation of required internal capital (capital needs). The purpose of ICAAP is to complement the regulatory capital requirements in the valuation of all relevant risks.
The ICAAP process for the Bank or Group is based on a unified methodology and risk management processes within the Parent company, taking into consideration the specific circumstances under which the Bank or Group operates.
The Parent company defines the methodology and makes the assessment of internal capital. The capital needs are assessed by pursuing the risk coverage with a confidence level of 99.9 % over 1 year time-horizon.The internally assessed own funds needed to meet internal capital requirements (referred to as Avail-able financial resources), include regulatory own funds and current profits, expected not to be paid-out as dividends.
In year 2012 the Bank maintained the available financial resources at levels that meet all internally es-tablished capital position minimum thresholds, relative to size and structure of the capital. The Bank provides as well the amount of available financial resources that meets all the minimum thresholds, established by the central bank on annual basis, upon the assessment of the Bank’s risk profile and communicated to the Bank within the SREP dialogue.
Internal assessment of capital needs is carried out for the risks, and their components, as follows:
Credit risk is the risk that at maturity the counterparty will default on settling financial commit-ments. Internal capital equals the amount of regulatory capital requirements, reduced by capital requirements on assets subject to detached assessment within other risk typology (equity risk).
Market risk is the risk of fair value losses originated in trading activities. Internal capital is equal to the regulatory capital requirements.
operational risk is the risk arising from the conduct of people, inadequate processes and systems or external events. It includes legal risk. Internal capital is equal to mandatory capital requirements for operational risk.
Banking book financial risk relates to equity risk, interest rate risk, and liquidity risk.
Banking book equity risk covers the risk of unconsolidated equity investments, classified as avail-able for sale, which are not acquired for trading purposes. Internal capital or capital needs are calcu-lated with a historical simulation, applying daily historical changes over a period of 5 years.
Banking book interest rate risk is defined as the risk of a change in the market interest rate that has an disadvantageous impact on net interest income of non-trading interest rate sensitive posi-tions. Internal capital is calculated with a historical simulation, applying daily changes over a 5-years long historical data series. Such obtained risk scenarios are the basis for the evaluation of joint net interest income and net economic value sensitivity at the chosen statistical confidence level.
Strategic risk includes the risk of changes in the business environment, inappropriate business decisions and insufficient responsiveness to changes. Internal capital is set in relation to the risk of disadvantageous evolvement of every major component of the business margin on the revenue and cost side, presented by a parametric VaR.
Credit concentration risk considers single-name concentration of the credit risk portfolio and con-centration risk by industries. The Bank applies the simplified methodology, devised by the central bank for the industry concentration, whereas for the single-name concentration the central bank methodology is prudentially adjusted by the Bank.
Banka Koper annual report 2012 • financial statements 71

Internal capital on stress-test
The assessment of internal capital (capital needs) under ordinary conditions is supplemented with the risk assessment under extreme, but plausible events (stress-test), in front of which additional capital needs are ascertained. Stres-test represents a forward-looking view as a combination of annual plan and relative stress scenarios.
Stress-tests are identified and if found relevant they are applied to all types of risks that influence the calculation of capital needs. The effects of stress tests are estimated separately for internal capital and Available financial resources:
• In terms of credit risk, the Group assesses the impact of a 2.5 percentage points lower GDP growth than the one planned.
• In terms of operational risk, the Group selects a scenario among 5 largest assessed with the self-diagnosis analysis. The scenario selected is the one believed most likely.
• For the banking book interest rate risk is estimated the impact of a 200 b.p. parallel yield curve shift and other selected scenarios on the capital needs. Next to this is evaluated the impact of unfavourable interest rate shift on internally assessed available capital.
• For equity risk the impact on capital needs is evaluated with the simulation of portfolio equity price changes observed over last 5 years. Likewise is evaluated the impact of unfavourable market indices movements on investments valuation and on available capital.
• In terms of strategic risk, the effects of stress scenarios are identified which are based on movements in several macroeconomic indices over last two decades (like GDP, interest rate, inflation), considering the statistical relationship with income & cost components.
Internally assessed capital requirements as of 31. 12. 2012: (all amounts expressed in millions of EUR)
Risk economic (internal) capital
Credit Risk 144.56
Market Risk 0.07
Operational Risk 12.66
Banking Book Risk 46.71
- Interest Rate Risk 31.34
- Equity Risk 15.37
Strategic Risk 9.54
Concentration of credit risk 2.89
Profitability risk 5.84
Stress test scenario 11.59
total capital charges 233.86
Available financial resources 259.61
3.3 Credit risk
Credit risk represents the risk of loss arising from the debtor’s failure to settle the contractual and financial obligations. Credit risk is, by scope and business strategic orientation, the most important risk for the Group.
The main part of Group’s credit risk arises from financial assets measured at amortized cost (loans and other claims). For those assets and commitments credit risk is evaluated by credit classification and the determination of impairments for statement of financial position assets and provision for off-balance sheet commitments and contingencies. The level of impairments and provisions has to reflect the amount of expected losses.
For financial instruments measured at fair value, credit risk is evaluated by observing market value changes, which are influenced also by the eventual credit deterioration of the issuer.
Banka Koper annual report 2012 • financial statements 72

Credit risk of derivative contracts is measured at replacement cost. The replacement cost is made up of the positive value of the deal, which is the positive difference between the settlement value and the fair value of the instrument and the mark-up that reflects the future volatility of values ex-changed.
The total Group’s credit exposure on the 31st of December 2012 equalled to EUR 3.238 million, which is 7 % more than on 31st of December 2011. In the Group’s credit portfolio of 31st of Decem-ber 2012, 91 % of all credit exposures are classified as performing. Banka Koper’s credit portfolio at the end December 2012 amounted to EUR 3.189 million of which 91 % is classified as performing.
Banka Koper’s credit risk related portfolio as at 31 December 2012 (all amounts expressed in thousands of EUR)
Counterpar-ties
total portfolio
total credit
risk related
portfolioShare in %
perform-ing
Share in %
non per-forming
Share in %
Impair-ment
losses on perform-
ing portfolio
Coverage rate of
perform-ing
portfolio
Impair-ment
losses on non per-forming
portfolio
Coverage rate of
non per-forming
portfolio
1 2 3 4 5 6 7 8 9 10=9/5 11 12=11/7
Central bank and govern-ment bodies 518,432 95,113 4 % 95,113 4 % - 0 % - 0 % - 0 %
Corporate entities 1,794,807 1,748,936 65 % 1,528,975 63 % 219,961 94 % 20,203 1 % 102,583 47 %
Banks 150,955 103,861 4 % 103,834 4 % 27 0 % - 0 % 25 93 %
Private indi-viduals 725,094 725,094 27 % 711,013 29 % 14,081 6 % 2,388 0 % 9,299 66 %
total 3,189,288 2,673,004 100 % 2,438,935 100 % 234,069 100 % 22,591 1 % 111,907 48 %
Banka Koper’s credit risk related portfolio as at 31 December 2011 (all amounts expressed in thousands of EUR)
Counterpar-ties
total portfolio
total credit
risk related
portfolioShare in %
perform-ing
Share in %
non per-forming
Share in %
Impair-ment
losses on perform-ing port-
folio
Coverage rate of
perform-ing
portfolio
Impair-ment
losses on non per-forming
portfolio
Coverage rate of
non per-forming
portfolio
1 2 3 4 5 6 7 8 9 10=9/5 11 12=11/7
Central bank and govern-ment bodies 262,901 31 0 % 31 0 % - 0 % - 0 % - 0 %
Corporate entities 1,830,454 1,711,470 69 % 1,503,772 66 % 207,698 93 % 20,825 1 % 94,071 45 %
Banks 183,112 103,962 4 % 103,962 5 % - 0 % - 0 % - 0 %
Private individuals 688,224 687,593 27 % 671,533 29 % 16,060 7 % 2,027 0 % 9,509 59 %
total 2,964,691 2,503,056 100 % 2,279,298 100 % 223,758 100 % 22,852 1 % 103,580 46 %
Banka Koper annual report 2012 • financial statements 73

Group’s credit risk related portfolio as at 31 December 2012 (all amounts expressed in thousands of EUR)
Counterpar-ties
total portfolio
total credit
risk related
portfolioShare in %
perform-ing
Share in %
non per-forming
Share in %
Impair-ment
losses on perform-
ing portfolio
Coverage rate of
perform-ing
portfolio
Impair-ment
losses on non per-forming
portfolio
Coverage rate of
non per-forming
portfolio
1 2 3 4 5 6 7 8 9 10=9/5 11 12=11/7
Central bank and govern-ment bodies 518,432 95,113 3 % 95,113 4 % - 0 % - 0 % - 0 %
Corporate entities 1,832,126 1,789,943 66 % 1,557,491 63 % 232,452 94 % 19,941 1 % 104,896 45 %
Banks 150,955 103,861 4 % 103,834 4 % 27 0 % - 0 % 25 93 %
Private indi-viduals 736,111 736,111 27 % 720,431 29 % 15,680 6 % 2,427 0 % 9,639 61 %
total 3,237,624 2,725,028 100 % 2,476,869 100 % 248,159 100 % 22,368 1 % 114,560 46 %
Group’s credit risk related portfolio as at 31 December 2011 (all amounts expressed in thousands of EUR)
Counterpar-ties
total portfolio
total credit
risk related
portfolioShare in %
perform-ing
Share in %
non per-forming
Share in %
Impair-ment
losses on perform-ing port-
folio
Coverage rate of
perform-ing
portfolio
Impair-ment
losses on non per-forming
portfolio
Coverage rate of
non per-forming
portfolio
1 2 3 4 5 6 7 8 9 10=9/5 11 12=11/7
Central bank and govern-ment bodies 262,901 31 0 % 31 0 % - 0 %
- 0 %
- 0 %
Corporate entities 1,873,592 1,758,296 69 % 1,543,389 66 % 214,907 92 % 20,699 1 % 95,600 44 %
Banks 183,112 103,962 4 % 103,962 5 % - 0 % - 0 % - 0 %
Private indi-viduals 698,595 697,964 27 % 680,460 29 % 17,504 8 % 2,061 0 % 9,785 56 %
total 3,018,200 2,560,253 100 % 2,327,842 100 % 232,411 100 % 22,760 1 % 105,385 45 %
Analyses by type of collateral (all amounts expressed in thousands of EUR)
Banka Koper Consolidated
2012 2011 2012 2011
net loansFair value
of collateral net loansFair value
of collateral net loansFair value
of collateral net loansFair value
of collateral
Real estate 483,629 1,486,820 358,773 1,125,715 539,334 1,542,525 411,871 1,178,813
Bank guarantees 32,808 34,748 35,147 37,305 32,808 34,748 35,147 37,305
Personal guarantees 201,527 555,481 129,967 359,012 201,527 555,481 129,967 359,012
Debt securities 20,185 68,635 32,471 94,448 20,185 68,635 32,471 94,448
Government guarantees 87,158 88,374 93,913 98,269 87,158 88,374 93,913 98,269
Other collateral 102,636 286,564 42,075 144,962 139,561 323,489 73,643 176,530
Deposits 1,166 11,937 23,341 25,411 1,166 11,937 23,341 25,411
Insurance company guar-antees 123,209 139,606 120,448 132,615 123,209 139,606 120,448 132,615
Shares 32,107 53,298 16,951 28,548 32,107 53,298 16,951 28,548
total collateralised net loans 1,084,425 2,725,463 853,086 2,046,285 1,177,055 2,818,093 937,752 2,130,951
Unsecured 779,414 971,477 736,721 945,610
total net loans 1,863,839 1,824,563 1,913,776 1,883,362
Banka Koper annual report 2012 • financial statements 74

Banka Koper Consolidated
2012 2011 2012 2011
CREDIT RISK EXPOSURES RELATING TO ON-BALANCE SHEET ASSETS ARE AS FOLLOWS:
Loans and advances to banks 58,308 44,889 58,308 44,889
Loans and advances to customers: 1,863,839 1,824,563 1,913,776 1,883,362
Loans to individuals: 552,932 524,161 563,561 534,197
- overdrafts 40,655 40,642 40,655 40,642
- credit cards 20,791 22,910 20,791 22,910
- term loans 124,446 125,186 124,446 125,186
- mortgages 367,040 335,423 367,040 335,423
- finance leases - - 10,629 10,036
Loans to sole proprietors 61,549 61,711 72,106 70,599
Loans to corporate entities 1,249,358 1,238,691 1,278,109 1,278,566
Advances 19,435 9,419 14,310 10,385
Investment securities available for sale 304,090 288,218 304,090 288,218
- debt securities 264,793 243,024 264,793 243,024
- equity securities 39,297 45,194 39,297 45,194
Other assets 40,854 43,920 54,989 43,109
CREDIT RISK EXPOSURES RELATING TO OFF-BALANCE SHEET ITEMS ARE AS FOLLOWS:
Guarantees 216,470 171,899 216,470 171,899
Credit commitments and other credit related liabilities 368,608 334,447 366,839 329,491
At 31 December 2,871,604 2,717,355 2,928,782 2,771,353
Maximum exposure(all amounts expressed in thousands of EUR)
Credit Risk Measurement
The Bank or Group controls and measures credit risk directly through the assessment and classifica-tion of the credit portfolio or indirectly by measuring fair value of assets, where the fair value is influ-enced by the credit standing of the issuer. The Group’s credit portfolio includes all monetary assets and assumed commitments, with the exception of investments in securities and capital investments measured at fair value and investment properties, which are measured at purchase value. Credit ex-posure on derivative instruments and similar deferred deals is measured at replacement cost.
The credit risk toward single counterparties is managed with the arrangement of credit authorities and sound credit granting process. The credit granting process is based on a careful analysis of the debtor and the underlying project, for which the financing is provided. The eligibility criteria of the counterparty to enter into a credit relationship with the Group, is an adequate credit standing, which can be upheld by proper collateral. The monitoring of credit exposure toward financial instruments and derivatives is supported by Kondor+ (KGL module), which ensures a real-time fair value measure-ment and derived credit exposure assessment.
The maximum exposure to credit risk represents the worst case scenario of credit risk exposure to the Group at 31 December 2012 and 2011, without taking account of any collateral held or other credit
Banka Koper annual report 2012 • financial statements 75

Slovenia eu of this in Italy other europe Rest of world total
Cash and balances with Central Banks 29,388 - - - - 29,388
Financial instruments held for trading: 2 288 288 - - 290
- derivative financial instruments 2 288 288 - - 290
Financial assets designated at fair value through profit or loss - 282 282 - - 282
Investment securities available for sale 194,027 104,758 87,473 5,305 - 304,090
Loans and advances: 1,799,706 51,414 46,017 49,654 40,808 1,941,582
- to banks 10,629 46,620 43,275 381 678 58,308
- to customers 1,775,680 4,119 2,741 49,262 34,778 1,863,839
- advances 13,397 675 1 11 5,352 19,435
Investments in subsidiaries 3,688 - - - - 3,688
Other assets 710 148 43 26 4 888
Contingent liabilities and commitments 542,002 41,253 41,253 1,045 63 584,363
totAl eXpoSuReS 2,569,523 198,143 175,356 56,030 40,875 2,864,571
2012 2011
Banka Koper’s rating loans and advances (%) Impairment loss (%) loans and advances (%) Impairment loss (%)
A 71 0.5 70 0.5
B 19 2.3 21 2.6
C 2 12.9 2 18.5
D 4 38.5 3 34.9
E 4 63.2 4 65.0
100 5.0 100 5.0
2012 2011
Group’s rating loans and advances (%) Impairment loss (%) loans and advances (%) Impairment loss (%)
A 71 0.5 70 0.5
B 19 2.3 20 2.6
C 2 12.9 2 18.5
D 4 36.2 4 33.6
E 4 62.6 4 65.0
100 5.0 100 5.0
Impairments
Based on estimates of a debtor’s credit capacity and collateral pledged, credit risk impairments are set aside against the Bank and Group assets. Impairments, collective or individual, are set against the portion of claims, which are judged with a high probability of not being repaid. Impairments on individual basis are estimated for corporate debtors and entrepreneurs whose total exposure exceeds EUR 75,000 and are classified as non-performing and for which an incurred loss has been ascertained. Individual assessment is carried out with the estimation of cash-flows, expected to be collected from the debtor, guarantor or from collateral pledged, discounted at the contractual inter-est rate, which is generally equal to effective interest rate.
enhancements attached. For on-balance-sheet assets, the exposures set out above are based on net carrying amounts as reported in the statement of financial position.
Credit Classification
The classification of debtors is carried out in line with internal procedure for analysing debtors’ cred-itworthiness, which is harmonized with regulatory requirements. Investments in the credit portfolio are classified into five prudential groups, established by the Bank of Slovenia. Within those 5 credit groups there are 12 internally defined credit classes. Claims on debtors awarded the maximum credit worthiness or having an adequate state guarantee are classified in the category A, claims on debtors with a lowest rating (credit standing) are classified in group E.
The A to E classification is based on the debtor’s ability to repay debt on schedule. The evaluation takes into account the debtor financial position, cash-flow capacity for repayment of debt, collateral pledged and the debt repayment record in the past periods. The Bank and Group consider as per-forming loans exposures towards clients classified A and B, and, starting from 2011, also the expo-sures towards individuals classified into C cluster.
Banka Koper annual report 2012 • financial statements 76

Collectively assessed impairments and provisions are evaluated for individuals and legal persons sepa-rately. Legal persons’ evaluation is based on the underlying collateral, while the exposures toward individuals are split into the following groups:
• Housing loans,• Long-term consumer loans,• Short-term consumer loans,• Approved overdrafts on transactions accounts• Credit card claims
Collective assessment of impairments and provisions are ascertained with the expected loss, estimat-ed with the measurement of probabilities of default and recovery rates, collected from the available Bank’s or Group’s data. The methodology and assumptions behind the incurred loss calculation are reviewed and updated annually.
When a loan is unrecoverable, it is written off against the provision set for loan impairment. Such loans are written off after all the available legal devices have been used and the amount of the loss is definitively ascertained. If, in a subsequent period, the amount of the impairment loss decreases and the decrease can be related objectively to an event occurring after the impairment was recognized (such as an improvement in the debtor’s credit rating), the previously recognized impairment loss is reversed by adjusting the allowance account. The amount of the reversal is recognized within the statement of income in impairment charges for credit losses.
Large Exposures
In order to limit the risk against single borrowers that may account for a significant percentage of the total exposure, the Bank or Group controls and manages the single-name credit concentration risk. The maximum exposure against a single borrower and connected entities is limited by law and should not exceed 25% of the Bank’s or Group’s capital (own funds). In addition, with the aim to control credit concentration, the Bank or Group calculates the indices of industry and single-name credit concentration. Indices are measured with the methodology established by the Bank of Slovenia.
Financial instrument`s breakdown by country risk
Slovenia eu of this in Italy other europe Rest of world total
Cash and balances with Central Banks 29,388 - - - - 29,388
Financial instruments held for trading: 2 288 288 - - 290
- derivative financial instruments 2 288 288 - - 290
Financial assets designated at fair value through profit or loss - 282 282 - - 282
Investment securities available for sale 194,027 104,758 87,473 5,305 - 304,090
Loans and advances: 1,799,706 51,414 46,017 49,654 40,808 1,941,582
- to banks 10,629 46,620 43,275 381 678 58,308
- to customers 1,775,680 4,119 2,741 49,262 34,778 1,863,839
- advances 13,397 675 1 11 5,352 19,435
Investments in subsidiaries 3,688 - - - - 3,688
Other assets 710 148 43 26 4 888
Contingent liabilities and commitments 542,002 41,253 41,253 1,045 63 584,363
totAl eXpoSuReS 2,569,523 198,143 175,356 56,030 40,875 2,864,571
Country risk – unconsolidated as at 31 December 2012 (all amounts expressed in thousands of EUR)
Banka Koper annual report 2012 • financial statements 77

Slovenia eu of this in Italy other europe Rest of world total
Cash and balances with Central Banks 35,463 - - - - 35,463
Financial instruments held for trading: 1,292 1,960 1,818 66 - 3,318
- trading assets 1,292 - - - 1,292
- derivative financial instru-ments - 1,960 1,818 66 - 2,026
Investment securities available for sale 178,741 101,275 61,451 7,207 995 288,218
Loans and advances: 1,813,950 24,804 13,733 54,283 45,599 1,938,636
- to banks 12,238 21,567 12,995 10,465 619 44,889
- to customers 1,796,796 2,562 734 43,781 40,223 1,883,362
- advances 4,916 675 4 37 4,757 10,385
Other assets 1,386 94 2 6 3 1,489
Contingent liabilitiesand commitments 435,897 48,570 48,570 6,968 - 491,435
totAl eXpoSuReS 2,466,729 176,703 125,574 68,530 46,597 2,758,559
Slovenia eu of this in Italy other europe Rest of world total
Cash and balances with Central Banks 35,463 - - - - 35,463
Financial instruments held for trading: 1,292 1,960 1,818 66 - 3,318
- trading assets 1,292 - - - 1,292
- derivative financial instru-ments - 1,960 1,818 66 - 2,026
Investment securities available for sale 178,741 101,275 61,451 7,207 995 288,218
Loans and advances: 1,754,185 24,804 13,733 54,283 45,599 1,878,871
- to banks 12,238 21,567 12,995 10,465 619 44,889
- to customers 1,737,997 2,562 734 43,781 40,223 1,824,563
- advances 3.950 675 4 37 4.757 9.419
Investments in subsidiaries 3,688 - - - - 3,688
Other assets 1,146 94 2 6 3 1,249
Contingent liabilities and commitments 440,853 48,570 48,570 6,968 - 496,391
totAl eXpoSuReS 2,415,368 176,703 125,574 68,530 46,597 2,707,198
Slovenia eu of this in Italy other europe Rest of world total
Cash and balances with Central Banks 29,388 - - - - 29,388
Financial instruments held for trading: 2 288 288 - - 290
- derivative financial instru-ments 2 288 288 - - 290
Financial assets designated at fair value through profit or loss - 282 282 - - 282
Investment securities available for sale 194,027 104,758 87,473 5,305 - 304,090
Loans and advances: 1,844,518 51,414 46,017 49,654 40,808 1,986,394
- to banks 10,629 46,620 43,275 381 678 58,308
- to customers 1,825,617 4,119 2,741 49,262 34,778 1,913,776
- advances 8,272 675 1 11 5,352 14,310
Other assets 10,313 148 43 26 4 10,491
Contingent liabilities and commitments 540,269 41,253 41,253 1,045 63 582,630
totAl eXpoSuReS 2,618,517 198,143 175,356 56,030 40,875 2,913,565
Country risk – unconsolidated as at 31 December 2011(all amounts expressed in thousands of EUR)
Country risk – consolidated as at 31 December 2012(all amounts expressed in thousands of EUR)
Banka Koper annual report 2012 • financial statements 78

Slovenia eu of this in Italy other europe Rest of world total
Cash and balances with Central Banks 35,463 - - - - 35,463
Financial instruments held for trading: 1,292 1,960 1,818 66 - 3,318
- trading assets 1,292 - - - 1,292
- derivative financial instru-ments - 1,960 1,818 66 - 2,026
Investment securities available for sale 178,741 101,275 61,451 7,207 995 288,218
Loans and advances: 1,813,950 24,804 13,733 54,283 45,599 1,938,636
- to banks 12,238 21,567 12,995 10,465 619 44,889
- to customers 1,796,796 2,562 734 43,781 40,223 1,883,362
- advances 4,916 675 4 37 4,757 10,385
Other assets 1,386 94 2 6 3 1,489
Contingent liabilitiesand commitments 435,897 48,570 48,570 6,968 - 491,435
totAl eXpoSuReS 2,466,729 176,703 125,574 68,530 46,597 2,758,559
Country risk – consolidated as at 31 December 2011(all amounts expressed in thousands of EUR)
3.4 Financial instrument`s breakdown by country risk
Past due financial instruments relate only to loans and advances portfolio, other financial instrument portfolios not recorded delays.
Loans and advances are summarised as follows:
31 December 2012 31 December 2011
unconsolidatedloans and advances
to customersloans and advances
to banksloans and advances
to customersloans and advances
to banks
Neither past due nor impaired 1,758,239 58,308 1,712,997 44,889
Past due but not impaired 9,712 - 12,700 -
Impaired 223,212 - 218,789 -
Gross 1,991,163 58,308 1,944,486 44,889
Impairment losses on loans and advances (127,324) - (119,923) -
net 1,863,839 58,308 1,824,563 44,889
Loans and advances by maturity (past due) – unconsolidated (all amounts expressed in thousands of EUR)
On 31.12.2012 the group of Banka Koper was exposed towards selected EU countries (Portugal, Ire-land, Greece, Italy and Spain) only to Italy in the amount of EUR 175,356 thousand, within exposure to parent company amouned to EUR 84,739 thousand.
Banka Koper annual report 2012 • financial statements 79

31 December 2012 31 December 2011
Consolidatedloans and advances
to customersloans and advances
to banksloans and advances
to customersloans and advances
to banks
Neither past due nor impaired 1,794,857 58,308 1,763,156 44,889
Past due but not impaired 11,461 - 14,447 -
Impaired 237,230 - 227,442 -
Gross 2,043,548 58,308 2,005,045 44,889
Impairment losses on loans and advances (129,772) - (121,683) -
net 1,913,776 58,308 1,883,362 44,889
Loans and advances by maturity (past due) – consolidated (all amounts expressed in thousands of EUR)
Loans and advances to customers by maturity and credit rating – unconsolidated (all amounts expressed in thousands of EUR)
Individuals
31 December 2012 overdrafts Credit Cards term loans MortgagesSole
proprietorsCorporate
entities
total loans and advancesto customers
Neither past due nor impaired A 40,021 19,069 115,267 335,403 31,440 792,621 1,333,821
Neither past due nor impaired B 370 98 5,605 20,651 24,235 362,379 413,338
Neither past due nor impaired C - - - - - - -
Neither past due nor impaired D - - - - - - -
Neither past due nor impaired E - - - - - - -
total neither past due nor impaired 40,391 19,167 120,872 356,054 55,675 1,155,000 1,747,159
not past due but impaired 123 541 3,174 11,583 3,296 52,070 70,787
Past due or impaired 2,350 2,364 3,792 2,685 11,764 150,262 173,217
Gross 42,864 22,072 127,838 370,322 70,735 1,357,332 1,991,163
Impairment losses on loans and advances (2,209) (1,281) (3,392) (3,282) (9,186) (107,974) (127,324)
net 40,655 20,791 124,446 367,040 61,549 1,249,358 1,863,839
Banka Koper annual report 2012 • financial statements 80
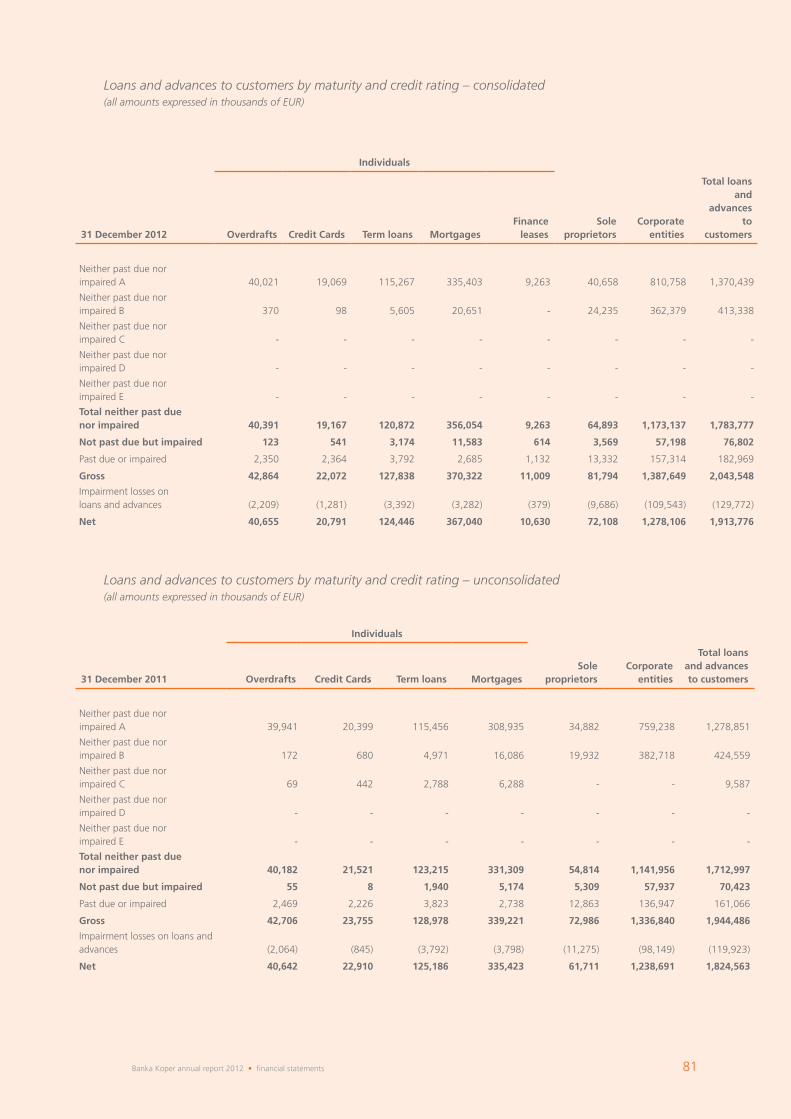
Loans and advances to customers by maturity and credit rating – consolidated (all amounts expressed in thousands of EUR)
Individuals
31 December 2012 overdrafts Credit Cards term loans MortgagesFinance
leases Sole
proprietorsCorporate
entities
total loans and
advancesto
customers
Neither past due nor impaired A 40,021 19,069 115,267 335,403 9,263 40,658 810,758 1,370,439
Neither past due nor impaired B 370 98 5,605 20,651 - 24,235 362,379 413,338
Neither past due nor impaired C - - - - - - - -
Neither past due nor impaired D - - - - - - - -
Neither past due nor impaired E - - - - - - - -
total neither past due nor impaired 40,391 19,167 120,872 356,054 9,263 64,893 1,173,137 1,783,777
not past due but impaired 123 541 3,174 11,583 614 3,569 57,198 76,802
Past due or impaired 2,350 2,364 3,792 2,685 1,132 13,332 157,314 182,969
Gross 42,864 22,072 127,838 370,322 11,009 81,794 1,387,649 2,043,548
Impairment losses on loans and advances (2,209) (1,281) (3,392) (3,282) (379) (9,686) (109,543) (129,772)
net 40,655 20,791 124,446 367,040 10,630 72,108 1,278,106 1,913,776
Loans and advances to customers by maturity and credit rating – unconsolidated (all amounts expressed in thousands of EUR)
Individuals
31 December 2011 overdrafts Credit Cards term loans MortgagesSole
proprietorsCorporate
entities
total loans and advancesto customers
Neither past due nor impaired A 39,941 20,399 115,456 308,935 34,882 759,238 1,278,851
Neither past due nor impaired B 172 680 4,971 16,086 19,932 382,718 424,559
Neither past due nor impaired C 69 442 2,788 6,288 - - 9,587
Neither past due nor impaired D - - - - - - -
Neither past due nor impaired E - - - - - - -
total neither past duenor impaired 40,182 21,521 123,215 331,309 54,814 1,141,956 1,712,997
not past due but impaired 55 8 1,940 5,174 5,309 57,937 70,423
Past due or impaired 2,469 2,226 3,823 2,738 12,863 136,947 161,066
Gross 42,706 23,755 128,978 339,221 72,986 1,336,840 1,944,486
Impairment losses on loans and advances (2,064) (845) (3,792) (3,798) (11,275) (98,149) (119,923)
net 40,642 22,910 125,186 335,423 61,711 1,238,691 1,824,563
Banka Koper annual report 2012 • financial statements 81

Loans and advances to customers by maturity and credit rating – consolidated (all amounts expressed in thousands of EUR)
Individuals
31 December 2011 overdrafts Credit Cards term loans MortgagesFinance
leasesSole
proprietorsCorporate
entities
total loans and
advancesto
customers
Neither past due nor impaired A 39,941 20,399 115,456 308,935 8,766 43,153 792,360 1,329,010
Neither past due nor impaired B 172 680 4,971 16,086 - 19,932 382,718 424,559
Neither past due nor impaired C 69 442 2,788 6,288 - - - 9.587
Neither past due nor impaired D - - - - - - - -
Neither past due nor impaired E - - - - - - - -
total neither past due nor impaired 40,182 21,521 123,215 331,309 8,766 63,085 1,175,078 1,763,156
not past due but impaired 55 8 1,940 5,174 568 5,514 61,797 75,056
Past due or impaired 2,469 2,226 3,823 2,738 1,012 13,700 140,865 166,833
Gross 42,706 23,755 128,978 339,221 10,346 82,299 1,377,740 2,005,045
Impairment losses on loans and advances (2,064) (845) (3,792) (3,798) (310) (11,700) (99,174) (121,683)
net 40,642 22,910 125,186 335,423 10,036 70,559 1,278,566 1,883,362
Individuals
31. December 2012 – unconsolidated overdrafts Credit cards term loans Mortgages
total individu-
als
not impaired Impaired
not impaired Impaired
not impaired Impaired
not impaired Impaired
Past due up to 30 days 323 - 897 22 5 57 1 1 1,306
Past due 30 - 60 days 60 - 211 33 293 74 238 42 951
Past due 60 - 90 days 57 1 67 50 62 53 43 25 358
Past due over 90 days 22 1,887 - 1,084 12 3,236 26 2,309 8,576
total 462 1,888 1,175 1,189 372 3,420 308 2,377 11,191
Sole proprietors Corporate entities
totalnot
impaired Impairednot
impaired Impaired
Past due up to 30 days 264 272 6,134 4,268 10,938
Past due 30 - 60 days 88 265 499 495 1,347
Past due 60 - 90 days 74 199 255 537 1,065
Past due over 90 days 8 10,594 72 138,002 148,676
total 434 11,330 6,960 143,302 162,026
There were any renegotiated loans in 2012 (2011: EUR 27,743 thousands).
Ageing of past due loans and advances to customers by rating, type of customers and product – unconsolidated (all amounts expressed in thousands of EUR)
Banka Koper annual report 2012 • financial statements 82

Individuals
overdrafts Credit cards term loans Mortgages Finance leases totalindi-
viduals31. December 2012 – Consolidated
not im-paired
Im-paired
not im-paired
Im-paired
not im-paired
Im-paired
not im-paired
Im-paired
not im-paired
Im-paired
Past due up to 30 days 323 - 897 22 5 57 1 1 83 9 1,398
Past due 30 - 60 days 60 - 211 33 293 74 238 42 36 15 1,002
Past due 60 - 90 days 57 1 67 50 62 53 43 25 20 10 388
Past due over 90 days 22 1,887 - 1,084 12 3,236 26 2,309 15 944 9,535
total 462 1,888 1,175 1,189 372 3,420 308 2,377 154 978 12,323
Sole proprietors Corporate entities
total
not im-
pairedIm-
paired
not im-
pairedIm-
paired
Past due up to 30 days 395 292 6,589 4,354 11,630
Past due 30 - 60 days 145 277 751 591 1,764
Past due 60 - 90 days 96 207 414 619 1,336
Past due over 90 days 50 11,870 549 143,447 155,916
total 686 12,646 8,303 149,011 170,646
There were any renegotiated loans in 2012 (2011: EUR 27,743 thousands).
Ageing of past due loans and advances to customers by rating, type of customers and product – consolidated (all amounts expressed in thousands of EUR)
Individuals
overdrafts Credit cards term loans Mortgages total individu-
als31. December 2011 - unconsolidated
not impaired Impaired
not impaired Impaired
not impaired Impaired
not impaired Impaired
Past due up to 30 days 283 - 1,304 66 4 11 - 4 1,672
Past due 30 - 60 days 109 - 135 48 431 91 215 55 1,084
Past due 60 - 90 days 53 1 48 45 71 68 33 37 356
Past due over 90 days 27 1,996 1 579 14 3,133 4 2,390 8,144
total 472 1,997 1,488 738 520 3,303 252 2,486 11,256
Sole proprietors Corporate entities
totalnot
impaired Impairednot
impaired Impaired
Past due up to 30 days 234 323 3,869 2,850 7,276
Past due 30 - 60 days 87 811 2,644 4,591 8,133
Past due 60 - 90 days 45 399 3,057 12,918 16,419
Past due over 90 days 9 10,955 23 106,995 117,982
total 375 12,488 9,593 127,354 149,810
Ageing of past due loans and advances to customers by rating, type of customers and product – unconsolidated (all amounts expressed in thousands of EUR)
Banka Koper annual report 2012 • financial statements 83

Individuals
overdrafts Credit cards term loans Mortgages Finance leases totalindi-
viduals31. December 2011 – Consolidated
not im-paired
Im-paired
not im-paired
Im-paired
not im-paired
Im-paired
not im-paired
Im-paired
not im-paired
Im-paired
Past due up to 30 days 283 - 1,304 66 4 11 - 4 71 92 1,835
Past due 30 - 60 days 109 - 135 48 431 91 215 55 37 22 1,143
Past due 60 - 90 days 53 1 48 45 71 68 33 37 16 8 380
Past due over 90 days 27 1,996 1 579 14 3,133 4 2,390 12 754 8,910
total 472 1,997 1,488 738 520 3,303 252 2,486 136 876 12,268
Sole proprietors Corporate entities total
not im-
pairedIm-
paired
not im-
pairedIm-
paired
Past due up to 30 days 335 356 4,374 3,052 8,117
Past due 30 - 60 days 151 833 2,997 4,662 8,643
Past due 60 - 90 days 88 432 3,227 12,995 16,742
Past due over 90 days 48 11,457 359 109,199 121,063
total 622 13,078 10,957 129,908 154,565
Ageing of past due loans and advances to customers by rating, type of customers and product – consolidated (all amounts expressed in thousands of EUR)
In 2012, the Bank received EUR 10,224 thousands from the sale of pledged collateral.
The breakdown of the gross amount of individually impaired loans and advances by class, along with the fair value of related collateral held by the Group as security, is as follows:
Loans and advances individually impaired(all amounts expressed in thousands of EUR)
Banka Koper and consolidated
31 December 2012 Individuals Sole proprietors Corporate entities total
Individually impaired loans - 9,295 188,329 197,624
Fair value of collateral - 20,104 280,828 300,932
31 December 2011 Individuals Sole proprietors Corporate entities total
Individually impaired loans - 10,919 177,761 188,680
Fair value of collateral - 25,037 267,083 292,120
Banka Koper annual report 2012 • financial statements 84

3.5 Liquidity risk
Liquidity risk is defined as the risk that the bank will not able to meet its payment obligations when they fall due, due to difficulties to obtain funds on the money market, or liquidate its marketable as-sets, taking into account losses that may be incurred due to forced actions.
The minimum liquidity to be maintained by banks is regulated by the Bank of Slovenia regulation on the mandatory reserve and the regulation on the minimum liquidity, establishing the minimum liquid-ity ratio for assets and liabilities with a maturity up to 1-month.
In order to manage the liquidity, the Bank or Group monitors the liquidity ratio and mandatory re-serves on a daily basis, enabling it to maintain the position within the established minimum levels. At operating level the liquidity is managed by a careful daily cash-flow planning, carried out by the Bank’s or Group’s Treasury. The Treasury Department keeps an adequate amount of eligible assets as collateral for obtaining funds from the Euro system and other money market participants. The structural liquidity is preserved by the definition of the minimum ratio between long-term assets and short-term liabilities.
The Risk Policy and Methodology Department monitors the short-term liquidity and structural liquid-ity position under normal and stressed conditions, applying appropriate assumptions for assets and liabilities of uncertain maturity. The Risk Policy and Methodology Department at least on a monthly basis, measures and reports the liquidity ratios to ALCO Committee and monitors the compliance with minimum established ratio levels. The Group established two key internal measures:
• the internal short-term liquidity ratio between expected inflows and outflows with residual maturity up to one month has to be equal to 1 or higher;
• the amount of medium/long term assets cannot exceed the amount of sources, deemed to be appropriate for financing longer-term assets.
The eventual liquidity crisis is addressed by a Contingency Liquidity Plan, which establishes early warn-ing indicators and roles and actions to be undertaken to counteract the adverse financial conditions.
Banka Koper annual report 2012 • financial statements 85

Maturities of assets and liabilities - unconsolidated
Non-derivative cash flows by Expected maturities as at 31 December 2012(all amounts expressed in thousands of EUR)
expected maturity
up to 1 month
1-3 months
3-12 months
total to 1 Year 1- 5 years
over 5 years
total over 1 year total
ASSETS
Cash and balances with central banks 15,361 - - 15,361 - 14,027 14,027 29,388
Financial assets designated at fair value through profit or loss - - - - 282 - 282 282
Investment securities available for sale 5,906 4,462 56,657 67,025 192,841 44,224 237,065 304,090
Loans and advances: 239,161 101,995 435,271 776,427 690,983 474,172 1,165,155 1,941,582
- to banks 43,324 5,139 9,845 58,308 - - - 58,308
- to customers 191,302 87,930 419,452 698,684 690,983 474,172 1,165,155 1,863,839
- advances 4,535 8,926 5,974 19,435 - - - 19,435
Property, plant and equipment - - - - 3,152 23,181 26,333 26,333
Investment property - - - - 1,028 - 1,028 1,028
Intangible assets - - - - 4,236 - 4,236 4,236
Investment in subsidiaries - - - - - 3,688 3,688 3,688
Income tax assets: 1 3 3,314 3,318 1,053 310 1,363 4,681
- current income tax - - 3,229 3,229 - - - 3,229
- deferred income tax 1 3 85 89 1,053 310 1,363 1,452
Other assets 117 46 334 497 391 - 391 888
total assets 260,546 106,506 495,576 862,628 893,966 559,602 1,453,568 2,316,196
LIABILITIES
Liabilities to Central Bank - - - - 201,750 - 201,750 201,750
Liabilities carried at amortised cost: 947,490 221,146 407,574 1,576,210 150,810 96,703 247,513 1,823,723
- deposits from banks 9,189 - 47,503 56,692 8,167 10,500 18,667 75,359
- due to customers 891,063 187,334 347,599 1,425,996 78,233 3,087 81,320 1,507,316
- other borrowed funds from banks 30,699 29,988 10,451 71,138 59,916 83,116 143,032 214,170
- other borrowed funds from other customers 7 5 2,021 2,033 4,494 - 4,494 6,527
- other financial liabilities 16,532 3,819 - 20,351 - - - 20,351
Provisions: - - 623 623 7,597 3,166 10,763 11,386
- provisions for liabilities and charges - - 623 623 7,597 - 7,597 8,220
- retirement benefit obligations - - - - - 3,166 3,166 3,166
Other liabilities 749 666 - 1,415 - - - 1,415
total liabilities 948,239 221,812 408,197 1,578,248 360,157 99,869 460,026 2,038,274
net lIQuIDItY GAp (687,693) (115,306) 87,379 (715,620) 533,809 459,733 993,542 277,922
As at 31 December 2011
Total assets 285,567 127,085 521,120 933,772 822,756 491,236 1,313,992 2,247,764
Total liabilities 892,652 432,313 274,267 1,599,232 262,023 118,317 380,340 1,979,572
net liquidity gap (607,085) (305,228) 246,853 (665,460) 560,733 372,919 933,652 268,192
Banka Koper annual report 2012 • financial statements 86

Maturities of assets and liabilities - unconsolidated and consolidated
Derivative cash flows by expected maturity – derivati ves settled on a net basis as at 31 December 2012(all amounts expressed in thousands of EUR)
expected maturity
up to 1 month
1-3 months
3-12 months
total to 1 Year 1- 5 years
over 5 years
total over 1 year total
DERIVATIVE ASSETS
Derivatives held for trading:
- forward currency 2 - - 2 - - - 2
- interest rate cap - - - - - 112 112 112
- interest option (CALL) - - - - 176 - 176 176
total 2 - - 2 176 112 288 290
DERIVATIVE LIABILITIES
Derivatives held for trading:
- forward currency 2 - - 2 - - - 2
- currency swaps 12 - - 12 - - - 12
- interest rate cap - - - - - 9 9 9
- interest option (PUT) - - - - 161 - 161 161
total 14 - - 14 161 9 170 184
net lIQuIDItY GAp (12) - - (12) 15 103 118 106
As at 31 December 2011
Total derivative assets 786 - - 786 1,111 129 1,240 2,026
Total derivative liabilities 1 - - 1 1,102 32 1,134 1,135
net lIQuIDItY GAp 785 - - 785 9 97 106 891
Banka Koper annual report 2012 • financial statements 87

As at 31 December 2012up to 1 month
1-3 months
3-12 months
total to 1 Year 1- 5 years
over 5 years
total over 1 year total
DERIVATIVE ASSETS
Derivatives held for hedge accounting - - - - - - - -
total - - - - - - - -
DERIVATIVE LIABILITIES
Derivatives held for hedge accounting: - - - - 1,573 - 1,573 1,573
Total - - - - 1,573 - 1,573 1,573
net lIQuIDItY GAp - - - - (1,573) - (1,573) (1,573)
As at 31 December 2011up to 1 month
1-3 months
3-12 months
total to 1 Year 1- 5 years
over 5 years
total over 1 year total
DERIVATIVE ASSETS
Derivatives held for hedge accounting: - - - - - - - -
total - - - - - - - -
DERIVATIVE LIABILITIES
Derivatives held for hedge accounting: - - - - 992 - 992 992
Total - - - - 992 - 992 992
net lIQuIDItY GAp - - - - (992) - (992) (992)
Derivative cash flows by expected maturities – derivatives settled on a gross basis(all amounts expressed in thousands of EUR)
expected maturity
As at 31 December 2012up to 1 month
1 - 3 months
3 - 12months
total to 1 year 1 - 5 years
total over 1 year total
DERIVATIVES HELD FOR TRADING:
- Currency swaps
- outflow - - - - - - -
- inflow 24,172 - - 24,172 - - 24,172
- Currency forward
- outflow 82 - - 82 - - 82
- inflow 80 - - 80 - - 80
total outflow 82 - - 82 - - 82
total inflow 24,252 - - 24,252 - - 24,252
expected maturity
As at 31 December 2011up to 1 month
1 - 3 months
3 - 12 months
total to 1 year 1 - 5 years
total over 1 year total
DERIVATIVES HELD FOR TRADING:
- Currency swaps
- outflow 13,924 - - 13,924 - - 13,924
- inflow 68,323 - - 68,323 - - 68,323
total outflow 13,924 - - 13,924 - - 13,924
total inflow 68,323 - - 68,323 - - 68,323
Banka Koper annual report 2012 • financial statements 88

Cash flows on gross basis are exchanged only for currency swaps. For the other type of derivative instruments the settlement is made on net basis.
Maturities of assets and liabilities - consolidated
Non derivative cash flows by expected maturities(all amounts expressed in thousands of EUR)
expected maturity
As at 31 December 2012up to 1 month
1-3months
3-12months
total to1 year
1- 5years
over 5 years
total over 1 year total
ASSETS
Cash and balances with central banks 15,361 - - 15,361 - 14,027 14,027 29,388
Financial assets designated at fair value through profit or loss - - - - 282 - 282 282
Investment securities available for sale 5,906 4,462 56,657 67,025 192,841 44,224 237,065 304,090
Loans and advances: 235,681 104,868 433,449 773,998 715,259 497,137 1,212,396 1,986,394
- to banks 43,324 5,139 9,845 58,308 - - - 58,308
- to customers 186,973 90,803 423,604 701,380 715,259 497,137 1,212,396 1,913,776
- advances 5,384 8,926 - 14,310 - - - 14,310
Goodwill - - - - - 905 905 905
Property, plant and equipment - - - - 4,386 23,181 27,567 27,567
Investment property - - - - 6,445 - 6,445 6,445
Intangible assets - - - - 4,337 - 4,337 4,337
Income tax assets: 564 3 3,314 3,881 1,053 310 1,362 5,244
- current income tax - - 3,229 3,229 - - - 3,229
- deferred income tax 564 3 85 652 1,053 310 1,363 2,015
Other assets 117 46 9,937 10,100 391 - 391 10,491
total assets 257,629 109,379 503,357 870,365 924,994 579,784 1,504,778 2,375,143
LIABILITIES
Liabilities to Central Bank - - - - 201,750 - 201,750 201,750
Liabilities carried at amortised cost: 947,492 221,697 427,573 1,596,762 179,810 103,703 283,513 1,880,275
- deposits from banks 9,189 - 47,503 56,692 8,167 10,500 18,667 75,359
- due to customers 891,048 187,334 347,599 1,425,981 78,233 3,087 81,320 1,507,301
- other borrowed funds from banks 30,716 30,013 30,450 91,179 88,916 90,116 179,032 270,211
- other borrowed funds from other customers 7 5 2,021 2,033 4,494 - 4,494 6,527
- other financial liabilities 16,532 4,345 - 20,877 - - - 20,877
Provisions: - - 623 623 7,579 3,252 10,831 11,454
- provisions for liabilities and charges - - 623 623 7,579 - 7,579 8,202
- retirement benefit obligations - - - - - 3,252 3,252 3,252
Income tax liabilities: 64 - - 64 - - - 64
- current income tax 64 - - 64 - - - 64
Other liabilities 901 666 - 1,567 - - - 1,567
total liabilities 948,457 222,363 428,196 1,599,016 389,139 106,955 496,094 2,095,110
net liquidity gap (690,828) (112,984) 75,161 (728,651) 535,855 472,829 1,008,684 280,033
As at 31 December 2011
Total assets 287,055 129,861 528,327 945,243 844,815 516,660 1,361,475 2,306,718
Total liabilities 893,879 432,313 274,267 1,600,459 310,976 125,398 436,374 2,036,833
net liquidity gap (606,824) (302,452) 254,060 (655,216) 533,839 391,262 925,101 269,885
Banka Koper annual report 2012 • financial statements 89

Expected maturities of off-balance sheet items - unconsolidated
(all amounts expressed in thousands of EUR)
expected maturity
As at 31 December 2012 no later than 1 year 1-5 years Over 5 years Total
Documentary and commercial letters of credit 73 - - 73
Guarantees 125,717 70,554 20,199 216,470
Derivative financial instruments 245 344 126 715
Credit commitments 356,118 11,702 - 367,820
total 482,153 82,600 20,325 585,078
As at 31 December 2011
total 395,215 91,778 19,353 506,346
Expected maturities of off-balance sheet items - consolidated
(all amounts expressed in thousands of EUR)
expected maturity
As at 31 December 2012 no later than 1 year 1-5 years Over 5 years Total
Documentary and commercial letters of credit 73 - - 73
Guarantees 125,717 70,554 20,199 216,470
Credit commitments 354,367 11,702 - 366,069
Other 245 344 126 715
total 480,402 82,600 20,325 583,327
As at 31 December 2011
total 395,211 86,826 19,353 501,390
Unconsolidated contractual un-discounted non-derivative cash flows of financial liabilities
(all amounts expressed in thousands of EUR)
As at 31 December 2012 up to 1 month 1-3 months 3-12 months 1-5 years Over 5 years total
Liabilities to Central Bank - - - 37,511 - 37,511
Liabilities carried at amortized cost: 948,626 221,674 410,534 156,229 103,510 1,840,573
- deposits from banks 9,200 - 47,828 8,447 11,220 76,695
- due to customers 892,151 187,792 350,146 81,099 3,313 1,514,501
- other borrowed funds from banks 30,736 30,058 10,525 62,028 88,977 222,324
- other borrowed funds from other customers 7 5 2,035 4,655 - 6,702
- advances 16,532 3,819 - - - 20,351
Financial guaranties issued 22,265 13,353 21,716 60,439 7,667 125,440
Banka Koper annual report 2012 • financial statements 90

Consolidated contractual un-discounted non-derivative cash flows of financial liabilities (all amounts expressed in thousands of EUR)
As at 31 December 2012 up to 1 month 1-3 months 3-12 months 1-5 years Over 5 years total
Liabilities to Central Bank - - - 37,511 - 37,511
Liabilities carried at amortised cost: 948,628 222,225 430,674 186,252 111,004 1,898,783
- deposits from banks 9,200 - 47,828 8,447 11,220 76,695
- due to customers 892,136 187,792 350,146 81,099 3,313 1,514,486
- other borrowed funds from banks 30,753 30,083 30,665 92,051 96,471 280,023
- other borrowed funds from other customers 7 5 2,035 4,655 - 6,702
- advances 16,532 4,345 - - - 20,877
Financial guaranties issued 22,265 13,353 21,716 60,439 7,667 125,440
Unconsolidated contractual un-discounted non-derivative cash flows of financial liabilitie
(all amounts expressed in thousands of EUR)
As at 31 December 2011 up to 1 month 1-3 months 3-12 months 1-5 years Over 5 years total
Liabilities to Central Bank - - - 154,543 - 154,543
Liabilities carried at amortized cost: 866,287 426,172 274,273 109,643 127,025 1,803,400
- deposits from banks 21,085 180,968 11,458 9,813 12,864 236,188
- due to customers 842,872 242,118 211,441 38,095 2,482 1,337,008
- other borrowed funds from banks 1,839 3,082 49,326 55,194 111,645 221,086
- other borrowed funds from other customers 491 4 2,048 6,541 34 9,118
Financial guaranties issued 13,088 12,302 16,899 38,567 7,002 87,858
Consolidated contractual un-discounted non-derivative cash flows of financial liabilities
(all amounts expressed in thousands of EUR)
As at 31 December 2011 up to 1 month 1-3 months 3-12 months 1-5 years Over 5 years total
Liabilities to Central Bank - - - 154,543 - 154,543
Liabilities carried at amortised cost: 866,370 426,172 274,273 161,146 134,739 1,862,700
- deposits from banks 21,085 180,968 11,458 9,813 12,864 236,188
- due to customers 842,870 242,118 211,441 38,095 2,482 1,337,006
- other borrowed funds from banks 1,924 3,082 49,326 106,697 119,359 280,388
- other borrowed funds from other customers 491 4 2,048 6,541 34 9,118
Financial guaranties issued 13,088 12,302 16,899 38,567 7,002 87,858
3.6 Equity risks of banking book
The risk is defined as the risk of unexpected losses of available-for sale equity investments (shares or capital investments), not consolidated into financial statements of the Bank or Group.
The Group does not manage the equity portfolio for proprietary trading purposes, but manage the investments acquired through the repossession of equity stakes, originally pledged as collateral to loans extended to its customers. The Bank is actively looking for any possibility to dispose the assets to eventual strategic or other interested groups of investors.
Banka Koper annual report 2012 • financial statements 91

3.7 Market risk
Market risk is connected to trading activities, which comprise buying or selling financial instruments on its own behalf (the purpose of them is a short-term sale with the intent to realize a gain, or earnings generated from the selling and buying price differences, resulting from actual or expected short-term price movements), or for the purpose of a present or future transaction with a client. The profit from trading is a result of the price or interest rate change, the difference between the buy-ing and selling price, or the margin charged to the client. Trading activities also include transactions for the purpose of trading position hedging. The trading instrument acquisition purpose has to be established before the actual contract is closed.
The Bank’s or Group’s main trading activities are foreign currency trades and derivative deals.
The operational risk arising from trading activities is managed on the basis of a clear division between the front and back-office operations, which ensures the required internal controls and the division of incompatible roles.
3.7.1 Derivative instrumentsThe derivative deals the Bank or Group undertakes are the ones driven by customers’ demands. Every single deal with a customer is correspondingly hedged in order to offset the position risk on a deal by deal basis (risk of decrease in the fair value, resulting from price change of the underlying instrument). The Bank or Group assumes only credit risk toward the deal counterparty. Credit risk is measured on a replacement cost basis and assumed only toward counterparties with sound credit standing, to which a credit line is granted. On the inter-bank market, derivative deals are done only with first-rate participants.
3.7.2 Currency RiskCurrency risk is the result of open position in a particular currency and the volatility of exchange rate. The open currency position in an individual currency is the difference between claims and obligations in that foreign currency. For the purpose of measuring currency risk, the Bank or Group takes into account the overall position, which is the sum of all investment and liabilities in foreign currencies and all unsettled currency deals: spot transactions and derivative contracts.
The Group identifies and measures currency risk on a daily basis:
• as a notional open position in individual currencies,• as a Value at Risk (VAR) for the joint exposure to all currencies.
Value at Risk is a statistical calculation of a maximum potential loss, which can occur during the next working day with a 99 % statistical confidence. The Value at Risk measure combines the amount of the open position in single currencies and their exchange rate volatilities and correlations. Due to intensive daily volatility of exchange rates, the currency nominal limits are set within relatively narrow boundaries, which allow the ordinary commercial activity of the Bank or Group to be carried out smoothly.
Group VAR by risk type(all amounts expressed in millions of EUR)
12 months to 31 December 2012 12 months to 31 December 2011
Average High low Average High low
Foreign exchange risk (trading and non-trading portfolio) 4 11 2 5 23 -
Bond risk (banking book) 1,657 2,571 930 - - -
total VAR 1,661 2,582 932 5 23 -
Banka Koper annual report 2012 • financial statements 92

Currency risk - unconsolidated(all amounts expressed in thousands of EUR)
As at 31 December 2012 euR uSD other total
ASSETS
Cash and balances with central banks 28,563 300 525 29,388
Financial instruments held for trading: 290 - - 290
- derivative financial instruments 290 - - 290
Financial assets designated at fair value through profit or loss 282 - - 282
Investment securities available for sale 304,090 - - 304,090
Loans and advances: 1,853,490 64,964 23,128 1,941,582
- to banks 16,632 29,995 11,681 58,308
- to customers 1,817,474 34,919 11,446 1,863,839
- advances 19,384 50 1 19,435
Property, plant and equipment 26,333 - - 26,333
Investment property 1,028 - - 1,028
Intangible assets 4,236 - - 4,236
Investment in subsidiaries 3,688 - - 3,688
Income tax assets: 4,681 - - 4,681
- current income tax 3,229 - - 3,229
- deferred income tax 1,452 - - 1,452
Other assets 888 - - 888
total assets 2,227,569 65,264 23,653 2,316,486
LIABILITIES
Liabilities to Central Bank 201,750 - - 201,750
Financial instruments held for trading: 184 - - 184
- derivative financial instruments 184 - - 184
Liabilities carried at amortised cost: 1,710,066 89,821 23,836 1,823,723
- deposits from banks 67,049 5,826 2,484 75,359
- due to customers 1,437,668 48,480 21,168 1,507,316
- other borrowed funds from banks 179,002 35,168 - 214,170
- other borrowed funds from other customers 6,527 - - 6,527
- other financial liabilities 19,820 347 184 20,351
Derivatives – hedge accounting 1,573 - - 1,573
Provisions: 11,386 - - 11,386
- provisions for liabilities and charges 8,220 - - 8,220
- retirement benefit obligations 3,166 - - 3,166
Other liabilities 1,415 - - 1,415
total liabilities 1,926,374 89,821 23,836 2,040,031
net balance sheet position 301,195 (24,557) (183) 276,455
Credit commitments 372,263 118 - 372,381
As at 31 December 2011 euR uSD other total
Total assets 2,187,523 41,120 21,147 2,249,790
Total liabilities 1,863,689 96,390 21,620 1,981,699
net balance sheet position 323,834 (55,270) (473) 268,091
Credit commitments 328,319 148 - 328,467
Banka Koper annual report 2012 • financial statements 93

Currency risk- consolidated(all amounts expressed in thousands of EUR)
As at 31 December 2012 euR uSD other total
ASSETS
Cash and balances with central banks 28,563 300 525 29,388
Financial instruments held for trading: 290 - - 290
- derivative financial instruments 290 - - 290
Financial assets designated at fair value through profit or loss 282 - - 282
Investment securities available for sale 304,090 - - 304,090
Loans and advances: 1,897,709 64,964 23,721 1,986,394
- to banks 16,632 29,995 11,681 58,308
- to customers 1,866,818 34,919 12,039 1,913,776
- advances 14,259 50 1 14,310
Goodwill 905 - - 905
Property, plant and equipment 27,567 - - 27,567
Investment property 6,445 - - 6,445
Intangible assets 4,337 - - 4,337
Income tax assets: 5,244 - - 5,244
- current income tax 3,229 - - 3,229
- deferred income tax 2,015 - - 2,015
Other assets 10,491 - - 10,491
total assets 2,285,923 65,264 24,246 2,375,433
LIABILITIES
Liabilities to Central Bank 201,750 - - 201,750
Financial instruments held for trading: 184 - - 184
- derivative financial instruments 184 - - 184
Liabilities carried at amortised cost: 1,766,618 89,821 23,836 1,880,275
- deposits from banks 67,049 5,826 2,484 75,359
- due to customers 1,437,653 48,480 21,168 1,507,301
- other borrowed funds from banks 235,043 35,168 - 270,211
- other borrowed funds from other customers 6,527 - - 6,527
- other financial liabilities 20,346 347 184 20,877
Derivatives – hedge accounting 1,573 - - 1,573
Provisions: 11,454 - - 11,454
- provisions for liabilities and charges 8,202 - - 8,202
- retirement benefit obligations 3,252 - - 3,252
Income tax liabilities: 64 - - 64
- current income tax 64 - - 64
Other liabilities 1,567 - - 1,567
total liabilities 1,983,210 89,821 23,836 2,096,867
net balance sheet position 302,713 (24,557) 410 278,566
Credit commitments 370,512 118 - 370,630
Banka Koper annual report 2012 • financial statements 94

Economic hedge of net balance sheet position in USD is done by continuously USD swap transactions in the amount of FX mismatch.
3.7.3 Interest rate riskThe table below summarizes the effective annual interest rate by major currencies for monetary financial instruments not carried at fair value through profit or loss. The assets and liabilities are expressed with a book value, while the residual maturity is presented by a contractual maturity for fixed-rate positions and by next reprising date for floating rate positions.
As at 31 December 2011 euR uSD other total
Total assets 2,246,377 41,120 21,247 2,308,744
Total liabilities 1,920,950 96,390 21,620 2,038,960
net balance sheet position 325,427 (55,270) (373) 269,784
Credit commitments 323,316 148 - 323,464
Banka Koper annual report 2012 • financial statements 95

Interest rate risk - unconsolidated(all amounts expressed in thousands of EUR)
As at 31 December 2012up to 1 month 1-3 months
3-12 months 1-5 years
Over 5 years
non-inter-est bearing total
ASSETS
Cash and balances with central banks 15,361 - - - 14,027 - 29,388
Financial instruments held for trading: - 147 141 - - 2 290
- derivative financial instruments - 147 141 - - 2 290
Financial assets designated at fair value through profit or loss - - - - - 282 282
Investment securities available for sale 12,221 11,870 59,551 142,232 38,919 39,297 304,090
Loans and advances: 323,064 321,256 1,209,305 22,121 25,935 39,901 1,941,582
- to banks 40,371 5,139 9,845 - - 2,953 58,308
- to customers 282,693 316,117 1,199,460 22,121 25,935 17,513 1,863,839
- advances - - - - - 19,435 19,435
Property, plant and equipment - - - - - 26,333 26,333
Investment property - - - - - 1,028 1,028
Intangible assets - - - - - 4,236 4,236
Investment in subsidiaries - - - - - 3,688 3,688
Income tax assets: - - - - - 4,681 4,681
- current income tax - - - - - 3,229 3,229
- deferred income tax - - - - - 1,452 1,452
Other assets - - - - - 888 888
total assets 350,646 333,273 1,268,997 164,353 78,881 120,336 2,316,486
LIABILITIES
Liabilities to Central Bank 201,750 - - - - - 201,750
Financial instruments held for trading: - 35 136 - - 13 184
- derivative financial instruments - 35 136 - - 13 184
Liabilities carried at amortised cost: 961,480 267,721 474,450 96,270 3,076 20,726 1,823,723
- deposits from banks 9,190 - 66,169 - - - 75,359
- due to customers 892,189 187,334 346,566 78,151 3,076 - 1,507,316
- other borrowed funds from banks 60,094 80,382 55,694 18,000 - - 214,170
- other borrowed funds from other customers 7 5 6,021 119 - 375 6,527
- other financial liabilities - - - - - 20,351 20,351
Derivatives – Hedge accounting - 1,573 - - - - 1,573
Provisions: - - - - - 11,386 11,386
- provisions for liabilities and charges - - - - - 8,220 8,220
- retirement benefit obligations - - - - - 3,166 3,166
Other liabilities - - - - - 1,415 1,415
total liabilities 1,163,230 269,329 474,586 96,270 3,076 33,540 2,040,031
total interest repricing gap (812,584) 63,944 794,411 68,083 75,805
As at 31 December 2011up to 1 month 1-3 months
3-12 months 1-5 years
Over 5 years
non-inter-est bearing total
Total assets 360,315 338,526 1,188,567 147,772 90,646 123,964 2,249,790
Total liabilities 1,135,708 525,349 266,075 7,347 62 47,158 1,981,699
total interest repricing gap (775,393) (186,823) 922,492 140,425 90,584
Banka Koper annual report 2012 • financial statements 96

Interest rate risk - consolidated(all amounts expressed in thousands of EUR)
As at 31 December 2012up to 1 month 1-3 months
3-12 months 1-5 years
Over 5 years
non-inter-est bearing total
ASSETS
Cash and balances with central banks 15,361 - - - 14,027 - 29,388
Financial instruments held for trading: - 147 141 - - 2 290
- derivative financial instruments - 147 141 - - 2 290
Financial assets designated at fair value through profit or loss - - - - - 282 282
Investment securities available for sale 12,221 11,870 59,551 142,232 38,919 39,297 304,090
Loans and advances: 342,459 348,613 1,209,513 23,126 27,907 34,776 1,986,394
- to banks 40,371 5,139 9,845 - - 2,953 58,308
- to customers 302,088 343,474 1,199,668 23,126 27,907 17,513 1,913,776
- advances - - - - - 14,310 14,310
Good will - - - - - 905 905
Property, plant and equipment - - - - - 27,567 27,567
Investment property - - - - - 6,445 6,445
Intangible assets - - - - - 4,337 4,337
Income tax assets: - - - - - 5,244 5,244
- current income tax - - - - - 3,229 3,229
- deferred income tax - - - - - 2,015 2,015
Other assets - - - - - 10,491 10,491
total assets 370,041 360,630 1,269,205 165,358 80,853 129,346 2,375,433
LIABILITIES
Liabilities to Central Bank 201,750 - - - - - 201,750
Financial instruments held for trading: - 35 136 - - 13 184
- derivative financial instruments - 35 136 - - 13 184
Liabilities carried at amortised cost: 1,000,194 285,033 474,450 96,270 3,076 21,252 1,880,275
- deposits from banks 9,190 - 66,169 - - - 75,359
- due to customers 892,174 187,334 346,566 78,151 3,076 - 1,507,301
- other borrowed funds from banks 98,823 97,694 55,694 18,000 - - 270,211
- other borrowed funds from other customers 7 5 6,021 119 - 375 6,527
- other financial liabilities - - - - - 20,877 20,877
Derivatives-Hedge accounting - 1,573 - - - - 1,573
Provisions: - - - - - 11,454 11,454
- provisions for liabilities and charges - - - - - 8,202 8,202
- retirement benefit obligations - - - - - 3,252 3,252
Income tax liabilities: - - - - - 64 64
- current income tax - - - - - 64 64
Other liabilities - - - - - 1,567 1,567
total liabilities 1,201,944 286,641 474,586 96,270 3,076 34,350 2,096,867
total interest repricing gap (831,903) 73,989 794,619 69,088 77,777
As at 31 December 2011up to 1 month 1-3 months
3-12 months 1-5 years
Over 5 years
non-inter-est bearing total
Total assets 346,652 401,808 1,194,580 148,735 92,850 124,119 2,308,744
Total liabilities 1,191,791 525,349 266,075 7,347 62 48,336 2,038,960
total interest repricing gap (845,139) (123,541) 928,505 141,388 92,788
Banka Koper annual report 2012 • financial statements 97

Sensitivity of net interest income of the Group on 100 b.p. parallel shift of yield curve as of 31. 12. 2012 (mln EUR)
+50 b.p. +100 b.p. -50 b.p. -100 b.p.
Sight term total Sight term total Sight term total Sight term total
total 0.21 2.06 2.27 0.42 4.14 4.56 (0.26) (1.89) (2.15) (0.27) (1.99) (2.26)
Asset 0.73 6.8 7.53 1.47 13.60 15.07 (0.51) (5.46) (5.97) (0.52) (5.61) (6.13)
Sight Loans 0.73 - 0.73 1.47 - 1.47 (0.51) - (0.51) (0.52) - (0.52)
Securities
FX - 0.15 0.15 - 0.31 0.31 - (0.13) (0.13) - (0.13) (0.13)
FL - 0.1 0.1 - 0.21 0.21 - (0.08) (0.08) - (0.08) (0.08)
Loans
FX - 0.29 0.29 - 0.58 0.58 - (0.25) (0.25) - (0.29) (0.29)
FL - 6.26 6.26 - 12.5 12.5 - (5) (5) - (5.11) (5.11)
Other Financial Assets
FX
FL
liabili-ties (0.52) (4.59) (5.11) (1.05) (9.16) (10.21) 0.25 3.5 3.75 0.25 3.57 3.82
Sight Deposits (0.52) - (0.52) (1.05) - - 0.25 - 0.25 0.25 - 0.25
Securities Issued
FX
FL
Debts
FX - (2.81) (2.81) - (5.61) (5.61) - 2.23 2.23 - 2.26 2.26
FL - (1.78) (1.78) - (3.55) (3.55) - 1.27 1.27 - 1.31 1.31
Other Financial Liabilities
FX
FL
Deriva-tives - (0.15) (0.15) - (0.3) (0.3) - 0.07 0.07 - 0.05 0.05
The sensitivity of net interest income on 100 b.p. interest rate equalled in increase/decrease of profit 2012 as follows:
• 50 b.p. increase: 2,3 mln EUR;• 100 b.p. increase: 4,6 mln EUR;• 50 b.p. decrease: (2,2) mln EUR;• 100 b.p. decrease: (2,3) mln EUR;
The impact of 100 b.p. interest rate shift on net present value of the Group, as of 31. 12. 2012 (mln EUR)
Currency (mln euR) total 0-18m 18m-3Y 3Y-5Y 5Y-10Y 10Y-15Y >15Y
euR (15.33) (1.11) (2.32) (2.93) (5.12) (2.65) (1.20)
uSD 0.04 0.07 (0.01) (0.01) (0.01) - -
CHF (0.11) (0.03) - (0.01) (0.03) (0.02) (0.02)
total Shift (15.40) (1.07) (2.33) (2.95) (5.16) (2.67) (1.22)
limit 8.8
utilization % 164 %
Banka Koper annual report 2012 • financial statements 98
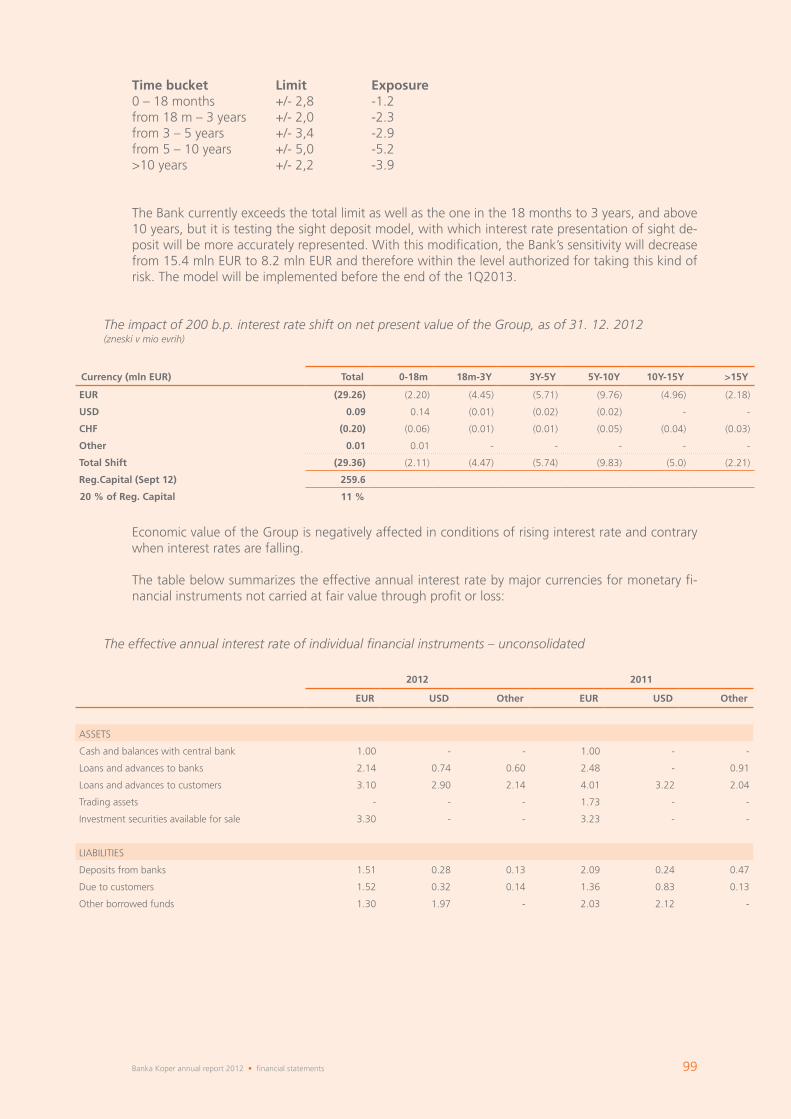
time bucket limit exposure 0 – 18 months +/- 2,8 -1.2 from 18 m – 3 years +/- 2,0 -2.3 from 3 – 5 years +/- 3,4 -2.9 from 5 – 10 years +/- 5,0 -5.2 >10 years +/- 2,2 -3.9
The Bank currently exceeds the total limit as well as the one in the 18 months to 3 years, and above 10 years, but it is testing the sight deposit model, with which interest rate presentation of sight de-posit will be more accurately represented. With this modification, the Bank’s sensitivity will decrease from 15.4 mln EUR to 8.2 mln EUR and therefore within the level authorized for taking this kind of risk. The model will be implemented before the end of the 1Q2013.
The impact of 200 b.p. interest rate shift on net present value of the Group, as of 31. 12. 2012 (zneski v mio evrih)
Currency (mln euR) total 0-18m 18m-3Y 3Y-5Y 5Y-10Y 10Y-15Y >15Y
euR (29.26) (2.20) (4.45) (5.71) (9.76) (4.96) (2.18)
uSD 0.09 0.14 (0.01) (0.02) (0.02) - -
CHF (0.20) (0.06) (0.01) (0.01) (0.05) (0.04) (0.03)
other 0.01 0.01 - - - - -
total Shift (29.36) (2.11) (4.47) (5.74) (9.83) (5.0) (2.21)
Reg.Capital (Sept 12) 259.6
20 % of Reg. Capital 11 %
Economic value of the Group is negatively affected in conditions of rising interest rate and contrary when interest rates are falling.
The table below summarizes the effective annual interest rate by major currencies for monetary fi-nancial instruments not carried at fair value through profit or loss:
The effective annual interest rate of individual financial instruments – unconsolidated
2012 2011
euR uSD other euR uSD other
ASSETS
Cash and balances with central bank 1.00 - - 1.00 - -
Loans and advances to banks 2.14 0.74 0.60 2.48 - 0.91
Loans and advances to customers 3.10 2.90 2.14 4.01 3.22 2.04
Trading assets - - - 1.73 - -
Investment securities available for sale 3.30 - - 3.23 - -
LIABILITIES
Deposits from banks 1.51 0.28 0.13 2.09 0.24 0.47
Due to customers 1.52 0.32 0.14 1.36 0.83 0.13
Other borrowed funds 1.30 1.97 - 2.03 2.12 -
Banka Koper annual report 2012 • financial statements 99

3.8 Operational risk
Operational risk is the risk of incurring losses in the event of inadequate, improper or inefficient im-plementation of internal processes, conduct of people, functioning of systems or external events. An integral part of operational risk is legal risk, which is a loss arising from the uncertainty of legal pro-ceedings and defected legal documentation, as well as compliance risk, which is the risk of the failure to comply with laws, rules, regulations, agreements and practices. Similar to the regulatory definition, strategic risk and reputational risk are not included in this framework and are managed separately.
The objective of operational risk management is to:
• Protect assets, preserve and safeguard material and the intellectual component of the Group’s assets.
• Control and proactively monitor processes in a way that significant risks are identified without delay.
• Observe and comply with processes and conform with internal and external rules.
The process of operational risk management is performed through the identification, measurement or evaluation, management and monitoring of operational risk. The process of operational risk meas-urement and management is supported by the IT system, developed by the Parent company, which sustains the following operational risk approaches:• Loss data collection,• Business environment evaluation,• Scenario analysis,• Mitigation actions management,• Informing about findings related to operational losses in the Parent company.
A systematic loss collection method enables an immediate analysis of loss event causes and sources, which led to an operational risk loss. This procedure supports the compliance with general opera-tional risk management standards.
The management of operational risk starts at the level of a single operational unit as an actual re-sponsibility of a unit’s head. The process is supplemented with the management of risk at a central-ized level, delegated to the Market and Operational Risk, and Methodology Department, which is in charge of organizing operational risk loss collection and carrying out self-assessments. Self-assess-ment is a method used to estimate risk exposure of the assessed organizational units and the Group, as well as to assess the risk-appetite of the bank.
The effective annual interest rate of individual financial instruments – consolidated
2012 2011
euR uSD other euR uSD other
ASSETS
Cash and balances with central bank 1.00 - - 1.00 - -
Loans and advances to banks 2.14 0.74 0.60 2.48 - 0.91
Loans and advances to customers 3.17 2.90 2.15 4.05 3.22 2.08
Trading assets - - - 1.73 - -
Investment securities available for sale 3.30 - - 3.23 - -
LIABILITIES
Deposits from banks 1.51 0.28 0.13 2.09 0.24 0.47
Due to customers 1.52 0.32 0.14 1.36 0.83 0.13
Other borrowed funds 1.30 1.97 - 2.10 2.12 -
Banka Koper annual report 2012 • financial statements 100

The Risk, Policy and Methodology Department assisted by the Operational risk group, reports on a quarterly basis to the Management Board and proposes remedial measures. In 2011, the Group car-ried out a company-wide self-assessment, focusing on the most important processes. The assessment was prepared according to the methodology developed by the Parent company.
3.9 Fair value of assets and liabilities
Since the credit portfolio with long-term maturity and invariable interest rate over 5 years accounts for merely 0.4 % of the total, we assess that there are no significant differences between the fair value of loans and their balance-sheet value.
Since the Bank or Group practically has no deposits with long-term maturities and fixed interest rates over five years, we assess that there are no significant differences between fair value of loans and their balance-sheet value.
Fair value of assets and liabilities– unconsolidated (all amounts expressed in thousands of EUR)
Banka Koper
2012 2011
Carrying value Fair value
unrecognised gain/loss
Carrying value Fair value
unrecognised gain/loss
ASSETS
Cash and balances with central banks 29,388 29,388 - 35,463 35,463 -
Financial instruments held for trading: 290 290 - 3,318 3,318 -
- trading assets - - - 1,292 1,292 -
- derivative financial instruments 290 290 - 2,026 2,026 -
Financial assets designated at fair value through profit or loss 282 282 - - - -
Investment securities available for sale 304,090 304,090 - 288,218 288,218 -
Loans and advances: 1,941,582 1,941,582 - 1,878,871 1,878,871 -
- to banks 58,308 58,308 - 44,889 44,889 -
- to customers 1,863,839 1,863,839 - 1,824,563 1,824,563 -
- advances 19,435 19,435 - 9,419 9,419 -
Investment in subsidiaries 3,688 3,688 - 3,688 3,688 -
Other assets 888 888 - 1,249 1,249 -
total assets 2,280,208 2,280,208 - 2,210,807 2,210,807 -
LIABILITIES
Liabilities to Central Bank 201,750 201,750 - 150,042 150,042 -
Financial instruments held for trading: 184 184 - 1,135 1,135 -
- derivative financial instruments 184 184 - 1,135 1,135 -
Liabilities carried at amortised cost: 1,823,723 1,823,723 - 1,811,794 1,811,794 -
- deposits from banks 75,359 75,359 - 233,741 233,741 -
- due to customers 1,507,316 1,507,316 - 1,332,896 1,332,896 -
- other borrowed funds from banks 214,170 214,170 - 207,551 207,551 -
- other borrowed funds from other customers 6,527 6,527 - 8,660 8,660 -
- other financial liabilities 20,351 20,351 - 28,946 28,946 -
Derivaitves- hedge accounting 1,573 1,573 - 992 992 -
Other liabilities 1,415 1,415 - 2,207 2,207 -
total liabilities 2,028,645 2,028,645 - 1,966,170 1,966,170 -
Banka Koper annual report 2012 • financial statements 101

Fair value of financial instruments
DerivativesDerivative products are valued by using observable and unobservable valuation inputs.
The observable inputs are used to value interest rate swaps, interest rate caps, structured-deposit embedded option, foreign exchange swaps, forward foreign exchange contracts and interest rate swaps. All derivatives, except for the embedded option, are valued with the support of Kondor+ front-office system. Derivatives are valued with a net present value method, by discounting contrac-tual cash-flows obtained with forward rates.
Interest rate caps are valued with the Black-Scholes approach to calculate the price of the different caplets composing the cap from the value of the forward rates.
Hedge accountingThe market value of derivatives is valued at fair value. In a specific case concerning the issuance of structured deposits the Group wanted to protect against interest rate risk, by swapping the fixed rate payment with a variable rate. Consequently the value of the hedged item is adjusted for gains and losses arising from risk.
Fair value of assets and liabilities – consolidated (all amounts expressed in thousands of EUR)
Consolidated
2012 2011
Carrying value Fair value
unrecognised gain/loss
Carrying value Fair value
unrecognised gain/loss
ASSETS
Cash and balances with central banks 29,388 29,388 - 35,463 35,463 -
Financial instruments held for trading: 290 290 - 3,318 3,318 -
- trading assets - - - 1,292 1,292 -
- derivative financial instruments 290 290 - 2,026 2,026 -
Financial assets designated at fair value through profit or loss 282 282 - - - -
Investment securities available for sale 304,090 304,090 - 288,218 288,218 -
Loans and advances: 1,986,394 1,986,394 - 1,938,636 1,938,636 -
- to banks 58,308 58,308 - 44,889 44,889 -
- to customers 1,913,776 1,913,776 - 1,883,362 1,883,362 -
- advances 14,310 14,310 - 10,385 10,385 -
Goodwill 905 905 - 905 905 -
Other assets 10,491 10,491 - 1,489 1,489 -
total assets 2,331,840 2,331,840 - 2,268,029 2,268,029 -
LIABILITIES
Liabilities to Central Bank 201,750 201,750 - 150,042 150,042 -
Financial instruments held for trading: 184 184 - 1,135 1,135 -
- derivative financial instruments 184 184 - 1,135 1,135 -
Liabilities carried at amortised cost: 1,880,275 1,880,275 - 1,868,606 1,868,606 -
- deposits from banks 75,359 75,359 - 233,741 233,741 -
- due to customers 1,507,301 1,507,301 - 1,332,894 1,332,894 -
- other borrowed funds from banks 270,211 270,211 - 263,636 263,636 -
- other borrowed funds from other customers 6,527 6,527 - 8,660 8,660 -
- other financial liabilities 20,877 20,877 - 29,675 29,675 -
Derivatives-hedge accounting 1,573 1,573 - 992 992 -
Other liabilities 1,567 1,567 - 2,510 2,510 -
total liabilities 2,085,349 2,085,349 - 2,023,285 2,023,285 -
Banka Koper annual report 2012 • financial statements 102

Available for sale financial instruments The bank evaluates the financial instruments at fair value. Shares that are listed on an active market are valued based on their market price, whereby for equities which are not listed, the fair value is determined according to internal valuation model. Fair value of shares which are not listed on an ac-tive market, are determined in accordance with Comparable stock-exchange pricing model. Shares, which are actually quoted on the Ljubljana Stock Exchange, but do not meet the liquidity criteria for shares classified into auction trading are valuated in accordance with Comparable stock-exchange pricing model or book value model. The effect of the valuations for the above mentioned shares as at 31.12.2012 amounted to 3,535.
In accordance with the assumption that comparable companies are priced similarly, the value of the estimated company can be determined based on the comparison of market prices of shares and market multiples of comparable companies listed on the stock exchange. The model can be applied if at least two comparable companies exist and are listed. As comparable companies are consider those that are listed on a regulated market and are also comparable across most of the following characteristics:
• Industry;• Market Capitalization;• Size of Capital;• Geographical location of business.
Information of financial ratios for comparable companies has to be obtained from independent sources such as the Ljubljana Stock Exchange, Reuters, etc.
The Value of comparable companies are based on the following financial ratios and market multiples:
• EV/S (enterprise value / sales);• EV/EBITDA (enterprise value / EBIT + depreciation);• P/E (price to earnings);• P/BV (price / book value);
The bases for making estimates are the financial statements:
• Balance Sheet (last 3 financial years);• Income Statement (last 3 financial years).
The final evaluation value of a company is calculated as the average of the values obtained from the individual multiples.
If one of the multiples is inadequate for the assessment of a specific share, it is not included in the calculation.
Banka Koper annual report 2012 • financial statements 103

Split of financial instrument measured at fair value to fair value hierarchy levels – unconsolidated and consolidated (all amounts expressed in thousands of EUR)
2012 2011
level 1 level 2 level 3 total level 1 level 2 level 3 total
ASSET
Derivatives - 290 - 290 - 2,026 - 2,026
HFT: - - - - 1,249 43 - 1,292
- debt - - - - 1,218 - - 1,218
- equities - - - - 31 43 - 74
AFS: 274,174 21,568 2,835 298,577 255,209 3,956 23,553 282,718
- debt 264,793 - - 264,793 243,024 - - 243,024
- equities 9,381 21,568 2,835 33,784 12,185 3,956 23,553 39,694
LIABILITIES
Derivatives - 184 - 184 - 1,135 - 1,135
In 2012 the Bank changed the method of valuation of the capital investment in Pivovarna Laško due to that, a transfer from level 2 to level 3 was done. In previous years the model based on compara-ble market prices in 2012 the valuation changed to model based on book value. According to the method used the sensitivity analysis is not relevant. In 2012 the Bank changed the valuation method of capital investment in Cimos. The valuation based on official appraiser was changed to internal model based on market multiplies, therefore transfer from level 3 to level 2 was done. There were no transfers from level 2 to level 1 in 2012.
Movement of financial instrument included in level 3 – unconsolidated and consolidated (all amounts expressed in thousands of EUR)
At 1 January 2012
purchase/Sales
unrealized gains/loses recorded in
p&l
unrealized gains/loses recorded in revaluation
reserve
Realized gains/loses recorded in
p<ransfers out
of level 3transfers into
level 3
At 31 December
2012
ASSET
AFS equities 23,553 - - - - (23,553) 2,835 2,835
Movement of financial instrument included in level 3 – unconsolidated and consolidated (all amounts expressed in thousands of EUR)
At 1January 2011 purchase/Sales
unrealized gains/loses recorded
in p&l
unrealized gains/loses recorded in revaluation
reserve
Realized gains/loses recorded
in p&lAt 31
December 2011
ASSET
AFS equities 23,553 - - - - 23,553
Banka Koper annual report 2012 • financial statements 104

net InteReSt InCoMe
(all amounts expressed in thousands of EUR)
Banka Koper Consolidated
2012 2011 2012 2011
INTEREST INCOME
Central bank deposits 125 341 125 341
Loans and advances (including finance leases): 72,082 78,336 75,562 81,572
- to banks 805 749 805 749
- to other custumers 71,277 77,587 74,757 80,823
Investment securities (AFS and HTM) 7,382 7,237 7,382 7,237
Investment securities HFT 22 38 22 38
Derivatives – hedge accounting 344 295 344 295
Other - 26 - 26
79,955 86,273 83,435 89,509
INTEREST EXPENSE
Financial liabilities measured at amortised cost 1,708 156 1,708 156
- Deposits from central banks 3,166 4,685 3,166 4,685
Bank deposits and loans 19,660 17,319 19,660 17,319
Other customers 4,595 4,238 5,702 5,649
Other borrowed funds 384 - 384 -
Derivatives - hedge accounting 12 10 12 10
Other 29,525 26,408 30,632 27,819
50,430 59,865 52,803 61,690
DIVIDenD InCoMe
(all amounts expressed in thousands of EUR)
Banka Koper Consolidated
2012 2011 2012 2011
Trading securities 4 2 4 2
Investment securities 1,568 1,036 968 636
1,572 1,038 972 638
05.
04.
Banka Koper annual report 2012 • financial statements 105

net Fee AnD CoMMISSIon InCoMe
(all amounts expressed in thousands of EUR)
Banka Koper Consolidated
2012 2011 2012 2011
FEE AND COMMISSION INCOME
From security trading on behalf of customers 79 107 79 107
From current account management 3,384 3,401 3,384 3,401
From payment services 10,725 10,817 10,725 10,817
From credit card business 8,430 8,168 8,430 8,168
From interbanking operations 8,122 8,763 8,122 8,763
From loans granted 4,844 4,906 4,844 4,906
From guaranties given 1,815 1,299 1,815 1,299
From safes renting 22 20 22 20
From pension fund management 618 623 618 623
Custody services 538 530 538 530
From payment systems management 1,792 1,802 1,792 1,802
From brokering of loans and insurance contract on behalf of others 77 20 767 452
40,446 40,456 41,136 40,888
FEE AND COMMISSION EXPENSE
From security trading 132 123 132 123
From loan brokerage on behalf of others 212 114 212 114
From custody services 161 160 161 160
From credit card processing 9,591 9,042 9,591 9,042
From payment transactions 3,356 2,864 3,356 2,864
Commitment fee for unused credit lines 2,359 1,212 2,396 1,247
15,811 13,515 15,848 13,550
24,635 26,941 25,288 27,338
GAInS leSS loSSeS FRoM FInAnCIAl ASSetS AnD lIABIlItIeS not ReCoGnISeD At FAIR VAlue tHRouGH pRoFIt AnD loSS
(all amounts expressed in thousands of EUR)
Banka Koper Consolidated
2012 2011 2012 2011
Loss/income due to sale of investment securities* 291 1,750 291 1,750
Write offs of loans and other assets (1,408) (447) (1,408) (447)
Recoveries from write offs of loans and other assets 410 192 410 192
Losses from financial liabilities measured at amortised cost (189) - (189) -
(896) 1,495 (896) 1,495
* As realized revaluation reserve EUR 268 thousands (2011: EUR 1,649 thousands).
06.
07.
Banka Koper annual report 2012 • financial statements 106

GAInS leSS loSSeS FRoM FInAnCIAl ASSetS AnD lIABIlItIeS HelD FoR tRADInG
(all amounts expressed in thousands of EUR)
Banka Koper Consolidated
2012 2011 2012 2011
Trading of derivatives (403) 1,076 (403) 1,076
Currency trading 652 635 652 635
Trading of debt securities (2) (46) (2) (46)
Trading of equity securities - (13) - (13)
247 1,652 247 1,652
FAIR VAlue ADJuStMentS In HeDGe ACCountInG
(all amounts expressed in thousands of EUR)
Banka Koper Consolidated
2012 2011 2012 2011
Net effect on derivatives used as hedging instruments 771 512 771 512
Net effect on hedged items (537) (483) (537) (483)
234 29 234 29
GAInS leSS loSSeS on DeReCoGnItIon oF non-CuRRent ASSetS otHeR tHAn HelD FoR SAle
(all amounts expressed in thousands of EUR)
Banka Koper Consolidated
2012 2011 2012 2011
Profit on sale of property and equipment 87 (232) 133 (214)
87 (232) 133 (214)
otHeR opeRAtInG GAInS leSS loSSeS
(all amounts expressed in thousands of EUR)
Banka Koper Consolidated
2012 2011 2012 2011
Rent 1,625 710 2,087 1,301
Taxes (496) (198) (496) (198)
Membership fees (87) (105) (87) (105)
Other operating expenses 1 785 176 870
1,043 1,192 1,680 1,868
11.
10.
09.
08.
Banka Koper annual report 2012 • financial statements 107

(all amounts expressed in thousands of EUR) Banka Koper
2012 2011
up to 1 year 1 to 5 years over 5 years up to 1 year 1 to 5 years over 5 years
670 2,466 2,850 655 2,407 2,780
(all amounts expressed in thousands of EUR) Consolidated
2012 2011
up to 1 year 1 to 5 years over 5 years up to 1 year 1 to 5 years over 5 years
1,162 3,160 2,850 1,287 3,186 2,780
ADMInIStRAtIVe eXpenSeS
(all amounts expressed in thousands of EUR)
Banka Koper Consolidated
2012 2011 2012 2011
Staff cost 26,918 27,937 27,516 28,494
Salaries 18,959 18,953 19,400 19,364
Social security cost 3,019 3,017 3,054 3,088
Pension costs 1,692 1,682 1,750 1,696
Other 3,248 4,285 3,312 4,346
General and administrative expenses 12,475 14,163 12,826 14,486
Material costs 1,646 1,524 1,681 1,545
IT costs 2,296 1,977 2,347 2,022
Rents 1,041 1,192 1,044 1,199
Professional services 5,821 6,240 5,890 6,431
Advertising and marketing 1,099 2,536 1,130 2,561
Cost of consulting, auditing, law and notarial services* 572 694 734 728
39,393 42,100 40,342 42,980
*In this auditor services (all amounts expressed in thousands of EUR)
Banka Koper Consolidated
2012 2011 2012 2011
AUDITOR SERVICES
- financial statements audit 80 90 80 90
- other non-audit services - 7 - 7
80 97 80 97
12.
From rent contracts arises that the future rent revenues amounted to EUR 5,986 thousands (Group EUR 7,253 thousands), as follows:
Banka Koper annual report 2012 • financial statements 108

AMoRtISAtIon AnD DepReCIAtIon
(all amounts expressed in thousands of EUR)
Banka Koper Consolidated
2012 2011 2012 2011
Amortisation 1,775 1,589 1,789 1,590
Depreciation 3,368 3,445 3,829 3,887
5,143 5,034 5,618 5,477
pRoVISIonS
(all amounts expressed in thousands of EUR)
Banka Koper Consolidated
2012 2011 2012 2011
Provisions for off-balance sheet exposures (658) 801 (687) 755
Provisions for National Housing Saving Scheme (252) - (252) -
Provisions for legal proceedings 45 (100) 45 (100)
Retirement and long service bonus (420) (245) (425) (252)
(1,285) 456 (1,319) 403
IMpAIRMent loSSeS
(all amounts expressed in thousands of EUR)
Banka Koper Consolidated
2012 2011 2012 2011
Impairments on of assets measurement at amortised cost:
- loans to other customers 17,614 13,371 18,525 14,102
Impairments on AFS securities (shares) 5,144 8,833 5,144 8,833
- - 83 -
Impairments of other assets 22,758 22,204 23,752 22,935
Impairment losses on AFS securities relate to Pivovarna Laško, Mercator and Abanka.
15.
14.
13.
Banka Koper annual report 2012 • financial statements 109

InCoMe tAX eXpenSe
(all amounts expressed in thousands of EUR)
Banka Koper Consolidated
2012 2011 2012 2011
Current tax 1,987 5,767 2,351 6,066
Deferred tax (note 40) (360) (1,672) (488) (1,819)
1,627 4,095 1,863 4,247
profit before tax 8,812 21,768 9,466 22,183
Further information about deferred income tax is presented in note 40. The tax on the Group’s profit before tax differs from the theoretical amount that would arise using the basic tax rate as follows:
Prima facie tax calculated at a tax rate of 18% 1,586 4,354 1,781 4,505
Income from already taxed released provisions (26) (61) (26) (61)
Income form already taxed dividends (283) (208) (283) (208)
Expenses not deductible for tax purposes:
- negative valuation of securities and derivatives HFT 926 1,767 1,099 1,914
- staff costs not assessable for tax 171 185 171 188
- other non tax deductible expenses 78 101 85 103
- release of deferred tax assets due to disposal of investments and liabilities (57) (59) (57) (59)
-Tax reliefs (408) (312) (419) (316)
Current tax on profit 1,987 5,767 2,351 6,066
Deferred tax (360) (1,672) (488) (1,819)
total income tax 1,627 4,095 1,863 4,247
In accordance with local regulations, the tax authorities may at any time inspect the Bank’s books and records within 5 years subsequent to the reported tax year and may impose additional tax assess-ments and penalties. The Bank’s management is not aware of any circumstances which may give rise to a potential material liability in this respect.
eARnInGS peR SHARe
(all amounts expressed in thousands of EUR)
Banka Koper Consolidated
2012 2011 2012 2011
Net profit for the year 7,185 17,673 7,603 17,936
Weighted average number of ordinary shares in issue 530,398 530,398 530,398 530,398
Basic and diluted profit per share (expressed in EUR per share) 13.55 33.32 14.33 33.82
Basic earnings per share is calculated by dividing the net profit attributable to shareholders by the weighted average number of ordinary shares in issue during the year, excluding the average number of ordinary shares purchased by the Bank and Group and held as treasury shares (961 lots). There are no diluted potential ordinary shares, there are no share options schemes.
17.
16.
Banka Koper annual report 2012 • financial statements 110

InCoMeS AnD eXpenSeS ACHIeVeD on FoReIGn MARKetS
The revenues generated by the Bank and Group in foreign markets do not constitute an important part of the Group’s total revenues.
In 2012 and 2011, the Bank or Group realised a significant part of expenses, with regards to funding granted by Intesa Sanpaolo Group banks, in foreign markets (note 48).
CASH AnD BAlAnCeS WItH CentRAl BAnKS
(all amounts expressed in thousands of EUR)
Banka Koper Consolidated
2012 2011 2012 2011
Cash in hand 17,543 14,925 17,543 14,925
Balances with central banks 11,845 20,538 11,845 20,538
29,388 35,463 29,388 35,463
From this: mandatory reserve liability to central banks 14,027 26,862 14,027 26,862
The Bank is required to maintain a mandatory reserve with the central bank (Bank of Slovenia), rela-tive to the volume and structure of its customer deposits. The current requirement of the Bank of Slovenia regarding the calculation of the amount to be held as mandatory reserve is 1 % of time deposits and debt securities with maturities up to two years. The Bank maintains sufficient liquid assets to fully comply with central bank requirements.
tRADInG ASSetS
(all amounts expressed in thousands of EUR)
Banka Koper Consolidated
2012 2011 2012 2011
Debt securities - 1,217 - 1,217
Equity securities:
- listed - 32 - 32
- unlisted - 43 - 43
- 1,292 - 1,292
As at 31 December 2012 and 31 December 2011 there were no trading assets pledged.
20.
19.
18.
Banka Koper annual report 2012 • financial statements 111

DeRIVAtIVe FInAnCIAl InStRuMentS AnD tRADInG lIABIlItIeS (BAnKA KopeR AnD ConSolIDAteD)
The Bank uses FX swaps mainly for foreign exchange management purposes, and in smaller volumes, FX swaps are offered as a banking service to its customers.
The Banking group concludes Interest rate swaps (IRS) above all to protect the bank’s interest income and then as a standardized offer to its clients. The IRSs are determined so that the reprising dates are in line with the mentioned interest rate swaps.
In 2011 and 2012, Banka Koper offered 5 issues of structured deposit in the amount of 32.7 million EUR, with the original maturity of 4 years and 2 and a half. Interest paid on these deposits is a com-bination of fixed interest rate of:
• 5 % in the first year (valid for 1-3 issue) and,• 6 % in the first 6 months (valid for 4 and 5 issue), and• variable interest rate applied in the following 3 or 2 years. Consequently, the return in the last
3 or 2 years depends on the movement of the reference interest rate EURIBOR 6M: • as for the first and second issue: if the EURIBOR 6M ranges from 1.28% to 5%, the interest
rate is 4.25% per year• as for the third issue: if the EURIBOR 6M ranges from 1.5 % to 5 %, the interest rate is
5.1 % per year• as for the fourth issue: if the EURIBOR 6M ranges from 1 % to 3.5%, the interest rate is 5 %
per year• as for the fifth issue: if the EURIBOR 6M ranges from 1 % to 3.5 %, the interest rate is 5.2 %
per year
However, during the period the EURIBOR 6M does not comply with these conditions the deposit yields 0 %.
The bank has broken down the above mentioned instrument into two parts. The first part consists of the deposit valued at its repayment value bearing a fixed interest rate, whereas the second part con-sists of the sold option to depositors, which is linked to the above mentioned movement of Euribor 6M interest rate.
In order to avoid interest rate risk, Banka Koper protected these positions by acquiring an interest rate option at same conditions as the issued one and by making an interest rate swap agreement (IRS) in the amount of structured deposits to hedge the fair value of underlying deposits. Due to the effectiveness test of changes in the hedging instrument’s fair value and changes in the hedged item’s fair value hedge accounting is used.
The notional amounts of certain types of financial instruments provide a basis for comparison with instruments recognised on the statement of financial position but do not necessarily indicate the amounts of future cash flows involved or the current fair value of the instruments and, therefore, do not indicate the Bank’s exposure to credit or price risks. The derivative instruments become favour-able (assets) or unfavourable (liabilities) as a result of fluctuations in market price, market interest rates or foreign exchange rates relative to their terms. The aggregate contractual or notional amount of derivative financial instruments on hand, the extent to which instruments are favourable or unfa-vourable, and thus the aggregate fair values of derivative financial assets and liabilities can fluctuate significantly from time to time. The fair values of derivative instruments held are set out in the fol-lowing table:
21.
Banka Koper annual report 2012 • financial statements 112
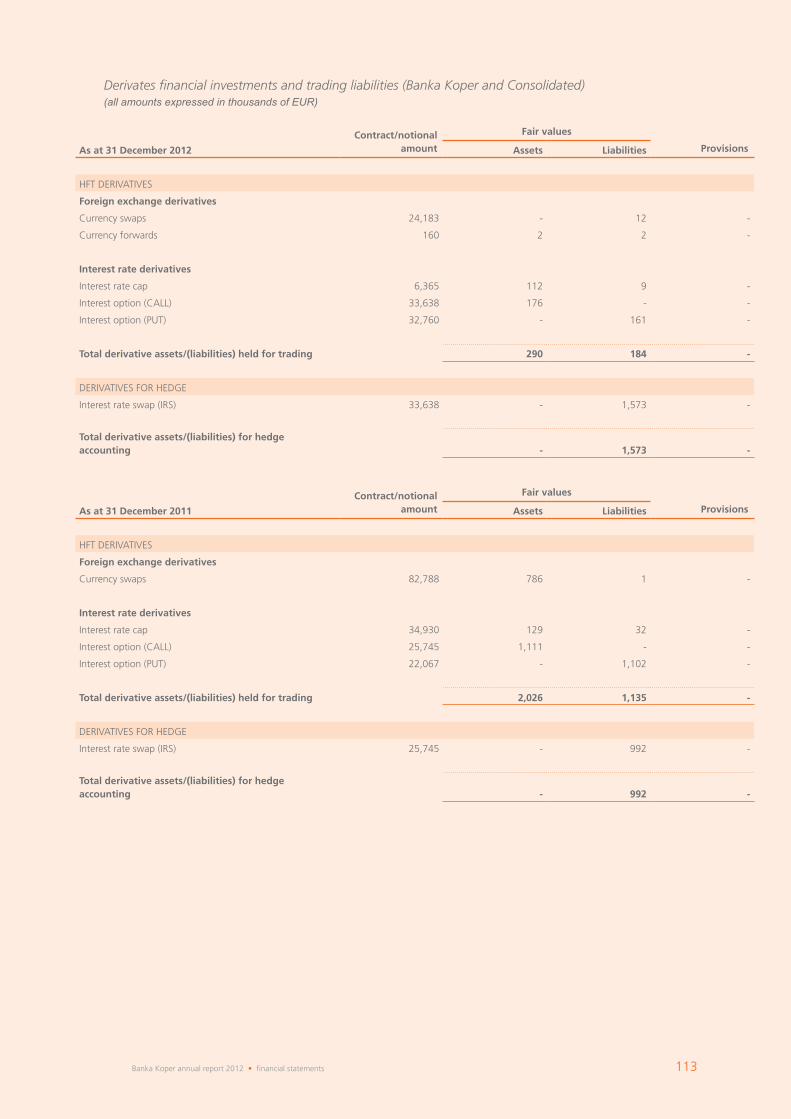
Contract/notional amount
Fair values
provisionsAs at 31 December 2012 Assets liabilities
HFT DERIVATIVES
Foreign exchange derivatives
Currency swaps 24,183 - 12 -
Currency forwards 160 2 2 -
Interest rate derivatives
Interest rate cap 6,365 112 9 -
Interest option (CALL) 33,638 176 - -
Interest option (PUT) 32,760 - 161 -
total derivative assets/(liabilities) held for trading 290 184 -
DERIVATIVES FOR HEDGE
Interest rate swap (IRS) 33,638 - 1,573 -
total derivative assets/(liabilities) for hedgeaccounting - 1,573 -
Contract/notional amount
Fair values
provisionsAs at 31 December 2011 Assets liabilities
HFT DERIVATIVES
Foreign exchange derivatives
Currency swaps 82,788 786 1 -
Interest rate derivatives
Interest rate cap 34,930 129 32 -
Interest option (CALL) 25,745 1,111 - -
Interest option (PUT) 22,067 - 1,102 -
total derivative assets/(liabilities) held for trading 2,026 1,135 -
DERIVATIVES FOR HEDGE
Interest rate swap (IRS) 25,745 - 992 -
total derivative assets/(liabilities) for hedgeaccounting - 992 -
Derivates financial investments and trading liabilities (Banka Koper and Consolidated)(all amounts expressed in thousands of EUR)
Banka Koper annual report 2012 • financial statements 113

InVeStMent SeCuRItIeS (AVAIlABle FoR SAle AnD HelD to MAtuRItY SeCuRItIeS)
(all amounts expressed in thousands of EUR)
Banka Koper Consolidated
2012 2011 2012 2011
GOVERNMENT SECURITIES:
- listed 216,879 165,711 216,879 165,711
OTHER DEBT SECURITIES:
- listed 47,914 77,313 47,914 77,313
EQUITY SECURITIES:
- listed 17,465 15,989 17,465 15,989
- unlisted 21,832 29,205 21,832 29,205
total securities available for sale 304,090 288,218 304,090 288,218
The Bank and Group adopted its own valuation model in cases where investments are not listed or measures such investments at cost less impairments. At the end of 2012 pledged securities amounted to EUR 201,746 thousands (2011: EUR 150,033 thousands).
(all amounts expressed in thousands of EUR)
Banka Koper and consolidated
2012 2011
AFS HtM AFS HtM
At beginning of the year 288,218 - 312,977 316
Additions 59,660 - 67,081 -
Impairment (5,144) - (8,833) -
Interest accrual 8,074 - 7,542 -
Expired coupons (6,456) - (7,366) -
Disposals (sale and redemption) (47,931) - (69,972) (316)
Gains/losses from changes in fair value 7,669 - (13,211) -
At end of year 304,090 - 288,218 -
loAnS AnD ADVAnCeS to BAnKS
(all amounts expressed in thousands of EUR)
Banka Koper Consolidated
2012 2011 2012 2011
Items in course of collection from other banks 2,953 6,383 2,953 6,383
Placements with other banks 55,355 38,506 55,355 38,506
58,308 44,889 58,308 44,889
23.
22.
Banka Koper annual report 2012 • financial statements 114

As at 31 December 2012 no placements with other banks are shown under Pledged assets (2011: nil).
loAnS AnD ADVAnCeS to CuStoMeRS
(all amounts expressed in thousands of EUR)
Banka Koper Consolidated
2012 2011 2012 2011
Loans to individuals: 563,096 534,660 574,103 545,006
- Overdrafts 42,864 42,706 42,864 42,706
- Credit cards 22,072 23,755 22,072 23,755
- Term loans 127,838 128,978 127,838 128,978
- Mortgages 370,322 339,221 370,322 339,221
- Finance leases - - 11,007 10,346
Loans to sole proprietors 70,735 72,986 81,792 82,299
Loans to corporate entities 1,357,332 1,336,840 1,387,653 1,377,740
Gross loans and advances 1,991,163 1,944,486 2,043,548 2,005,045
Less provision for impairment (127,324) (119,923) (129,772) (121,683)
net loans and advances 1,863,839 1,824,563 1,913,776 1,883,362
Movement of provisions for impairment losses on loans and advances to retail customers as follows - unconsolidated:(all amounts expressed in thousands of EUR)
loans to individuals – Banka Koper
overdrafts Credit cards term loans Mortgages
total loans to individuals –Banka Koper
As at 31 December 2010 3,023 29 4,598 3,842 11,492
Provision for loan impairment 2,368 1,125 5,377 7,326 16,196
Amounts recovered during the year (2,530) (309) (5,269) (6,660) (14,768)
Included in statement of income (162) 816 108 666 1,428
Write off provisions already made (797) - (914) (710) (2,421)
As at 31 December 2011 2,064 845 3,792 3,798 10,499
Provision for loan impairment 976 1,354 5,525 8,341 16,196
Amounts recovered during the year (571) (918) (5,784) (8,857) (16,130)
Included in statement of income 405 436 (259) (516) 66
Write off provisions already made (260) - (141) - (401)
As at 31 December 2012 2,209 1,281 3,392 3,282 10,164
24.
Banka Koper annual report 2012 • financial statements 115

Movement of provisions for impairment losses on loans and advances to retail customers as follows - consolidated:(all amounts expressed in thousands of EUR)
loans to individuals – Consolidated
overdrafts Credit cards term loans Mortgages Finance leases
total loans to individuals - Consolidated
As at 31 December 2010 3,023 29 4,598 3,842 271 11,763
Provision for loan impairment 2,368 1,125 5,377 7,326 164 16,360
Amounts recovered during the year (2,530) (309) (5,269) (6,660) (71) (14,839)
Included in statement of income (162) 816 108 666 93 1,521
Write off provisions already made (797) - (914) (710) (54) (2,475)
As at 31 December 2011 2,064 845 3,792 3,798 310 10,809
Provision for loan impairment 976 1,354 5,525 8,341 198 16,394
Amounts recovered during the year (571) (918) (5,784) (8,857) (73) (16,203)
Included in statement of income 405 436 (259) (516) 125 191
Write off provisions already made (260) - (141) - (56) (457)
As at 31 December 2012 2,209 1,281 3,392 3,282 379 10,543
Movement of provisions for impairment losses on loans and advances to corporate customers as follows – unconsolidated and consolidated(all amounts expressed in thousands of EUR)
Banka Koper Consolidated
Sole proprietors Corporate entities Sole proprietors Corporate entities
As at 31 December 2010 9,971 95,031 10,186 95,675
Provision for loan impairment 9,750 98,191 10,002 98,825
Amounts recovered during the year (7,937) (88,061) (7,979) (88,267)
Included in statement of income 1,813 10,130 2,023 10,558
Write off provisions already made (509) (7,012) (509) (7,059)
As at 31 December 2011 11,275 98,149 11,700 99,174
Provision for loan impairment 6,409 77,781 6,551 79,000
Amounts recovered during the year (7,033) (59,609) (7,100) (60,117)
Included in statement of income (624) 18,172 (549) 18,883
Write off provisions already made (1,465) (8,347) (1,465) (8,514)
As at 31 December 2012 9,186 107,974 9,686 109,543
Banka Koper annual report 2012 • financial statements 116
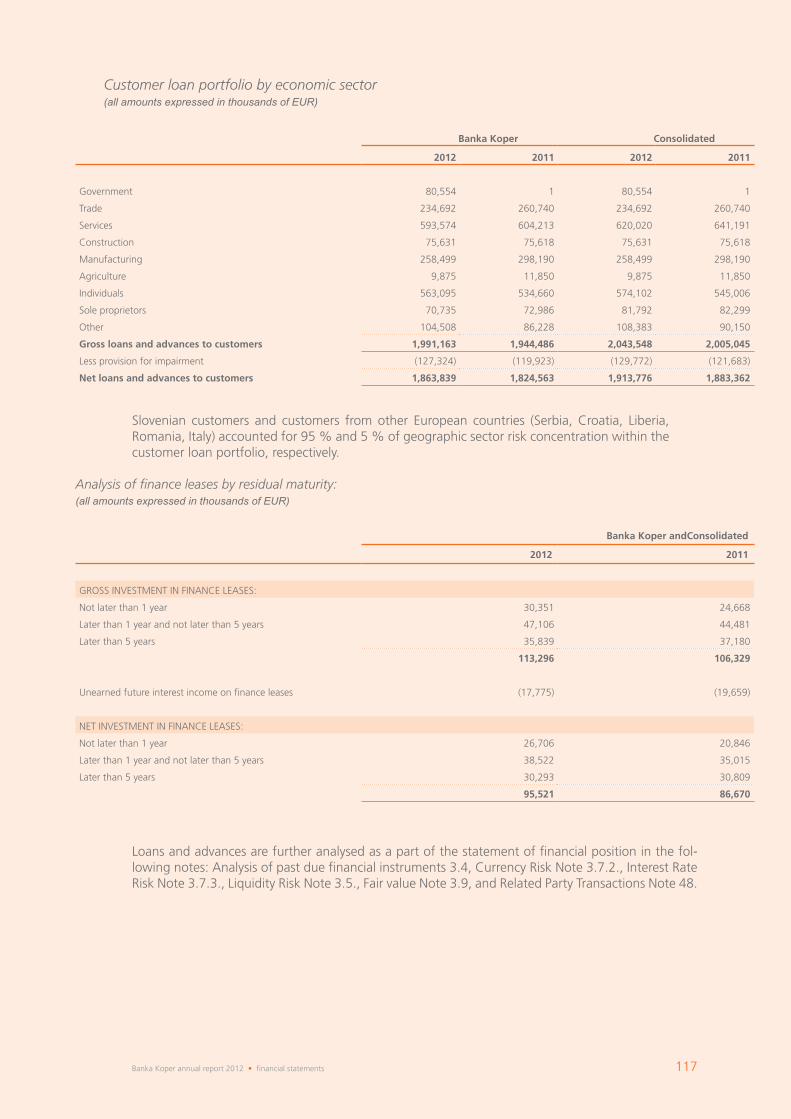
Customer loan portfolio by economic sector(all amounts expressed in thousands of EUR)
Banka Koper Consolidated
2012 2011 2012 2011
Government 80,554 1 80,554 1
Trade 234,692 260,740 234,692 260,740
Services 593,574 604,213 620,020 641,191
Construction 75,631 75,618 75,631 75,618
Manufacturing 258,499 298,190 258,499 298,190
Agriculture 9,875 11,850 9,875 11,850
Individuals 563,095 534,660 574,102 545,006
Sole proprietors 70,735 72,986 81,792 82,299
Other 104,508 86,228 108,383 90,150
Gross loans and advances to customers 1,991,163 1,944,486 2,043,548 2,005,045
Less provision for impairment (127,324) (119,923) (129,772) (121,683)
net loans and advances to customers 1,863,839 1,824,563 1,913,776 1,883,362
Slovenian customers and customers from other European countries (Serbia, Croatia, Liberia, Romania, Italy) accounted for 95 % and 5 % of geographic sector risk concentration within the customer loan portfolio, respectively.
Analysis of finance leases by residual maturity:(all amounts expressed in thousands of EUR)
Banka Koper andConsolidated
2012 2011
GROSS INVESTMENT IN FINANCE LEASES:
Not later than 1 year 30,351 24,668
Later than 1 year and not later than 5 years 47,106 44,481
Later than 5 years 35,839 37,180
113,296 106,329
Unearned future interest income on finance leases (17,775) (19,659)
NET INVESTMENT IN FINANCE LEASES:
Not later than 1 year 26,706 20,846
Later than 1 year and not later than 5 years 38,522 35,015
Later than 5 years 30,293 30,809
95,521 86,670
Loans and advances are further analysed as a part of the statement of financial position in the fol-lowing notes: Analysis of past due financial instruments 3.4, Currency Risk Note 3.7.2., Interest Rate Risk Note 3.7.3., Liquidity Risk Note 3.5., Fair value Note 3.9, and Related Party Transactions Note 48.
Banka Koper annual report 2012 • financial statements 117

ADVAnCeS
(all amounts expressed in thousands of EUR)
Banka Koper Consolidated
2012 2011 2012 2011
Commissions receivables 304 333 304 333
Cheques 5 5 5 5
Receivables 6,905 492 1,975 1,580
Claims to Europay 8,536 7,147 8,536 7,147
Claims to citizens 868 631 868 631
Other 2,817 811 2,817 811
Gross advances 19,435 9,419 14,505 10,507
Impairments - - (195) (122)
net advances 19,435 9,419 14,310 10,385
Movement in provisions for impairment on other assets:(all amounts expressed in thousands of EUR)
Banka Koper Consolidated
As at 31 December 2010 - 127
Additional provision for impairment - 31
Amounts recovered during the year - (33)
Included in income statement - (2)
Write off of impairment - (3)
As at 31 December 2011 - 122
Additional provision for impairment - 111
Amounts recovered during the year - (27)
Included in income statement - 84
Write off of impairment - (11)
As at 31 December 2012 - 195
GooDWIll
(all amounts expressed in thousands of EUR)
Consolidated
2012 2011
opening net book amount 905 905
Acquisition of a subsidiary - -
Impairment - -
Closing net book amount 905 905
25.
26.
Banka Koper annual report 2012 • financial statements 118

pRopeRtY, plAnt AnD eQuIpMent
(all amounts expressed in thousands of EUR)
Banka Koper Consolidated
land and buildings
Hardware equipment
other equip-ment
total Banka Koper
land and buildings
Hardware equipment
other equipment
total con-solidated
MOVEMENT IN YEAR 2011
Opening net book amount 22,610 1,024 2,093 25,727 22,610 1,036 3,342 26,988
Transfer to invest-ment property (71) - - (71) (71) - - (71)
Transfer from intangible assets 2,895 - - 2,895 2,895 - - 2,895
Additions 1,472 443 928 2,843 1,472 446 1,932 3,850
Disposals (176) (1) (63) (240) (176) (1) (593) (770)
Depreciation charge (2,066) (621) (682) (3,369) (2,066) (629) (1,116) (3,811)
Closing net book amount 24,664 845 2,276 27,785 24,664 852 3,565 29,081
As at 31 December 2011
Cost 49,726 8,063 11,170 68,959 49,726 8,086 14,633 72,445
Accumulated depre-ciation (25,062) (7,218) (8,894) (41,174) (25,062) (7,234) (11,068) (43,364)
net book amount as at 31 December 2011 24,664 845 2,276 27,785 24,664 852 3,565 29,081
MOVEMENT IN YEAR 2012
Opening net book amount 24,664 845 2,276 27,785 24,664 852 3,565 29,081
Additions 605 827 419 1,851 605 832 1,076 2,513
Disposals - (1) (7) (8) - (1) (309) (310)
Depreciation charge (2,088) (467) (740) (3,295) (2,088) (474) (1,155) (3,717)
Closing net book amount 23,181 1,204 1,948 26,333 23,181 1,209 3,177 27,567
As at 31 December 2012
Cost 50,331 7,165 11,343 68,839 50,331 7,193 13,349 70,873
Accumulated depre-ciation (27,150) (5,961) (9,395) (42,506) (27,150) (5,984) (10,172) (43,306)
net book amount as at 31 December 2012 23,181 1,204 1,948 26,333 23,181 1,209 3,177 27,567
In 2012 there was no property, plant and equipment pledged (2011; nil).
In addition to its own premises, the Bank or Group hired premises at 35 locations. Future minimum lease payments under lease contracts amount to EUR 5,570 thousand, of this:
(all amounts expressed in thousands of EUR)
27.
Banka Koper annual report 2012 • financial statements 119

InVeStMent pRopeRtY
For Investment Property there are no special restrictions in terms of duration and use.
On 31st December 2012 no stipulated contracts for the acquisition or construction of Investment Property are in place in Banka Koper or Group. No substantial investments in the repair, maintenance or expansion of these investments are planned in 2013.
In the item other operating gains and losses (see note 10) income from property investments carries rents of EUR 80 thousand (2011: EUR 90 thousand), Group of EUR 312 thousand (2011: 90 EUR thousand). In 2012, Bank`s maintenance costs for from property investments amounted to EUR 1 thousands, the respective amounted on Group level amounted to EUR 46 thousands (2011: EUR 3 thousands).
Fair value of investment property is disclosed under chapter 3.9. Fair value of assets and liabilities.
Movement of investment property (all amounts expressed in thousands of EUR)
Banka Koper Consolidated
2012 2011 2012 2011
At beginning of the year 1,112 940 1,112 940
Depreciation (73) (76) (112) (76)
Transfer to fixed assets - 71 - 71
Additions 102 464 5,558 464
Disposals (113) (287) (113) (287)
At end of year 1,028 1,112 6,445 1,112
Banka Koper and Consolidated
2012 2011
Up to 1 year 1 to 5 years Over 5 years Up to 1 year 1 to 5 years Over 5 years
557 2,228 2,785 559 2,236 2,795
28.
Banka Koper annual report 2012 • financial statements 120

IntAnGIBle ASSetS
The Bank and Group have not pledged any intangible fixed assets.
The Bank or Group has evidence of future contractual obligations for the acquisition of intangible long term assets of EUR 375 thousand for the acquisition of the AMEX licence.
The Bank or Group does not have any intangible fixed assets in management. In 2012, the Bank or Group has not recognized any expenditure related to research and development in the statement of income. All development expenditure in 2012 was capitalized as intangible fixed assets, out of which staff expenses amounted to EUR 528 thousand.
(all amounts expressed in thousands of EUR)
Banka Koper Consolidated
Develop-ment licenses
Software and other
total Banka Koper
De-velop-ment licenses
Software and other
total consoli-dated
MOVEMENT IN YEAR 2011
Opening net book amount 2,013 457 3,175 5,645 2,013 457 3,176 5,646
Transfer to tangible assets - - (2,895) (2,895) - - (2,895) (2,895)
Additions 1,329 691 1,048 3,068 1,329 691 1,049 3,069
Disposals - - - - - - - -
Amortisation (1,025) (265) (299) (1,589) (1,025) (265) (300) (1,590)
Closing net book amount 2,317 883 1,029 4,229 2,317 883 1,030 4,230
As at 31 December 2011
Cost 8,556 2,839 3,754 15,149 8,556 2,845 3,761 15,162
Accumulated amortisation (6,239) (1,956) (2,725) (10,920) (6,239) (1,962) (2,731) (10,932)
net book amount as at 31 December 2011 2,317 883 1,029 4,229 2,317 883 1,030 4,230
MOVEMENT IN YEAR 2012
Opening net book amount 2,317 883 1,029 4,229 2,317 883 1,030 4,230
Additions 1,444 214 124 1,782 1,444 326 126 1,896
Disposals - - - - - - - -
Amortisation (1,077) (279) (419) (1,775) (1,077) (292) (420) (1,789)
Closing net book amount 2,684 818 734 4,236 2,684 917 736 4,337
As at 31 December 2012
Cost 10,000 3,022 3,770 16,792 10,000 3,140 3,777 16,917
Accumulated amortisation (7,316) (2,204) (3,036) (12,556) (7,316) (2,223) (3,041) (12,580)
net book amount as at 31 December 2012 2,684 818 734 4,236 2,684 917 736 4,337
29.
Banka Koper annual report 2012 • financial statements 121

InVeStMent In SuBSIDIARIeS
In accordance with the project of transferring credit card processing to a single entity within the Intesa Sanpaolo Group, the bank sold its investment in ISP Card d.o.o. Ljubljana to ISP Card d.o.o. Zagreb in March 2010.
(all amounts expressed in thousands of EUR)
Banka Koper
2012 2011
At beginning of the year 3,688 3,688
Additional investment - -
Disposal of a subsidiary - -
Disposal surplus - -
Release of impairment - -
At end of year 3,688 3,688
otHeR ASSetS
(all amounts expressed in thousands of EUR)
Banka Koper Consolidated
2012 2011 2012 2011
Accruals 451 799 456 801
Inventory 19 41 19 41
Taxes and contributions 17 10 533 51
Fixed assets from seized collateral 391 392 9,459 584
Other 10 7 24 12
888 1,249 10,491 1,489
lIABIlItIeS to CentRAl BAnK
(all amounts expressed in thousands of EUR)
Banka Koper Consolidated
2012 2011 2012 2011
Loans granted 201,750 150,042 201,750 150,042
201,750 150,042 201,750 150,042
Due to CuStoMeRS
(all amounts expressed in thousands of EUR)
Banka Koper Consolidated
2012 2011 2012 2011
Demand deposits 881 156 881 156
Term deposits 74,478 233,585 74,478 233,585
75,359 233,741 75,359 233,741
33.
32.
31.
30.
Banka Koper annual report 2012 • financial statements 122
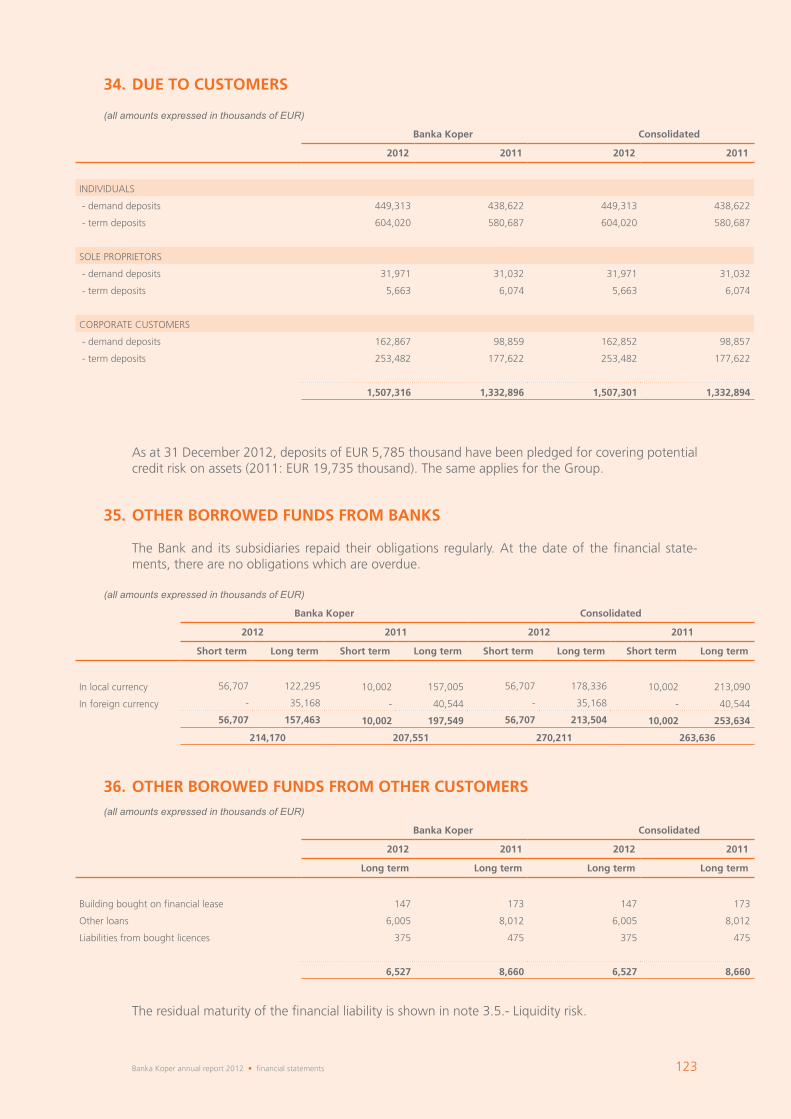
As at 31 December 2012, deposits of EUR 5,785 thousand have been pledged for covering potential credit risk on assets (2011: EUR 19,735 thousand). The same applies for the Group.
Due to CuStoMeRS
(all amounts expressed in thousands of EUR)
Banka Koper Consolidated
2012 2011 2012 2011
INDIVIDUALS
- demand deposits 449,313 438,622 449,313 438,622
- term deposits 604,020 580,687 604,020 580,687
SOLE PROPRIETORS
- demand deposits 31,971 31,032 31,971 31,032
- term deposits 5,663 6,074 5,663 6,074
CORPORATE CUSTOMERS
- demand deposits 162,867 98,859 162,852 98,857
- term deposits 253,482 177,622 253,482 177,622
1,507,316 1,332,896 1,507,301 1,332,894
(all amounts expressed in thousands of EUR)
Banka Koper Consolidated
2012 2011 2012 2011
Short term long term Short term long term Short term long term Short term long term
In local currency 56,707 122,295 10,002 157,005 56,707 178,336 10,002 213,090
In foreign currency - 35,168 - 40,544 - 35,168 - 40,544
56,707 157,463 10,002 197,549 56,707 213,504 10,002 253,634
214,170 207,551 270,211 263,636
otHeR BoRoWeD FunDS FRoM otHeR CuStoMeRS
otHeR BoRRoWeD FunDS FRoM BAnKS
The Bank and its subsidiaries repaid their obligations regularly. At the date of the financial state-ments, there are no obligations which are overdue.
(all amounts expressed in thousands of EUR)
Banka Koper Consolidated
2012 2011 2012 2011
long term long term long term long term
Building bought on financial lease 147 173 147 173
Other loans 6,005 8,012 6,005 8,012
Liabilities from bought licences 375 475 375 475
6,527 8,660 6,527 8,660
The residual maturity of the financial liability is shown in note 3.5.- Liquidity risk.
36.
35.
34.
Banka Koper annual report 2012 • financial statements 123

otHeR FInAnCIAl lIABIlItIeS
(all amounts expressed in thousands of EUR)
Banka Koper Consolidated
2012 2011 2012 2011
Unpaid commissions 184 193 184 754
Liabilities form credit card business 5,374 9,790 5,374 9,843
Not yet process payments 4,770 8,348 4,770 8,393
Unpaid dividend 118 115 118 185
Creditors 3,659 2,662 4,013 2,662
Salaries 1,998 2,031 2,035 2,031
Deferred income 3,739 5,185 3,786 5,185
Other 509 622 597 622
20,351 28,946 20,877 29,675
pRoVISIonS FoR lIABIlItIeS AnD CHARGeS
Provisions for premium pay-back are intended to cover the bank's liabilities raised by the Law on National Housing Saving Scheme. The bank is obliged to pay back to the Housing Fund all premiums, paid to individuals taking part in the scheme, who within 2 years after the end of the saving period do not proceed to take a loan from the bank in line with the law's conditions.
The amount of premiums the bank is obliged to pay back to the Housing Fund is estimated consi-dering the suggestion of the Bank of Slovenia, the historical pay-back patterns and expected future conditions in the housing loan segment. The obligation to pay back premiums in case that savings are not used under eligible purposes, applies to the 2nd, 3rd, 4th and 5th tender. The amount of provisions required as at 31. 12. 2012 amount to EUR 324 thousand. The amount is based on the estimation that 80 % of all saved funds will be used unpurposely.
The Bank or Group also makes credit risk provisions for off-balance sheet items. The above credit risk provisions recorded by Banka Koper or Group refer to contractual commitments for issued guaran-tees and letters of credits and irrevocable contractual commitments for granted, but undrawn loans.
(all amounts expressed in thousands of EUR)
Banka Koper Consolidated
2012 2011 2012 2011
Provisions for off-balance sheet liabilities 7,143 6,492 7,125 6,445
Provisions for National Saving Housing Scheme 324 439 324 439
Provisions for infrastructure arrangements for the disabled - 52 - 52
Legal proceedings due to employees 753 500 753 500
total 8,220 7,483 8,202 7,436
38.
37.
Banka Koper annual report 2012 • financial statements 124

Movement in provisions:(all amounts expressed in thousands of EUR)
Banka Koper Consolidated
2012 2011 2012 2011
At beginning of year 7,483 8,170 7,436 8,077
Additional provision 19,940 15,305 19,940 15,305
Amounts recovered during the year (19,126) (15,987) (19,046) (15,941)
Included in statement of income under provisions 865 (701) 894 (655)
Included in statement of income under staff costs (51) 19 (51) 19
Repayment of the premiums for National Saving Housing Scheme (77) (4) (77) (4)
Investment in facilities for disable people - (1) - (1)
At end of year 8,220 7,483 8,202 7,436
RetIReMent BeneFIt oBlIGAtIonS
(all amounts expressed in thousands of EUR)
Banka Koper Consolidated
2012 2011 2012 2011
Retirement severance pay and long service bonuses 2,918 2,845 3,004 2,926
Provision for redundancies 248 123 248 123
3,166 2,968 3,252 3,049
Movements(all amounts expressed in thousands of EUR)
Banka Koper Consolidated
2012 2011 2012 2011
At beginning of year 2,968 2,998 3,049 3,071
Additional provisions 420 245 425 252
Charged to statement of income 420 245 425 252
Utilised provisions (222) (275) (222) (274)
At end of year 3,166 2,968 3,252 3,049
39.
Banka Koper annual report 2012 • financial statements 125
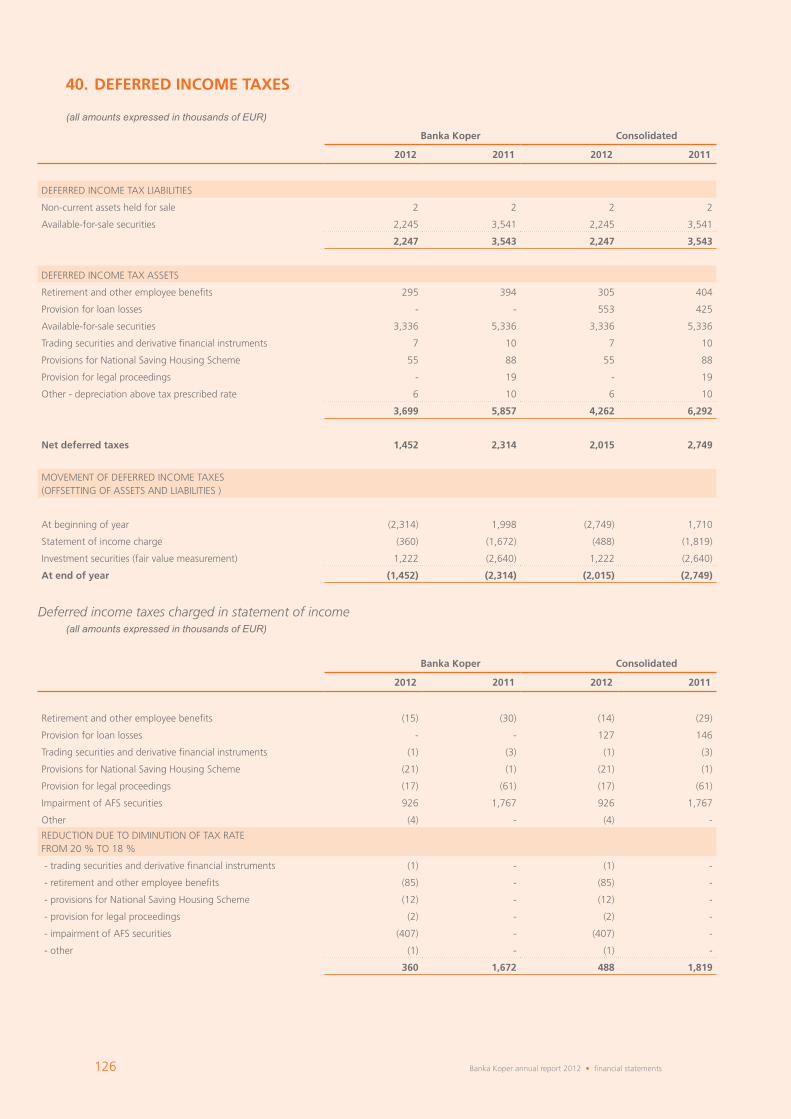
DeFeRReD InCoMe tAXeS
(all amounts expressed in thousands of EUR)
Banka Koper Consolidated
2012 2011 2012 2011
DEFERRED INCOME TAX LIABILITIES
Non-current assets held for sale 2 2 2 2
Available-for-sale securities 2,245 3,541 2,245 3,541
2,247 3,543 2,247 3,543
DEFERRED INCOME TAX ASSETS
Retirement and other employee benefits 295 394 305 404
Provision for loan losses - - 553 425
Available-for-sale securities 3,336 5,336 3,336 5,336
Trading securities and derivative financial instruments 7 10 7 10
Provisions for National Saving Housing Scheme 55 88 55 88
Provision for legal proceedings - 19 - 19
Other - depreciation above tax prescribed rate 6 10 6 10
3,699 5,857 4,262 6,292
net deferred taxes 1,452 2,314 2,015 2,749
MOVEMENT OF DEFERRED INCOME TAXES (OFFSETTING OF ASSETS AND LIABILITIES )
At beginning of year (2,314) 1,998 (2,749) 1,710
Statement of income charge (360) (1,672) (488) (1,819)
Investment securities (fair value measurement) 1,222 (2,640) 1,222 (2,640)
At end of year (1,452) (2,314) (2,015) (2,749)
Deferred income taxes charged in statement of income(all amounts expressed in thousands of EUR)
Banka Koper Consolidated
2012 2011 2012 2011
Retirement and other employee benefits (15) (30) (14) (29)
Provision for loan losses - - 127 146
Trading securities and derivative financial instruments (1) (3) (1) (3)
Provisions for National Saving Housing Scheme (21) (1) (21) (1)
Provision for legal proceedings (17) (61) (17) (61)
Impairment of AFS securities 926 1,767 926 1,767
Other (4) - (4) -
REDUCTION DUE TO DIMINUTION OF TAX RATE FROM 20 % TO 18 %
- trading securities and derivative financial instruments (1) - (1) -
- retirement and other employee benefits (85) - (85) -
- provisions for National Saving Housing Scheme (12) - (12) -
- provision for legal proceedings (2) - (2) -
- impairment of AFS securities (407) - (407) -
- other (1) - (1) -
360 1,672 488 1,819
40.
Banka Koper annual report 2012 • financial statements 126

otHeR lIABIlItIeS
(all amounts expressed in thousands of EUR)
Banka Koper Consolidated
2012 2011 2012 2011
Accruals 260 272 307 397
Prepayments received 406 1,334 406 1,334
Taxes and contributions 749 601 828 692
Other - - 26 87
1,415 2,207 1,567 2,510
SHARe CApItAl
(all amounts expressed in thousands of EUR)
Banka Koper and Consolidated number of shares ordinary shares Share premium treasury shares
As at 31 December 2010 531,359 22,173 7,499 (49)
As at 31 December 2011 531,359 22,173 7,499 (49)
As at 31 December 2012 531,359 22,173 7,499 (49)
The share capital of the Bank is divided into 531,359 no-par shares. Each share has an equal pro-portion in the share capital of the Bank and its participating value in the share capital as well. The proportion of each share in the share capital of the Bank is determined on the basis of the number of the issued shares.
42.
41.
Banka Koper annual report 2012 • financial statements 127

ReVAluAtIon ReSeRVeS
(all amounts expressed in thousands of EUR)
Banka Koper Consolidated
2012 2011 2012 2011
REVALUATION RESERVES
Equity securities 9,308 12,523 9,308 12,523
Debt securities (520) (10,213) (520) (10,213)
total 8,788 2,310 8,788 2,310
Movement – Banka Koper and consolidated(all amounts expressed in thousands of EUR)
Revaluation reserves
As at 31 December 2010 12,878
VALUATION OF AVAILABLE-FOR-SALE SECURITIES
equity securities (1,904)
Valuation (3,363)
Disposals (1,539)
Impairment 2,998
Debt securities (8,664)
Valuation (8,884)
Disposals 220
Impairment -
As at 31 December 2011 2,310
VALUATION OF AVAILABLE-FOR-SALE SECURITIES
equity securities (3,216)
Valuation (7,054)
Disposals (97)
Impairment 3,466
Tax rate changes 469
Debt securities 9,694
Valuation 10,203
Disposals (126)
Tax rate changes (383)
As at 31 December 2012 8,788
43.
Banka Koper annual report 2012 • financial statements 128

ReSeRVeS FRoM pRoFIt AnD RetAIneD eARnInGS
(all amounts expressed in thousands of EUR)
Banka Koper Consolidated
2012 2011 2012 2011
Legal reserves 13,198 12,839 13,198 12,839
Statutory reserves 211,962 211,959 211,962 211,959
Retained earnings 12,835 11,311 14,946 13,004
Treasury share`s reserves 49 49 49 49
total 238,044 236,158 240,155 237,851
Movement – Banka Koper (all amounts expressed in thousands of EUR)
legal reserves
Statutory reserves
Retained earnings
treasury share`s
reserves total re-
serves
As at 31 December 2010 11,955 200,472 11,271 49 223,747
Transfer from net profit for the period 884 11,487 5,302 - 17,673
Dividends - - (5,262) - (5,262)
As at 31 December 2011 12,839 211,959 11,311 49 236,158
Net profit for the financial year - - 7,185 - 7,185
Dividends - - (5,299) - (5,299)
Transfer to statutory reserves - 3 (3) - -
Transfer to legal reserves 359 - (359) - -
As at 31 December 2012 13,198 211,962 12,835 49 238,044
Movement – consolidated (all amounts expressed in thousands of EUR)
legal reserves
Statutory reserves
Retained earnings
treasury share`s
reserves total re-
serves
As at 31 December 2010 11,955 200,472 12,701 49 225,177
Transfer from net profit for the period 884 11,487 5,565 - 17,936
Dividends - - (5,262) - (5,262)
As at 31 December 2011 12,839 211,959 13,004 49 237,851
Net profit for the financial year - - 7,603 - 7,603
Dividends - - (5,299) - (5,299)
Transfer to statutory reserves - 3 (3) - -
Transfer to legal reserves 359 - (359) - -
As at 31 December 2012 13,198 211,962 14,946 49 240,155
44.
Banka Koper annual report 2012 • financial statements 129

legal reservesThe Bank, according to its Statute, creates legal reserves to a level such that the sum of legal reserves and those capital reserves that are added to the legal reserves when the required amount of legal reserves is ascertained equals the double of the share capital of the Bank.
Statutory reservesThe Bank, according to its Statute, creates statutory reserves until they achieve an amount which is fifteen-fold that of the Bank’s registered capital stock. In each financial year, a part of the net profit that remained after any losses carried forward, legal reserves and reserves for own shares have been covered, can be allocated to statutory reserves.
DIVIDenDS peR SHARe
Dividends payable are not accounted for until they have been ratified by the Annual General Meet-ing. By the date the financial statements were authorised by the Management Board no dividends were proposed or declared. For 2011, the Bank disbursed for dividends EUR 5,299 thousand i.e. EUR 9.99 per share.
Distribution of the profit of the year(all amounts expressed in thousands of EUR)
Banka Koper
2012 2011
Net profit for the period 7,185 17,673
Allocation of the profit to the legal reserves (5 %) (359) (884)
Residual net profit available for other reserves or distribution 6,826 16,789
Allocation of the profit to the statutory reserves - (11,487)
Residual net profit available for distribution at the AGM 6,826 5,302
CASH AnD CASH eQuIVAlentS
(all amounts expressed in thousands of EUR)
Banka Koper Consolidated
2012 2011 2012 2011
Cash and balances with central bank 15,361 8,601 15,376 8,603
Trading assets - 1,217 - 1,217
Loans and advances to banks 42,462 23,467 42,462 23,467
total 57,823 33,285 57,383 33,287
46.
45.
Banka Koper annual report 2012 • financial statements 130
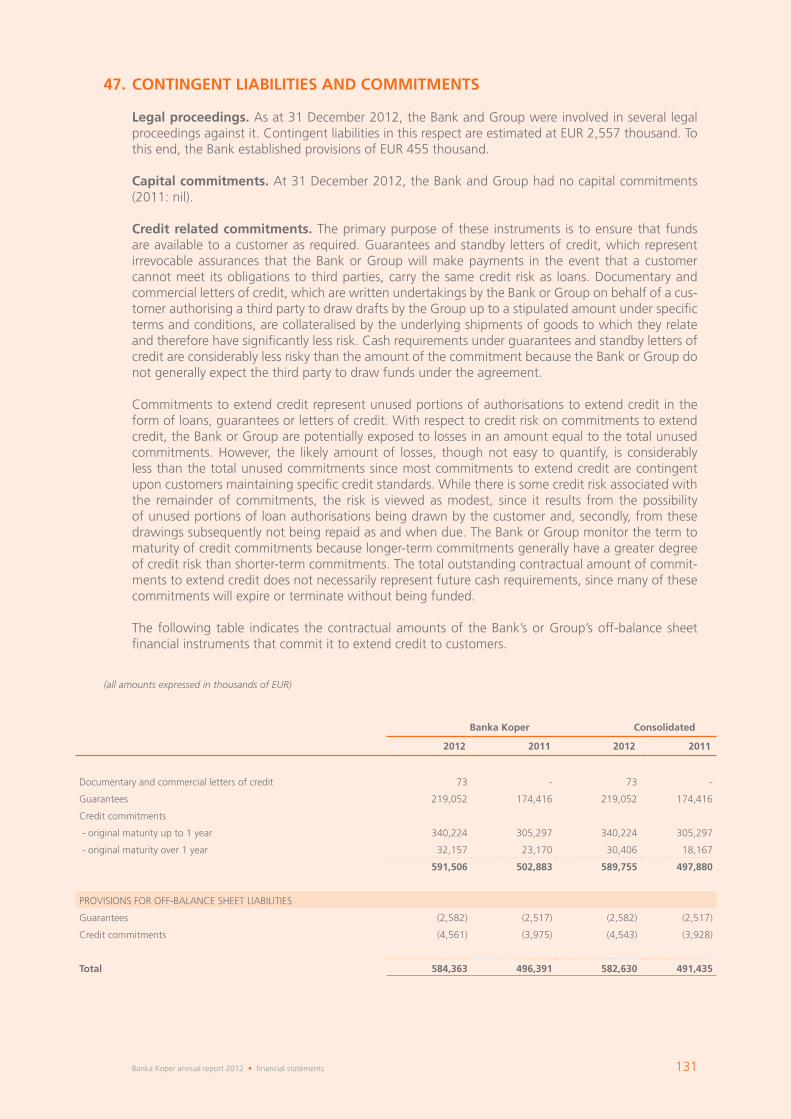
ContInGent lIABIlItIeS AnD CoMMItMentS
legal proceedings. As at 31 December 2012, the Bank and Group were involved in several legal proceedings against it. Contingent liabilities in this respect are estimated at EUR 2,557 thousand. To this end, the Bank established provisions of EUR 455 thousand.
Capital commitments. At 31 December 2012, the Bank and Group had no capital commitments (2011: nil).
Credit related commitments. The primary purpose of these instruments is to ensure that funds are available to a customer as required. Guarantees and standby letters of credit, which represent irrevocable assurances that the Bank or Group will make payments in the event that a customer cannot meet its obligations to third parties, carry the same credit risk as loans. Documentary and commercial letters of credit, which are written undertakings by the Bank or Group on behalf of a cus-tomer authorising a third party to draw drafts by the Group up to a stipulated amount under specific terms and conditions, are collateralised by the underlying shipments of goods to which they relate and therefore have significantly less risk. Cash requirements under guarantees and standby letters of credit are considerably less risky than the amount of the commitment because the Bank or Group do not generally expect the third party to draw funds under the agreement.
Commitments to extend credit represent unused portions of authorisations to extend credit in the form of loans, guarantees or letters of credit. With respect to credit risk on commitments to extend credit, the Bank or Group are potentially exposed to losses in an amount equal to the total unused commitments. However, the likely amount of losses, though not easy to quantify, is considerably less than the total unused commitments since most commitments to extend credit are contingent upon customers maintaining specific credit standards. While there is some credit risk associated with the remainder of commitments, the risk is viewed as modest, since it results from the possibility of unused portions of loan authorisations being drawn by the customer and, secondly, from these drawings subsequently not being repaid as and when due. The Bank or Group monitor the term to maturity of credit commitments because longer-term commitments generally have a greater degree of credit risk than shorter-term commitments. The total outstanding contractual amount of commit-ments to extend credit does not necessarily represent future cash requirements, since many of these commitments will expire or terminate without being funded.
The following table indicates the contractual amounts of the Bank’s or Group’s off-balance sheet financial instruments that commit it to extend credit to customers.
(all amounts expressed in thousands of EUR)
Banka Koper Consolidated
2012 2011 2012 2011
Documentary and commercial letters of credit 73 - 73 -
Guarantees 219,052 174,416 219,052 174,416
Credit commitments
- original maturity up to 1 year 340,224 305,297 340,224 305,297
- original maturity over 1 year 32,157 23,170 30,406 18,167
591,506 502,883 589,755 497,880
PROVISIONS FOR OFF-BALANCE SHEET LIABILITIES
Guarantees (2,582) (2,517) (2,582) (2,517)
Credit commitments (4,561) (3,975) (4,543) (3,928)
total 584,363 496,391 582,630 491,435
47.
Banka Koper annual report 2012 • financial statements 131

RelAteD pARtY tRAnSACtIonS
(all amounts expressed in thousands of EUR)
loansDirectors and
advisers
Management board and their
direct family members
Supervisory board members and their direct
family members Major shareholders Subsidiaries
2012 2011 2012 2011 2012 2011 2012 2011 2012 2011
LOANS
At beginning of the year 234 215 - - - - 24,479 31,563 26,111 20,570
Loans issued during the year 100 50 13 - - - 1,007,060 538,925 53,290 22,866
Loan repayments during the year (47) (31) (13) - - - (987,844) (546,009) (36,265) (17,325)
At end of year 287 234 - - - - 43,695 24,479 43,136 26,111
Impairment as at 31 December - - - - - - - 443 244
Collateral received as at 31 December 679 517 - - - - - - - -
DEPOSITS
At beginning of the year 1,381 1,249 2,991 2,760 843 781 363,709 479,985 2 1,506
Deposits received during the year 1,639 1,976 5,726 9,736 1,520 1,680 363,870 803,445 87,901 69,181
Deposits repaid during the year (2,469) (1,844) (6,636) (9,505) (1,828) (1,618) (588,672) (919,721) (87,888) (70,685)
At end of year 551 1,381 2,081 2,991 535 843 138,907 363,709 15 2
Interest expense on deposits 35 35 92 91 24 24 6,295 5,533 - -
Interest income earned 9 9 - - - - 437 687 881 623
Other revenue − fee income 1 1 1 1 - - 333 461 114 25
Guarantees issued by the bank and commitments - - - - - - 20,366 20,270 - -
Remuneration 1,041 1,315 2,021* 1,943 117* 123
There were no transactions made with companies in which the Management board, Supervisory board and their closer family members or directors, advisors would have significant influence.
48.
Banka Koper annual report 2012 • financial statements 132

* Listed by names:(all amounts expressed in thousands of EUR)
Management board Gross salary Bonuses other payments under
pension plan other total
Giancarlo Miranda 226 54 70 9 16 375
Igor Kragelj 263 60 7 3 - 333
Aleksander Lozej 188 48 7 3 - 246
Aleksander Milostnik 187 48 7 3 - 245
Rado Grdina 187 48 9 3 - 247
Francesco Del Genio 133 41 70 - 9 253
Mario Henjak 242 61 16 3 - 322
total 1,427 360 186 23 25 2,021
(all amounts expressed in thousands of EUR)
Supervisory board members Attendance fee Bonuses total
Vojko Čok 3 65 68
Ivan Šramko - - -
Roberto Civalleri 3 20 23
Borut Bratina 3 20 23
Elena Breno 2 - 2
Fabrizio Centrone 1 - 1
total 12 105 117
eVentS AFteR tHe RepoRtInG peRIoD
There were no significant adjusting or non-adjusting events after the reporting period.
49.
Banka Koper annual report 2012 • financial statements 133

Publisher
Banka Koper d.d.
Created by
Banka Koper d.d., Inspira komunikacije
Design & DTP
Inspira komunikacije
Photography
Inspira komunikacije