ballwin mo real estate trends and statistics
TRANSCRIPT

8/8/2019 Ballwin MO Real Estate Trends and Statistics
http://slidepdf.com/reader/full/ballwin-mo-real-estate-trends-and-statistics 1/11
MARKET UPDATEFinding Homes for You
· Current Real Estate Market Conditions for Single Family Homes
· Trends in Pricing· Current Levels of Supply and Demand
· Value Metrics
· Report for the week ofSeptember 13, 2010
· Presented by Finding Homes for YouFinding Homes For You, Inc www.FindingHomesForYou.com - [email protected]
BALLWIN, MO 63
Powered by Altos Research LLC | www.altosresearch.com | Copyright © 2005-2010 Altos Research LLC

8/8/2019 Ballwin MO Real Estate Trends and Statistics
http://slidepdf.com/reader/full/ballwin-mo-real-estate-trends-and-statistics 2/11
Median List Price
Median Lot Size
13.2
Percent Relisted (reset DOM)
2108
2.5
2 %
Median Number of Bathrooms
142
Inventory of Properties Listed
$ 126
Percent Flip (price increased)
0.25 - 0.50 acre
Median House Size (sq ft)
$ 240,000
56 %
4.0
Market Action Index
Median Number of Bedrooms
Asking Price Per Square Foot
10 %
Percent of Properties with Price Decrease
Strong Buyer's
≠≠
±+
±+
±+
==
Altos Research Value Statistics
Most Expensive Listing
Average Days on Market (DoM)
ottom/Fourth
Lower/Third
Upper/Second
Top/First
This Week Real-Time Market Profile Trend
The Market Action Index answers the question "How's the Market?" by measuringthe current rate of sale versus the amount of the inventory. Index above 30implies a seller's advantage. Below 30, conditions give the advantage to thebuyer.
Supply and Demand
Characteristics per Quartile
0 93232
1162.5 14
3.0
8
128
3.0 142
117
12
11
0.25 - 0.50acre
0
$ 213,400
8
4
142
3.5
0.25 - 0.50acre
82.5
13440.25 - 0.50
acre
141
$ 164,900
4.0
210
0.25 - 0.50acre$ 299,900
4.0$ 485,200
0
10
2460
Inventory has been lightening latelyand the Market Action Index has beentrending up. These are mildly positiveindications for the market.
Monday September 13, 2010
Finding Homes for You | www.FindingHomesForYou.com | 636.386.0659
141
1820
2.0
The median list price in BALLWIN, MOthis week is $240,000. The 566
properties have been on the marketfor an average of 142 days.
Most expensive 25% of properties
Upper-middle 25% of properties
Lower-middle 25% of properties
Least expensive 25% of properties
Quartile Median Price Lot Size Beds Baths Age Inventory New Absorbed DOMSq. Ft.
No change
Strong upward trend Strong downward trend
Slight upward trend Slight downward trend±+
== ≠≠
≠=
BALLWIN,
City Overview
Least Expensive Listing
Average List Price
Average Age of Listing
566
$ 2,949,000
$ 79,900
$ 299,395
14
Trend Key:
The market has shown someevidence of slowing recently. Bothprices and inventory levels arerelatively unchanged in recentweeks. Watch the Market ActionIndex for changes as it can be aleading indicator for price changes.
Page 2 of 11
Single Family Home

8/8/2019 Ballwin MO Real Estate Trends and Statistics
http://slidepdf.com/reader/full/ballwin-mo-real-estate-trends-and-statistics 3/11
Finding Homes for You | www.FindingHomesForYou.com | 636.386.0659
City OverviewBALLWIN,
Monday September 13, 2010
Median PriceThe market seems to have paused around this plateau. The Market Action Index is a good leading indicator for the durability ofthis trend.
90-day Average7-day Average
Quartile PricesPrice weakness is visible almost across the board. Prices in Quartile 4 have been mixed recently, while the rest of the market istrending downward. Look to a strong, persistent up shift in the Market Action Index as a leading indicator of the trough in themarket.
First/Top Second/Upper Third/Lower Fourth/Bottom
Page 3 of 11
Single Family Hom

8/8/2019 Ballwin MO Real Estate Trends and Statistics
http://slidepdf.com/reader/full/ballwin-mo-real-estate-trends-and-statistics 4/11
Finding Homes for You | www.FindingHomesForYou.com | 636.386.0659
City OverviewBALLWIN,
Monday September 13, 2010
Price per Square FootThe market plateau is seen across the price and value. The price per square foot and median list price have both beenreasonably stagnant. Watch the Market Action Index for persistent changes as a leading indicator before the market moves fromthese levels.
90-day Average7-day Average
Inventory of Properties Listed for SaleInventory has been falling in recent weeks. Note that declining inventory alone does not signal a strengthening market. Look tothe Market Action Index and Days on Market trends to gauge whether buyer interest is changing with the available supply.
90-day Average7-day Average
Page 4 of 11
Single Family Hom

8/8/2019 Ballwin MO Real Estate Trends and Statistics
http://slidepdf.com/reader/full/ballwin-mo-real-estate-trends-and-statistics 5/11
Finding Homes for You | www.FindingHomesForYou.com | 636.386.0659
City OverviewBALLWIN,
Monday September 13, 2010
Market Action IndexThe BALLWIN market is currently quite strongly in the Buyer's Advantage zone (below 30). The 90-day Market Action Index standsat 13.15. With several months of inventory available at the current sales rate, buyers should find ample choice.
Buyers/Sellers Cutoff90-day Average
Market Action Index per QuartileNot surprisingly given the overall Market Action Index, all quartiles are in the Buyer's Market zone with several months ofinventory given the current rate of demand for homes in the quartile. Watch the quartile for changes before the overall marketshifts. Often one end of the market (e.g. the low end) will improve and signal a strengthening market before the whole group
changes.
First/Top Second/Upper Third/Lower Fourth/Bottom
Buyers/Sellers Cutoff
Residential house prices are a function of supply and demand, and market conditions can be characterizedby analyzing those factors. Watch this index for sustained changes: if the index falls into the Buyer’sAdvantage zone (below 30) for a long period, prices are likely in for a downward correction.
The Market Action Index (MAI) illustrates a balance between supply and demand using a statistical functionof the current rate of sale versus current inventory.
Page 5 of 11
Single Family Hom

8/8/2019 Ballwin MO Real Estate Trends and Statistics
http://slidepdf.com/reader/full/ballwin-mo-real-estate-trends-and-statistics 6/11
Finding Homes for You | www.FindingHomesForYou.com | 636.386.0659
City OverviewBALLWIN,
Monday September 13, 2010
Days on MarketThe properties have been on the market for an average of 142 days. Half of the listings have come newly on the market in thepast 91 or so days.
90-day Average7-day Average
Days on Market per QuartileIt is not uncommon for the higher priced homes in an area to take longer to sell than those in the lower quartiles.
First/Top Second/Upper Third/Lower Fourth/Bottom
Page 6 of 11
Single Family Hom

8/8/2019 Ballwin MO Real Estate Trends and Statistics
http://slidepdf.com/reader/full/ballwin-mo-real-estate-trends-and-statistics 7/11
Median List Price
Median Lot Size
13.9
Percent Relisted (reset DOM)
2218
2.5
2 %
Median Number of Bathrooms
134
Inventory of Properties Listed
$ 123
Percent Flip (price increased)
0.25 - 0.50 acre
Median House Size (sq ft)
$ 250,000
57 %
4.0
Market Action Index
Median Number of Bedrooms
Asking Price Per Square Foot
13 %
Percent of Properties with Price Decrease
Strong Buyer's
≠≠
±+
±+
±+
≠≠
Altos Research Value Statistics
Most Expensive Listing
Average Days on Market (DoM)
ottom/Fourth
Lower/Third
Upper/Second
Top/First
This Week Real-Time Market Profile Trend
The Market Action Index answers the question "How's the Market?" by measuringthe current rate of sale versus the amount of the inventory. Index above 30implies a seller's advantage. Below 30, conditions give the advantage to thebuyer.
Supply and Demand
Characteristics per Quartile
0 52992
1392.5 0
3.0
4
136
3.5 58
126
4
0
0.25 - 0.50acre
25
$ 222,000
6
1
58
3.5
0.25 - 0.50acre
42.5
13990.25 - 0.50
acre
57
$ 174,000
4.0
136
0.25 - 0.50acre$ 299,900
4.0$ 418,900
0
5
2500
The Market Action Index has beentrending down lately, indicatingdemand falling along with supply.Conditions point to mildly negativetrends for the market.
Monday September 13, 2010
Finding Homes for You | www.FindingHomesForYou.com | 636.386.0659
57
1972
2.0
The median list price in BALLWIN, MO63011 this week is $250,000. The 230
properties have been on the marketfor an average of 134 days.
Most expensive 25% of properties
Upper-middle 25% of properties
Lower-middle 25% of properties
Least expensive 25% of properties
Quartile Median Price Lot Size Beds Baths Age Inventory New Absorbed DOMSq. Ft.
No change
Strong upward trend Strong downward trend
Slight upward trend Slight downward trend±+
== ≠≠
≠=
BALLWIN, MO 63
Neighborhood Detail
Least Expensive Listing
Average List Price
Average Age of Listing
230
$ 1,200,000
$ 114,000
$ 292,744
25
Trend Key:
The market has shown someevidence of slowing recently. Bothprices and inventory levels arerelatively unchanged in recentweeks. Watch the Market ActionIndex for changes as it can be aleading indicator for price changes.
Page 7 of 11
Single Family Home

8/8/2019 Ballwin MO Real Estate Trends and Statistics
http://slidepdf.com/reader/full/ballwin-mo-real-estate-trends-and-statistics 8/11
Finding Homes for You | www.FindingHomesForYou.com | 636.386.0659
Neighborhood DetailBALLWIN, MO 63
Monday September 13, 2010
Median PriceRecently prices in this zip have settled at a plateau even though they dipped this week. Look for a persistent up-shift in theMarket Action Index before we see prices significantly move from these levels.
90-day Average7-day Average
Quartile PricesIn the quartile market segments, we see price conditions in this zip code have not shown strong directional trends lately.Quartile 3 has been trending up recently, but unless we see a persistent up-shift in the Market Action Index, it will likely resumethe trend of the rest of the market.
First/Top Second/Upper Third/Lower Fourth/Bottom
Page 8 of 11
Single Family Hom

8/8/2019 Ballwin MO Real Estate Trends and Statistics
http://slidepdf.com/reader/full/ballwin-mo-real-estate-trends-and-statistics 9/11
Finding Homes for You | www.FindingHomesForYou.com | 636.386.0659
Neighborhood DetailBALLWIN, MO 63
Monday September 13, 2010
Price per Square FootThe market plateau is seen across the price and value. The price per square foot and median list price have both beenreasonably stagnant. Watch the Market Action Index for persistent changes as a leading indicator before the market moves fromthese levels.
90-day Average7-day Average
Inventory of Properties Listed for SaleInventory has been falling in recent weeks. Note that declining inventory alone does not signal a strengthening market. Look tothe Market Action Index and Days on Market trends to gauge whether buyer interest is changing with the available supply.
90-day Average7-day Average
Page 9 of 11
Single Family Hom

8/8/2019 Ballwin MO Real Estate Trends and Statistics
http://slidepdf.com/reader/full/ballwin-mo-real-estate-trends-and-statistics 10/11
Finding Homes for You | www.FindingHomesForYou.com | 636.386.0659
Neighborhood DetailBALLWIN, MO 63
Monday September 13, 2010
Market Action IndexThe BALLWIN, 63011 market is currently quite strongly in the Buyer's Advantage zone (below 30). The 90-day Market ActionIndex stands at 13.91. With several months of inventory available at the current sales rate, buyers should find ample choice.
Buyers/Sellers Cutoff90-day Average
Market Action Index per QuartileNot surprisingly, all quartiles are in the Buyer's Market zone with several months of inventory given the current levels ofdemand. Watch the quartiles for changes before the overall market shifts.
First/Top Second/Upper Third/Lower Fourth/Bottom
Buyers/Sellers Cutoff
Residential house prices are a function of supply and demand, and market conditions can be characterizedby analyzing those factors. Watch this index for sustained changes: if the index falls into the Buyer’sAdvantage zone (below 30) for a long period, prices are likely in for a downward correction.
The Market Action Index (MAI) illustrates a balance between supply and demand using a statistical functionof the current rate of sale versus current inventory.
age 10 of 11
Single Family Hom
8/8/2019 Ballwin MO Real Estate Trends and Statistics
http://slidepdf.com/reader/full/ballwin-mo-real-estate-trends-and-statistics 11/11
Finding Homes for You | www.FindingHomesForYou.com | 636.386.0659
Neighborhood DetailBALLWIN, MO 63
Monday September 13 2010
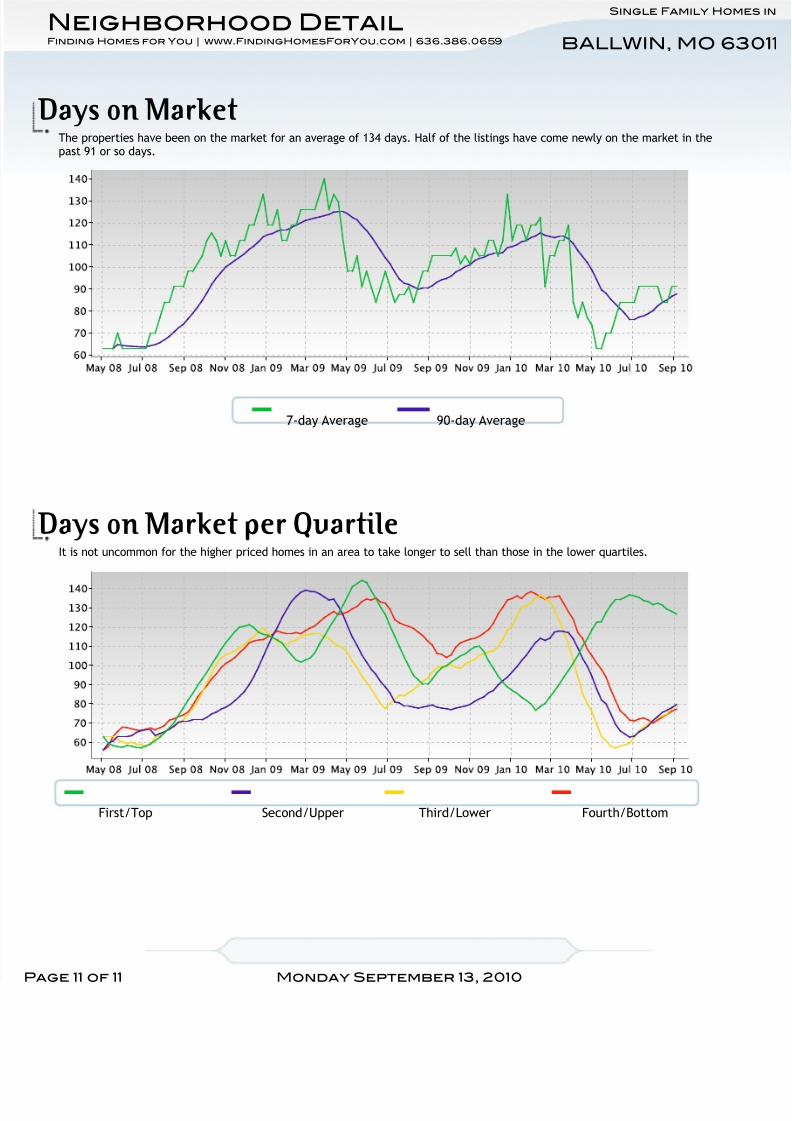
Days on MarketThe properties have been on the market for an average of 134 days. Half of the listings have come newly on the market in thepast 91 or so days.
90-day Average7-day Average
Days on Market per QuartileIt is not uncommon for the higher priced homes in an area to take longer to sell than those in the lower quartiles.
First/Top Second/Upper Third/Lower Fourth/Bottom
Page 11 of 11
Single Family Hom