baird 2017 global industrial conference -...
TRANSCRIPT

BAIRD 2017 GLOBAL INDUSTRIAL CONFERENCE
ANDERS GUSTAFSSONCHIEF EXECUTIVE OFFICERZEBRA TECHNOLOGIES
November 9, 2017
Statements made in this presentation which are not statements of historical fact are forward-looking statements and are
subject to the safe harbor provisions created by the Private Securities Litigation Reform Act of 1995. Actual results may
differ from those expressed or implied in the company’s forward-looking statements. Zebra may elect to update forward-
looking statements but expressly disclaims any obligation to do so, even if the company’s estimates change. These
forward-looking statements are based on current expectations, forecasts and assumptions and are subject to the risks and
uncertainties inherent in Zebra’s industry, market conditions, general domestic and international economic conditions, and
other factors. These factors include customer acceptance of Zebra’s hardware and software products and competitors’
product offerings, and the potential effects of technological changes. The continued uncertainty over future global economic
conditions, the availability of credit, and capital markets volatility may have adverse effects on Zebra, its suppliers and its
customers. In addition, a disruption in our ability to obtain products from vendors as a result of supply chain constraints,
natural disasters or other circumstances could restrict sales and negatively affect customer relationships. Profits and
profitability will be affected by Zebra’s ability to control manufacturing and operating costs. Because of Zebra’s debt, interest
rates and financial market conditions will also have an impact on results. Foreign exchange rates will have an effect on
financial results because of the large percentage of our international sales. The outcome of litigation in which Zebra may be
involved is another factor. The success of integrating acquisitions could also affect profitability, reported results and the
company’s competitive position in it industry. These and other factors could have an adverse effect on Zebra’s sales, gross
profit margins and results of operations. Descriptions of the risks, uncertainties and other factors that could affect the
company’s future operations and results can be found in Zebra’s filings with the Securities and Exchange Commission. In
particular, please refer to Zebra’s latest filing of its Forms 10-K and 10-Q. This presentation includes certain non-GAAP
financial measures and we refer to the reconciliations to the comparable GAAP financial measures and related information.2
Safe Harbor Statement

The Market Leader in Enterprise Visibility
MOBILE COMPUTING#1 SCANNING#1 RFID READERS#1
DESKTOP PRINTING#1 TABLETOP PRINTING#1 MOBILE PRINTING#1
3
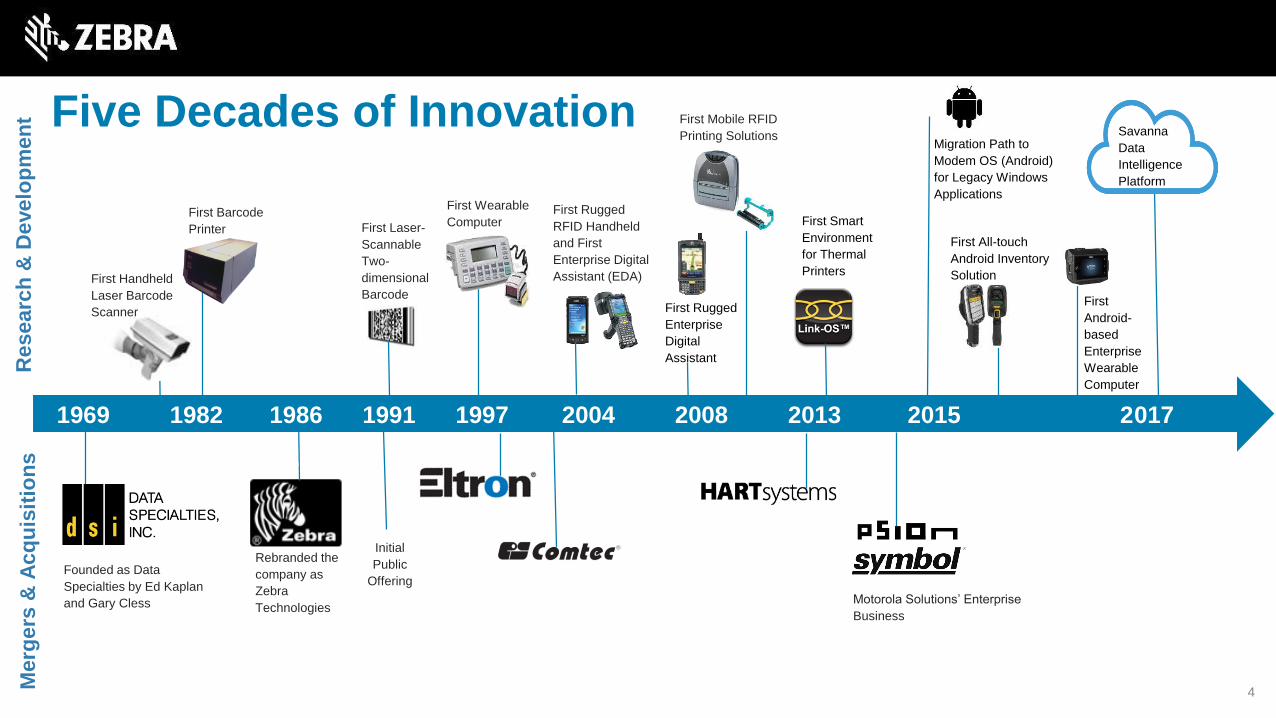
Five Decades of Innovation
8First All-touch
Android Inventory
Solution
First Rugged
Enterprise
Digital
Assistant
First Rugged
RFID Handheld
and First
Enterprise Digital
Assistant (EDA)
Initial
Public
OfferingFounded as Data
Specialties by Ed Kaplan
and Gary Cless
First Barcode
Printer First Laser-
Scannable
Two-
dimensional
Barcode
First Wearable
Computer First Smart
Environment
for Thermal
Printers
First
Android-
based
Enterprise
Wearable
Computer
Migration Path to
Modem OS (Android)
for Legacy Windows
Applications
1969 1982 1986 1991 1997 2004 2008 2013 2015 2017
4
Rebranded the
company as
Zebra
TechnologiesMotorola Solutions’ Enterprise
Business
Merg
ers
& A
cq
uis
itio
ns
Re
se
arc
h &
De
ve
lop
me
nt First Mobile RFID
Printing Solutions
First Handheld
Laser Barcode
Scanner
Savanna
Data
Intelligence
Platform
5
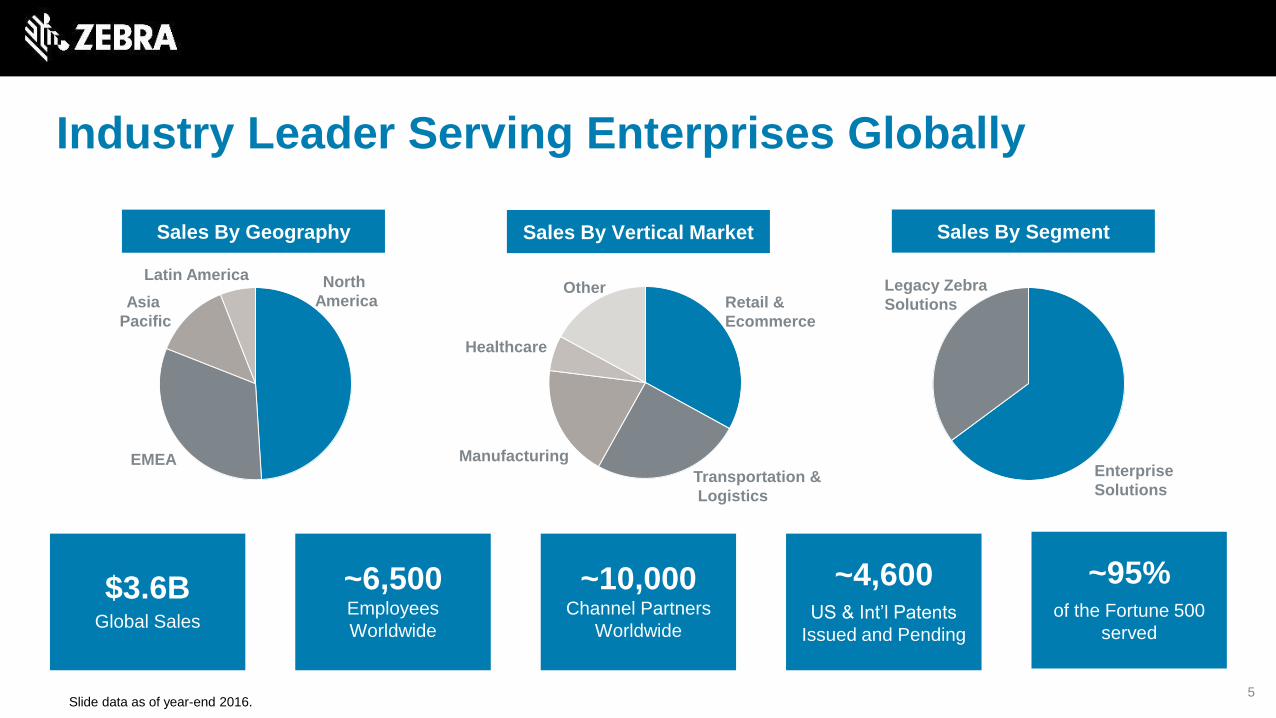
Industry Leader Serving Enterprises Globally
Latin America North
America
EMEA
Asia
Pacific
Retail &
Ecommerce
Transportation &
Logistics
Manufacturing
Healthcare
Other Legacy Zebra
Solutions
Enterprise
Solutions
Sales By Geography Sales By Vertical Market Sales By Segment
$3.6BGlobal Sales
~6,500 Employees
Worldwide
~4,600US & Int’l Patents
Issued and Pending
~10,000 Channel Partners
Worldwide
~95%of the Fortune 500
served
Slide data as of year-end 2016.

6
Attractive Performance Post-Acquisition(1)
FY15 FY16 YTD 3Q17
Organic Net Sales Growth(2,3)
7.5% 0.4% 6.1%
Adjusted EBITDA Margin 16.2% 17.5% 18.1%
Non-GAAP EPS Growth (YoY) N/M +10% +29%
1. Refer to the appendix of this presentation for reconciliations of GAAP to non-GAAP financial results
2. Organic Net Sales Growth is calculated by translating, for certain currencies, the current period results at the currency exchange rates used in the
comparable prior year period, rather than the exchange rates in effect during the current period. In addition, we exclude the impact of the company’s
foreign currency hedging program in both the current and prior year periods.
3. The Company sold the wireless LAN business in October 2016. We are excluding the impact of the net sales of this business in the FY 2016 period
when computing organic net sales growth. FY 2015 organic net sales growth uses estimated historical 2014 Enterprise sales and includes wireless
LAN sales.

SENSE ANALYZE ACT
Savanna
Data
Intelligence
Platform
Real-Time Analytics
What is it?
Where is it?
How is it?
Data Application
Enables Mobile Workers’
Best Next Move
Zebra Enables Enterprise Asset Intelligence
Operational Visibility Services

8
Targeting 4-5% Annualized Sales Growth Over a Cycle
Core Markets
~$9B
3-4% Industry Growth
Adjacencies &
Solutions
$15B+ MarketsMobile Computing,
Scanning, Printing,
Services
Extending our leadership position in core
markets
Evolving the portfolio into solutions
Opportunities in underpenetrated, faster-
growing adjacencies
$24B+

9
QUESTIONS?

APPENDIX
10

11
This presentation contains certain Non-GAAP financial measures, consisting of “adjusted net sales,” “EBITDA,” “Adjusted EBITDA,” “Non-GAAP net income,” “Non-GAAP
earnings per share,” and “organic net sales growth.” Management presents these measures to focus on the on-going operations and believes it is useful to investors
because they enable them to perform meaningful comparisons of past and present operating results. The company believes it is useful to present Non-GAAP financial
measures, which exclude certain significant items, as a means to understand the performance of its ongoing operations and how management views the business. Please
see the “Reconciliation of GAAP to Non-GAAP Financial Measures” tables and accompanying disclosures at the end of this presentation for more detailed information
regarding non-GAAP financial measures herein, including the items reflected in adjusted net earnings calculations. These measures, however, should not be construed as
an alternative to any other measure of performance determined in accordance with GAAP.
The company does not provide a reconciliation for non-GAAP estimates on a forward-looking basis where it is unable to provide a meaningful or accurate calculation or
estimation of reconciling items and the information is not available without unreasonable effort. This is due to the inherent difficulty of forecasting the timing or amount of
various items that have not yet occurred, are out of the company’s control and/or cannot be reasonably predicted, and that would impact diluted net earnings per share, the
most directly comparable forward-looking GAAP financial measure. For the same reasons, the company is unable to address the probable significance of the unavailable
information. Forward-looking non-GAAP financial measures provided without the most directly comparable GAAP financial measures may vary materially from the
corresponding GAAP financial measures.
As a global company, Zebra's operating results reported in U.S. dollars are affected by foreign currency exchange rate fluctuations because the underlying foreign
currencies in which the company transacts change in value over time compared to the U.S. dollar; accordingly, the company presents certain organic growth financial
information, which includes impacts of foreign currency translation, to provide a framework to assess how the company’s businesses performed excluding the impact of
foreign currency exchange rate fluctuations. Foreign currency impact represents the difference in results that are attributable to fluctuations in the currency exchange rates
used to convert the results for businesses where the functional currency is not the U.S. dollar. This impact is calculated by translating, for certain currencies, current period
results at the currency exchange rates used in the comparable period in the prior year, rather than the exchange rates in effect during the current period. In addition, the
company excludes the impact of its foreign currency hedging program in both the current year and prior year periods The company believes these measures should be
considered a supplement to and not in lieu of the company’s performance measures calculated in accordance with GAAP.
Use of Non-GAAP Financial Information
12
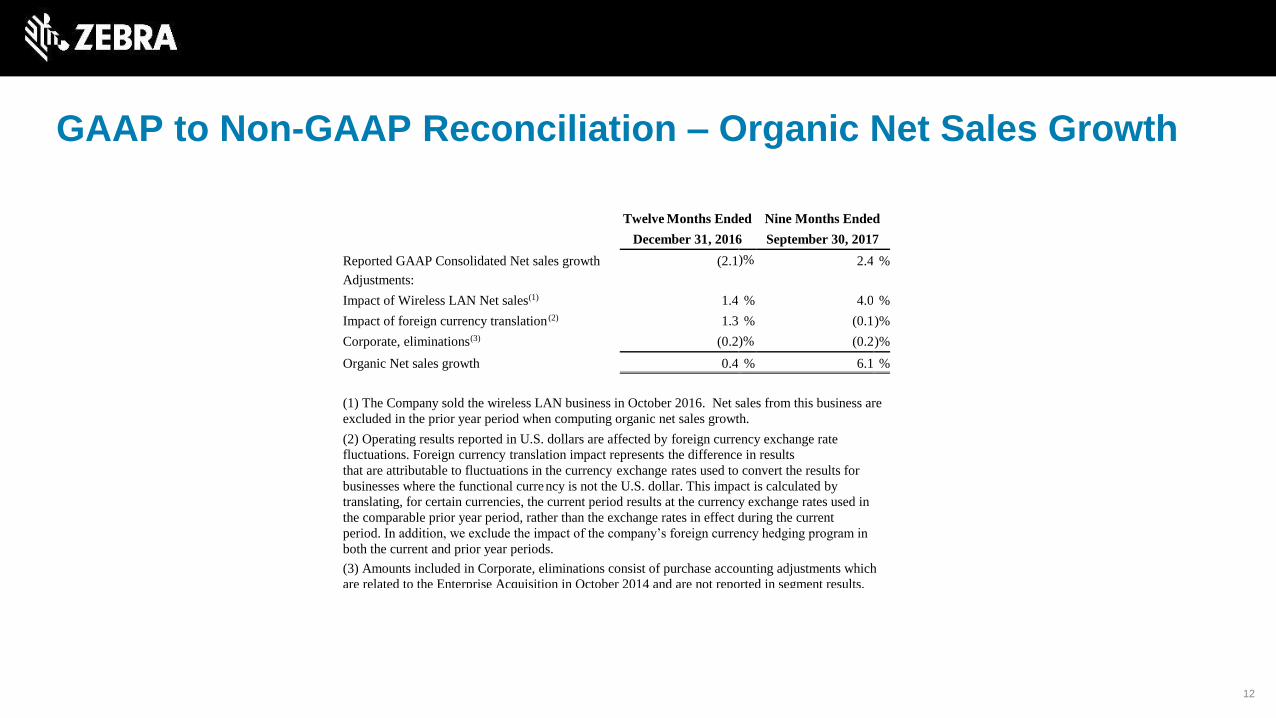
GAAP to Non-GAAP Reconciliation – Organic Net Sales Growth
Twelve Months Ended Nine Months Ended
December 31, 2016 September 30, 2017
Reported GAAP Consolidated Net sales growth (2.1 )% 2.4 %
Adjustments:
Impact of Wireless LAN Net sales(1) 1.4 % 4.0 %
Impact of foreign currency translation (2) 1.3 % (0.1 )%
Corporate, eliminations(3) (0.2 )% (0.2 )%
Organic Net sales growth 0.4 % 6.1 %
(1) The Company sold the wireless LAN business in October 2016. Net sales from this business are
excluded in the prior year period when computing organic net sales growth.
(2) Operating results reported in U.S. dollars are affected by foreign currency exchange rate
fluctuations. Foreign currency translation impact represents the difference in results
that are attributable to fluctuations in the currency exchange rates used to convert the results for
businesses where the functional currency is not the U.S. dollar. This impact is calculated by
translating, for certain currencies, the current period results at the currency exchange rates used in
the comparable prior year period, rather than the exchange rates in effect during the current
period. In addition, we exclude the impact of the company’s foreign currency hedging program in
both the current and prior year periods.
(3) Amounts included in Corporate, eliminations consist of purchase accounting adjustments which
are related to the Enterprise Acquisition in October 2014 and are not reported in segment results.

13
GAAP to Non-GAAP Reconciliation - EBITDA Twelve Months Ended
December 31,
2016 December 31,
2015
Operating income $ 80 $ 37
Depreciation 75 69
Amortization of intangible assets 229 251
EBITDA (Non-GAAP) 384 357
Adjustments to Net sales
Purchase accounting adjustments 10 16
Total adjustments to Net sales 10 16
Adjustments to Cost of sales
Purchase accounting adjustments — 4
Share-based compensation 2 3
Total adjustments to Cost of sales 2 7
Adjustments to Operating expenses
Acquisition and integration costs 125 145
Impairment of goodwill and other intangibles 62 —
Share-based compensation 26 30
Exit and restructuring costs 19 40
Total adjustments to Operating expenses 232 215
Total adjustments to EBITDA 244 238
Adjusted EBITDA (Non-GAAP) $ 628 $ 595
Adjusted EBITDA % of Adjusted Net Sales 17.5 % 16.2 %

14
GAAP to Non-GAAP Reconciliation - EBITDA
Nine Months
Ended
September 30,
2017
Net (loss) income $ 13
Add back:
Depreciation 58
Amortization of intangible assets 151
Total Other expenses, net 179
Income tax expense (benefit) (3 )
EBITDA (Non-GAAP) 398
Adjustments to Net sales
Purchase accounting adjustments 3
Total adjustments to Net sales 3
Adjustments to Cost of sales
Share-based compensation 2
Total adjustments to Cost of sales 2
Adjustments to Operating expenses
Acquisition and integration costs 50
Impairment of goodwill and other intangibles —
Share-based compensation 25
Exit and restructuring costs 10
Total adjustments to Operating expenses 85
Total adjustments to EBITDA 90
Adjusted EBITDA (Non-GAAP) $ 488
Adjusted EBITDA % of Adjusted Net Sales 18.1 %

15
GAAP to Non-GAAP Reconciliation – Net Income Twelve Months Ended
December 31,
2016 December 31,
2015
Net income (loss) $ (137 ) $ (158 )
Adjustment to Net sales(1)
Purchase accounting adjustments 10 16
Total adjustment to Net sales 10 16
Adjustments to Cost of sales (1)
Purchase accounting adjustments — 4
Share-based compensation 2 3
Total adjustments to Cost of sales 2 7
Adjustments to Operating expenses (1)
Amortization of intangible assets 229 251
Acquisition and integration costs 125 145
Impairment of goodwill and other intangibles 62 —
Share-based compensation 26 30
Exit and restructuring costs 19 40
Total adjustments to Operating expenses 461 466
Adjustments to Other expenses (1)
Amortization of debt issuance cost and discount 23 16
Impairment of cost-based investments 7 —
Foreign exchange loss 5 23
Forward interest rate swaps loss (gain) — (4 )
Total adjustments to Other expenses 35 35
Income tax effect of adjustments
Income tax expense (benefit) 8 (22 )
Tax-effect of Non-GAAP items(2) (86 ) (79 )
Total income tax effect of adjustments (78 ) (101 )
Total adjustments 430 423
Non-GAAP Net income $ 293 $ 265
GAAP earnings (loss) per share
Basic $ (2.65 ) $ (3.10 )
Diluted $ (2.65 ) $ (3.10 )
Non-GAAP earnings per share
Basic $ 5.67 $ 5.19
Diluted $ 5.60 $ 5.08
Basic weighted average shares outstanding 51,579,112 50,996,297
Diluted weighted average and equivalent shares
outstanding 52,259,157
52,096,036
(1) Presented on a pre-tax basis. (2) Represents the adjustment to the GAAP basis tax provision commensurate with non-GAAP adjustments.
16
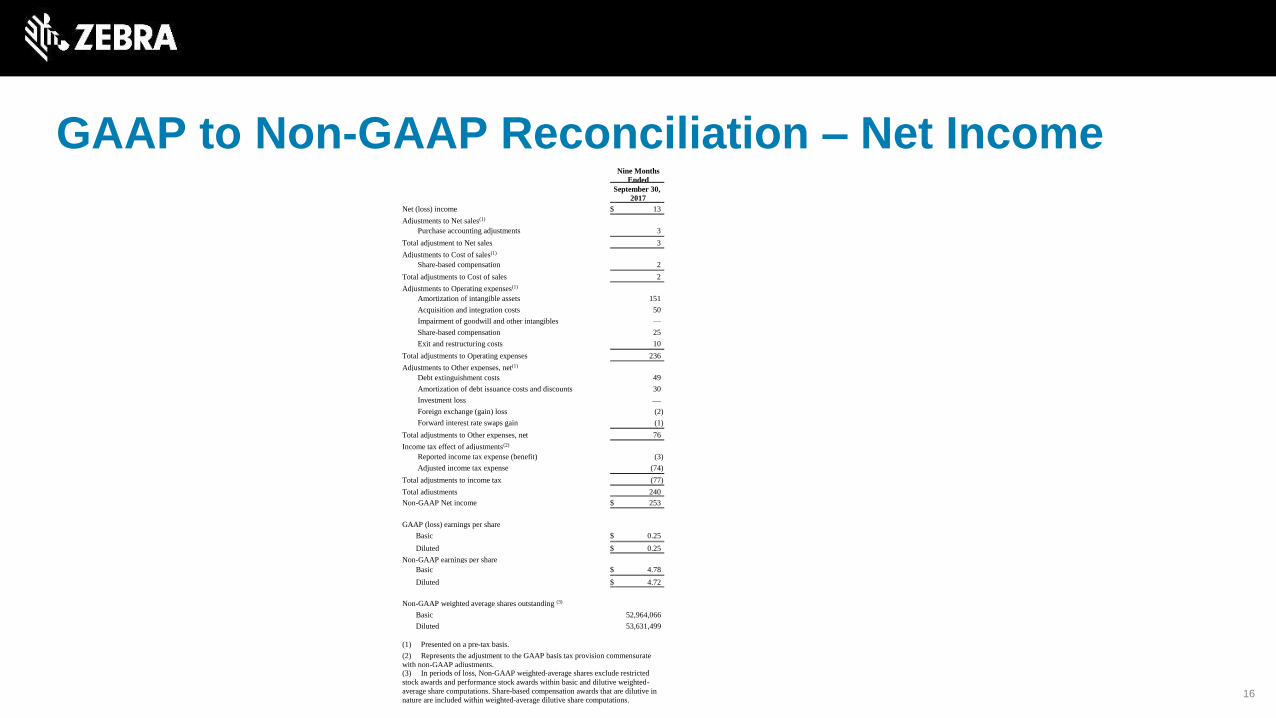
GAAP to Non-GAAP Reconciliation – Net Income
Nine Months
Ended
September 30,
2017
Net (loss) income $ 13
Adjustments to Net sales(1) Purchase accounting adjustments 3
Total adjustment to Net sales 3
Adjustments to Cost of sales(1) Share-based compensation 2
Total adjustments to Cost of sales 2
Adjustments to Operating expenses(1) Amortization of intangible assets 151
Acquisition and integration costs 50
Impairment of goodwill and other intangibles —
Share-based compensation 25
Exit and restructuring costs 10
Total adjustments to Operating expenses 236
Adjustments to Other expenses, net(1) Debt extinguishment costs 49
Amortization of debt issuance costs and discounts 30
Investment loss —
Foreign exchange (gain) loss (2 )
Forward interest rate swaps gain (1 )
Total adjustments to Other expenses, net 76
Income tax effect of adjustments(2) Reported income tax expense (benefit) (3 )
Adjusted income tax expense (74 )
Total adjustments to income tax (77 )
Total adjustments 240
Non-GAAP Net income $ 253
GAAP (loss) earnings per share
Basic $ 0.25
Diluted $ 0.25
Non-GAAP earnings per share Basic $ 4.78
Diluted $ 4.72
Non-GAAP weighted average shares outstanding (3)
Basic 52,964,066
Diluted 53,631,499
(1) Presented on a pre-tax basis.
(2) Represents the adjustment to the GAAP basis tax provision commensurate
with non-GAAP adjustments. (3) In periods of loss, Non-GAAP weighted-average shares exclude restricted
stock awards and performance stock awards within basic and dilutive weighted-
average share computations. Share-based compensation awards that are dilutive in nature are included within weighted-average dilutive share computations.
