robert w. baird industrial conference › 583752720 › files › doc... · robert w. baird...
TRANSCRIPT

November 11, 2014
Robert W. Baird Industrial Conference

Forward-Looking Statements & Non-GAAP Measures
This presentation contains forward-looking information regarding future events or the Company’s future financial performance based on the current expectations of Terex Corporation. In addition, when included in this presentation, the words “may,” “expects,” “intends,” “anticipates,” “plans,” “projects,” “estimates” and the negatives thereof and analogous or similar expressions are intended to identify forward-looking statements. However, the absence of these words does not mean that the statement is not forward-looking. The Company has based these forward-looking statements on current expectations and projections about future events. These statements are not guarantees of future performance.
Because forward-looking statements involve risks and uncertainties, actual results could differ materially. Such risks and uncertainties,
many of which are beyond the control of Terex, include among others: Our business is cyclical and weak general economic conditions
affect the sales of our products and financial results; our ability to successfully integrate acquired businesses; the need to comply with
restrictive covenants contained in our debt agreements; our ability to generate sufficient cash flow to service our debt obligations and
operate our business; our ability to access the capital markets to raise funds and provide liquidity; our business is sensitive to government
spending; our business is very competitive and is affected by our cost structure, pricing, product initiatives and other actions taken by
competitors; our ability to timely manufacture and deliver products to customers; our retention of key management personnel; the financial
condition of suppliers and customers, and their continued access to capital; our providing financing and credit support for some of our
customers; we may experience losses in excess of recorded reserves; impairment in the carrying value of goodwill and other indefinite-
lived intangible assets; our ability to obtain parts and components from suppliers on a timely basis at competitive prices; our business is
global and subject to changes in exchange rates between currencies, regional economic conditions and trade restrictions; our operations
are subject to a number of potential risks that arise from operating a multinational business, including compliance with changing
regulatory environments, the Foreign Corrupt Practices Act and other similar laws and political instability; a material disruption to one of
our significant facilities; possible work stoppages and other labor matters; compliance with changing laws and regulations, particularly
environmental and tax laws and regulations; litigation, product liability claims, patent claims, class action lawsuits and other liabilities; our
ability to comply with an injunction and related obligations resulting from the settlement of an investigation by the United States Securities
and Exchange Commission (“SEC”); our implementation of a global enterprise resource planning system and its performance; and other
factors, risks and uncertainties that are more specifically set forth in our public filings with the SEC. Non-GAAP Measures: Terex from time to time refers to various non-GAAP (generally accepted accounting principles) financial measures in this presentation. Terex believes that this information is useful to understanding its operating results and the ongoing performance of its underlying businesses without the impact of special items. See the appendix at the end of this presentation as well as the Terex third quarter 2014 earnings release on the Investor Relations section of our website www.terex.com for a description and/or reconciliation of these measures.
2

Defining Who We Are
Lifting & Material Handling Solutions Company
Focused on Operational Improvement
Leader in Product Categories
Geographically Diverse
Cash Generator
Profitable
3

4
Market Environment
• AWP: Market expected to remain strong – anticipate flat near term demand
• Construction: Mostly European dependent – outlook is flat to negative
• Cranes: Flat near term market – non-residential growth uncertain; Utilities and
Services expected to be positive
• MHPS: Flat MH business with service and parts positive. Port automation
deliveries to decline in 2015 - new business likely, timing hard to predict
• MP: Slower mining related products more than offsetting stronger aggregate
products but overall demand flat to positive
Market recovery difficult to predict
Terex to focus on controllable cost and growth initiatives

North America
Western Europe
Asia/ Oceania
Other
LATAM
Total Terex Sales by Geography %
Sales by Geography 2013 vs 2014
6%
3%
(26)% (30)%
31% 32%
17%
(39)% (22)%
5
(5)%
Q3
Q3
Q3
Q3
Q3 YTD
YTD YTD
YTD
YTD
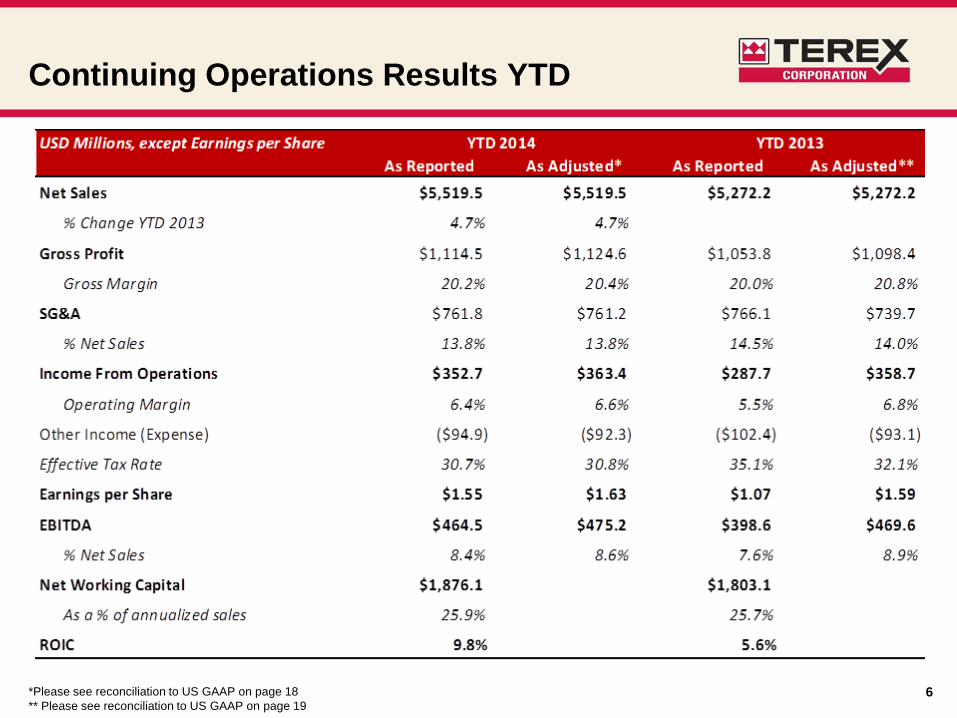
Continuing Operations Results YTD
*Please see reconciliation to US GAAP on page 18
** Please see reconciliation to US GAAP on page 19 6

Liquidity Bridge Jun-14 to Sep-14
7
Liquidity in the quarter increased by $115 million
• Generated $92 million from operating activities, including $22 million from reduced
working capital
• Stock repurchase and dividend payment combined for $12 million use of cash
• Repaid debt of $51 million
• Expanded revolver capacity aided liquidity by $100 million

Net Sales Bridge 2013 to 2014
8
Net Sales grew $53 million in Q3 versus prior year, approximately $22 million
from favorable exchange rates
• AWP Q3 sales grew in all regions except South America where volumes were down 24%
• Excluding foreign exchange, Construction grew 8% in Q3 driven by strength in material
handling and US concrete mixers
• Cranes segment decline in the quarter driven by reductions in mobile cranes partially
offset by strength in Utilities
Third Quarter Year to Date

Operating Profit Bridge 2013 to 2014
9
Mixed Operating Profit results in the quarter
• AWP decline driven by under-absorption, product campaign, currency, and factory
start-up costs
• Construction improved on higher sales, productivity and cost base vigilance
• Cranes declined on lower sales volume
• MHPS continued to benefit from cost savings and restructuring activities
• MP declined on regional mix, under-absorption and increased engineering expense
Third Quarter Year to Date

Cash & Investments 345
Revolver Facility 600
Amount Outstanding -50
Issued Letters of Credit 0
Total Liquidity 895
Liquidity Profile
Maturity Profile
Cash of $345mm with leverage at 2.4x net debt/EBITDA
Coupon Maturity Rating Price Yield
Cash 345$
$600mm Revolver 50 0.1 2.15% Aug-19 Ba1 / BBB-
USD Term Loan B 228 0.4 3.50% Aug-21 Ba1 / BBB-
EUR Term Loan B 252 0.8 4.00% Aug-21 Ba1 / BBB-
Total Secured Debt 530$ 0.8
Senior Guaranteed Notes (Callable in '16) 300 1.3 6.50% Apr-20 B2 / BB 104.750$ 5.487%
Senior Guaranteed Notes (Callable in '16) 850 2.6 6.00% May-21 B2 / BB 103.500$ 5.363%
Convertible Notes 123 2.8 4.00% Jun-15 B3 / B+
Other Debt 49 2.9
Total Debt 1,852$ 2.9 x
Net Debt 1,507$ 2.4 x
Sep 30
2014
Amount
x2014 EBITDA
multiple*
* Based on LTM 9/30/14 EBITDA of $637mm.
$49 $123 $50
$300
$1330
2014 2015 2016 2017 2018 2019 2020 2021
$600
Terex Capital Structure
10
No Material Near-Term Debt Maturities

Improvement Initiatives
• Improvement Initiatives include more than 50 specific projects addressing a range of
opportunities within and across Terex businesses
• Currently targeted OP opportunities totaling ~$200 million over the next few years
• Working capital improvement opportunity exceeds $300 million
• Increased cash generation supports continued debt reduction and share repurchase
• Additional 3 points of improvement in effective tax rate expected from on-going tax initiatives
11

Improvement Initiatives
12
• Working Capital improvement initiative underway to address unfavorable
AR vs AP relationship
DSO vs DPO
Favorable 10-day gap
Unfavorable 10-day gap
DSO = ($150M)
DPO = ($150M)
Total = ($300M)
Gap Cost

Summary
13
• End markets remain difficult to predict – focused on
improvement initiatives that make the company stronger in any
environment
• Equipment commissioning in our MHPS segment will be key to
Q4 performance
• Full year EPS and Free Cash Flow estimated at or near the
lower end of our guidance
• Improvement initiatives targeting $200 million of operating
profit; $300-500 million debt reduction and share repurchase;
and 3 percentage point reduction in Effective Tax Rate

Questions?
October 30, 2014
Third Quarter 2014 Conference Call
14

Terex Book-to-Bill Trend (USD Millions)
15

Backlog Trend (USD Millions)
16

1
7
Third Quarter Results
Free cash flow = net cash provided by (used in) operating activities less capital expenditures
Q3 Reported EPS of $0.51 and Adjusted EPS of $0.59 compared to prior
year EPS of $0.73
Performance in the quarter was in line with our revised guidance
• Overall sales growth of 3% versus prior year period, almost half from favorable
exchange rates
• AWP margin decline driven by under-absorption and product campaign ($17 million),
currency ($9 million), and factory start-up costs ($4 million)
• Cranes met its moderated expectations, as set out in September
• Improved performance in MHPS (excluding $10.7 million in restructuring charges)
and Construction was in line with expectations
• MP operating profit declined on regional mix, under-absorption and increased
engineering expense
Free cash flow of $71 million in the quarter
Full year EPS and Free Cash Flow estimated at or near the lower end of our
guidance

Continuing Operations Results Q3
* Please see reconciliation to US GAAP on page 17 1
8

19
Q3 2014 Adjustments

20
YTD 2014 Adjustments

21
YTD 2013 Adjustments

22
Adjusted OP by Segment – Q3 2014

23
Adjusted OP by Segment – 2014 YTD

24
Adjusted OP by Segment – 2013 YTD

Q3 2013 ROIC Calculation
25
See reconciliation of adjusted amounts below on table following ROIC table. Amounts are as of and for the three months ended for the periods referenced in
the table below.