babcock & wilcox enterprises,...
TRANSCRIPT

Table of Contents
UNITED STATES
SECURITIES AND EXCHANGE COMMISSIONWashington, D.C. 20549
FORM 10-Q(Mark One)
x QUARTERLY REPORT PURSUANT TO SECTION 13 OR 15(d) OF THE SECURITIES EXCHANGE ACT OF 1934For the quarterly period ended June 30, 2017
OR
¨ TRANSITION REPORT PURSUANT TO SECTION 13 OR 15(d) OF THE SECURITIES EXCHANGE ACT OF 1934For the transition period from to
Commission File No. 001-36876
BABCOCK & WILCOX ENTERPRISES, INC.(Exact name of registrant as specified in its charter)
DELAWARE 47-2783641(State or other Jurisdiction of Incorporation or Organization) (I.R.S. Employer Identification No.)
THE HARRIS BUILDING
13024 BALLANTYNE CORPORATE PLACE, SUITE 700 CHARLOTTE, NORTH CAROLINA 28277(Address of Principal Executive Offices) (Zip Code)
Registrant's Telephone Number, Including Area Code: (704) 625-4900
Indicate by check mark whether the registrant (1) has filed all reports required to be filed by Section 13 or 15(d) of the Securities Exchange Act of 1934 during thepreceding 12 months (or for such shorter period that the registrant was required to file such reports), and (2) has been subject to such filing requirements for thepast 90 days. Yes x No ¨
Indicate by check mark whether the registrant has submitted electronically and posted on its corporate Web site, if any, every Interactive Data File required to besubmitted and posted pursuant to Rule 405 of Regulation S-T (§232.405 of this chapter) during the preceding 12 months (or for such shorter period that theregistrant was required to submit and post such files). Yes x No ¨
Indicate by check mark whether the registrant is a large accelerated filer, an accelerated filer, a non-accelerated filer, a smaller reporting company, or an emerginggrowth company. See the definitions of "large accelerated filer," "accelerated filer," "smaller reporting company," and "emerging growth company" in Rule 12b-2of the Exchange Act.
Large accelerated filer x Accelerated filer ¨ Non-accelerated filer ¨ (Do not check if a smaller reporting company) Smaller reporting company ¨ Emerging growth company ¨If an emerging growth company, indicate by check mark if the registrant has elected not to use the extension transition period for complying with any new orrevised financial accounting standards provided pursuant to Section 13(a) of the Exchange Act. ¨
Indicate by check mark whether the registrant is a shell company (as defined in Rule 12b-2 of the Exchange Act). Yes ¨ No x
The number of shares of the registrant's common stock outstanding at July 31, 2017 was 48,880,390 .
1

Table of Contents
BABCOCK & WILCOX ENTERPRISES, INC.
FORM 10-Q
TABLE OF CONTENTS
PAGE
PART I - FINANCIAL INFORMATION Item 1 – Condensed Consolidated Financial Statements 3 Condensed Consolidated Statements of Operations for the Three and Six Months Ended June 30, 2017 and 2016 (Unaudited) 3
Condensed Consolidated Statements of Comprehensive Income for the Three and Six Months Ended June 30, 2017 and 2016(Unaudited)
4
Condensed Consolidated Balance Sheets as of June 30, 2017 and December 31, 2016 (Unaudited) 5 Condensed Consolidated Statements of Cash Flows for the Six Months Ended June 30, 2017 and 2016 (Unaudited) 6 Notes to Condensed Consolidated Financial Statements 7 Item 2 - Management's Discussion and Analysis of Financial Condition and Results of Operations 28 Item 3 - Quantitative and Qualitative Disclosures About Market Risk 42 Item 4 - Controls and Procedures 43
PART II - OTHER INFORMATION Item 1 - Legal Proceedings 44 Item 1A - Risk Factors 44 Item 2 - Unregistered Sales of Equity Securities and Use of Proceeds 45 Item 5 - Other Information 45 Item 6 - Exhibits 46
SIGNATURES 46
2

Table of Contents
PART I - FINANCIAL INFORMATION
ITEM 1. Condensed Consolidated Financial Statements
BABCOCK & WILCOX ENTERPRISES, INC.CONDENSED CONSOLIDATED STATEMENTS OF OPERATIONS
Three months ended June 30, Six months ended June 30,
(in thousands, except per share amounts) 2017 2016 2017 2016Revenues $ 349,829 $ 383,208 $ 740,933 $ 787,324Costs and expenses:
Cost of operations 405,651 357,156 733,855 681,116Selling, general and administrative expenses 68,584 63,329 135,606 122,064Restructuring activities and spin-off transaction costs 2,103 31,616 5,135 35,626Research and development costs 2,901 3,070 5,163 5,912Losses (gains) on asset disposals and impairments, net 4 6 4 (15)
Total costs and expenses 479,243 455,177 879,763 844,703Equity in income (loss) and impairment of investees (15,232) (616) (14,614) 2,060
Operating loss (144,646) (72,585) (153,444) (55,319)Other income (expense):
Interest income 125 251 238 541Interest expense (6,349) (391) (8,099) (790)Other – net 1,982 292 1,609 354
Total other income (expense) (4,242) 152 (6,252) 105Loss before income tax expense (148,888) (72,433) (159,696) (55,214)
Income tax expense (benefit) 1,962 (9,033) (2,005) (2,407)Net loss (150,850) (63,400) (157,691) (52,807)
Net income attributable to noncontrolling interest (149) (90) (353) (176)Net loss attributable to shareholders $ (150,999) $ (63,490) $ (158,044) $ (52,983)
Basic loss per share $ (3.09) $ (1.25) $ (3.24) $ (1.04)
Diluted loss per share $ (3.09) $ (1.25) $ (3.24) $ (1.04)
Shares used in the computation of earnings per share: Basic 48,854 50,603 48,797 51,115Diluted 48,854 50,603 48,797 51,115
See accompanying notes to condensed consolidated financial statements.
3

Table of Contents
BABCOCK & WILCOX ENTERPRISES, INC.CONDENSED CONSOLIDATED STATEMENTS OF COMPREHENSIVE INCOME (LOSS)
Three months ended June 30, Six months ended June 30,
(in thousands) 2017 2016 2017 2016Net loss $ (150,850) $ (63,400) $ (157,691) $ (52,807)Other comprehensive income (loss):
Currency translation adjustments, net of taxes 6,757 (11,566) 12,174 (9,826)
Derivative financial instruments: Unrealized gains (losses) on derivative financial instruments (3,657) 847 2,244 4,057Income taxes (1,453) 69 (139) 703
Unrealized gains (losses) on derivative financial instruments, net of taxes (2,204) 778 2,383 3,354Derivative financial instrument gains reclassified into net income (1,550) (693) (6,448) (1,997)Income taxes (892) (42) (1,947) (343)
Reclassification adjustment for gains included in net income, net of taxes (658) (651) (4,501) (1,654)
Benefit obligations: Unrealized gains (losses) on benefit obligations (97) 37 (141) (24)Income taxes — — — —
Unrealized gains (losses) on benefit obligations, net of taxes (97) 37 (141) (24)Amortization of benefit plan costs (benefits) (789) 95 (1,662) (309)Income taxes 11 37 20 (428)
Amortization of benefit plan costs (benefits), net of taxes (800) 58 (1,682) 119
Investments: Unrealized gains (losses) on investments (3) (7) 87 35Income taxes 16 — 45 24
Unrealized gains (losses) on investments, net of taxes (19) (7) 42 11Investment (gains) losses reclassified into net income (1) — (44) 1Income taxes — — (16) —
Reclassification adjustments for (gains) losses included in net income, net oftaxes (1) — (28) 1
Other comprehensive income (loss) 2,978 (11,351) 8,247 (8,019)Total comprehensive loss (147,872) (74,751) (149,444) (60,826)
Comprehensive income (loss) attributable to noncontrolling interest 164 (113) (26) (152)Comprehensive loss attributable to shareholders $ (147,708) $ (74,864) $ (149,470) $ (60,978)
See accompanying notes to condensed consolidated financial statements.
4
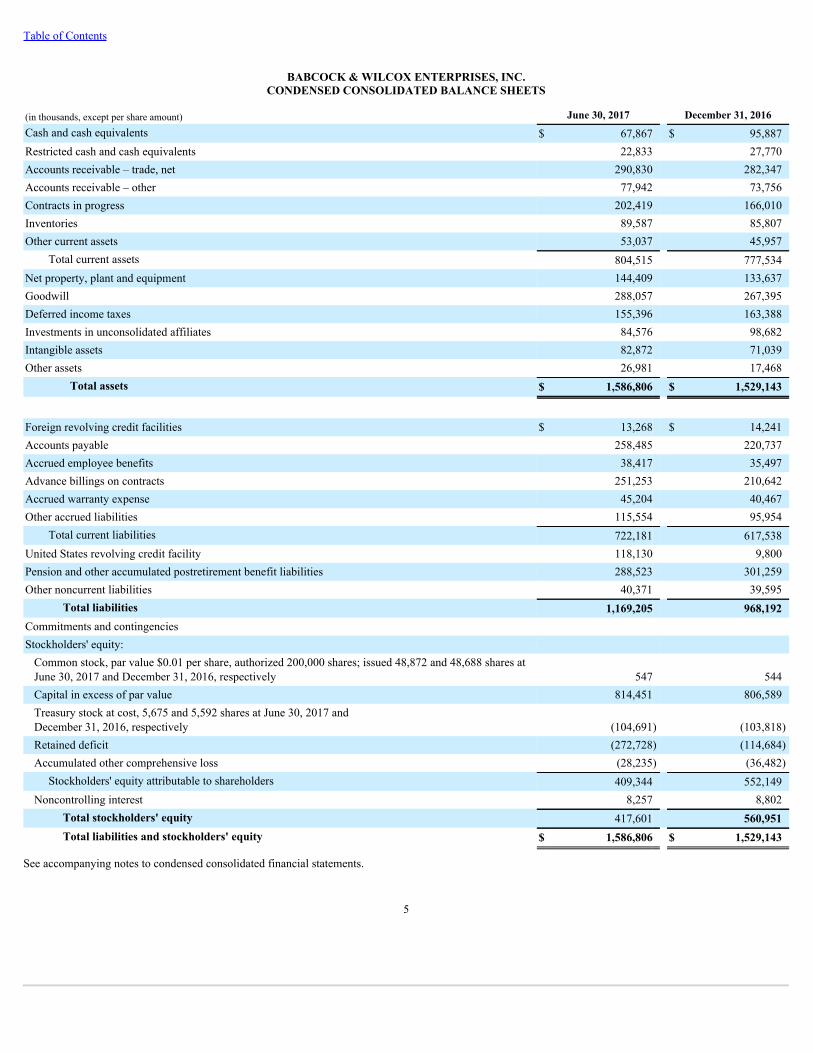
Table of Contents
BABCOCK & WILCOX ENTERPRISES, INC.CONDENSED CONSOLIDATED BALANCE SHEETS
(in thousands, except per share amount) June 30, 2017 December 31, 2016
Cash and cash equivalents $ 67,867 $ 95,887Restricted cash and cash equivalents 22,833 27,770Accounts receivable – trade, net 290,830 282,347Accounts receivable – other 77,942 73,756Contracts in progress 202,419 166,010Inventories 89,587 85,807Other current assets 53,037 45,957
Total current assets 804,515 777,534Net property, plant and equipment 144,409 133,637Goodwill 288,057 267,395Deferred income taxes 155,396 163,388Investments in unconsolidated affiliates 84,576 98,682Intangible assets 82,872 71,039Other assets 26,981 17,468
Total assets $ 1,586,806 $ 1,529,143
Foreign revolving credit facilities $ 13,268 $ 14,241Accounts payable 258,485 220,737Accrued employee benefits 38,417 35,497Advance billings on contracts 251,253 210,642Accrued warranty expense 45,204 40,467Other accrued liabilities 115,554 95,954
Total current liabilities 722,181 617,538United States revolving credit facility 118,130 9,800Pension and other accumulated postretirement benefit liabilities 288,523 301,259Other noncurrent liabilities 40,371 39,595
Total liabilities 1,169,205 968,192Commitments and contingencies Stockholders' equity:
Common stock, par value $0.01 per share, authorized 200,000 shares; issued 48,872 and 48,688 shares atJune 30, 2017 and December 31, 2016, respectively 547 544Capital in excess of par value 814,451 806,589Treasury stock at cost, 5,675 and 5,592 shares at June 30, 2017 andDecember 31, 2016, respectively (104,691) (103,818)Retained deficit (272,728) (114,684)Accumulated other comprehensive loss (28,235) (36,482)
Stockholders' equity attributable to shareholders 409,344 552,149Noncontrolling interest 8,257 8,802
Total stockholders' equity 417,601 560,951Total liabilities and stockholders' equity $ 1,586,806 $ 1,529,143
See accompanying notes to condensed consolidated financial statements.
5

Table of Contents
BABCOCK & WILCOX ENTERPRISES, INC.CONDENSED CONSOLIDATED STATEMENTS OF CASH FLOWS
Six months ended June 30,
(in thousands) 2017 2016
Cash flows from operating activities: Net income (loss) $ (157,691) $ (52,807)Non-cash items included in net income (loss):
Depreciation and amortization of long-lived assets 21,465 12,441Debt issuance costs amortization 764 —Income of equity method investees (3,579) (2,060)Other than temporary impairment of equity method investment in TBWES 18,193 —Losses on asset disposals and impairments, net 114 14,481Provision for (benefit from) deferred income taxes (1,326) (6,624)Recognition of losses (gains) for pension and postretirement plans (600) 29,986Stock-based compensation, net of associated income taxes 6,522 10,655
Changes in assets and liabilities, net of effects of acquisitions: Accounts receivable 6,343 49,476Contracts in progress and advance billings on contracts 6,704 (21,684)Inventories 3,381 (4,746)Income taxes (899) (2,437)Accounts payable 25,454 (36,784)Accrued and other current liabilities 13,839 3,583Pension liabilities, accrued postretirement benefits and employee benefits (13,040) (8,652)Other, net (7,331) (657)
Net cash from operating activities (81,687) (15,829)Cash flows from investing activities:
Decrease in restricted cash and cash equivalents 929 3,014Investment in equity method investees — (26,220)Purchase of property, plant and equipment (7,741) (13,607)Acquisition of business, net of cash acquired (52,547) —Purchases of available-for-sale securities (16,320) (16,743)Sales and maturities of available-for-sale securities 21,840 11,724Other (90) (562)
Net cash from investing activities (53,929) (42,394)Cash flows from financing activities:
Borrowings under our United States revolving credit facility 423,823 —Repayments of our United States revolving credit facility (315,493) —Borrowings under our foreign revolving credit facilities 240 1,065Repayments of our foreign revolving credit facilities (2,157) —Shares of our common stock returned to treasury stock (873) (52,307)Other (1,993) (230)
Net cash from financing activities 103,547 (51,472)Effects of exchange rate changes on cash 4,049 (4,495)Net increase (decrease) in cash and equivalents (28,020) (114,190)Cash and equivalents, beginning of period 95,887 365,192Cash and equivalents, end of period $ 67,867 $ 251,002See accompanying notes to condensed consolidated financial statements.
6
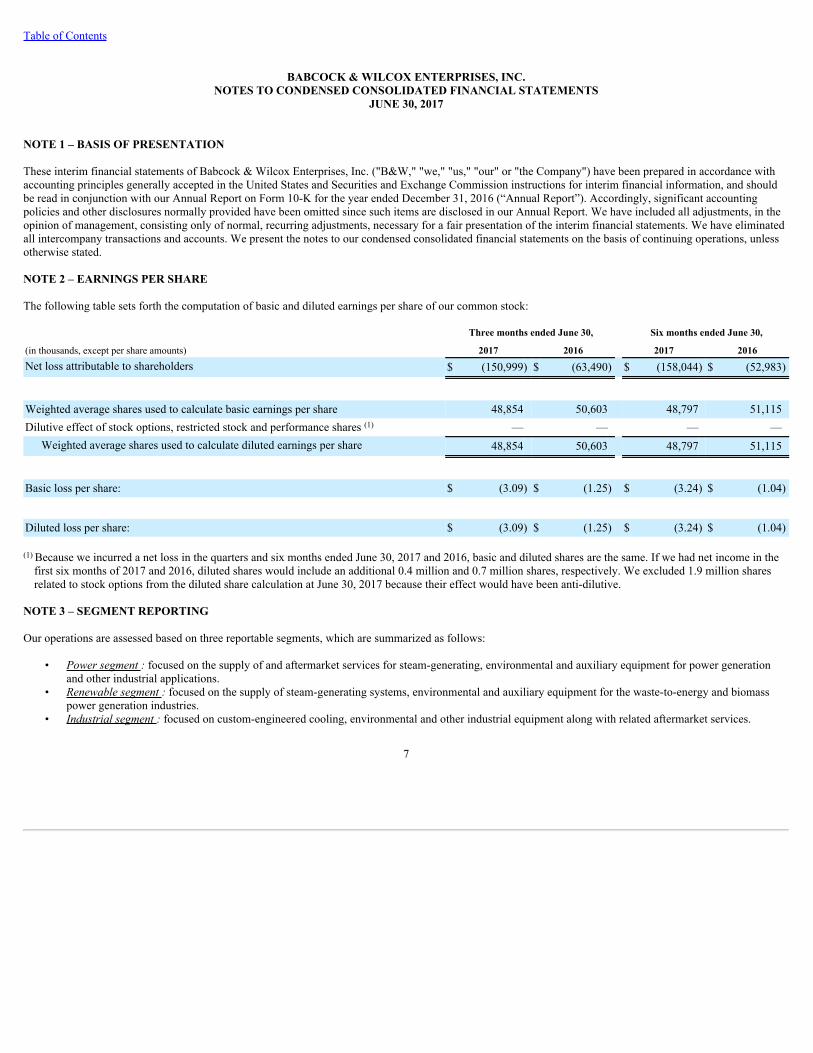
Table of Contents
BABCOCK & WILCOX ENTERPRISES, INC.NOTES TO CONDENSED CONSOLIDATED FINANCIAL STATEMENTS
JUNE 30, 2017
NOTE 1 – BASIS OF PRESENTATION
These interim financial statements of Babcock & Wilcox Enterprises, Inc. ("B&W," "we," "us," "our" or "the Company") have been prepared in accordance withaccounting principles generally accepted in the United States and Securities and Exchange Commission instructions for interim financial information, and shouldbe read in conjunction with our Annual Report on Form 10-K for the year ended December 31, 2016 (“Annual Report”). Accordingly, significant accountingpolicies and other disclosures normally provided have been omitted since such items are disclosed in our Annual Report. We have included all adjustments, in theopinion of management, consisting only of normal, recurring adjustments, necessary for a fair presentation of the interim financial statements. We have eliminatedall intercompany transactions and accounts. We present the notes to our condensed consolidated financial statements on the basis of continuing operations, unlessotherwise stated.
NOTE 2 – EARNINGS PER SHARE
The following table sets forth the computation of basic and diluted earnings per share of our common stock:
Three months ended June 30, Six months ended June 30,
(in thousands, except per share amounts) 2017 2016 2017 2016Net loss attributable to shareholders $ (150,999) $ (63,490) $ (158,044) $ (52,983)
Weighted average shares used to calculate basic earnings per share 48,854 50,603 48,797 51,115Dilutive effect of stock options, restricted stock and performance shares (1) — — — —
Weighted average shares used to calculate diluted earnings per share 48,854 50,603 48,797 51,115
Basic loss per share: $ (3.09) $ (1.25) $ (3.24) $ (1.04)
Diluted loss per share: $ (3.09) $ (1.25) $ (3.24) $ (1.04)
(1) Because we incurred a net loss in the quarters and six months ended June 30, 2017 and 2016, basic and diluted shares are the same. If we had net income in thefirst six months of 2017 and 2016, diluted shares would include an additional 0.4 million and 0.7 million shares, respectively. We excluded 1.9 million sharesrelated to stock options from the diluted share calculation at June 30, 2017 because their effect would have been anti-dilutive.
NOTE 3 – SEGMENT REPORTING
Our operations are assessed based on three reportable segments, which are summarized as follows:
• Powersegment:focused on the supply of and aftermarket services for steam-generating, environmental and auxiliary equipment for power generationand other industrial applications.
• Renewablesegment:focused on the supply of steam-generating systems, environmental and auxiliary equipment for the waste-to-energy and biomasspower generation industries.
• Industrialsegment:focused on custom-engineered cooling, environmental and other industrial equipment along with related aftermarket services.
7

Table of Contents
An analysis of our operations by segment is as follows:
Three months ended June 30, Six months ended June 30,
(in thousands) 2017 2016 2017 2016Revenues:
Power segment $ 213,756 $ 261,841 $ 410,052 $ 550,544Renewable segment 48,074 85,476 153,610 169,249Industrial segment 90,229 38,005 182,446 70,471Eliminations (2,230) (2,114) (5,175) (2,940)
349,829 383,208 740,933 787,324Gross profit:
Power segment 49,061 62,475 92,024 122,007Renewable segment (110,894) (17,503) (100,300) (4,124)Industrial segment 9,464 11,148 24,779 18,904Intangible amortization expense included in cost of operations (3,453) (569) (8,471) (1,080)Mark to market loss included in cost of operations — (29,499) (954) (29,499)
(55,822) 26,052 7,078 106,208Selling, general and administrative ("SG&A") expenses (67,596) (61,902) (133,518) (119,610)Restructuring activities and spin-off transaction costs (2,103) (31,616) (5,135) (35,626)Research and development costs (2,901) (3,070) (5,163) (5,912)Intangible amortization expense included in SG&A (988) (1,026) (1,982) (2,053)Mark to market loss included in SG&A — (401) (106) (401)Equity in income of investees 2,961 (616) 3,579 2,060Impairment of equity method investment (18,193) — (18,193) —Gains (losses) on asset disposals, net (4) (6) (4) 15
Operating loss $ (144,646) $ (72,585) $ (153,444) $ (55,319)
Beginning with the quarter ended September 30, 2017, the Industrial Steam product line currently included in our Power segment will be reclassified to theIndustrial segment to align with management changes that became effective on July 1, 2017.
On June 30, 2017, we assessed our intangible assets for impairment, including goodwill, and we will perform our annual goodwill impairment test after the changein reportable segments is completed. See Note 13 for the results of our interim goodwill impairment test.
NOTE 4 – UNIVERSAL ACQUISITION
On January 11, 2017, we acquired Universal Acoustic & Emission Technologies, Inc. ("Universal") for approximately $52.5 million in cash, funded primarily byborrowings under our United States revolving credit facility, net of $4.4 million cash acquired in the business combination. Transaction costs included in thepurchase price were approximately $0.2 million . We accounted for the Universal acquisition using the acquisition method, whereby all of the assets acquired andliabilities assumed were recognized at their fair value on the acquisition date, with any excess of the purchase price over the estimated fair value recorded asgoodwill. In order to purchase Universal on January 11, 2017, we borrowed approximately $55.0 million under the United States revolving credit facility in 2017.
Universal provides custom-engineered acoustic, emission and filtration solutions to the natural gas power generation, mid-stream natural gas pipeline, locomotiveand general industrial end-markets. Universal's product offering includes gas turbine inlet and exhaust systems, silencers, filters and enclosures. Universal employsapproximately 460 people, mainly in the United States and Mexico. The acquisition of Universal is consistent with our goal to grow and diversify our technology-based offerings with new products and services in the industrial markets that are complementary to our core businesses. During 2017 , we will integrate Universalwith our Industrial segment. Universal contributed $12.6 million and $33.8 million of revenue to our operating results during the three and six months endedJune 30, 2017 , respectively. Universal contributed
8
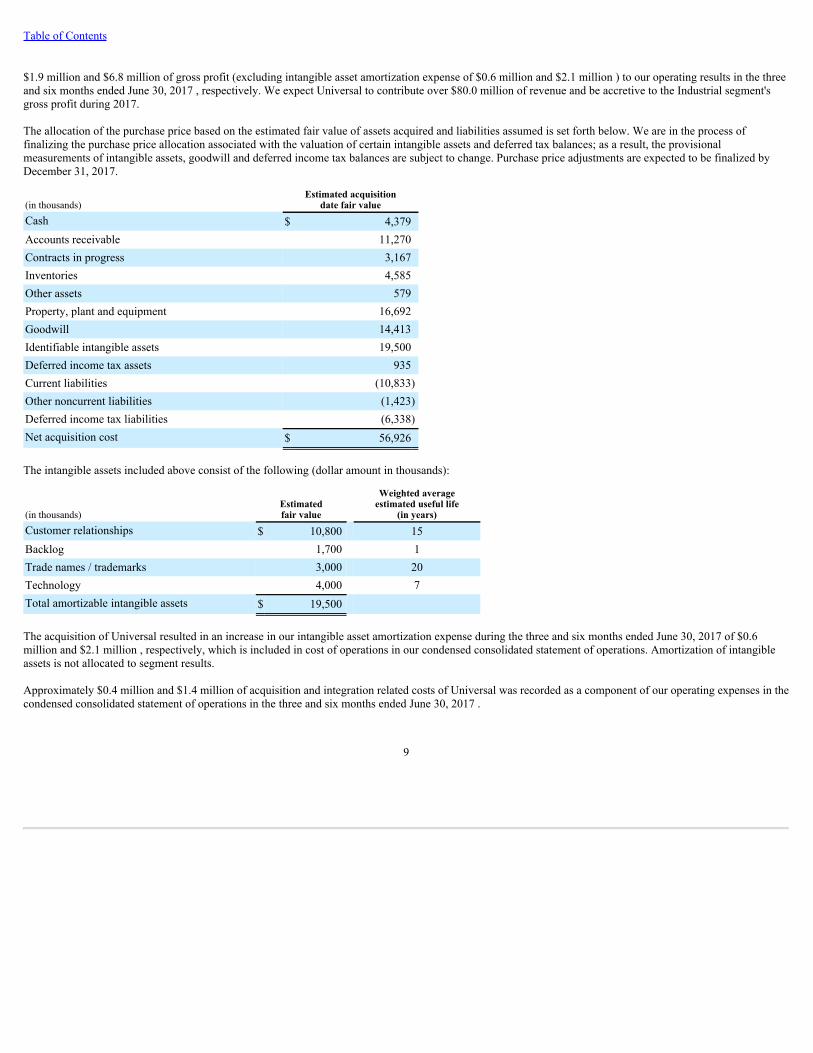
Table of Contents
$1.9 million and $6.8 million of gross profit (excluding intangible asset amortization expense of $0.6 million and $2.1 million ) to our operating results in the threeand six months ended June 30, 2017 , respectively. We expect Universal to contribute over $80.0 million of revenue and be accretive to the Industrial segment'sgross profit during 2017.
The allocation of the purchase price based on the estimated fair value of assets acquired and liabilities assumed is set forth below. We are in the process offinalizing the purchase price allocation associated with the valuation of certain intangible assets and deferred tax balances; as a result, the provisionalmeasurements of intangible assets, goodwill and deferred income tax balances are subject to change. Purchase price adjustments are expected to be finalized byDecember 31, 2017.
(in thousands)Estimated acquisition
date fair valueCash $ 4,379Accounts receivable 11,270Contracts in progress 3,167Inventories 4,585Other assets 579Property, plant and equipment 16,692Goodwill 14,413Identifiable intangible assets 19,500Deferred income tax assets 935Current liabilities (10,833)Other noncurrent liabilities (1,423)Deferred income tax liabilities (6,338)Net acquisition cost $ 56,926
The intangible assets included above consist of the following (dollar amount in thousands):
(in thousands)Estimatedfair value
Weighted averageestimated useful life
(in years)Customer relationships $ 10,800 15Backlog 1,700 1Trade names / trademarks 3,000 20Technology 4,000 7Total amortizable intangible assets $ 19,500
The acquisition of Universal resulted in an increase in our intangible asset amortization expense during the three and six months ended June 30, 2017 of $0.6million and $2.1 million , respectively, which is included in cost of operations in our condensed consolidated statement of operations. Amortization of intangibleassets is not allocated to segment results.
Approximately $0.4 million and $1.4 million of acquisition and integration related costs of Universal was recorded as a component of our operating expenses in thecondensed consolidated statement of operations in the three and six months ended June 30, 2017 .
9

Table of Contents
The following unaudited pro forma financial information below represents our results of operations for the three and six months ended June 30, 2016 and 12months ended December 31, 2016 had the Universal acquisition occurred on January 1, 2016. The unaudited pro forma financial information below is not intendedto represent or be indicative of our actual consolidated results had we completed the acquisition at January 1, 2016. This information should not be taken asrepresentative of our future consolidated results of operations.
Three months ended Six months ended Twelve months ended(in thousands) June 30, 2016 June 30, 2016 December 31, 2016
Revenues $ 404,120 $ 828,493 $ 1,660,986Net income (loss) attributable to B&W (62,963) (52,361) (113,940)Basic earnings per common share (1.24) (1.02) (2.27)Diluted earnings per common share (1.24) (1.02) (2.27)
The unaudited pro forma results included in the table above reflect the following pre-tax adjustments to our historical results:
• A net increase in amortization expense related to timing of amortization of the fair value of identifiable intangible assets acquired of $0.5 million , $1.9million and $2.8 million in the three and six months ended June 30, 2016 and the 12 months ended December 31, 2016 , respectively.
• Elimination of the historical interest expense recognized by Universal of $0.1 million , $0.2 million and $0.4 million in the three and six months endedJune 30, 2016 and the 12 months ended December 31, 2016 , respectively.
• Elimination of $0.5 million in transaction related costs recognized in the 12 months ended December 31, 2016 .
NOTE 5 – CONTRACTS AND REVENUE RECOGNITION
We generally recognize revenues and related costs from long-term contracts on a percentage-of-completion basis. Accordingly, we review contract price and costestimates regularly as work progresses and reflect adjustments in profit proportionate to the percentage of completion in the periods in which we revise estimates tocomplete the contract. To the extent that these adjustments result in a reduction of previously reported profits from a project, we recognize a charge against currentearnings. If a contract is estimated to result in a loss, that loss is recognized in the current period as a charge to earnings and the full loss is accrued on our balancesheet, which results in no expected gross profit from the loss contract in the future unless there are revisions to our estimated revenues or costs at completion inperiods following the accrual of the contract loss. Changes in the estimated results of our percentage-of-completion contracts are necessarily based on informationavailable at the time that the estimates are made and are based on judgments that are inherently uncertain as they are predictive in nature. As with all estimates tocomplete used to measure contract revenue and costs, actual results can and do differ from our estimates made over time.
In the three and six months ended June 30, 2017 and 2016 , we recognized changes in estimated gross profit related to long-term contracts accounted for on thepercentage-of-completion basis, which are summarized as follows:
Three months ended June 30, Six months ended June 30,
(in thousands) 2017 2016 2017 2016Increases in estimates for percentage-of-completioncontracts $ 4,982 $ 12,019 $ 14,182 $ 26,193Decreases in estimates for percentage-of-completioncontracts (121,217) (38,839) (124,588) (44,812)Net changes in estimates for percentage-of-completioncontracts $ (116,235) $ (26,820) $ (110,406) $ (18,619)
As disclosed in our December 31, 2016 consolidated financial statements, we had four renewable energy projects in Europe that were loss contracts atDecember 31, 2016 . During the three months ended June 30, 2017 , two additional renewable energy projects in Europe became loss contracts. During the threeand six months ended June 30, 2017 , we recorded a total of $115.2 million and $112.2 million , respectively, in net losses resulting from changes in the estimatedrevenues and costs to complete these six European renewable energy loss contracts. These changes in estimates include an increase in our estimate of liquidateddamages associated with these six projects of $16.7 million during the three months ended June 30, 2017 , to a total of $49.6 million . The charges recorded in thesecond quarter of 2017 are due to revisions in the estimated revenues and costs at completion during the period, primarily as a result of scheduling delays andshortcomings in our subcontractors' estimated
10

Table of Contents
productivity. Also included in the charges recorded in the second quarter of 2017 were corrections to estimated contract costs at completion of $4.9 million and$6.2 million relating to the three months ended December 31, 2016 and March 31, 2017, respectively. Management has determined these amounts are immaterialto the consolidated financial statements in both previous periods. As of June 30, 2017 , the status of these six loss contracts was as follows:
As we disclosed in our 2016 second and third quarter and annual financial statements, we incurred significant charges due to changes in the estimated cost tocomplete a contract related to one European renewable energy contract, which caused the project to become a loss contract. As of June 30, 2017 , this projectis approximately 94% complete and construction activities are complete as of the date of this report. The unit became operational during the second quarter of2017, and turnover activities linked to the customer's operation of the facility will be completed during the second half of 2017. During the three months endedJune 30, 2017 , we recognized additional contract losses of $10.5 million on the project as a result of differences in actual and estimated costs during thesecond quarter of 2017 and schedule delays. Our estimate at completion as of June 30, 2017 includes $6.5 million of total expected liquidated damages. As ofJune 30, 2017 , the reserve for estimated contract losses recorded in "other accrued liabilities" in our consolidated balance sheet was $3.9 million . In thesecond quarter of 2016, we recognized a $31.7 million charge, and as of June 30, 2016 , this project and had $6.4 million of accrued losses and was 73%complete.
The second project became a loss contract in the fourth quarter of 2016. As of June 30, 2017 , this contract was approximately 69% complete, and we expectthis project to be completed in early 2018. During the three and six months ended June 30, 2017 , we recognized additional contract losses of $41.2 millionand $37.4 million , respectively, on this project as a result of changes in construction cost estimates and schedule delays. Our estimate at completion as of June30, 2017 includes $14.3 million of total expected liquidation damages. As of June 30, 2017 , the reserve for estimated contract losses recorded in "otheraccrued liabilities" in our consolidated balance sheet was $16.6 million .
The third project became a loss contract in the fourth quarter of 2016. As of June 30, 2017 , this contract was approximately 95% complete and constructionactivities are complete as of the date of this report. The unit became operational during the second quarter of 2017, and turnover activities linked to thecustomer's operation of the facility will be completed during the second half of 2017. During the three and six months ended June 30, 2017 , we recognizedadditional contract losses of $2.7 million and $5.5 million , respectively, as a result of changes in the estimated costs at completion. Our estimate atcompletion as of June 30, 2017 includes $7.3 million of total expected liquidated damages for schedule delays. As of June 30, 2017 , the reserve for estimatedcontract losses recorded in "other accrued liabilities" in our consolidated balance sheet was $1.5 million .
The fourth project became a loss contract in the fourth quarter of 2016. As of June 30, 2017 , this contract was approximately 66% complete, and we expectthis project to be completed in early 2018. During the three and six months ended June 30, 2017 , we revised our estimated revenue and costs at completion forthis loss contract, which resulted in additional contract losses of $23.8 million and $21.9 million , respectively. Our estimate at completion as of June 30, 2017includes $6.4 million of total expected liquidated damages due to schedule delays. The changes in the status of this project were primarily attributable tochanges in the estimated costs at completion, offset by a $4.8 million reduction in estimated liquidated damages we recognized during the three months endedMarch 31, 2017. As of June 30, 2017 , the reserve for estimated contract losses recorded in "other accrued liabilities" in our consolidated balance sheet was$8.8 million .
The fifth project became a loss contract in the second quarter of 2017. As of June 30, 2017 , this contract was approximately 57% complete, and we expect thisproject to be completed in the first half of 2018. During the three months ended June 30, 2017 , we revised our estimated revenue and costs at completion forthis loss contract, which resulted in additional contract losses of $23.3 million in the three months ended June 30, 2017 . Our estimate at completion as of June30, 2017 includes $12.0 million of total expected liquidated damages due to schedule delays. The change in the status of this project was primarily attributableto changes in the estimated costs at completion and schedule delays. As of June 30, 2017 , the reserve for estimated contract losses recorded in "other accruedliabilities" in our consolidated balance sheet was $9.4 million .
The sixth project became a loss contract in the second quarter of 2017. As of June 30, 2017 , this contract was approximately 59% complete, and we expectthis project to be completed in the first half of 2018. During the three months ended June 30, 2017 , we revised our estimated revenue and costs at completionfor this loss contract, which resulted in additional contract losses of $18.5 million in the three months ended June 30, 2017 . Our estimate at completion as ofJune 30, 2017 includes $3.2 million of total expected liquidated damages due to schedule delays. The change in the status of this project was primarilyattributable to changes in the estimated costs at completion and schedule delays. As of June 30, 2017 , the reserve for estimated contract losses recorded in"other accrued liabilities" in our consolidated balance sheet was $4.0 million .
11

Table of Contents
We continue to expect the other renewable energy projects that are not loss contracts to remain profitable at completion.
During the third quarter of 2016, we determined it was probable that we would receive a $15.0 million insurance recovery for a portion of the losses on the firstEuropean renewable energy project discussed above. There was no change in the accrued probable insurance recovery at June 30, 2017 . The insurance recoveryrepresents the full amount available under the insurance policy, and is recorded in accounts receivable - other in our condensed consolidated balance sheet atJune 30, 2017 .
NOTE 6 – RESTRUCTURING ACTIVITIES AND SPIN-OFF TRANSACTION COSTS
Restructuringliabilities
Restructuring liabilities are included in other accrued liabilities on our condensed consolidated balance sheets. Activity related to the restructuring liabilities is asfollows:
Three months ended June 30, Six months ended June 30,
(in thousands) 2017 2016 2017 2016Balance at beginning of period (1) $ 697 $ 160 $ 2,254 $ 740Restructuring expense 1,887 15,877 3,857 18,024Payments (1,617) (4,053) (5,144) (6,780)
Balance at June 30 $ 967 $ 11,984 $ 967 $ 11,984
(1) For the three month periods ended June 30, 2017 and 2016, the balance at the beginning of the period is as of March 31, 2017 and 2016, respectively. For thesix month periods ended June 30, 2017 and 2016, the balance at the beginning of the period is as of December 31, 2016 and 2015, respectively.
Accrued restructuring liabilities at June 30, 2017 and 2016 relate primarily to employee termination benefits.
Excluded from restructuring expense in the table above are non-cash restructuring charges that did not impact the accrued restructuring liability. In the three andsix months ended June 30, 2017 , we recognized $(0.2) million and $0.4 million , respectively, in non-cash restructuring expense related to losses (gains) on thedisposals of long-lived assets. In the three and six months ended June 30, 2016 , we recognized non-cash charges of $14.6 million related to impairments of long-lived assets.
Spin-offtransactioncosts
Spin-off costs were primarily attributable to employee retention awards directly related to the spin-off from our former parent, The Babcock & Wilcox Company(now known as BWX Technologies, Inc.). In the three and six months ended June 30, 2017 , we recognized spin-off costs of $0.5 million and $0.9 million ,respectively. In the three and six months ended June 30, 2016, we recognized spin-off costs of $1.1 million and $3.0 million , respectively. In the three monthsended June 30, 2017 , we disbursed $1.9 million of the accrued retention awards.
NOTE 7 – PROVISION FOR INCOME TAXES
We had tax expense in the three months ended June 30, 2017 which resulted in a 1.3% effective tax rate as compared to a tax benefit in the three months endedJune 30, 2016 which resulted in a 12.5% effective tax rate. Our effective tax rate for the three months ended June 30, 2017 was lower than our statutory rateprimarily due to foreign losses in our Renewable segment that are subject to a valuation allowance, nondeductible expenses and unfavorable discrete items of $3.2million . The discrete items include withholding tax on a forecasted distribution outside the US, partly offset by favorable adjustments to prior year foreign taxreturns and the effect of vested and exercised share-based compensation awards. The tax benefit associated with the $18.2 million impairment of our equity methodinvestment in India was offset by a valuation allowance.
Our effective tax rate for the three months ended June 30, 2016 was lower than our statutory rate primarily due to a $13.1 million increase in valuation allowancesagainst deferred tax assets related to our equity investment in a foreign joint venture and state net operating losses, and to changes in the jurisdictional mix of ourforecasted full year income and losses, which were significantly affected by the 2016 second quarter mark to market adjustments, and the charge from a renewableenergy contact in Europe.
12

Table of Contents
Our effective rate for the six months ended June 30, 2017 was approximately 1.3% as compared to 4.4% for the six months ended June 30, 2016 . Our effective taxrate for the six months ended June 30, 2017 was lower than our statutory rate primarily due to the reasons noted above and nondeductible transaction costs, whichwere offset by the effect of vested and exercised share-based compensation awards, both of which were discrete items in the first quarter of 2017.
Our effective tax rate for the six months ended June 30, 2016 was lower than our statutory rate primarily due to a $13.1 million increase in valuation allowancesassociated with deferred tax assets related to our equity investment in a foreign joint venture and state net operating losses, and to the jurisdictional mix of ourforecasted full year income and losses, as described above.
During the six months ended June 30, 2017 , we prospectively adopted Financial Accounting Standards Board ("FASB") Accounting Standards Update ("ASU")2016-09, Compensation-StockCompensation(Topic718):ImprovementstoEmployeeShare-basedPaymentAccounting. Adopting the new accounting standardresulted in a net $0.2 million and $1.5 million income tax benefit in the three and six months ended June 30, 2017 , respectively, associated with the income taxeffects of vested and exercised share-based compensation awards. NOTE 8 – COMPREHENSIVE INCOME
Gains and losses deferred in accumulated other comprehensive income (loss) ("AOCI") are reclassified and recognized in the condensed consolidated statements ofoperations once they are realized. The changes in the components of AOCI, net of tax, for the first two quarters in 2017 and 2016 were as follows:
(in thousands)
Currencytranslation gain
(loss)
Net unrealized gain(loss) on investments
(net of tax)
Net unrealizedgain (loss) on
derivativeinstruments
Net unrecognized gain(loss) related to benefit
plans (net of tax) TotalBalance at December 31, 2016 $ (43,987) $ (37) $ 802 $ 6,740 $ (36,482)
Other comprehensive income (loss) before reclassifications 5,417 61 4,587 (44) 10,021Amounts reclassified from AOCI to net income (loss) — (27) (3,843) (882) (4,752)Net current-period other comprehensive income (loss) 5,417 34 744 (926) 5,269
Balance at March 31, 2017 $ (38,570) $ (3) $ 1,546 $ 5,814 $ (31,213)Other comprehensive income (loss) before reclassifications 6,757 (19) (2,204) (97) 4,437Amounts reclassified from AOCI to net income (loss) — (1) (658) (800) (1,459)Net current-period other comprehensive income (loss) 6,757 (20) (2,862) (897) 2,978
Balance at June 30, 2017 $ (31,813) $ (23) $ (1,316) $ 4,917 $ (28,235)
13
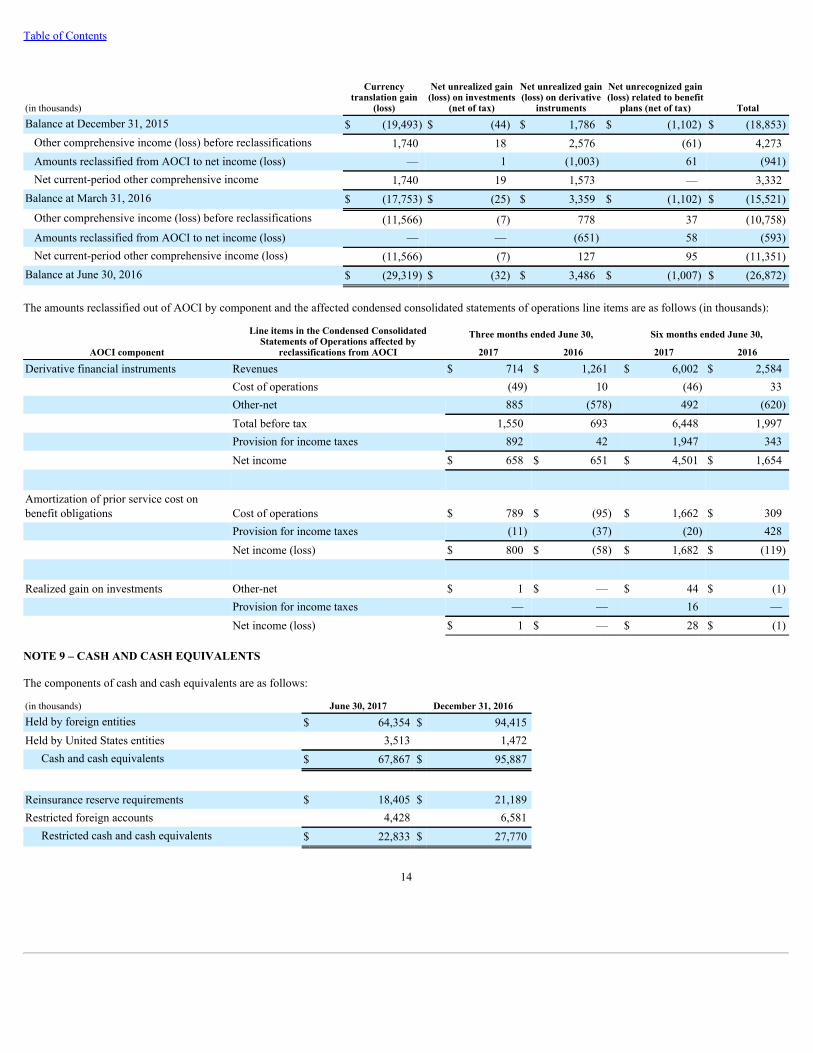
Table of Contents
(in thousands)
Currencytranslation gain
(loss)
Net unrealized gain(loss) on investments
(net of tax)
Net unrealized gain(loss) on derivative
instruments
Net unrecognized gain(loss) related to benefit
plans (net of tax) TotalBalance at December 31, 2015 $ (19,493) $ (44) $ 1,786 $ (1,102) $ (18,853)
Other comprehensive income (loss) before reclassifications 1,740 18 2,576 (61) 4,273Amounts reclassified from AOCI to net income (loss) — 1 (1,003) 61 (941)Net current-period other comprehensive income 1,740 19 1,573 — 3,332
Balance at March 31, 2016 $ (17,753) $ (25) $ 3,359 $ (1,102) $ (15,521)Other comprehensive income (loss) before reclassifications (11,566) (7) 778 37 (10,758)Amounts reclassified from AOCI to net income (loss) — — (651) 58 (593)Net current-period other comprehensive income (loss) (11,566) (7) 127 95 (11,351)
Balance at June 30, 2016 $ (29,319) $ (32) $ 3,486 $ (1,007) $ (26,872)
The amounts reclassified out of AOCI by component and the affected condensed consolidated statements of operations line items are as follows (in thousands):
AOCI component
Line items in the Condensed ConsolidatedStatements of Operations affected by
reclassifications from AOCI
Three months ended June 30, Six months ended June 30,
2017 2016 2017 2016
Derivative financial instruments Revenues $ 714 $ 1,261 $ 6,002 $ 2,584 Cost of operations (49) 10 (46) 33 Other-net 885 (578) 492 (620) Total before tax 1,550 693 6,448 1,997 Provision for income taxes 892 42 1,947 343 Net income $ 658 $ 651 $ 4,501 $ 1,654
Amortization of prior service cost onbenefit obligations Cost of operations $ 789 $ (95) $ 1,662 $ 309 Provision for income taxes (11) (37) (20) 428 Net income (loss) $ 800 $ (58) $ 1,682 $ (119)
Realized gain on investments Other-net $ 1 $ — $ 44 $ (1) Provision for income taxes — — 16 — Net income (loss) $ 1 $ — $ 28 $ (1)
NOTE 9 – CASH AND CASH EQUIVALENTS
The components of cash and cash equivalents are as follows:
(in thousands) June 30, 2017 December 31, 2016Held by foreign entities $ 64,354 $ 94,415Held by United States entities 3,513 1,472
Cash and cash equivalents $ 67,867 $ 95,887
Reinsurance reserve requirements $ 18,405 $ 21,189Restricted foreign accounts 4,428 6,581
Restricted cash and cash equivalents $ 22,833 $ 27,770
14

Table of Contents
Our United States revolving credit facility described in Note 17 allows for nearly immediate borrowing of available capacity to fund cash requirements in thenormal course of business, meaning that the minimum United States cash on hand is maintained to minimize borrowing costs.
NOTE 10 – INVENTORIES
The components of inventories are as follows:
(in thousands) June 30, 2017 December 31, 2016Raw materials and supplies $ 66,776 $ 61,630Work in progress 6,764 6,803Finished goods 16,047 17,374
Total inventories $ 89,587 $ 85,807
NOTE 11 – EQUITY METHOD INVESTMENTS
Joint ventures in which we have significant ownership and influence, but not control, are accounted for in our consolidated financial statements using the equitymethod of accounting. We assess our investments in unconsolidated affiliates for other-than-temporary-impairment when significant changes occur in theinvestee's business or our investment philosophy. Such changes might include a series of operating losses incurred by the investee that are deemed other thantemporary, the inability of the investee to sustain an earnings capacity that would justify the carrying amount of the investment or a change in the strategic reasonsthat were important when we originally entered into the joint venture. If an other-than-temporary-impairment were to occur, we would measure our investment inthe unconsolidated affiliate at fair value.
Our primary equity method investees include joint ventures in China and India, each of which manufactures boiler parts and equipment. At June 30, 2017 andDecember 31, 2016 , our total investment in these joint ventures was $84.6 million and $98.7 million , respectively. During the second quarter of 2017, both weand our joint venture partner decided to make a strategic change in the Thermax Babcock & Wilcox Energy Solutions Private Limited ("TBWES") joint venturedue to the decline in forecasted market opportunities in India, which reduced the expected recoverable value of our investment in the joint venture. As a result ofthis strategic change, we recognized a $18.2 million other-than-temporary-impairment of our investment in TBWES during the three months ended June 30, 2017 .The impairment charge was based on the difference in the carrying value of our investment in TBWES and our share of the estimated fair value of TBWES's netassets.
15

Table of Contents
NOTE 12 – INTANGIBLE ASSETS
Our intangible assets are as follows:
(in thousands) June 30, 2017 December 31, 2016Definite-lived intangible assets
Customer relationships $ 59,392 $ 47,892Unpatented technology 19,489 18,461Patented technology 6,576 2,499Tradename 22,492 18,774Backlog 30,041 28,170All other 7,521 7,429
Gross value of definite-lived intangible assets 145,511 123,225Customer relationships amortization (20,432) (17,519)Unpatented technology amortization (3,898) (2,864)Patented technology amortization (1,871) (1,532)Tradename amortization (4,447) (3,826)Acquired backlog amortization (26,677) (21,776)All other amortization (6,619) (5,974)
Accumulated amortization (63,944) (53,491)Net definite-lived intangible assets $ 81,567 $ 69,734
Indefinite-lived intangible assets: Trademarks and trade names $ 1,305 $ 1,305
Total indefinite-lived intangible assets $ 1,305 $ 1,305
The following summarizes the changes in the carrying amount of intangible assets:
Six months ended June 30,(in thousands) 2017 2016Balance at beginning of period $ 71,039 $ 37,844Business acquisitions 19,500 —Amortization expense (10,453) (3,133)Currency translation adjustments and other 2,786 319Balance at end of the period $ 82,872 $ 35,030
The acquisition of Universal resulted in an increase in our intangible asset amortization expense during the three and six months ended June 30, 2017 of $0.6million and $2.1 million , respectively, which is included in cost of operations in our condensed consolidated statement of operations. The amortization ofUniversal's intangible assets was highest during the first quarter of 2017 and is expected to decline each subsequent quarter during the year primarily due to theamortization of the backlog intangible asset. Amortization of intangible assets is not allocated to segment results.
16

Table of Contents
Estimated future intangible asset amortization expense, including the increase in amortization expense resulting from the January 11, 2017 acquisition ofUniversal, is as follows (in thousands):
Period ending Amortization expense
Three months ending September 30, 2017 $ 3,739Three months ending December 31, 2017 $ 3,598Twelve months ending December 31, 2018 $ 12,415Twelve months ending December 31, 2019 $ 10,218Twelve months ending December 31, 2020 $ 8,949Twelve months ending December 31, 2021 $ 8,630Twelve months ending December 31, 2022 $ 7,081Thereafter $ 26,937
NOTE 13 – GOODWILL
The following summarizes the changes in the carrying amount of goodwill:
(in thousands) Power Renewable Industrial TotalBalance at December 31, 2016 $ 46,220 $ 48,435 $ 172,740 $ 267,395Increase resulting from Universal acquisition — — 14,413 14,413Currency translation adjustments 783 1,016 4,450 6,249Balance at June 30, 2017 $ 47,003 $ 49,451 $ 191,603 $ 288,057
Our annual goodwill impairment assessment is performed on October 1 of each year (the "annual assessment" date). The Renewable segment's second quarterresults and management changes in our Industrial segment caused us to also evaluate whether goodwill was impaired at June 30, 2017 (the "interim assessment"date).
Our interim assessment for each of our six reporting units indicated that it was not more likely than not that any of our reporting unit's goodwill was impaired. Thefollowing summarizes our reporting units' goodwill balances at June 30, 2017 and the headroom from our interim Step 1 goodwill impairment test, which is theestimated fair value less the carrying value:
(in millions) Power Construction Renewable MEGTEC SPIG UniversalReporting unit headroom 102% 214% 68% 3% <1% 11%Goodwill balance $38.1 $8.9 $49.5 $104.3 $72.9 $14.4
Estimating the fair value of a reporting unit requires significant judgment. The fair value of each reporting unit determined under Step 1 of the goodwillimpairment test was based on a 50% weighting of an income approach using a discounted cash flow analysis based on forward-looking projections of futureoperating results, a 30% to 40% weighting of a market approach using multiples of revenue and earnings before interest, taxes, depreciation and amortization(“EBITDA”) of guideline companies and a 10% to 20% weighting of a market approach using multiples of revenue and EBITDA from recent, similar businesscombinations. As a result of the incurred and accrued contract losses in the Renewable reporting unit, it has a negative carrying value at both the annual and interim assessmentdates. The Step 1 goodwill impairment test indicated there was no impairment of the Renewable reporting unit's goodwill, and its fair value exceeded its carryingvalue by 68% at June 30, 2017. The reporting unit's estimated fair value is most sensitive to changes in the future forecasted results of operations and the discountrate. The rate we used to discount future projected cash flows at the interim assessment date in 2017 was 15% . Reasonable changes in assumptions did not indicateimpairment.
For our MEGTEC reporting unit, which is included in our Industrial segment, the Step 1 goodwill impairment test indicated there was no impairment, and the fairvalue exceeded the carrying value by 3% at June 30, 2017 compared to 22% at October 1, 2016. Under both the income and market valuation approaches, the fairvalue estimates decreased due to lower projected net sales and EBITDA. Similar to many industrial businesses, the reduction in MEGTEC reporting unit revenueshas been the
17

Table of Contents
result of a decline in new equipment demand, primarily in the Americas. However, management believes the industrials market is starting to show signs ofstabilizing as evidenced by the 42% increase in revenues and 31% increase in gross profit during the second quarter of 2017. The estimate of fair value of theMEGTEC reporting unit is sensitive to changes in assumptions, particularly assumed discount rates and projections of future operating results under the incomeapproach. At June 30, 2017, the discount rate used in the income approach was 11% . Absent any other changes, an increase in the discount rate could result infuture impairment of goodwill. Decreases in future projected operating results could also result in future impairment of goodwill.
For our SPIG reporting unit, which is included in our Industrial segment, the Step 1 goodwill impairment test indicated there was no impairment, and the fair valueexceeded the carrying value by less than 1% at June 30, 2017 compared to 5% at October 1, 2016. The small amount of headroom is expected based on the factthat the business was acquired on July 1, 2016. Under both the income and market valuation approaches, the independently obtained fair value estimates decreaseddue to a short-term decrease in profitability attributable to specific contracts. New management coupled with changes in SPIG's contracting process results in thereporting unit's forecasted profitability increasing in future periods. Since October 1, 2016, the reporting unit also has an increased pipeline of opportunities to sellits products and services. The estimate of fair value of the SPIG reporting unit is sensitive to changes in assumptions, particularly assumed discount rates andprojections of future operating results under the income approach. At June 30, 2017, the discount rate used in the income approach was 12.5% . Absent any otherchanges, an increase in the discount rate could result in future impairment of goodwill. Decreases in future projected operating results could also result in futureimpairment of goodwill.
NOTE 14 – PROPERTY, PLANT & EQUIPMENT
Property, plant and equipment is stated at cost. The composition of our property, plant and equipment less accumulated depreciation is set forth below:
(in thousands) June 30, 2017 December 31, 2016Land $ 8,716 $ 6,348Buildings 120,574 114,322Machinery and equipment 203,228 189,489Property under construction 13,447 22,378 345,965 332,537Less accumulated depreciation 201,556 198,900Net property, plant and equipment $ 144,409 $ 133,637
NOTE 15 – WARRANTY EXPENSE
Changes in the carrying amount of our accrued warranty expense are as follows:
Six months ended June 30,(in thousands) 2017 2016Balance at beginning of period $ 40,467 $ 39,847Additions 13,050 9,788Expirations and other changes (3,243) (1,219)Increases attributable to business combinations 1,060 —Payments (7,437) (5,707)Translation and other 1,307 36
Balance at end of period $ 45,204 $ 42,745
18
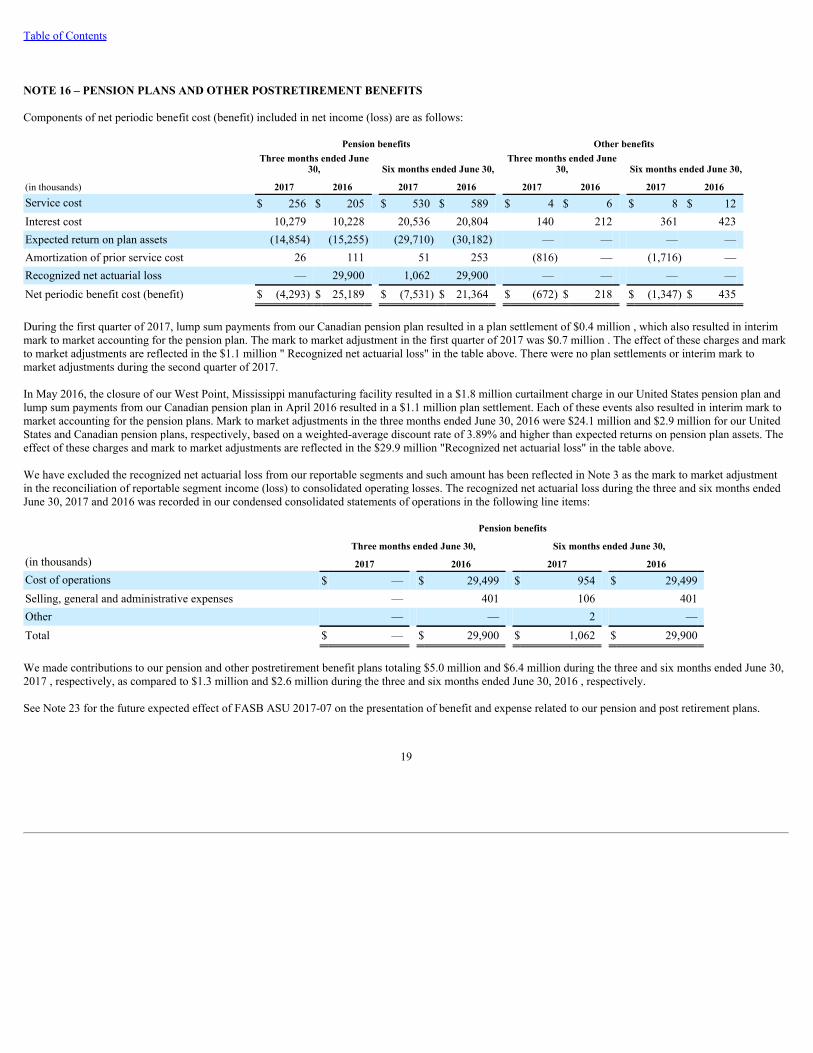
Table of Contents
NOTE 16 – PENSION PLANS AND OTHER POSTRETIREMENT BENEFITS
Components of net periodic benefit cost (benefit) included in net income (loss) are as follows:
Pension benefits Other benefits
Three months ended June
30, Six months ended June 30, Three months ended June
30, Six months ended June 30,
(in thousands) 2017 2016 2017 2016 2017 2016 2017 2016Service cost $ 256 $ 205 $ 530 $ 589 $ 4 $ 6 $ 8 $ 12Interest cost 10,279 10,228 20,536 20,804 140 212 361 423Expected return on plan assets (14,854) (15,255) (29,710) (30,182) — — — —Amortization of prior service cost 26 111 51 253 (816) — (1,716) —Recognized net actuarial loss — 29,900 1,062 29,900 — — — —Net periodic benefit cost (benefit) $ (4,293) $ 25,189 $ (7,531) $ 21,364 $ (672) $ 218 $ (1,347) $ 435
During the first quarter of 2017, lump sum payments from our Canadian pension plan resulted in a plan settlement of $0.4 million , which also resulted in interimmark to market accounting for the pension plan. The mark to market adjustment in the first quarter of 2017 was $0.7 million . The effect of these charges and markto market adjustments are reflected in the $1.1 million " Recognized net actuarial loss" in the table above. There were no plan settlements or interim mark tomarket adjustments during the second quarter of 2017.
In May 2016, the closure of our West Point, Mississippi manufacturing facility resulted in a $1.8 million curtailment charge in our United States pension plan andlump sum payments from our Canadian pension plan in April 2016 resulted in a $1.1 million plan settlement. Each of these events also resulted in interim mark tomarket accounting for the pension plans. Mark to market adjustments in the three months ended June 30, 2016 were $24.1 million and $2.9 million for our UnitedStates and Canadian pension plans, respectively, based on a weighted-average discount rate of 3.89% and higher than expected returns on pension plan assets. Theeffect of these charges and mark to market adjustments are reflected in the $29.9 million "Recognized net actuarial loss" in the table above.
We have excluded the recognized net actuarial loss from our reportable segments and such amount has been reflected in Note 3 as the mark to market adjustmentin the reconciliation of reportable segment income (loss) to consolidated operating losses. The recognized net actuarial loss during the three and six months endedJune 30, 2017 and 2016 was recorded in our condensed consolidated statements of operations in the following line items:
Pension benefits Three months ended June 30, Six months ended June 30,(in thousands) 2017 2016 2017 2016Cost of operations $ — $ 29,499 $ 954 $ 29,499Selling, general and administrative expenses — 401 106 401Other — — 2 —Total $ — $ 29,900 $ 1,062 $ 29,900
We made contributions to our pension and other postretirement benefit plans totaling $5.0 million and $6.4 million during the three and six months ended June 30,2017 , respectively, as compared to $1.3 million and $2.6 million during the three and six months ended June 30, 2016 , respectively.
See Note 23 for the future expected effect of FASB ASU 2017-07 on the presentation of benefit and expense related to our pension and post retirement plans.
19
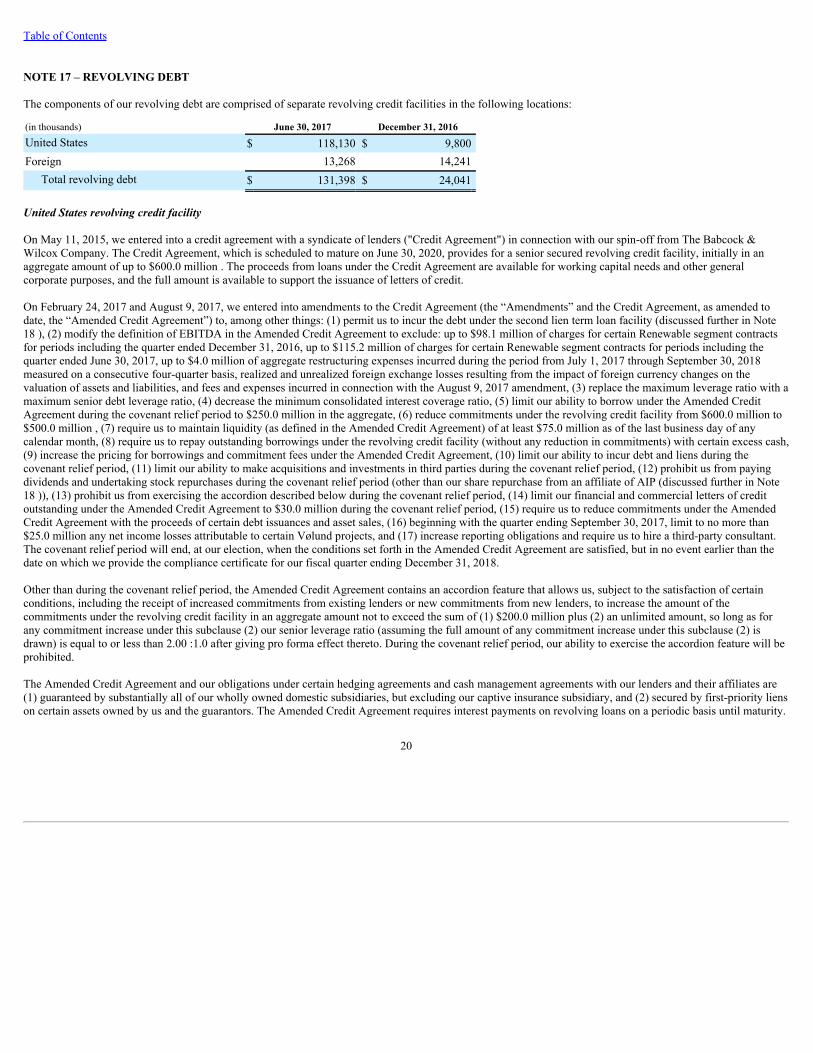
Table of Contents
NOTE 17 – REVOLVING DEBT
The components of our revolving debt are comprised of separate revolving credit facilities in the following locations:
(in thousands) June 30, 2017 December 31, 2016United States $ 118,130 $ 9,800Foreign 13,268 14,241
Total revolving debt $ 131,398 $ 24,041
United States revolving credit facility
On May 11, 2015, we entered into a credit agreement with a syndicate of lenders ("Credit Agreement") in connection with our spin-off from The Babcock &Wilcox Company. The Credit Agreement, which is scheduled to mature on June 30, 2020, provides for a senior secured revolving credit facility, initially in anaggregate amount of up to $600.0 million . The proceeds from loans under the Credit Agreement are available for working capital needs and other generalcorporate purposes, and the full amount is available to support the issuance of letters of credit.
On February 24, 2017 and August 9, 2017, we entered into amendments to the Credit Agreement (the “Amendments” and the Credit Agreement, as amended todate, the “Amended Credit Agreement”) to, among other things: (1) permit us to incur the debt under the second lien term loan facility (discussed further in Note18 ), (2) modify the definition of EBITDA in the Amended Credit Agreement to exclude: up to $98.1 million of charges for certain Renewable segment contractsfor periods including the quarter ended December 31, 2016, up to $115.2 million of charges for certain Renewable segment contracts for periods including thequarter ended June 30, 2017, up to $4.0 million of aggregate restructuring expenses incurred during the period from July 1, 2017 through September 30, 2018measured on a consecutive four-quarter basis, realized and unrealized foreign exchange losses resulting from the impact of foreign currency changes on thevaluation of assets and liabilities, and fees and expenses incurred in connection with the August 9, 2017 amendment, (3) replace the maximum leverage ratio with amaximum senior debt leverage ratio, (4) decrease the minimum consolidated interest coverage ratio, (5) limit our ability to borrow under the Amended CreditAgreement during the covenant relief period to $250.0 million in the aggregate, (6) reduce commitments under the revolving credit facility from $600.0 million to$500.0 million , (7) require us to maintain liquidity (as defined in the Amended Credit Agreement) of at least $75.0 million as of the last business day of anycalendar month, (8) require us to repay outstanding borrowings under the revolving credit facility (without any reduction in commitments) with certain excess cash,(9) increase the pricing for borrowings and commitment fees under the Amended Credit Agreement, (10) limit our ability to incur debt and liens during thecovenant relief period, (11) limit our ability to make acquisitions and investments in third parties during the covenant relief period, (12) prohibit us from payingdividends and undertaking stock repurchases during the covenant relief period (other than our share repurchase from an affiliate of AIP (discussed further in Note18 )), (13) prohibit us from exercising the accordion described below during the covenant relief period, (14) limit our financial and commercial letters of creditoutstanding under the Amended Credit Agreement to $30.0 million during the covenant relief period, (15) require us to reduce commitments under the AmendedCredit Agreement with the proceeds of certain debt issuances and asset sales, (16) beginning with the quarter ending September 30, 2017, limit to no more than$25.0 million any net income losses attributable to certain Vølund projects, and (17) increase reporting obligations and require us to hire a third-party consultant.The covenant relief period will end, at our election, when the conditions set forth in the Amended Credit Agreement are satisfied, but in no event earlier than thedate on which we provide the compliance certificate for our fiscal quarter ending December 31, 2018.
Other than during the covenant relief period, the Amended Credit Agreement contains an accordion feature that allows us, subject to the satisfaction of certainconditions, including the receipt of increased commitments from existing lenders or new commitments from new lenders, to increase the amount of thecommitments under the revolving credit facility in an aggregate amount not to exceed the sum of (1) $200.0 million plus (2) an unlimited amount, so long as forany commitment increase under this subclause (2) our senior leverage ratio (assuming the full amount of any commitment increase under this subclause (2) isdrawn) is equal to or less than 2.00 :1.0 after giving pro forma effect thereto. During the covenant relief period, our ability to exercise the accordion feature will beprohibited.
The Amended Credit Agreement and our obligations under certain hedging agreements and cash management agreements with our lenders and their affiliates are(1) guaranteed by substantially all of our wholly owned domestic subsidiaries, but excluding our captive insurance subsidiary, and (2) secured by first-priority lienson certain assets owned by us and the guarantors. The Amended Credit Agreement requires interest payments on revolving loans on a periodic basis until maturity.
20

Table of Contents
We may prepay all loans at any time without premium or penalty (other than customary LIBOR breakage costs), subject to notice requirements. The AmendedCredit Agreement requires us to make certain prepayments on any outstanding revolving loans after receipt of cash proceeds from certain asset sales or otherevents, subject to certain exceptions and a right to reinvest such proceeds in certain circumstances. During the covenant relief period, such prepayments mayrequire us to reduce the commitments under the Amended Credit Agreement by a corresponding amount of such prepayments. Following the covenant reliefperiod, such prepayments will not require us to reduce the commitments under the Amended Credit Agreement.
After giving effect to Amendments, loans outstanding under the Amended Credit Agreement bear interest at our option at either (1) the LIBOR rate plus 5.0% perannum or (2) the base rate (the highest of the Federal Funds rate plus 0.5% , the one month LIBOR rate plus 1.0% , or the administrative agent's prime rate) plus4.0% per annum. A commitment fee of 1.0% per annum is charged on the unused portions of the revolving credit facility. A letter of credit fee of 2.50% per annumis charged with respect to the amount of each financial letter of credit outstanding, and a letter of credit fee of 1.50% per annum is charged with respect to theamount of each performance and commercial letter of credit outstanding. Additionally, an annual facility fee of $1.5 million is payable on the first business day of2018 and 2019, and a pro rated amount is payable on the first business day of 2020.
The Amended Credit Agreement includes financial covenants that are tested on a quarterly basis, based on the rolling four-quarter period that ends on the last dayof each fiscal quarter. The maximum permitted senior debt leverage ratio as defined in the Amended Credit Agreement is:
• 6.00 :1.0 for the quarter ending September 30, 2017,• 8.50 :1.0 for each of the quarters ending December 31, 2017 and March 31, 2018,• 6.25 :1.0 for the quarter ending June 30, 2018,• 4.00 :1.0 for the quarter ending September 30, 2018,• 3.75 :1.0 for the quarter ending December 31, 2018,• 3.25 :1.0 for each of the quarters ending March 31, 2019 and June 30, 2019, and• 3.00 :1.0 for each of the quarters ending September 30, 2019 and each quarter thereafter.
The minimum consolidated interest coverage ratio as defined in the Credit Agreement is:• 1.50 :1.0 for the quarter ending September 30, 2017,• 1.00 :1.0 for each of the quarters ending December 31, 2017 and March 31, 2018,• 1.25 :1.0 for the quarter ending June 30, 2018,• 1.50 :1.0 for each of the quarters ending September 30, 2018 and December 31, 2018,• 1.75 :1.0 for each of the quarters ending March 31, 2019 and June 30, 2019, and• 2.00 :1.0 for each of the quarters ending September 30, 2019 and each quarter thereafter.
Beginning with September 30, 2017, consolidated capital expenditures in each fiscal year are limited to $27.5 million .
At June 30, 2017 , usage under the Amended Credit Agreement consisted of $118.1 million in borrowings at an effective interest rate of 3.81% , $7.7 million offinancial letters of credit and $93.7 million of performance letters of credit. After giving effect to the August 9, 2017 amendment, at June 30, 2017 , we had $92.1million available for borrowings or to meet letter of credit requirements primarily based on trailing 12 month EBITDA, and our leverage (as defined in theAmended Credit Agreement) ratio was 2.16 and our interest coverage ratio was 5.41 . At June 30, 2017 , we were in compliance with all of the covenants set forthin the Amended Credit Agreement.
Foreign revolving credit facilities
Outside of the United States, we have revolving credit facilities in Turkey, China and India that are used to provide working capital to our operations in eachcountry. These three foreign revolving credit facilities allow us to borrow up to $14.5 million in aggregate and each have a one year term. At June 30, 2017 , wehad $13.3 million in borrowings outstanding under these foreign revolving credit facilities at an effective weighted-average interest rate of 5.1% .
21

Table of Contents
Other credit arrangements
Certain subsidiaries have credit arrangements with various commercial banks and other financial institutions for the issuance of letters of credit and bankguarantees in associated with contracting activity. The aggregate value of all such letters of credit and bank guarantees not secured by the United States revolvingcredit facility as of June 30, 2017 and December 31, 2016 was $273.3 million and $255.2 million , respectively.
We have posted surety bonds to support contractual obligations to customers relating to certain projects. We utilize bonding facilities to support such obligations,but the issuance of bonds under those facilities is typically at the surety's discretion. Although there can be no assurance that we will maintain our surety bondingcapacity, we believe our current capacity is adequate to support our existing project requirements for the next 12 months. In addition, these bonds generallyindemnify customers should we fail to perform our obligations under the applicable contracts. We, and certain of our subsidiaries, have jointly executed generalagreements of indemnity in favor of surety underwriters relating to surety bonds those underwriters issue in support of some of our contracting activity. As ofJune 30, 2017 , bonds issued and outstanding under these arrangements in support of contracts totaled approximately $465.3 million .
NOTE 18 – SECOND LIEN TERM LOAN FACILITY
On August 9, 2017 , we entered into a second lien credit agreement (the "Second Lien Credit Agreement") with an affiliate of American Industrial Partners("AIP"), governing a second lien term loan facility. The second lien term loan facility consists of a second lien term loan in the principal amount of $175.9 million ,all of which we borrowed on August 9, 2017, and a delayed draw term loan facility in the principal amount of up to $20.0 million , which may be drawn in a singledraw prior to June 30, 2020, subject to certain conditions. Borrowings under the second lien term loan, other than the delayed draw term loan, bear interest at 10%per annum, and borrowings under the delayed draw term loan bear interest at 12% per annum, in each case payable quarterly. Undrawn amounts under the delayeddraw term loan accrue a commitment fee at a rate of 0.50% per annum. The second lien term loan has a scheduled maturity of December 30, 2020. Any delayeddraw borrowings would also have a scheduled maturity of December 30, 2020. In connection with our entry into the second lien term loan facility, we used aportion of the proceeds from the second lien term loan to repurchase approximately 4.8 million shares of our common stock (approximately 10% of our sharesoutstanding) held by an affiliate of AIP for approximately $50.9 million , which was one of the conditions precedent for the second lien term loan facility.
Borrowings under the Second Lien Credit Agreement are (1) guaranteed by substantially all of our wholly owned domestic subsidiaries, but excluding our captiveinsurance subsidiary, and (2) secured by second-priority liens on certain assets owned by us and the guarantors. The Second Lien Credit Agreement requiresinterest payments on loans on a periodic basis until maturity. Voluntary prepayments made during the first year after closing are subject to a make-whole premium,voluntary prepayments made during the second year after closing are subject to a a 3.0% premium and voluntary prepayments made during the third year afterclosing are subject to a 2.0% premium. The Second Lien Credit Agreement requires us to make certain prepayments on any outstanding loans after receipt of cashproceeds from certain asset sales or other events, subject to certain exceptions and a right to reinvest such proceeds in certain circumstances, and subject to certainrestrictions contained in an intercreditor agreement among the lenders under the Amended Credit Agreement and the Second Lien Credit Agreement.
The Second Lien Credit Agreement contains representations and warranties, affirmative and restrictive covenants, financial covenants and events of defaultsubstantially similar to those contained in the Amended Credit Agreement, subject to appropriate cushions. The Second Lien Credit Agreement is generally lessrestrictive than the Amended Credit Agreement.
NOTE 19 – CONTINGENCIES
ARPA litigation
On February 28, 2014, the Arkansas River Power Authority ("ARPA") filed suit against Babcock & Wilcox Power Generation Group, Inc. (now known as TheBabcock & Wilcox Company and referred to herein as “BW PGG”) in the United States District Court for the District of Colorado (Case No. 14-cv-00638-CMA-NYW) alleging breach of contract, negligence, fraud and other claims arising out of BW PGG's delivery of a circulating fluidized bed boiler and related equipmentused in the Lamar Repowering Project pursuant to a 2005 contract.
22

Table of Contents
A jury trial took place in mid-November 2016. Some of ARPA’s claims were dismissed by the judge during the trial. The jury’s verdict on the remaining claimswas rendered on November 21, 2016. The jury found in favor of B&W with respect to ARPA’s claims of fraudulent concealment and negligent misrepresentationand on one of ARPA’s claims of breach of contract. The jury found in favor of ARPA on the three remaining claims for breach of contract and awarded damagestotaling $4.2 million , which exceeded the previous $2.3 million accrual we established in 2012 by $1.9 million . We increased our accrual by $1.9 million in thefourth quarter of 2016. At June 30, 2017 and December 31, 2016 , $4.2 million was included in other accrued liabilities in our consolidated balance sheet, and wehave posted a bond pending resolution of post-trial matters.
ARPA also requested that pre-judgment interest of $4.1 million plus post-judgment interest at a rate of 0.77% compounded annually be added to the judgment,together with certain litigation costs. The court granted ARPA $3.7 million of pre-judgment interest on July 21, 2017. We recorded the $3.7 million pre-judgmentinterest payable in our June 30, 2017 condensed consolidated financial statements in other accrued liabilities and interest expense. B&W intends to evaluate itsoptions for appeal.
Stockholder litigation
On March 3, 2017 and March 13, 2017, the Company and certain of its officers were named as defendants in two separate but largely identical complaints allegingviolations of the federal securities laws. The complaints received to date purport to be brought on behalf of a class of investors who purchased the Company'scommon stock between July 1, 2015 and February 28, 2017 and were filed in the United States District Court for the Western District of North Carolina(collectively, the "Stockholder Litigation"). During the second quarter of 2017, the Stockholder Litigation was consolidated into a single action and a lead plaintiffwas selected by the Court. As amended, the complaint now purports to cover investors who purchased shares between June 17, 2015 and February 28, 2017.
The plaintiffs in the Stockholder Litigation allege fraud, misrepresentation and a course of conduct around the facts surrounding certain projects underway in theCompany's Renewable segment, which, according to the plaintiffs, had the effect of artificially inflating the price of the Company’s common stock. The plaintiffsfurther allege that stockholders were harmed when the Company disclosed on February 28, 2017 that it would incur losses on these projects. Plaintiffs seek anunspecified amount of damages.
The Company believes the allegations in the Stockholder Litigation are without merit, and that the outcome of the Stockholder Litigation will not have a materialadverse impact on our consolidated financial condition, results of operations or cash flows.
Other
Due to the nature of our business, we are, from time to time, involved in routine litigation or subject to disputes or claims related to our business activities,including, among other things: performance or warranty-related matters under our customer and supplier contracts and other business arrangements; and workers'compensation, premises liability and other claims. Based on our prior experience, we do not expect that any of these other litigation proceedings, disputes andclaims will have a material adverse effect on our consolidated financial condition, results of operations or cash flows.
NOTE 20 – DERIVATIVE FINANCIAL INSTRUMENTS
Our foreign currency exchange ("FX") forward contracts that qualify for hedge accounting are designated as cash flow hedges. The hedged risk is the risk ofchanges in functional-currency-equivalent cash flows attributable to changes in FX spot rates of forecasted transactions related to long-term contracts. We excludefrom our assessment of effectiveness the portion of the fair value of the FX forward contracts attributable to the difference between FX spot rates and FX forwardrates. At June 30, 2017 and 2016 , we had deferred approximately $(1.3) million and $3.5 million , respectively, of net gains (losses) on these derivative financialinstruments in accumulated other comprehensive income ("AOCI").
At June 30, 2017 , our derivative financial instruments consisted solely of FX forward contracts. The notional value of our FX forward contracts totaled $223.3million at June 30, 2017 with maturities extending to November 2019. These instruments consist primarily of contracts to purchase or sell euros and British poundssterling. We are exposed to credit-related losses in the event of nonperformance by counterparties to derivative financial instruments. We attempt to mitigate thisrisk by using major financial institutions with high credit ratings. The counterparties to all of our FX forward contracts are financial
23

Table of Contents
institutions party to our United States revolving credit facility. Our hedge counterparties have the benefit of the same collateral arrangements and covenants asdescribed under our United States revolving credit facility.
The following tables summarize our derivative financial instruments:
Asset and Liability Derivative(in thousands) June 30, 2017 December 31, 2016Derivatives designated as hedges:
Foreign exchange contracts: Location of FX forward contracts designated as hedges:
Accounts receivable-other $ 2,992 $ 3,805Other assets 69 665Accounts payable 5,214 1,012Other liabilities 60 213
Derivatives not designated as hedges: Foreign exchange contracts:
Location of FX forward contracts not designated as hedges: Accounts receivable-other $ 28 $ 105Other assets 7 —Accounts payable 71 403Other liabilities — 7
The effects of derivatives on our financial statements are outlined below:
Three months ended June 30, Six months ended June 30,
(in thousands) 2017 2016 2017 2016Derivatives designated as hedges: Cash flow hedges
Foreign exchange contracts Amount of gain (loss) recognized in other comprehensive income $ (3,657) $ 847 $ 2,244 4,057
Effective portion of gain (loss) reclassified from AOCI into earnings by location: Revenues 714 1,261 6,002 2,584Cost of operations (49) 10 (46) 33Other-net 885 (578) 492 (620)
Portion of gain (loss) recognized in income that is excluded from effectivenesstesting by location:
Other-net (113) 1,219 (3,519) 1.801
Derivatives not designated as hedges: Forward contracts Loss recognized in income by location:
Other-net $ (36) $ (303) $ (345) $ (413)
NOTE 21 – FAIR VALUE MEASUREMENTS
The following tables summarize our financial assets and liabilities carried at fair value, all of which were valued from readily available prices or using inputs basedupon quoted prices for similar instruments in active markets (known as "Level 1" and
24

Table of Contents
"Level 2" inputs, respectively, in the fair value hierarchy established by the FASB Topic FairValueMeasurementsandDisclosures).
(in thousands) Available-for-sale securities June 30, 2017 Level 1 Level 2 Level 3
Commercial paper $ 7,968 $ — $ 7,968 $ —Certificates of deposit — — — —Mutual funds 1,228 — 1,228 —Corporate bonds — — — —U.S. Government and agency securities 7,343 7,343 — —
Total fair value of available-for-sale securities $ 16,539 $ 7,343 $ 9,196 $ —
(in thousands) Available-for-sale securities December 31, 2016 Level 1 Level 2 Level 3
Commercial paper $ 6,734 $ — $ 6,734 $ —Certificates of deposit 2,251 — 2,251 —Mutual funds 1,152 — 1,152 —Corporate bonds 750 750 — —U.S. Government and agency securities 7,104 7,104 — —
Total fair value of available-for-sale securities $ 17,991 $ 7,854 $ 10,137 $ —
Derivatives June 30, 2017 December 31, 2016Forward contracts to purchase/sell foreign currencies $ (2,248) $ 2,940
Available-for-sale securities
We estimate the fair value of available-for-sale securities based on quoted market prices. Our investments in available-for-sale securities are presented in "otherassets" on our condensed consolidated balance sheets.
Derivatives
Derivative assets and liabilities currently consist of FX forward contracts. Where applicable, the value of these derivative assets and liabilities is computed bydiscounting the projected future cash flow amounts to present value using market-based observable inputs, including FX forward and spot rates, interest rates andcounterparty performance risk adjustments.
Other financial instruments
We used the following methods and assumptions in estimating our fair value disclosures for our other financial instruments:• Cashandcashequivalentsandrestrictedcashandcashequivalents. The carrying amounts that we have reported in the accompanying condensed
consolidated balance sheets for cash and cash equivalents and restricted cash and cash equivalents approximate their fair values due to their highly liquidnature.
• Revolvingdebt. We base the fair values of debt instruments on quoted market prices. Where quoted prices are not available, we base the fair values on thepresent value of future cash flows discounted at estimated borrowing rates for similar debt instruments or on estimated prices based on current yields fordebt issues of similar quality and terms. The fair value of our debt instruments approximated their carrying value at June 30, 2017 and December 31, 2016 .
Non-recurring fair value measurements
The other-than-temporary impairment of our equity method investment in TBWES required significant fair value measurements using unobservable inputs ("Level3" inputs as defined in the fair value hierarchy established by FASB Topic FairValueMeasurementsandDisclosures). We determined the impairment charge byfirst determining an estimate of the price that could be received to sell the assets and transfer the liabilities held by TBWES in an orderly transaction between
25

Table of Contents
market participants at June 30, 2017. The fair value of TBWES's net assets was determined through a combination of the cost approach, a market approach and anincome approach.
The purchase price allocation associated with the January 11, 2017 acquisition of Universal required significant fair value measurements using unobservableinputs. The fair value of the acquired intangible assets was determined using the income approach (see Note 4 ).
The measurement of the net actuarial loss associated with our Canadian pension plan was determined using unobservable inputs (see Note 16 ). These inputsincluded the estimated discount rate, expected return on plan assets and other actuarial inputs associated with the plan participants.
NOTE 22 – SUPPLEMENTAL CASH FLOW INFORMATION
During the six -months ended June 30, 2017 and 2016 , we recognized the following non-cash activity in our condensed consolidated financial statements:
(in thousands) 2017 2016
Accrued capital expenditures in accounts payable $ 703 $ 3,920
NOTE 23 – NEW ACCOUNTING STANDARDS
New accounting standards that could affect our consolidated financial statements in the future are summarized as follows:
In May 2014, the FASB issued ASU 2014-09, RevenuefromContractswithCustomers. The new accounting standard provides a comprehensive model to use inaccounting for revenue from contracts with customers and will replace most existing revenue recognition guidance when it becomes effective. In 2016, the FASBissued accounting standards updates to address implementation issues and to clarify the guidance for identifying performance obligations, licenses; determining ifan entity is the principal or agent in a revenue arrangement; and technical corrections and improvements on topics including: contract costs, loss provisions onconstruction and production contracts and disclosures for remaining and prior-period performance obligations. The new accounting standard also requires moredetailed disclosures to enable financial statement users to understand the nature, amount, timing, and uncertainty of revenue and cash flows arising from contractswith customers. The new accounting standard is effective for interim and annual reporting periods beginning after December 15, 2017, and permits retrospectivelyapplying the guidance to each prior reporting period presented (full retrospective method) or prospectively applying the guidance and providing additionaldisclosures comparing results to previous guidance, with the cumulative effect of initially applying the guidance recognized in beginning retained earnings at thedate of initial application (modified retrospective method). We have developed a cross-functional team of B&W professionals from across each of our reportablesegments and an implementation plan to adopt the new accounting standard. To date, we have analyzed our primary revenue streams and performed a detailedreview of a sample of key contracts representative of our products and services in order to assess potential changes in our processes, systems, internal controls andthe timing and method of revenue recognition and related disclosures. Based on our preliminary assessment, we do not expect the timing of revenue recognition tochange significantly upon adoption of the new accounting standard; however, we are still assessing the impact to process, systems, internal controls anddisclosures. We plan to adopt the new accounting standard on January 1, 2018 under the modified retrospective method. The FASB has issued, and may issue inthe future, interpretative guidance, which may cause our evaluation to change. Our evaluation will include the existing, uncompleted contracts at that time the newaccounting standard is adopted, and as a result, we will not be able to make a final determination about the impact of adopting the new accounting standard untilthe first quarter of 2018.
In January 2016, the FASB issued ASU 2016-1, FinancialInstruments-Overall:RecognitionandMeasurementofFinancialAssetsandFinancialLiabilities. Thenew accounting standard is effective for us beginning in 2018, but early adoption is permitted. The new accounting standard requires investments such asavailable-for-sale securities to be measured at fair value through earnings each reporting period as opposed to changes in fair value being reported in othercomprehensive income. We do not expect the new accounting standard to have a significant impact on our financial results when adopted.
In February 2016, the FASB issued ASU 2016-02, Leases(Topic842). With adoption of this standard, lessees will have to recognize almost all leases as a right-of-use asset and a lease liability on their balance sheet. For income statement purposes, the FASB retained a dual model, requiring leases to be classified as eitheroperating or finance. Classification will be based
26

Table of Contents
on criteria that are similar to those applied in current lease accounting, but without explicit bright lines. The new accounting standard is effective for us beginningin 2019. We do not expect the new accounting standard to have a significant impact on our financial results when adopted.
In August 2016, the FASB issued ASU 2016-15, StatementofCashFlows(Topic230):ClassificationofCertainCashReceiptsandCashPayments . The newguidance is intended to reduce diversity in practice in how certain transactions are classified in the statement of cash flows. Of the eight classification-relatedchanges this new standard will require in the statement of cash flows, only two of the classification requirements are relevant to our historical cash flow statementpresentation (presentation of debt prepayments and presentation of distributions from equity method investees). However, the new classification requirementswould not have changed our historical statement of cash flows. The new standard is effective for us beginning in 2018. We do not plan to early adopt the newaccounting standard because the impact is not expected to be material to our consolidated statement of cash flows when adopted.
In January 2017, the FASB issued ASU 2017-01, BusinessCombinations(Topic805):ClarifyingtheDefinitionofaBusiness.The new guidance clarifies thedefinition of a business in an effort to make the guidance more consistent. The guidance provides a test for determining when a group of assets and businessactivities is not a business, specifically, when substantially all of the fair value of the gross assets acquired or disposed of are concentrated in a single identifiableasset or group of assets, and if inputs and substantive processes that significantly contribute to the ability to create outputs is not present. The new accountingstandard is effective for us beginning in 2018. We do not expect the new accounting standard to have a significant impact on our financial results when adopted.
In January 2017, the FASB issued ASU 2017-04, Intangibles-GoodwillandOther(Topic350):SimplifyingtheTestforGoodwillImpairment.The new guidanceremoves the requirement to compare implied fair value of goodwill with the carrying amount, therefore impairment charges would be recognized immediately bythe amount which carrying value exceeds fair value. The new accounting standard is effective beginning in 2020. We are currently assessing the impact thatadopting this new accounting standard will have on our financial statements.
In March 2017, the FASB issued ASU 2017-07, Compensation-RetirementBenefits(Topic715):ImprovingthePresentationofNetPeriodicBenefitCostandNetPeriodicPostretirementBenefitCost. The new guidance classifies service cost as the only component of net periodic benefit cost presented in cost of operations,whereas the other components will be presented in other income. This will affect not only how we present net periodic benefit cost, but also how we present grossprofit and operating income upon adoption. The new accounting standard is effective for us beginning in 2018. We have assessed the impact of adopting the newstandard on our consolidated statement of operations and determined the required reclassifications will primarily impact our Power segment's gross profit. Thechanges in the classification of the historical components of net periodic benefit costs are summarized in the following table:
Pension & other postretirement benefit costs (benefits)
(in thousands)December 31,
2016December 31,
2015Current
classificationFuture
classificationService cost $ 1,703 $ 13,701 Cost of operations Cost of operationsInterest cost 41,772 50,644 Cost of operations Other income (expense)Expected return on plan assets (61,939) (68,709) Cost of operations Other income (expense)Amortization of prior service cost 250 307 Cost of operations Other income (expense)Recognized net actuarial losses - mark to market adjustments
24,110 40,210 Cost of operations or SG&Aexpenses
Other income (expense)
Net periodic benefit cost (benefit) $ 5,896 $ 36,153
New accounting standards that were adopted during the six months ended June 30, 2017 are summarized as follows:
In the six months ended June 30, 2017 , the Company adopted ASU 2016-09, Compensation-StockCompensation(Topic718):ImprovementstoEmployeeShare-basedPaymentAccounting. This new accounting standard has affected how we account for share-based payments, with the most significant impact being theimpact of income taxes associated with share-based compensation. Subsequent to adoption, the income tax effects related to share-based payments will be recordedas a
27

Table of Contents
component of income tax expense (or benefit) as they occur, rather than being classified as a component of additional paid-in capital. In addition, the effect ofexcess tax benefits will now be presented in the cash flow statement as an operating activity. We prospectively adopted the new accounting standard. See Note 7for the effect on the statement of operations for the three and six months ended June 30, 2017 .
In the six months ended June 30, 2017 , the Company adopted ASU 2015-11, Inventory(Topic330):SimplifyingtheMeasurementofInventory. This newaccounting standard requires that first-in, first-out inventory be measured at the lower of cost or net realizable value. Under GAAP prior to the adoption of this newaccounting standard, inventory was measured at the lower of cost or market, where market was defined as replacement cost, with a ceiling of net realizable valueand a floor of net realizable value minus a normal profit margin. Although this new accounting standard raises the threshold on when charges against inventory canoccur, we do not expect a significant impact because we have not had significant inventory charges in the past. We prospectively adopted the new accountingstandard and it had no impact on our condensed consolidated financial statements for the three or six months ended June 30, 2017 .
NOTE 24 – SUBSEQUENT EVENT
On August 7, 2017, our Board of Directors approved a Key Executive Retention Program (the “KERP”) as a means to maintain continuity of management as theCompany works through its operational challenges. Key members of our management team (other than our CEO) participate in the KERP, and participantsreceived awards payable in both cash and shares of the Company’s common stock. The KERP had no impact on our consolidated financial statements as of June30, 2017.
28

Table of Contents
Item 2. Management's Discussion and Analysis of Financial Condition and Results of Operations
FORWARD-LOOKING STATEMENTS
This report contains forward-looking statements within the meaning of Section 27A of the Securities Act of 1933 and 21E of the Securities Exchange Act of 1934.You should not place undue reliance on these statements. These forward-looking statements include statements that reflect the current views of our seniormanagement with respect to our financial performance and future events with respect to our business and industry in general. Statements that include the words"expect," "intend," "plan," "believe," "project," "forecast," "estimate," "may," "should," "anticipate" and similar statements of a future or forward-looking natureidentify forward-looking statements. Forward-looking statements address matters that involve risks and uncertainties. Accordingly, there are or will be importantfactors that could cause our actual results to differ materially from those indicated in these statements. These factors include the cautionary statements included inthis report and the factors set forth under "Risk Factors" in our Annual Report on Form 10-K for the year ended December 31, 2016 ("Annual Report") filed withthe Securities and Exchange Commission. If one or more events related to these or other risks or uncertainties materialize, or if our underlying assumptions proveto be incorrect, actual results may differ materially from what we anticipate. We assume no obligation to revise or update any forward-looking statement includedin this report for any reason, except as required by law.
OVERVIEW OF RESULTS
In this report, unless the context otherwise indicates, "B&W," "we," "us," "our" and "the Company" mean Babcock & Wilcox Enterprises, Inc. and its consolidatedsubsidiaries. The presentation of the components of our revenues, gross profit and operating income on the following pages of this Management's Discussion andAnalysis of Financial Condition and Results of Operations is consistent with the way our chief operating decision maker reviews the results of operations andmakes strategic decisions about the business.
We generally recognize revenues and related costs from long-term contracts on a percentage-of-completion basis.Accordingly, we review contract price and cost estimates regularly as work progresses and reflect adjustments in profitproportionate to the percentage of completion in the periods in which we revise estimates to complete the contract. To theextent that these adjustments result in a reduction of previously reported profits from a project, we recognize a charge againstcurrent earnings. Changes in the estimated results of our percentage of completion contracts are necessarily based oninformation available at the time that the estimates are made and are based on judgments that are inherently uncertain as theyare predictive in nature. As with all estimates to complete used to measure contract revenue and costs, actual results can anddo differ from our estimates made over time.
In the second quarter of 2017, we incurred $151.0 million of net losses, primarily resulting from a total of $115.2 million in losses in our Renewable segment fromchanges in the estimated revenues and costs to complete six renewable energy contracts in Europe, and a non-cash $18.2 million other-than-temporary-impairmentcharge related to our Power segment's investment in a joint venture in India. The 2017 second quarter charges in our Renewable segment were primarily a result ofscheduling delays and shortcomings in our subcontractors' estimated productivity. During the second quarter of 2016, we recorded a $31.7 million loss from achange in the estimated revenues and costs to complete one renewable energy contract in Europe, which was primarily a result of a change in the estimated cost tocomplete due to a design deficiency that required re-engineering, on-site rework and delivery delays. In the past few quarters, we have made substantialmanagement and process changes in our Renewable segment in response to the loss contracts, including changes in top management. Although we believe that theprovisions we made for our six loss contracts at June 30, 2017 are adequate, given that among other things percentage-of-completion accounting is based onestimates of future activities, revenues and costs, there can be no assurance that future losses will not be required to be recognized with respect to any of ourrenewable energy projects. Going forward, our Renewable segment will focus primarily on its core technologies, with the balance of plant and civil constructionscope being executed by a partner. We believe the new execution model lowers our execution risk and positions us for better profitability in the Renewablesegment, and is more consistent with our company-wide strategy of being an industrial equipment technology and solutions provider.
Our Power segment had strong second quarter 2017 results; however, market trends make for difficult year-over-year comparisons. Early in 2016, we anticipated afuture decline in the coal power generation markets and proactively responded by restructuring our Power segment to help us hold gross margins. Our 2016restructuring was effective, and the Power segment's gross margin percentage has not significantly changed despite the 18% decline in Power segment revenues inthe
29

Table of Contents
second quarter of 2017 compared to the same quarter in 2016. The Power segment also benefited from effective contract execution.
The Industrial segment revenues in the second quarter and first six months of 2017 increased significantly due to the acquisitions of SPIG S.p.A. ("SPIG") andUniversal Acoustic & Emissions Technology, Inc. ("Universal") on July 1, 2016 and January 11, 2017, respectively. Together, the acquisitions contributed $59.2million and $129.6 million of revenue in the second quarter and first six months of 2017, respectively. The acquisitions also benefited the Industrial segment'sgross profit, which helped offset the impact of lower industrial market activity over the past year in the United States. We remain optimistic of cross-sellingopportunities generated by including these new businesses.
Excluding net borrowings on our United States revolving credit facility, we used $6.5 million and $136.4 million of cash in the second quarter and first six monthsof 2017, respectively. Net borrowings from our United States revolving credit facility were $28.1 million and $108.3 million in the second quarter and first sixmonths of 2017, respectively. Our use of cash was primarily to fund progress on our Renewable segment contracts and acquire Universal. We expect ouroperations to use cash over the full year of 2017, particularly in the Renewable segment, as we fund contract losses and work down advanced bill positions. Ourforecasted use of cash in the remainder of 2017 and first half of 2018 is expected to be funded in part through borrowings from our United States revolving creditfacility and second lien term loan.
Year-over-year comparisons of our results were also affected by:
• $4.5 million and $1.6 million of intangible amortization expense in the second quarters of 2017 and 2016, respectively, and $10.5 million and $3.1 millionof expense in the first six months of 2017 and 2016, respectively. We expect intangible amortization expense of $7.3 million in the second half of 2017.We expect $17.8 million of amortization expense in the full year 2017 compared to $19.9 million of amortization in the full year 2016.
• $1.6 million and $4.3 million of restructuring expense was recognized in the second quarter and first six months of 2017, respectively, compared to $30.5million and $32.6 million of restructuring expense in the second quarter and first six months of 2016, respectively, which related to restructuring activitiesannounced in prior years. The actions restructured our business that serves the power generation market in advance of lower demand projected for powergeneration from coal in the United States.
• $0.5 million and $0.9 million and of expense directly related to the spin-off from our former Parent was recognized in the second quarter and first sixmonths of 2017, respectively, compared to $1.1 million and $3.0 million in the second quarter and first six months of 2016, respectively. The costs wereprimarily attributable to employee retention awards.
• $3.7 million of interest payable was awarded by the court based on the outcome of our appeal of the November 21, 2016 Arkansas River Power Authority("ARPA") trial verdict, which was recorded as an increase in interest expense during the second quarter of 2017.
• $0.9 million and $1.9 million of selling, general and administrative ("SG&A") expenses in the second quarters of 2017 and 2016 associated withacquisition and integration costs related to SPIG and Universal, respectively, and $2.9 million and $1.9 million of acquisition and integration costs in thefirst six months of 2017 and 2016, respectively.
• $29.9 million actuarially determined mark to market pension loss in the second quarter of 2016 triggered by the closure of our West Point, Mississippimanufacturing facility in May 2017 that resulted in a curtailment in our United States pension plan and lump sum payments from our Canadian pensionplan in April 2016 that resulted in a plan settlement. $1.1 million of actuarially determined mark to market were recognized in the first six months of2017, which relate to lump sum settlement payments from our Canadian pension plan in the first quarter of 2017.
Our second quarter and year to date segment and other operating results are described in more detail below.
30

Table of Contents
RESULTS OF OPERATIONS
THREE AND SIX MONTHS ENDED JUNE 30, 2017 VS. 2016
Selected financial highlights are presented in the table below:
Three months ended June 30, Six months ended June 30,
(In thousands) 2017 2016 $ Change 2017 2016 $ ChangeRevenues:
Power segment $ 213,756 $ 261,841 $ (48,085) $ 410,052 $ 550,544 $ (140,492)Renewable segment 48,074 85,476 (37,402) 153,610 169,249 (15,639)Industrial segment 90,229 38,005 52,224 182,446 70,471 111,975Eliminations (2,230) (2,114) (116) (5,175) (2,940) (2,235)
349,829 383,208 (33,379) 740,933 787,324 (46,391)Gross profit (loss):
Power segment 49,061 62,475 (13,414) 92,024 122,007 (29,983)Renewable segment (110,894) (17,503) (93,391) (100,300) (4,124) (96,176)Industrial segment 9,464 11,148 (1,684) 24,779 18,904 5,875Intangible amortization expense included in cost of operations (3,453) (569) (2,884) (8,471) (1,080) (7,391)Mark to market adjustments included in cost of operations — (29,499) 29,499 (954) (29,499) 28,545
(55,822) 26,052 (81,874) 7,078 106,208 (99,130)SG&A expenses (67,596) (61,902) (5,694) (133,518) (119,610) (13,908)Restructuring activities and spin-off transaction costs (2,103) (31,616) 29,513 (5,135) (35,626) 30,491Research and development costs (2,901) (3,070) 169 (5,163) (5,912) 749Intangible amortization expense included in SG&A (988) (1,026) 38 (1,982) (2,053) 71Mark to market adjustment included in SG&A — (401) 401 (106) (401) 295Equity in income (loss) of investees 2,961 (616) 3,577 3,579 2,060 1,519Impairment of equity method investment (18,193) — (18,193) (18,193) — (18,193)Gains (losses) on asset disposals, net (4) (6) 2 (4) 15 (19)
Operating income (loss) $ (144,646) $ (72,585) $ (72,061) $ (153,444) $ (55,319) $ (98,125)
Beginning with the quarter ended September 30, 2017, the Industrial Steam product line currently included in our Power segment will be reclassified to theIndustrial segment to align with management changes that became effective on July 1, 2017.
Condensed and consolidated results of operations
ThreemonthsendedJune30,2017vs.2016
Revenues decreased by $33.4 million to $349.8 million in the second quarter of 2017 as compared to $383.2 million in the second quarter of 2016 due primarily toanticipated decreases in construction activities associated with new build and retrofit projects in the Power segment and a decrease in the revenue recognized in theRenewable segment resulting from ongoing performance challenges on six of our renewable energy contracts. These declines are partially offset by the increase inrevenue in the Industrial segment resulting from the acquisitions of SPIG on July 1, 2016 and Universal on January 11, 2017.
In the second quarter of 2017 we had a consolidated gross loss of $55.8 million , which compares to gross profit of $26.1 million in the second quarter of 2016, adecrease of $81.9 million . The primary drivers of the decrease were the six uncompleted European loss contracts in the Renewable segment (see Note 5 in thecondensed consolidated financial
31

Table of Contents
statements) and the impact of the decline in the Power segment's revenues, which were partially offset by gross profit contributions from the SPIG and Universalacquisitions. Intangible asset amortization expense is discussed in further detail in the sections below.
Excluding amortization of intangible assets and pension mark to market adjustments, SG&A expenses were $5.7 million higher in the second quarter of 2017,primarily related to adding the SPIG and Universal businesses and ongoing project support activities in the Renewable segment, partially offset by savings fromour 2016 restructuring actions. Intangible asset amortization expense and pension mark to market adjustments are discussed in further detail in the sections below.
Equity in income of investees in the second quarter of 2017 includes a $18.2 million other-than-temporary-impairment of our investment in Thermax Babcock &Wilcox Energy Solutions Private Limited ("TBWES"). The impairment charge was a result of the strategic change we and our joint venture partner have made dueto the decline in forecasted market opportunities in India, which is discussed in further detail the following sections. Excluding the impairment, equity in income ofinvestees increased $3.6 million to $3.0 million in the second quarter of 2017 compared to a loss of $0.6 million in the second quarter of 2016, primarilyattributable to the improvement in our joint ventures' project performance and cost management.
SixmonthsendedJune30,2017vs.2016
Revenues decreased by $46.4 million to $740.9 million in the first six months of 2017 as compared to $787.3 million for the corresponding six month period in2016. The primary decreases were in construction activities associated with new build and retrofit projects in the Power segment and a decrease in the revenuerecognized in the Renewable segment resulting from ongoing performance challenges on six of our renewable energy contracts. These declines were partiallyoffset by the increase in revenue in the Industrial segment resulting from the acquisitions of SPIG and Universal.
Gross profit decreased by $99.1 million to $7.1 million in the six months ended June 30, 2017 as compared to $106.2 million in the corresponding period in 2016.The primary drivers of the decrease were the six uncompleted European loss contracts in the Renewable segment (see Note 5 in the condensed consolidatedfinancial statements) and the impact of the decline in the Power segment's revenues, which were partially offset by gross profit contributions from the SPIG andUniversal acquisitions. Intangible asset amortization expense is discussed in further detail in the sections below.
Excluding amortization of intangible assets and pension mark to market adjustments, SG&A expenses increased by $13.9 million in the first six months of 2017 ascompared to $119.6 million in the corresponding six month period in 2016, primarily related to adding the SPIG and Universal businesses and ongoing projectsupport activities in the Renewable segment, partially offset by savings from our 2016 restructuring actions. Intangible asset amortization expense and pensionmark to market adjustments are discussed in further detail in the sections below.
Equity in income of investees during the first six months of 2017 includes a $18.2 million other-than-temporary-impairment of our investment in TBWESdescribed above. Excluding the impairment, equity in income of investees increased $1.5 million , to $3.6 million in the six months ended June 30, 2017 ascompared to $2.1 million in the corresponding period in 2016. The increase in equity income of investees in the first six months of 2017 is primarily attributable tothe improvement in our joint ventures' project performance and cost management.
Power
Three months ended June 30, Six months ended June 30,
(In thousands) 2017 2016 $ Change 2017 2016 $ ChangeRevenues $ 213,756 $ 261,841 $ (48,085) $ 410,052 $ 550,544 $ (140,492)Gross profit $ 49,061 $ 62,475 $ (13,414) $ 92,024 $ 122,007 $ (29,983)Gross margin % 23% 24% 22% 22%
ThreemonthsendedJune31,2017vs.2016
Revenues decreased 18% , or $48.1 million , to $213.8 million in the second quarter of 2017, compared to $261.8 million in the corresponding quarter in 2016. Therevenue decrease is attributable to the anticipated decline in the coal power generation market that impacted all of our Power segment product and service lines.We resized our business in anticipation of these
32

Table of Contents
declines with our 2016 restructuring actions. Compared to the second quarter of 2016, the primary decrease in revenues in the second quarter of 2017 wasattributable to a $61.0 million decline in new build utility and environmental equipment and retrofit projects primarily due to a decrease in construction activity.Offsetting those declines was a $18.1 million increase in industrial steam generation revenues in the second quarter of 2017 compared to the corresponding quarterin 2016.
Gross profit decreased 21% , or $13.4 million , to $49.1 million in the quarter ended June 30, 2017 , compared to gross profit of $62.5 million in the correspondingquarter in 2016. We were able to maintain our gross margin percentage as a result of the 2016 restructuring actions, which partially offset the gross profit effect oflower sales volumes. Compared to the second quarter of 2016, the primary decrease in gross profit in the second quarter of 2017 was attributable to the decrease ingross profit from a lower volume of construction activity associated with new build utility and environmental equipment and retrofits projects.
SixmonthsendedJune30,2017vs.2016
Revenues decreased 26% , or $140.5 million , to $410.1 million in the first six months of 2017, compared to $550.5 million in the corresponding six month periodin 2016. The revenue decrease is attributable to the anticipated decline in the coal power generation market discussed above. Compared to the first six months of2016, the primary decrease in revenues in the first six months of 2017 was attributable to a $149.3 million decline new build utility and environmental equipmentand retrofit projects primarily due to a decrease in construction activity. Offsetting those declines was a $16.1 million increase in industrial steam generationrevenues in the first six months of 2017 compared to the corresponding six month period in 2016.
Gross profit decreased 25% , or $30.0 million , to $92.0 million in the first six months of 2017, compared to $122.0 million in the corresponding six month periodin 2016. We were able to maintain our gross margin percentage as a result of the 2016 restructuring actions, which partially offset the gross profit effect of lowersales volumes. Compared to the first six months of 2016, the primary decrease in gross profit in the first six months of 2017 was attributable to the decrease ingross profit from a lower volume of construction activity associated with new build utility and environmental equipment and retrofits projects.
Renewable
Three months ended June 30, Six months ended June 30,
(In thousands) 2017 2016 $ Change 2017 2016 $ ChangeRevenues $ 48,074 $ 85,476 $ (37,402) $ 153,610 $ 169,249 $ (15,639)Gross profit (loss) $ (110,894) $ (17,503) $ (93,391) $ (100,300) $ (4,124) $ (96,176)Gross margin % (231)% (20)% (65)% (2)%
ThreemonthsendedJune30,2017vs.2016
Revenues decreased 44% , or $37.4 million , to $48.1 million in the second quarter of 2017, compared to $85.5 million in the corresponding quarter in 2016. Thenumber of contracts and level of activity in the segment during the second quarter of 2017 and 2016 were comparable. The $37.4 million decrease in revenue in thesecond quarter of 2017 was primarily attributable to revisions in our estimates of progress and estimated liquidated damages on six of our renewable energycontracts.
Gross profit decreased $93.4 million , to a loss of $110.9 million in the second quarter of 2017, compared to a loss of $17.5 million in the corresponding quarter in2016. The decrease was primarily a result of six renewable energy loss contracts that remained uncompleted as of June 30, 2017 . Changes in estimates to completeour renewable energy contracts resulted in a $115.2 million charge during the second quarter of 2017 due to revisions in the estimated revenues and costs atcompletion during the period, primarily as a result of scheduling delays and shortcomings in our subcontractors estimated productivity. The loss contracts are notexpected to contribute any gross profit to the Renewable segment throughout 2017 unless there are revisions to our estimated revenues or costs at completion infuture periods.
During the second quarter of 2016, we recorded a $31.7 million loss from a change in the estimated revenues and costs to complete one renewable energy contractin Europe, which included a reduction in revenue of $6.8 million for anticipated liquidated damages. The 2016 second quarter charges were primarily a result of achange in the estimated cost to complete due to a design deficiency that required re-engineering, on-site rework and delivery delays.
33

Table of Contents
See Note 5 in the condensed consolidated financial statements for additional information on the impact of the segment's renewable energy contracts on our resultsof operations in the second quarters of 2017 and 2016.
SixmonthsendedJune30,2017vs.2016
Revenues decreased 9% in the first six months of 2017 to $153.6 million , compared to $169.2 million in the corresponding six month period in 2016. The numberof contracts and level of activity in the segment during the first six months of 2017 and 2016 were comparable.
Gross profit decreased in the first six months of 2017 to a loss of $100.3 million , compared to a loss of $4.1 million in the corresponding six month period in 2016.Changes in estimates to complete our renewable energy contracts resulted in a $112.2 million charge during the first six months of 2017 due to the same reasonsnoted above.
Industrial
Three months ended June 30, Six months ended June 30,
(In thousands) 2017 2016 $ Change 2017 2016 $ ChangeRevenues $ 90,229 $ 38,005 $ 52,224 $ 182,446 $ 70,471 $ 111,975Gross profit $ 9,464 $ 11,148 $ (1,684) $ 24,779 $ 18,904 $ 5,875Gross margin % 10% 29% 14% 27%
ThreemonthsendedJune30,2017vs.2016
Revenues increased 137% , or $52.2 million , to $90.2 million in the second quarter of 2017, compared to $38.0 million in the corresponding quarter in 2016. Theincrease in revenues in the Industrial segment is attributable to the acquisitions of SPIG on July 1, 2016 and Universal on January 11, 2017, which together added$59.2 million of revenue in the second quarter of 2017. Partially offsetting the revenue contribution from businesses acquired after June 30, 2016 were lowerenvironmental solutions, engineered products and aftermarket parts and services sales volumes in the second quarter of 2017 compared to the correspondingquarter in 2016. However, management believes the industrial market is starting to show signs of stabilizing as evidenced by the increase in revenues and grossprofit during the second quarter of 2017 compared to the first quarter of 2017.
Gross profit decreased 15% , or $1.7 million , to $9.5 million in the second quarter of 2017, compared to $11.1 million in the corresponding quarter in 2016. Theacquisitions of SPIG and Universal contributed $2.0 million of gross profit in the second quarter of 2017. Offsetting the gross profit contribution from businessesacquired after June 30, 2016 was less gross profit from lower sales volumes discussed above; however, the gross margin percentage associated with sales ofenvironmental solutions, engineered products and aftermarket parts and services was consistent with the corresponding quarter in 2016. The year-over-yearvariance of gross margins also reflects product mix, as new build cooling system projects generally have lower margins than other products and services in thesegment. Also affecting the Industrial segment's gross margin percentage in the second quarter of 2017 was productivity issues on new build cooling systemprojects. The productivity issues caused us to increase project cost estimates and deploy additional resources to complete the projects on time. We have appointednew leadership and deployed additional resources to complete these projects on schedule.
SixmonthsendedJune30,2017vs.2016
Revenues increased 159% , or $112.0 million , to $182.4 million in the first six months of 2017, compared to $70.5 million in the corresponding six month periodin 2016. The increase in revenues in the Industrial segment is attributable to the SPIG and Universal acquisitions, which together added $129.6 million of revenuein the first six months of 2017. Partially offsetting the revenue contribution from businesses acquired after June 30, 2016 were lower environmental solutions,engineered products and aftermarket parts and services sales volumes in the first six months of 2017 compared to the corresponding six month period in 2016.
Gross profit increased 31% , or $5.9 million , to $24.8 million in the first six months of 2017, compared to $18.9 million in the corresponding six month period in2016. The acquisitions of SPIG and Universal contributed $11.6 million of gross profit in the first six months of 2017. Offsetting the gross profit contribution frombusinesses acquired after June 30, 2016 was less gross profit from lower sales volumes discussed above; however, the gross margin percentage associated withsales of
34

Table of Contents
environmental solutions, engineered products and aftermarket parts and services was consistent with the corresponding six month period in 2016. The year-over-year variance of gross margins also reflects product mix, as new build cooling system projects generally have lower margins than other products and services in thesegment. Also affecting the Industrial segment's gross margin percentage in the first six months of 2017 were productivity issues on new build cooling systemprojects discussed above.
Bookings and backlog
Bookings and backlog are not measures recognized by generally accepted accounting principles. It is possible that our methodology for determining bookings andbacklog may not be comparable to methods used by other companies.
We generally include expected revenue from contracts in our backlog when we receive written confirmation from our customers authorizing the performance ofwork and committing the customers to payment for work performed. Backlog may not be indicative of future operating results, and projects in our backlog may becanceled, modified or otherwise altered by customers. Additionally, because we operate globally, our backlog is also affected by changes in foreign currencies eachperiod. We do not include orders of our unconsolidated joint ventures in backlog.
Bookings represent additions to our backlog. We believe comparing bookings on a quarterly basis or for periods less than one year is less meaningful than forlonger periods, and that shorter term changes in bookings may not necessarily indicate a material trend.
Three months ended June 30, Six months ended June 30,(In millions) 2017 2016 2017 2016Power $177 $161 $353 $425Renewable 15 21 51 125Industrial 155 31 260 64Other/eliminations (37) — (37) —
Bookings $310 $213 $627 $614
(In approximate millions) June 30, 2017 December 31, 2016 June 30, 2016Power $562 $618 $688Renewable 1,137 1,241 1,414Industrial 318 216 60Other/eliminations (37) (3) (8)
Backlog $1,980 $2,072 $2,154
Of the backlog at June 30, 2017 , we expect to recognize revenues as follows:
(In approximate millions) 2017 2018 Thereafter TotalPower $259 $171 $132 $562Renewable 222 218 697 1,137Industrial 161 52 105 318Other/eliminations (2) (27) (8) (37)
Backlog $640 $414 $926 $1,980
SG&A expenses
SG&A expenses, excluding intangible asset amortization expense and pension mark to market adjustments, increased by $5.7 million to $67.6 million in thesecond quarter of 2017, as compared to $61.9 million in the second quarter of 2016. The primary reasons for the increase are the $8.2 million increase resultingfrom the SPIG and Universal acquisitions, a $6.2 million increase in the Renewable segment associated with ongoing project support activities and $0.9 million ofSPIG and Universal acquisition and integration related expenses. Partially offsetting these increases is a $10.4 million reduction in the Power segment's SG&Aexpenses during the second quarter of 2017 resulting from our 2016 restructuring actions.
35
Table of Contents
SG&A expenses, excluding intangible asset amortization expense and pension mark to market adjustments, increased by $13.9 million in the first six months of2017 to $133.5 million , as compared to $119.6 million in the first six months of 2016. The primary reasons for the increase are the $16.3 million increase resultingfrom the SPIG and Universal acquisitions, a $10.2 million increase in the Renewable segment associated with ongoing project support activities and $2.2 million ofSPIG and Universal acquisition and integration related expenses. Partially offsetting these increases is a $17.2 million reduction in the Power segment's SG&Aexpenses during the first six months of 2017 resulting from our 2016 restructuring actions.
Research and development expenses
Research and development expenses relate to the development and improvement of new and existing products and equipment, as well as conceptual andengineering evaluation for translation into practical applications. These expenses were $2.9 million and $3.1 million for the quarter ended June 30, 2017 and 2016 ,respectively, and $5.2 million and $5.9 million for the six months ended June 30, 2017 and 2016 , respectively. We continuously evaluate each research anddevelopment project and collaborate with our business teams to ensure that we believe we are developing technology and products that are currently desired by themarket and will result in future sales.
Restructuring
We have engaged in a series of restructuring activities, which were intended to help us maintain margins, make our costs more variable and allow our business tobe more flexible. We made our manufacturing costs more volume-variable through the closure of manufacturing facilities and development of manufacturingarrangements with third parties. Also, we made our cost of engineering and supply chain more variable by creating a matrix organization capable of deliveringproducts across multiple segments, and developing more volume-variable outsourcing arrangements with our joint venture partners and other third parties to meetfluctuating demand. This new matrix organization and operating model required different competencies and, in some cases, changes in leadership. While primarilyapplicable to our Power segment, our restructuring actions also benefit the Renewable and Industrial segments to a lesser degree. As demonstrated in our segmentgross margin percentages, notwithstanding the challenges in our Renewable segment, we have achieved our objective of maintaining gross margins. Quantificationof cost savings, however, is significantly dependent upon volume assumptions that have changed since the restructuring actions were initiated.
2016Restructuringactivities
On June 28, 2016, we announced actions to restructure our power business in advance of lower projected demand for power generation from coal in the UnitedStates. These restructuring actions were primarily in the Power segment. Additionally, we announced leadership changes on December 6, 2016, which included thedeparture of members of management in our Renewable segment. The costs associated with these restructuring activities were $2.2 million and $3.6 million in thesecond quarter and first six months of 2017, respectively, and were primarily related to $1.0 million of employee severance in the second quarter of 2017 and $2.0million of employee severance in the first six months of 2017. This compares to the $29.4 million of charges in the second quarter and first six months of 2016,which consisted of $13.5 million of employee severance costs, a $14.6 million non-cash impairment of the long-lived assets at B&W's one coal power plant and$1.3 million of costs related to organizational realignment of personnel and processes. We expect additional restructuring charges of up to $1.6 million , primarilyrelated to additional manufacturing facility consolidation initiatives that could extend through 2017.
Pre-2016restructuringactivities
Previously announced restructuring initiatives intended to better position us for growth and profitability have primarily been related to facility consolidation andorganizational efficiency initiatives. Theses costs (benefits) were $(0.6) million and $1.1 million in the second quarter of 2017 and 2016, respectively. These costswere $0.6 million and $3.0 million in the first six months of 2017 and 2016, respectively. We expect nominal additional restructuring charges during 2017,primarily related to facility demolition and consolidation activities.
Spin-offtransactioncosts
Spin-off costs were primarily attributable to employee retention awards directly related to the spin-off from our former parent, The Babcock & Wilcox Company(now known as BWX Technologies, Inc.). In the second quarter and first six months of 2017, we recognized spin-off costs of $0.5 million and $0.9 million ,respectively. In the second quarter and first
36

Table of Contents
six months of 2016, we recognized spin-off costs of $1.1 million and $3.0 million , respectively. In the second quarter of 2017, we disbursed $1.9 million of theaccrued retention awards. Approximately $ 0.7 million of such costs remain, which we expect to be recognized over the next 12 months.
Equity in income (loss) of investees
Our primary equity method investees included joint ventures in China and India, each of which manufactures boiler parts and equipment. Excluding theimpairment described below, Equity in income of investees in the second quarter of 2017 increased $3.6 million to $3.0 million compared to a loss of $0.6 millionin the second quarter of 2016. The increase in equity income of investees in the second quarter of 2017 is attributable primarily to the joint ventures' projectperformance. Partially offsetting the increase is the December 22, 2016 sale of all of our interest in our former Australian joint venture, Halley & Mellowes Pty.Ltd. ("HMA"). HMA contributed $0.4 million and $0.9 million to our equity in income of investees in the first quarter of 2016 and the first six months of 2016,respectively.
At June 30, 2017, our total investment in equity method investees was $84.6 million , which included a $55.9 million investment in Babcock & Wilcox BeijingCompany, Ltd. ("BWBC"). Based in China, BWBC designs, manufactures and sells various power plant boilers and related aftermarket equipment. BWBC hasbeen profitable historically, and we have determined that no other-than-temporary-impairment has occurred based on the value of its cash on hand, long-livedassets and expected future cash flows.
Our investment in equity method investees also included a investment in TBWES, which has a manufacturing facility intended primarily for new build coal boilerprojects in India. During the second quarter of 2017, both we and our joint venture partner decided to make a strategic change in the Indian joint venture due to thedecline in forecasted market opportunities in India, which reduced the expected recoverable value of our investment in the joint venture. As a result of this strategicchange, we recognized a $18.2 million other-than-temporary-impairment of our investment in TBWES. The impairment charge was based on the difference in thecarrying value of our investment in TBWES and our share of the estimated fair value of TBWES's net assets. After recording the impairment charge, our remaininginvestment in TBWES at June 30, 2017 was $26.1 million . We assess our investments in unconsolidated affiliates for other-than-temporary-impairment when significant changes occur in the investee's business or ourinvestment philosophy. Such changes might include a series of operating losses incurred by the investee that are deemed other than temporary, the inability of theinvestee to sustain an earnings capacity that would justify the carrying amount of the investment or a change in the strategic reasons that were important when weoriginally entered into the joint venture. If an other-than-temporary-impairment were to occur, we would measure our investment in the unconsolidated affiliate atfair value.
Intangible asset amortization expense
We recorded $4.5 million and $1.6 million of intangible amortization expense during the second quarters of 2017 and 2016, respectively, and $10.5 million and$3.1 million of expense during the first six months of 2017 and 2016, respectively. The increase in amortization expense is attributable to our last two businesscombinations, which increased our intangible assets by $74.7 million.
We acquired $55.2 million of intangible assets in the July 1, 2016 acquisition of SPIG. Amortization of the SPIG intangible assets resulted in $5.4 million ofexpense during the first six months of 2017, and $2.4 million during the second quarter of 2017. We expect the amortization expense associated with SPIG'sintangible assets will be $3.3 million in the second half of 2017.
We acquired $19.5 million of intangible assets in the January 11, 2017 acquisition of Universal. Amortization of the Universal intangible assets resulted in $2.1million of expense during the first six months of 2017, and $0.6 million in the second quarter of 2017. We expect the amortization expense associated withUniversal's intangible assets will be $1.0 million in the second half of 2017.
We expect total intangible amortization expense of $7.3 million in the second half of 2017.
37

Table of Contents
Market to market adjustments
During the first quarter of 2017, lump sum payments from our Canadian pension plan resulted in a plan settlement of $0.4 million and an interim mark to marketloss of $0.7 million . The $1.1 million charge during the first quarter of 2017 is not necessarily representative of future interim accounting adjustments as suchevents are not currently predicted and interim measurement of mark to market adjustments are subject to then current actuarial assumptions. There was no mark tomarket gain or loss associated with our pension and other postretirement benefit plans in the second quarter of 2017.
In May 2016, the closure of our West Point, Mississippi manufacturing facility resulted in a $1.8 million curtailment charge in our United States pension plan andlump sum payments from our Canadian pension plan in April 2016 resulted in a $1.1 million plan settlement. Each of these events also resulted in interim mark tomarket accounting for the pension plans. Mark to market adjustments in the second quarter of 2016 were $24.1 million and $2.9 million for our United States andCanadian pension plans, respectively, based on a weighted-average discount rate of 3.89% and higher than expected returns on pension plan assets. The effect ofthese charges and mark to market adjustments are reflected in the $29.9 million recognized net actuarial loss in the second quarter of 2016.
Provision for income taxes
Three months ended June 30, Six months ended June 30,
(In thousands) 2017 2016 $ Change 2017 2016 $ ChangeIncome (loss) before income taxes $ (148,888) $ (72,433) $ (76,455) $ (159,696) $ (55,214) $ (104,482)Income tax expense (benefit) $ 1,962 $ (9,033) $ 10,995 $ (2,005) $ (2,407) $ 402
Effective tax rate (1.3)% 12.5% 1.3% 4.4%
We operate in numerous countries that have statutory tax rates below that of the United States federal statutory rate of 35%. The most significant of these foreignoperations are located in Canada, Denmark, Germany, Italy, Mexico, Sweden and the United Kingdom with effective tax rates ranging between 19% andapproximately 30%. In addition, the jurisdictional mix of our income (loss) before tax can be significantly affected by mark to market adjustments related to ourpension and postretirement plans, which have been primarily in the United States, and the impact of discrete items.
Income (loss) before the provision for income taxes generated in the United States and foreign locations for the quarters ended June 30, 2017 and 2016 is presentedin the table below.
Three months ended June 30, Six months ended June 30,
(In thousands) 2017 2016 2017 2016United States $ (28,742) $ (40,754) $ (37,417) $ (29,826)Other than United States (120,146) (31,679) (122,279) (25,388)
Income (loss) before income taxes $ (148,888) $ (72,433) $ (159,696) $ (55,214)
We had tax expense in the second quarter of 2017 which resulted in a 1.3% effective tax rate as compared to a tax benefit in the second quarter of 2016 whichresulted in a 12.5% effective tax rate. Our effective tax rate for the second quarter of 2017 was lower than our statutory rate primarily due to foreign losses in ourRenewable segment that are subject to a valuation allowance, nondeductible expenses and unfavorable discrete items of $3.2 million . The discrete items includewithholding tax on a forecasted distribution outside the US, partly offset by favorable adjustments to prior year foreign tax returns and the effect of vested andexercised share-based compensation awards. The tax benefit associated with the $18.2 million impairment of our equity method investment in India was offset by avaluation allowance. Our effective tax rate for the second quarter of 2016 was lower than our statutory rate primarily due to a $13.1 million increase in valuationallowances against deferred tax assets related to our equity investment in a foreign joint venture and state net operating losses, and to changes in the jurisdictionalmix of our forecasted full year income and losses, which were significantly affected by the mid-year mark to market adjustments, and the charge from therenewable energy contact in Europe.
Our effective rate for the first six months of 2017 was approximately 1.3% as compared to 4.4% for the first six months of 2016. Our effective tax rate for the firstsix months of 2017 was lower that our statutory rate primarily due to the reasons noted above and nondeductible transaction costs, which were offset by the effectof vested and exercised share-based
38

Table of Contents
compensation awards, both of which were discrete items in the first quarter of 2017. Our effective tax rate for the first six months of 2016 was lower than ourstatutory rate primarily due to a $13.1 million increase in valuation allowances associated with deferred tax assets related to our equity investment in a foreign jointventure and state net operating losses, and to the jurisdictional mix of our forecasted full year income and losses, as described above.
Liquidity and capital resources
In general, our foreign cash balances are not available to fund our United States operations unless the funds are repatriated or used to repay intercompany loansmade from the United States to foreign entities, which could expose us to taxes we presently have not made a provision for in our results of operations. $64.4million of our $67.9 million of unrestricted cash and cash equivalents at June 30, 2017 was held by foreign entities. We presently have no plans to repatriate thesefunds to the United States as we believe that our United States liquidity is sufficient to meet the anticipated cash requirements of our United States operations.
Historically, our primary sources of liquidity have been cash from operations, borrowings under our United States revolving credit facility and borrowings underforeign revolving credit facilities. Our borrowing capacity under our United States revolving credit facility is primarily limited by the financial covenants, whichare most significantly affected by our trailing 12 months EBITDA (as defined in the credit agreement governing the facility). The significant loss accruals werecorded in the second quarter of 2017 and the fourth quarter of 2016 reduced our trailing 12 months EBITDA and, in turn, our ability to comply with our financialcovenants. Accordingly, we amended our credit agreement in February and August 2017 to, among other things, provide covenant relief.
To provide additional liquidity, we entered into a second lien term loan facility on August 9, 2017 with an affiliate of American Industrial Partners (“AIP”). Thesecond lien term loan facility consists of a second lien term loan in the principal amount of $175.9 million , all of which we borrowed on August 9, 2017 , and adelayed draw term loan in the principal amount of $20.0 million, which may be drawn in a single draw prior to June 30, 2020, subject to certain conditions. Weused approximately $125.0 million of the second lien term loan proceeds to repay borrowings outstanding under our United States revolving credit facility and payfees and expenses related to the second lien term loan facility and the amendment of our United States revolving credit facility. The balance of the second lien termloan proceeds were used to repurchase approximately 4.8 million shares of our common stock held by an affiliate of AIP for approximately $50.9 million , whichwas one of the conditions precedent for the second lien term loan facility.
After giving effect to the amendments to our credit agreement, we had approximately $92.1 million of availability under our United States revolving credit facilityas of June 30, 2017. Based on the amended United States revolving credit and second lien term loan facilities, we believe we have adequate sources of liquidity atJune 30, 2017 to meet our cash requirements. Our assessment is based on our operating forecast, backlog, cash on-hand, borrowing capacity, planned capitalinvestments and ability to manage future discretionary cash outflows during the next 12 month period. We expect our operations to use cash over the full year of2017 and into the first half of 2018, particularly in the Renewable segment, as we fund contract losses and work down advanced bill positions. Our forecasted useof cash over the next 12 months is expected to be funded in part through borrowings from our United States revolving credit facility. Our United States revolvingcredit facility allows for nearly immediate borrowing of available capacity to fund cash requirements in the normal course of business, meaning that the minimumUnited States cash on hand is maintained to minimize borrowing costs. After giving effect to the $50.0 million of unrestricted cash on hand required under ourfinancial covenants, we expect to have between $40.0 million and $175.0 million of available borrowing capacity from our United States revolving credit facilityduring the next 12 months based on our forecast of the trailing 12 month EBITDA calculation. We expect cash and cash equivalents, cash flows from operations,and our borrowing capacity under our United States revolving credit facility to be sufficient to meet our liquidity needs for at least 12 months from the date of thisfiling.
Our net cash used in operations was $81.7 million in the first six months of 2017, compared to cash used in operations of $15.8 million in the first six months of2016. The change is partially attributable to the $105.1 million increase in our net loss in the first six months of 2017 compared to the first six months of 2016.Also, a $14.7 million net decrease in cash outflows associated with changes in accounts receivable, contracts in progress and advanced billings in the first sixmonths of 2017 compared to the first six months of 2016 resulted primarily from the timing of billings and stage of completion of large, ongoing contracts in ourRenewable segment. Generally, we try to structure contract milestones to mirror our expected cash outflows over the course of the contract; however, the timing ofmilestone receipts can greatly affect our overall cash position. Our portfolio of Renewable energy contracts at both June 30, 2017 and December 31, 2016 includedmilestone payments from our customers in advance of incurring the contract expenses, and as a result we are in an advance bill position
39

Table of Contents
on most of these contracts at both dates. Because of the advanced bill positions, combined with the increase in expected costs to complete the Renewable losscontracts, we expect the use of cash by the Renewable segment to continue during 2017 and into early 2018 until these contracts are completed. Partially offsettingthese operating cash outflows was a $72.5 million decrease in operating cash outflows associated with changes in contract related accounts payable and accruedliabilities in the first six months of 2017 compared to the first six months of 2016.
Our net cash used in investing activities was $53.9 million in the first six months of 2017 and $42.4 million in the first six months of 2016. The net cash used ininvesting activities was primarily attributable to the $52.5 million acquisition of Universal on January 11, 2017, net of $4.4 million cash acquired in the businesscombination (see Note 4 to the condensed consolidated financial statements). The net cash used in investing activities in the second quarter of 2016 includes a$26.2 million contribution to increase our interest in TBWES, our joint venture in India. Capital expenditures were $7.7 million and $13.6 million in the first sixmonths of 2017 and 2016, respectively.
Our net cash provided by financing activities was $103.5 million in the first six months of 2017, compared to $51.5 million of cash used in the first six months of2016. The cash provided by financing activities in the quarter ended June 30, 2017 was a result of net borrowings from our United States revolving credit facilityof $108.3 million to fund our working capital needs and the Universal acquisition, partially offset by $2.2 million of net repayments of our foreign revolving creditfacilities. The net cash used in financing activities in the first six months of 2016 is primarily attributable to repurchases of $52.3 million of our common stock.
UnitedStatesrevolvingcreditfacility
On May 11, 2015, we entered into a credit agreement with a syndicate of lenders ("Credit Agreement") in connection with our spin-off from The Babcock &Wilcox Company. The Credit Agreement, which is scheduled to mature on June 30, 2020, provides for a senior secured revolving credit facility, initially in anaggregate amount of up to $600 million . The proceeds of loans under the Credit Agreement are available for working capital needs and other general corporatepurposes, and the full amount is available to support the issuance of letters of credit.
On February 24, 2017 and August 9, 2017, we entered into amendments to the Credit Agreement (the “Amendments” and the Credit Agreement, as amended todate, the “Amended Credit Agreement”) to, among other things: (1) permit us to incur the debt under the second lien term loan facility, (2) modify the definition ofEBITDA in the Amended Credit Agreement to exclude: up to $98.1 million of charges for certain Renewable segment contracts for periods including the quarterended December 31, 2016, up to $115.2 million of charges for certain Renewable segment contracts for periods including the quarter ended June 30, 2017, up to$4.0 million of aggregate restructuring expenses incurred during the period from July 1, 2017 through September 30, 2018 measured on a consecutive four-quarterbasis, realized and unrealized foreign exchange losses resulting from the impact of foreign currency changes on the valuation of assets and liabilities, and fees andexpenses incurred in connection with the August 9, 2017 amendment, (3) replace the maximum leverage ratio with a maximum senior debt leverage ratio, (4)decrease the minimum consolidated interest coverage ratio, (5) limit our ability to borrow under the Amended Credit Agreement during the covenant relief periodto $250.0 million in the aggregate, (6) reduce commitments under the revolving credit facility from $600.0 million to $500.0 million , (7) require us to maintainliquidity (as defined in the Amended Credit Agreement) of at least $75.0 million as of the last business day of any calendar month, (8) require us to repayoutstanding borrowings under the revolving credit facility (without any reduction in commitments) with certain excess cash, (9) increase the pricing for borrowingsand commitment fees under the Amended Credit Agreement, (10) limit our ability to incur debt and liens during the covenant relief period, (11) limit our ability tomake acquisitions and investments in third parties during the covenant relief period, (12) prohibit us from paying dividends and undertaking stock repurchasesduring the covenant relief period (other than our share repurchase from an affiliate of AIP), (13) prohibit us from exercising the accordion described below duringthe covenant relief period, (14) limit our financial and commercial letters of credit outstanding under the Amended Credit Agreement to $30.0 million during thecovenant relief period, (15) require us to reduce commitments under the Amended Credit Agreement with the proceeds of certain debt issuances and asset sales,(16) beginning with the quarter ending September 30, 2017, limit to no more than $25.0 million any net income losses attributable to certain Vølund projects, and(17) increase reporting obligations and require us to hire a third-party consultant. The covenant relief period will end, at our election, when the conditions set forthin the Amended Credit Agreement are satisfied, but in no event earlier than the date on which we provide the compliance certificate for our fiscal quarter endingDecember 31, 2018.
Other than during the covenant relief period, the Amended Credit Agreement contains an accordion feature that allows us, subject to the satisfaction of certainconditions, including the receipt of increased commitments from existing lenders or new
40

Table of Contents
commitments from new lenders, to increase the amount of the commitments under the revolving credit facility in an aggregate amount not to exceed the sum of (1)$200.0 million plus (2) an unlimited amount, so long as for any commitment increase under this subclause (2) our senior leverage ratio (assuming the full amountof any commitment increase under this subclause (2) is drawn) is equal to or less than 2.0 :1.0 after giving pro forma effect thereto. During the covenant reliefperiod, our ability to exercise the accordion feature will be prohibited.
After giving effect to Amendments, loans outstanding under the Amended Credit Agreement bear interest at our option at either (1) the LIBOR rate plus 5.0% perannum or (2) the base rate (the highest of the Federal Funds rate plus 0.5%, the one month LIBOR rate plus 1.0%, or the administrative agent's prime rate) plus4.0% per annum. A commitment fee of 1.0% per annum is charged on the unused portions of the revolving credit facility. A letter of credit fee of 2.50% per annumis charged with respect to the amount of each financial letter of credit outstanding, and a letter of credit fee of 1.50% per annum is charged with respect to theamount of each performance and commercial letter of credit outstanding. Additionally, an annual facility fee of $1.5 million is payable on the first business day of2018 and 2019, and a pro rated amount is payable on the first business day of 2020.
The Amended Credit Agreement includes financial covenants that are tested on a quarterly basis, based on the rolling four-quarter period that ends on the last dayof each fiscal quarter. The maximum permitted senior debt leverage ratio as defined in the Amended Credit Agreement is:
• 6.00 :1.0 for the quarter ending September 30, 2017,• 8.50 :1.0 for each of the quarters ending December 31, 2017 and March 31, 2018,• 6.25 :1.0 for the quarter ending June 30, 2018,• 4.00 :1.0 for the quarter ending September 30, 2018,• 3.75 :1.0 for the quarter ending December 31, 2018,• 3.25 :1.0 for each of the quarters ending March 31, 2019 and June 30, 2019, and• 3.00 :1.0 for each of the quarters ending September 30, 2019 and each quarter thereafter.
The minimum consolidated interest coverage ratio as defined in the Credit Agreement is:• 1.50 :1.0 for the quarter ending September 30, 2017,• 1.00 :1.0 for each of the quarters ending December 31, 2017 and March 31, 2018,• 1.25 :1.0 for the quarter ending June 30, 2018,• 1.50 :1.0 for each of the quarters ending September 30, 2018 and December 31, 2018,• 1.75 :1.0 for each of the quarters ending March 31, 2019 and June 30, 2019, and• 2.00 :1.0 for each of the quarters ending September 30, 2019 and each quarter thereafter.
Beginning with September 30, 2017, consolidated capital expenditures in each fiscal year are limited to $27.5 million.
At June 30, 2017 , usage under the Amended Credit Agreement consisted of $118.1 million in borrowings at an effective interest rate of 3.81% , $7.7 million offinancial letters of credit and $93.7 million of performance letters of credit. After giving effect to the August 9, 2017 amendment, at June 30, 2017 , we had $92.1million available for borrowings or to meet letter of credit requirements primarily based on trailing 12 month EBITDA, and our leverage (as defined in theAmended Credit Agreement) ratio was 2.16 and our interest coverage ratio was 5.41 . At June 30, 2017 , we were in compliance with all of the covenants set forthin the Amended Credit Agreement.
Secondlientermloan
On August 9, 2017 , we entered into a second lien credit agreement (the "Second Lien Credit Agreement") with an affiliate of AIP governing a second lien termloan facility. The second lien term loan facility consists of a second lien term loan in the principal amount of $175.9 million , all of which we borrowed on August9, 2017, and a delayed draw term loan facility in the principal amount of up to $20.0 million , which may be drawn in a single draw prior to June 30, 2020, subjectto certain conditions. Borrowings under the second lien term loan, other than the delayed draw term loan, bear interest at 10% per annum, and borrowings underthe delayed draw term loan bear interest at 12% per annum, in each case payable quarterly. Undrawn amounts under the delayed draw term loan accrue acommitment fee at a rate of 0.50% per annum. The second lien term loan has a scheduled maturity of December 30, 2020. Any delayed draw borrowings wouldalso have a scheduled maturity of December 30, 2020. In connection with our entry into the second lien term loan facility, we used a portion of the proceeds fromthe second lien term loan to repurchase approximately 4.8 million shares of our common stock (approximately 10% of our shares outstanding) held by an affiliateof AIP for approximately $50.9 million , which was one of the conditions precedent for the second lien term loan facility.
41

Table of Contents
Borrowings under the Second Lien Credit Agreement are (1) guaranteed by substantially all of our wholly owned domestic subsidiaries, but excluding our captiveinsurance subsidiary, and (2) secured by second-priority liens on certain assets owned by us and the guarantors. The Second Lien Credit Agreement requiresinterest payments on loans on a periodic basis until maturity. Voluntary prepayments made during the first year after closing are subject to a make-whole premium,voluntary prepayments made during the second year after closing are subject to a a 3.0% premium and voluntary prepayments made during the third year afterclosing are subject to a 2.0% premium. The Second Lien Credit Agreement requires us to make certain prepayments on any outstanding loans after receipt of cashproceeds from certain asset sales or other events, subject to certain exceptions and a right to reinvest such proceeds in certain circumstances, and subject to certainrestrictions contained in an intercreditor agreement among the lenders under the Amended Credit Agreement and the Second Lien Credit Agreement.
The Second Lien Credit Agreement contains representations and warranties, affirmative and restrictive covenants, financial covenants and events of defaultsubstantially similar to those contained in the Amended Credit Agreement, subject to appropriate cushions. The Second Lien Credit Agreement is generally lessrestrictive than the Amended Credit Agreement.
Foreignrevolvingcreditfacilities
Outside of the United States, we have revolving credit facilities in Turkey, China and India that are used to provide working capital to our operations in eachcountry. These three foreign revolving credit facilities allow us to borrow up to $14.5 million in aggregate and each have a one year term. At June 30, 2017 , wehad $13.3 million in borrowings outstanding under these foreign revolving credit facilities at an effective weighted-average interest rate of 5.1% .
Othercreditarrangements
Certain subsidiaries have credit arrangements with various commercial banks and other financial institutions for the issuance of letters of credit and bankguarantees in associated with contracting activity. The aggregate value of all such letters of credit and bank guarantees not secured by the United States revolvingcredit facility as of June 30, 2017 and December 31, 2016 was $273.3 million and $255.2 million , respectively.
We have posted surety bonds to support contractual obligations to customers relating to certain projects. We utilize bonding facilities to support such obligations,but the issuance of bonds under those facilities is typically at the surety's discretion. Although there can be no assurance that we will maintain our surety bondingcapacity, we believe our current capacity is more than adequate to support our existing project requirements for the next 12 months. In addition, these bondsgenerally indemnify customers should we fail to perform our obligations under the applicable contracts. We, and certain of our subsidiaries, have jointly executedgeneral agreements of indemnity in favor of surety underwriters relating to surety bonds those underwriters issue in support of some of our contracting activity. Asof June 30, 2017 , bonds issued and outstanding under these arrangements in support of contracts totaled approximately $465.3 million .
CRITICAL ACCOUNTING POLICIES
For a summary of the critical accounting policies and estimates that we use in the preparation of our unaudited condensed consolidated financial statements, see"Critical Accounting Policies" in our Annual Report. There have been no significant changes to our policies during the quarter ended June 30, 2017 .
Item 3. Quantitative and Qualitative Disclosures About Market Risk
Our exposures to market risks could change materially from those disclosed under "Quantitative and Qualitative Disclosures About Market Risk" in our AnnualReport. Our exposure to market risk from changes in interest rates relates primarily to our cash equivalents and our investment portfolio, which primarily consistsof investments in United States Government obligations and highly liquid money market instruments denominated in United States dollars. We are averse toprincipal loss and seek to ensure the safety and preservation of our invested funds by limiting default risk, market risk and reinvestment risk. Our investments areclassified as available-for-sale.
Although the condensed and consolidated balance sheets do not present debt at fair value, our second lien term loan facility is fixed-rate debt, the fair value ofwhich could fluctuate as a result of changes in prevailing market rates. On August 9, 2017,
42

Table of Contents
its principal balance was $175.9 million. Our United States revolving credit facility is variable-rate debt, so its fair value would not be significantly affected bychanges in prevailing market rates. We have operations in many foreign locations, and, as a result, our financial results could be significantly affected by factors such as changes in foreign currencyexchange ("FX") rates or weak economic conditions in those foreign markets. Our primary foreign currency exposures are Danish kroner, Great British pound,Euro, Canadian dollar, and Chinese yuan. In order to manage the risks associated with FX rate fluctuations, we attempt to hedge those risks with FX derivativeinstruments, but there can be no assurance that such instruments will be available to us on reasonable terms. Historically, we have hedged those risks with FXforward contracts. We do not enter into speculative derivative positions.
Item 4. Controls and Procedures
Disclosurecontrolsandprocedures
As of the end of the period covered by this report, the Company's management, with the participation of our Chief Executive Officer and the Chief FinancialOfficer, has evaluated the effectiveness of the design and operation of our disclosure controls and procedures (as that term is defined in Rules 13a-15(e) and 15d-15(e) adopted by the Securities and Exchange Commission under the Securities Exchange Act of 1934, as amended (the "Exchange Act")) in providing reasonableassurance that information required to be disclosed by us in the reports that we file or submit under the Exchange Act is recorded, processed, summarized andreported within the time periods specified in the rules and forms of the Securities and Exchange Commission, and such information is accumulated andcommunicated to management as appropriate to allow timely decisions regarding disclosure. Our disclosure controls and procedures were developed through aprocess in which our management applied its judgment in assessing the costs and benefits of such controls and procedures, which, by their nature, can provide onlyreasonable assurance regarding the control objectives. You should note that the design of any system of disclosure controls and procedures is based in part uponvarious assumptions about the likelihood of future events, and we cannot assure you that any design will succeed in achieving its stated goals under all potentialfuture conditions, regardless of how remote.
On January 11, 2017, we acquired Universal, which would have represented approximately 3% of our total consolidated assets and consolidated revenues as of andfor the year ended December 31, 2016, respectively. As the acquisition occurred during the last 12 months, the scope of our assessment of the effectiveness ofdisclosure controls and procedures does not include internal control over financial reporting related to Universal. This exclusion is in accordance with theSecurities and Exchange Commission's general guidance that an assessment of a recently acquired business may be omitted from our internal control over financialreporting scope in the year of acquisition.
Based on the evaluation referred to above, our Chief Executive Officer and Chief Financial Officer concluded that the operation of our disclosure controls andprocedures were not effective as of June 30, 2017 due to a material weakness in our internal control over financial reporting at Vølund (described below), which isan integral part of our disclosure controls and procedures. Notwithstanding the existence of the material weakness, management has concluded that theconsolidated financial statements included in both this report and prior periodic reports on Forms 10-Q and 10-K present fairly, in all material respects, ourconsolidated financial position, results of operations and cash flows for the periods presented in conformity with United States generally accepted accountingprinciples.
InternalcontroloversourcesofinformationusedinprojectaccountingatVølund
As of March 31, 2017, we did not maintain effective internal control over the completeness and accuracy of the information used in the percentage of completion("POC") accounting for three European renewable energy projects at Vølund, a business unit within our Renewable segment. Based on our detailed investigation,we determined Vølund's project accountants and project management did not timely identify certain subcontractor costs and required quantities of certain labor andequipment needed to complete ongoing projects, which resulted in an understatement of our consolidated net loss in the first quarter of 2017. Though the error wasnot material, the related internal control deficiency was considered a material weakness because it could have resulted in material errors in our financial statements.The correction of the immaterial error was included in the $115.2 million charge we recognized for changes in POC accounting estimates recorded in our statementof operations in the second quarter of 2017. Factors that contributed to the material weakness in internal control over financial reporting during the first quarter of2017 were turnover of key project and supply chain personnel at Vølund and the relocation of certain project management responsibilities from Vølund'sadministrative offices to the project sites during a period of significant changes in subcontractors' scopes of work. As a result, our processes and internal controlsassociated with the completeness
43
Table of Contents
and accuracy of information used to estimate revenue and related costs in the application of POC accounting for these three projects were ineffective.
At December 31, 2016, we determined that our internal control over financial reporting was operating effectively, including with respect to the completeness andaccuracy of the information used in the POC accounting for Vølund's European renewable energy projects. POC accounting estimates require significantjudgments in recognizing revenue and costs on long-term construction-type contracts. Significant changes in estimates on such contracts may be representative ofchanges in operational matters, such as engineering design changes, subcontractor productivity shortcomings and revised project schedules that may not beindicative of a financial error or a deficiency in our internal control over financial reporting. Estimates are made based on the best information available at the timewe report our financial results, which includes then-current views of broader operational matters and estimates within each contract. Each of Vølund's POCaccounting estimates at December 31, 2016 were the judgment of project management and accountants based on the information available at the time the estimateswere made. In addition, Vølund's POC accounting at December 31, 2016 included risk-weighted contingencies for the estimated costs associated with the revisedproject schedules. We believe the December 31, 2016 estimates were consistent with the then-current engineering drawings, scheduling, subcontractor work plansand materials needed to complete each project. Our identification of a material weakness at June 30, 2017 does not change our previous conclusion that our internalcontrol over financial reporting was effective at December 31, 2016.
Remediationofthematerialweaknessininternalcontroloverfinancialreporting
As of June 30, 2017, we have not yet fully remediated the material weakness at Vølund. With the oversight of our senior management and the Audit and FinanceCommittee of our Board of Directors, we have taken and will continue to take steps intended to address and remediate the underlying causes of the materialweakness in internal control over financial reporting at Vølund. Our primary areas of focus include the following:
• Providing supplemental training for Vølund's on-site personnel on the design of our project accounting review and financial reporting process.• Improving the quality and number of on-site personnel supporting Vølund's European renewable energy projects, including supplementing their resources
with personnel from our Power segment.• Enhancing our policies and procedures related to the timely accumulation of information used in our periodic project accounting reviews, and
documentation of judgments made as a result of such reviews.• Implementing vendor inquiry and invoice reconciliation controls on each project.
We believe the introduction of new internal control activities during the second quarter of 2017 contributed to our identification of the material weakness. As wecontinue to evaluate and improve our internal control over financial reporting, we may determine to take additional measures to address and remediate the materialweakness during 2017. However, our remediation plans cannot guarantee the material weakness will be remediated by a specific future date or at all.
Changesininternalcontroloverfinancialreporting
Other than the changes described above, there were no changes in our internal control over financial reporting during the quarter ended June 30, 2017 that havematerially affected, or are reasonably likely to materially affect, our internal control over financial reporting.
PART II - OTHER INFORMATION
Item 1. Legal Proceedings
For information regarding ongoing investigations and litigation, see Note 19 to the unaudited condensed consolidated financial statements in Part I of this report,which we incorporate by reference into this Item.
Item 1A. Risk Factors
We are subject to various risks and uncertainties in the course of our business. The discussion of such risks and uncertainties may be found under "Risk Factors" inour Annual Report. There have been no material changes to such risk factors.
44

Table of Contents
Item 2. Unregistered Sales of Equity Securities and Use of Proceeds
In August 2015, we announced that our Board of Directors authorized a share repurchase program. The following table provides information on our purchases ofequity securities during the quarter ended June 30, 2017. Any shares purchased that were not part of a publicly announced plan or program are related torepurchases of common stock pursuant to the provisions of employee benefit plans that permit the repurchase of shares to satisfy statutory tax withholdingobligations.
Period Total number of
shares purchased (1)
Averageprice paidper share
Total number ofshares purchased as
part of publiclyannounced plans or
programs
Approximate dollarvalue of shares that may yet be purchased under the plans or programs
(in thousands) (2)
April 1, 2017 - April 30, 2017 — $— — $100,000May 1, 2017 - May 31, 2017 981 $— — $100,000June 1, 2017 - June 30, 2017 1,704 $— — $100,000
Total 2,685 —
(1) The shares repurchased during May and June 2017 shown in the table above are those repurchased pursuant to the provisions of employee benefit plans thatrequire us to repurchase shares to satisfy employee statutory income tax withholding obligations.
(2) On August 4, 2016, we announced that our board of directors authorized the repurchase of an indeterminate number of our shares of common stock in theopen market at an aggregate market value of up to $100 million over the next twenty-four months. As of August 1, 2017, we have not made any sharerepurchases under the August 4, 2016 share repurchase authorization.
Item 5. Other Information
On August 7, 2017, our Board of Directors approved a Key Executive Retention Program (the “KERP”) as a means to maintain continuity of management as theCompany works through its operational challenges. Key members of our management team participate in the KERP. While the Company’s Chief ExecutiveOfficer is not a participant in the KERP, our other current named executive officers are participants. In order to balance both near and longer term risks, KERPparticipants received awards payable in both cash and shares of the Company’s common stock.
The cash awards are in the form of cash-settled performance units (“CPUs”), 40% of which vest on February 14, 2018 and the remaining 60% of which vest onAugust 14, 2018, subject to the participant remaining employed by the Company through the applicable vesting date. Unvested CPUs will vest in full if theparticipant’s employment terminates (i) due to death or disability, (ii) involuntarily without cause, or (iii) following a change in control, for good reason by theparticipant. Payout of the CPUs will depend on the 30 -day average price of the Company’s common stock immediately prior to each vesting event, but in no eventwill the payout be less than 75% of the initial award value or more than 150% of the initial award value. If the participant voluntarily terminates employmentbetween the first and second vesting dates, the participant must repay the Company the after-tax amount realized upon the first vesting event.
The stock awards are in the form of restricted stock units (“RSUs”), 50% of which vest on the August 14, 2019 and the remaining 50% of which vest on August14, 2020, subject to the participant remaining employed by the Company through the applicable vesting date. Unvested RSUs will vest in full upon theparticipant’s (i) death or disability, or (ii) following a change in control, the participant’s employment is terminated without cause by the Company or for goodreason by the participant. Partial vesting would be provided upon a termination prior to a change in control due to a reduction in force. In the event that some or allof the performance stock units previously granted to an executive in 2016 or 2017 vest according to their terms, such shares will reduce the number of RSUs thatare ultimately issued to that executive under the KERP.
45

Table of Contents
Item 6. Exhibits
10.1 Form of Performance Unit Award Grant Agreement (Cash Settled)
10.2 Form of Special Restricted Stock Unit Award Grant Agreement
31.1 Rule 13a-14(a)/15d-14(a) certification of Chief Executive Officer
31.2 Rule 13a-14(a)/15d-14(a) certification of Chief Financial Officer
32.1 Section 1350 certification of Chief Executive Officer
32.2 Section 1350 certification of Chief Financial Officer
101.INS XBRL Instance Document
101.SCH XBRL Taxonomy Extension Schema Document
101.CAL XBRL Taxonomy Extension Calculation Linkbase Document
101.LAB XBRL Taxonomy Extension Label Linkbase Document
101.PRE XBRL Taxonomy Extension Presentation Linkbase Document
101.DEF XBRL Taxonomy Extension Definition Linkbase Document
SIGNATURES
Pursuant to the requirements of the Securities Exchange Act of 1934, the registrant has duly caused this report to be signed on its behalf by the undersignedthereunto duly authorized.
August 9, 2017 BABCOCK & WILCOX ENTERPRISES, INC.
By: /s/ Daniel W. Hoehn Daniel W. Hoehn Vice President, Controller & Chief Accounting Officer (Principal Accounting Officer and Duly Authorized Representative)
46

Exhibit 10.1
[Babcock & Wilcox Letterhead]
August ___, 2017
BY HAND
[Employee][Address]
Dear [ Employee]:
This letter memorializes the terms of a special performance unit award that Babcock & Wilcox Enterprises, Inc. (the “Company ”) is making to you. Effective August ___, 2017, the Company hereby grants you ___ performance units (the“Performance Units”), subject to the terms and conditions set forth below. Certain capitalized terms not defined herein are defined inAnnex A hereto.
Vesting Conditions . The Performance Units shall vest as follows: (a) 40% of the Performance Units shall vest on February___, 2018 (the “ First Vesting Date ”), and (b) 60% of the Performance Units shall vest on August ___, 2018 (the “ Second VestingDate ”) (each of the First Vesting Date and the Second Vesting Date, a “ Vesting Date ”), subject in each case to your continuedemployment with the Company and its affiliates through the applicable Vesting Date. Notwithstanding the foregoing, if youremployment terminates pursuant to a Qualifying Termination, any unvested Performance Units shall vest in full effective as of thedate of such termination of employment.
Settlement . Any vested Performance Units shall be satisfied by payment in cash to you, within 30 days following the date onwhich the applicable Performance Units vest, of an amount equal to the product of (x) the number of Performance Units that vestedon the applicable vesting date multiplied by (y) the applicable Measurement Value, subject to applicable tax withholding.
Recoupment Under Certain Circumstances . In the event that, after the First Vesting Date but prior to the Second VestingDate, you incur a termination of employment with the Company that is not a Qualifying Termination, you shall, within ten businessdays of such termination, repay the Company the after-tax portion of any amounts previously paid to you hereunder.
The Performance Units shall not count toward or be considered in determining payments or benefits due under any otherplan, program, or agreement. You and the Company acknowledge that your employment is “at will” and may be terminated by eitheryou or the Company at any time and for any reason.
This letter may not be amended or modified, except by an agreement in writing signed by you and the Company. This lettershall be binding upon any successor of the Company or its businesses (whether direct or indirect, by purchase, merger,consolidation, or otherwise), in the same manner and to the same extent that the Company would be obligated under this letter if nosuccession had taken place. The term “Company,” as used in this letter, shall mean the Company as defined above and any successoror assignee to the business or assets that by reason hereof becomes bound by this letter.
This letter shall be governed by and construed in accordance with the laws of the State of Delaware, without reference toconflict of laws principles.
[ SignaturePageFollows]
Please indicate your agreement with and acceptance of the terms and conditions of this letter agreement, by signing this letteragreement in the space provided below. Please keep a copy for your records and return the original to me.
Sincerely yours,

BABCOCK & WILCOX ENTERPRISES, INC.
By: _____________________________ Name: Title:
Acknowledged and Agreed:
_____________________________ [ Employee]
Exhibit A Certain Definitions
For purposes of this letter agreement, the following terms have the meanings ascribed to them below:
“ Average Fair Market Value ” means, with respect to a vesting date, the average Fair Market Value over the 30-day periodimmediately preceding such vesting date, measured by dividing the sum of all Fair Market Values for trading days during suchperiod by the number of such trading days, provided that if such vesting date occurs subsequent to a Change in Control, theapplicable 30-day period shall be the 30-day period immediately preceding such Change in Control.
“ Cause ” means your (i) willful and continued failure to perform substantially your duties with the Company or an affiliateof the Company (occasioned by reason other than your physical or mental illness or disability) after a written demand for substantialperformance is delivered to you by the Company which specifically identifies the manner in which the Company believes that youhave not substantially performed your duties, after which you shall have 30 days to defend or remedy such failure to substantiallyperform your duties, (ii) willful engaging in illegal conduct or gross misconduct which is materially and demonstrably injurious tothe Company or its successor, or (iii) conviction with no further possibility of appeal for, or plea of guilty or nolo contendere by youto, any felony. If, immediately prior to your cessation of employment, you hold a position with the Company such that yourcompensation is regularly subject to review by the Committee, then the cessation of your employment under (i) and (ii) above shallnot be deemed to be for “Cause” unless and until there shall have been delivered to you a copy of a resolution duly adopted by theaffirmative vote of not less than three-quarters of the entire membership of the Committee at a meeting of such Committee calledand held for such purpose (after reasonable notice is provided to you and you are given an opportunity, together with your counsel,to be heard before such Committee), finding that, in the good faith opinion of such Committee, you are guilty of the conductdescribed in (i) or (ii) above, and specifying the particulars thereof in detail.
“ Change in Control ” has the meaning set forth in the Equity Plan.
“ Committee ” means the Compensation Committee of the Company’s Board of Directors.
“ Disability ” has the meaning set forth in the Equity Plan.
“ Equity Plan ” means the Company’s Amended and Restated 2015 Long-Term Incentive Plan.
“ Fair Market Value ” has the meaning set forth in the Equity Plan. In the event that an event of the type described in Section4.4 of the Equity Plan occurs between August 1, 2017 and August 1, 2018, the Fair Market Value for any date subsequent to suchevent shall be equitably adjusted by the Committee to reflect the impact of the event.
“ Good Reason ” means (i) a material diminution in your duties or responsibilities from those applicable immediately beforethe date on which the applicable Change in Control occurs, (ii) a material reduction in your annual rate of base salary or target bonusas in effect on the applicable Change in Control or as either of the same may be increased from time to time thereafter, (iii) amaterial reduction in the amount of your annual target long-term incentive compensation opportunity (whether payable in cash,common stock or a combination thereof) as in effect on the applicable Change in Control or as the same may be increased from timeto time thereafter, unless such material reduction applies to all similarly situated executives of the Company or its successor and theparent corporation resulting from the applicable Change in Control; and provided that for the avoidance of doubt, a materialreduction of such annual target long-term incentive compensation opportunity shall not be deemed to occur solely because suchopportunity becomes payable solely in cash, or (iv) a change in the location of your principal place of employment by more than 50

miles from the location where you were principally employed immediately before the applicable Change in Control.Notwithstanding the foregoing, “Good Reason” shall not be deemed to exist unless: (1) you have provided written notice to theSuccessor of the existence of one or more of the conditions listed in (i) through (iv) above and your intention to terminateemployment as a result within 60 days after your knowledge of such condition or conditions occurs, (2) such condition or conditionshave not been cured by the Company within 30 days after receipt of such notice, and (3) you actually terminate employment within30 days after the expiration of such 30-day cure period.
“ Initial Value ” means the Fair Market Value on August ___, 2017.
“ Measurement Value ” means (i) if the applicable Average Fair Market Value is equal to or less than 75% of the InitialValue, 75% of the Initial Value, (ii) if the applicable Average Fair Market Value is greater than 75% of the Initial Value but less than200% of the Initial Value, the applicable Average Fair Market Value, or (iii) if the applicable Average Fair Market Value equals orexceeds 150% of the Initial Value, 150% of the Initial Value.
“ Qualifying Termination ” means a termination of your employment with the Company due to (i) your death or Disability,(ii) a termination by the Company without Cause, or (iii) following a Change in Control, a termination by you for Good Reason.
“ Reduction in Force ” means a termination of employment under circumstances that would result in the payment of benefitsunder The Babcock & Wilcox Employee Severance Plan or a successor plan (as may be amended) whether or not you are aparticipant in such plan, termination of employment in connection with a voluntary exit incentive program, or termination ofemployment under other circumstances which the Company designates as a reduction in force.
Exhibit 10.2
[Babcock & Wilcox Letterhead]
SPECIAL RESTRICTED STOCK UNITSGRANT AGREEMENT
To: <first_name> <last_name>
Effective <award_date> (the “ Date of Grant ”), the Compensation Committee of the Board of Directors (the “ Committee ”) ofBabcock & Wilcox Enterprises, Inc. (“ BW ”) awarded you a grant of Restricted Stock Units (“ RSUs ”) under the Babcock &Wilcox Enterprises, Inc. Amended and Restated 2015 Long-Term Incentive Plan (the “ Plan ”). By accepting your grant onlinethrough the Schwab Equity Award Center, you agree that the RSUs are granted under and governed by the terms and conditions ofthe Plan, and this Special Restricted Stock Units Grant Agreement (this “ Agreement ”), which is included in the online acceptanceprocess. A copy of the Plan and the Prospectus relating to the stock issued under the Plan can be found athttp://equityawardcenter.schwab.com under the “At a Glance/My Company Info” tab in your Schwab account. The Plan andProspectus are incorporated by reference and made a part of the terms and conditions of your award. If you would like to receive acopy of either the Plan or Prospectus, please contact [ ].
Any reference or definition contained in this Agreement shall, except as otherwise specified, be construed in accordance with theterms and conditions of the Plan and all determinations and interpretations made by the Committee with regard to any questionarising hereunder or under the Plan shall be binding and conclusive on you and your legal representatives and beneficiaries. Theterm “ BW ” as used in this Agreement with reference to employment shall include Subsidiaries of BW (including unconsolidatedjoint ventures). In the event of any inconsistency between the provisions of this Agreement and the Plan, the Plan shall govern.Whenever the words “you” or “your” are used in any provision of this Agreement under circumstances where the provision shouldlogically be construed to apply to the beneficiary, estate, or personal representative, to whom any rights under this Agreement maybe transferred by will or by the laws of descent and distribution, it shall be deemed to include such person.
Subject to the provisions of the Plan, the terms and conditions of this grant are as follows:
1. RSU Award . You have been awarded <shares_awarded> RSUs. Each RSU represents a right to receive one Share after thevesting of such RSU, as set forth in, and subject to, Section 2 below.
2. Vesting Requirements . Subject to Section 4 below, the RSUs will become vested under one or more of the circumstancesdescribed in this Section 2 (each such circumstance, a “ Vesting Date ”).
(a) Normal Vesting . Provided you are continuously employed with BW through each applicable vest date, the RSUs willvest in two equal tranches on each of the second anniversary of the Date of Grant and the third anniversary of theDate of Grant.
(b) Reduction in Force . In the event that your employment with BW is terminated by reason of a Reduction in Force (asdefined below) on or after the first anniversary of the Date of Grant, then (i) 25% of the then-remaining outstandingRSUs will vest on the date of such termination if the termination occurs prior to the second anniversary of the Date ofGrant and (ii) 50% of the then-remaining outstanding RSUs will vest on the date of such termination if thetermination occurs on or after the second anniversary of the Date of Grant. For purposes of this Agreement, the term “Reduction in Force ” means a termination of employment under circumstances that would result in the payment ofbenefits under The Babcock & Wilcox Employee Severance Plan or a successor plan (as may be amended) whether ornot you are a participant in such plan, termination of employment in connection with a voluntary exit incentiveprogram, or termination of employment under other circumstances which the Committee designates as a reduction inforce.
(c) Death; Disability; Change in Control . 100% of the then-remaining outstanding RSUs will vest on the earliest to occurprior to the third anniversary of the Date of Grant of: (i) the date of termination of your employment from BW due todeath, (ii) your Disability or (iii) to the extent provided under Section 3 below, a Change in Control.
(d) Other Vesting . The Committee may provide for additional vesting under other circumstances, in its sole discretion, tothe extent permitted under the Plan.

3. Change in Control Vesting
(a) If you remain employed by BW throughout the period beginning on the Date of Grant and ending on the date of a Changein Control, you will become 100% vested in all outstanding unvested RSUs evidenced by this Agreement upon theChange in Control, except to the extent that a Replacement Award (as defined in subsection (d)) is provided to you toreplace, adjust or continue the award of RSUs covered by this Agreement (the “ Replaced Award ”). If a ReplacementAward is provided, references to the RSUs in this Agreement shall be deemed to refer to the Replacement Award afterthe Change in Control.
(b) If, upon or after receiving a Replacement Award, you experience a termination of employment with BW (or anysuccessor) (the “ Successor ”) by reason of you terminating employment for Good Reason or the Successor terminatingyour employment other than for Cause, in each case within a period of two years after the Change in Control and at atime when the Replacement Award has not vested or been forfeited, you shall become 100% vested in the ReplacementAward upon such termination.
(c) For purposes of this Agreement, a “ Replacement Award ” means an award: (i) of the same type (e.g., restricted stockunits) as the Replaced Award; (ii) that has a value at least equal to the value of the Replaced Award; (iii) that relates topublicly traded equity securities of BW or its successor in the Change in Control or another entity that is affiliated withBW or its successor following the Change in Control; (iv) if your holding the Replaced Award is subject to U.S. federalincome tax under the Code, the tax consequences of which under the Code are not less favorable to you than the taxconsequences of the Replaced Award; and (v) the other terms and conditions of which are not less favorable to you thanthe terms and conditions of the Replaced Award (including the provisions that would apply in the event of a subsequentChange in Control). A Replacement Award may be granted only to the extent it does not result in the Replaced Award orReplacement Award failing to comply with or be exempt from Section 409A of the Code. Without limiting the generalityof the foregoing, the Replacement Award may take the form of a continuation of the Replaced Award if the requirementsof the two preceding sentences are satisfied. The determination of whether the conditions of this Section 3(c) are satisfiedwill be made by the Committee, as constituted immediately before the Change in Control, in its sole discretion.
(d) For purposes of this Agreement, “ Cause ” means: (i) your willful and continued failure to perform substantially yourduties with the Company or an affiliate of the Company (occasioned by reason other than your physical or mental illnessor disability) after a written demand for substantial performance is delivered to you by BW or its successor whichspecifically identifies the manner in which BW or its successor believes that you have not substantially performed yourduties, after which you shall have thirty (30) days to defend or remedy such failure to substantially perform your duties;(ii) your willful engaging in illegal conduct or gross misconduct which is materially and demonstrably injurious to BW orits successor; or (iii) your conviction with no further possibility of appeal for, or plea of guilty or nolo contendere by youto, any felony. If, immediately prior to your cessation of employment, you hold a position with BW such that yourcompensation is regularly subject to review by the Committee, then t he cessation of your employment undersubparagraph (i) and (ii) above shall not be deemed to be for “Cause” unless and until there shall have been delivered toyou a copy of a resolution duly adopted by the affirmative vote of not less than three-quarters (3/4) of the entiremembership of the Committee at a meeting of such Committee called and held for such purpose (after reasonable noticeis provided to you and you are given an opportunity, together with your counsel, to be heard before such Committee),finding that, in the good faith opinion of such Committee, you are guilty of the conduct described in subparagraph (i) or(ii) above, and specifying the particulars thereof in detail.
(e) A termination “ for Good Reason ” shall mean your termination of employment with the Successor as a result of theoccurrence, without your consent, of one or more of the following events:
(i) a material diminution in your duties or responsibilities from those applicable immediately before the date onwhich a Change in Control occurs;
(ii) a material reduction in your annual rate of base salary or target bonus as in effect on the Change in Control oras either of the same may be increased from time to time thereafter;
(iii) a material reduction in the amount of your annual target long-term incentive compensation opportunity(whether payable in cash, common stock or a combination thereof) as in effect on the Change in Control or asthe same may be increased from time to time thereafter, unless such material reduction applies to all similarlysituated executives of BW or its successor and the parent corporation resulting from the Change in Control;and provided that for the avoidance of doubt, a material reduction of such annual target long-term incentive

compensation opportunity shall not be deemed to occur solely because such opportunity becomes payablesolely in cash; or
(iv) a change in the location of your principal place of employment with the Successor by more than fifty (50)miles from the location where you were principally employed immediately before the Change in Control.
Notwithstanding the foregoing, “ Good Reason ” shall not be deemed to exist unless: (A) you have provided writtennotice to the Successor of the existence of one or more of the conditions listed in (i) through (iv) above and yourintention to terminate employment as a result within sixty (60) days after your knowledge of such condition orconditions occurs; and (B) such condition or conditions have not been cured by the Successor within thirty (30) daysafter receipt of such notice.
4. Forfeiture of RSUs .
(a) RSUs which are not or do not become vested upon your termination of employment shall, coincident therewith,terminate and be of no force or effect.
(b) Notwithstanding any other provision hereof, upon any vesting event with respect to the RSUs hereunder, the numberof RSUs that would otherwise vest shall be reduced, but not below zero, by the number of Previously Awarded Units(as defined below) that vested prior to, or that are vesting as of (e.g., as a result of a termination event or Change inControl resulting in vesting hereunder and in respect of Previously Awarded Units), such vesting event, provided that(x) any Previously Awarded Unit taken into account to reduce the number of RSUs vesting hereunder on one vestingdate shall not be taken into account on any subsequent vesting date and (y) the number of RSUs that vest on aparticular vesting date shall not be retroactively adjusted (or subject to recoupment) based upon a subsequent vestingevent with respect to Previously Awarded Units. Any RSUs that would have vested pursuant to this Agreement butfor this paragraph shall terminate and be of no force or effect, effective upon the date they otherwise would havevested. For purposes hereof, “ Previously Awarded Units ” means the performance-based restricted stock unitsgranted to you in calendar years 2016 and 2017.
(c) In the event that (i) you are convicted of (A) a felony or (B) a misdemeanor involving fraud, dishonesty or moralturpitude, or (ii) you engage in conduct that adversely affects or may reasonably be expected to adversely affect thebusiness reputation or economic interests of BW, as determined in the sole judgment of the Committee, then all RSUsand all rights or benefits awarded to you under this grant of RSUs are forfeited, terminated and withdrawnimmediately upon such conviction or notice of such determination. The Committee shall have the right to suspendany and all rights or benefits awarded to you hereunder pending its investigation and final determination with regardto such matters. The forfeiture provisions of this paragraph are in addition to the provisions of Section 11 below.Notwithstanding the foregoing, the provisions of this Section 4(c) shall cease to apply as of a Change in Control.
5. Settlement of RSUs .
(a) NotinConnectionWithChangeinControl. If settlement is not occurring in connection with or following a Change inControl, vested RSUs shall be settled in Shares, which Shares shall be distributed as soon as administratively practicableafter the applicable Vesting Date, but in no event later than March 15 following the end of the calendar year in whichsuch Vesting Date occurs.
(b) ChangeinControl.
(i) Notwithstanding anything in this Agreement to the contrary, to the extent any RSUs are vested as of a Changein Control, such vested RSUs shall be settled in Shares within 10 business days of the Change in Control.
(ii) Notwithstanding anything in this Agreement to the contrary, if, during the two-year period following aChange in Control, you experience a termination of employment, the RSUs that are vested as of the date ofsuch termination of employment shall be settled for Shares within 10 business days of such termination ofemployment.
6. Dividends, Voting Rights and Other Rights . You shall have no rights of ownership in the Shares underlying the RSUs and shallhave no right to vote such Shares until the date on which the Shares are transferred to you pursuant hereto. To the extent thatcash dividends are otherwise paid with respect to Shares, dividend equivalents will be credited with respect to the Sharesunderlying the RSUs and shall vest at the same time and to the same extent as the related RSUs vest. Vested dividend

equivalents shall be paid at the same time the underlying Shares are transferred to you, with no earnings accruing thereon.Dividend equivalents credited with respect to RSUs that do not vest shall be forfeited at the same time the related RSUs areforfeited.
7. Taxes .
(a) You will realize income in connection with this RSU grant in accordance with the tax laws of the jurisdiction that isapplicable to you. You should consult your tax advisor as to the federal and/or state income or other tax consequencesassociated with this RSU grant as it relates to your specific circumstances.
(b) By acceptance of this award, you agree that any amount which BW or its successor is required to withhold on yourbehalf, including state income tax and FICA withholding, in connection with income realized by you under this awardor as otherwise required under applicable law will be satisfied by withholding Shares otherwise deliverable to youand having an aggregate fair market value as near equal in value but not exceeding the amount of such required taxwithholding.
8. Transferability . RSUs granted hereunder are non-transferable other than by will or by the laws of descent and distribution orpursuant to a qualified domestic relations order.
9. Adjustments . The RSUs and the number of Shares issuable for each RSU and the other terms and conditions of the grantevidenced by this Agreement (including, without limitation, the provisions of Section 4(b) above) are subject to mandatoryadjustment as provided in Section 4.4 of the Plan.
10. Compliance with Section 409A of the Code . To the extent applicable, it is intended that this Agreement and the Plan complywith or be exempt from the provisions of Section 409A of the Code. This Agreement and the Plan shall be administered in amanner consistent with this intent, and any provision that would cause this Agreement or the Plan to fail to satisfy Section 409Aof the Code shall have no force or effect until amended to comply with or be exempt from Section 409A of the Code (whichamendment may be retroactive to the extent permitted by Section 409A of the Code and may be made by BW without yourconsent). If the RSUs are “deferred compensation” (within the meaning of Section 409A of the Code and the regulationsthereunder) and become payable on your “separation from service” with BW and its Subsidiaries within the meaning of Section409A(a)(2)(A)(i) of the Code and you are a “specified employee” as determined pursuant to procedures adopted by BW incompliance with Section 409A of the Code, then, to the extent necessary to comply with Section 409A of the Code and avoidany additional taxes thereunder, settlement of the RSUs shall be made on the earlier of the fifth business day of the seventhmonth after the date of your “separation from service” with BW and its Subsidiaries within the meaning of Section 409A(a)(2)(A)(i) of the Code or your death.
11. Clawback Provisions .
(a) Recovery of RSUs . In the event that BW is required to prepare an accounting restatement due to the materialnoncompliance of BW with any financial reporting requirement under the U.S. federal securities laws as a result offraud (a “ Restatement ”) and the Board reasonably determines that you knowingly engaged in the fraud, BW willhave the right to recover the RSUs granted during the three-year period preceding the date on which the Board orBW, as applicable, determines it is required to prepare the Restatement (the “ Three-Year Period ”), or vested inwhole or in part during the Three-Year Period, to the extent of any excess of what would have been granted to orwould have vested for you under the Restatement.
(b) Recovery Process . In the event a Restatement is required, the Board, based upon a recommendation by theCommittee, will (i) review the RSUs either granted or vested in whole or in part during the Three-Year Period and (ii)in accordance with the provisions of this Agreement and the Plan, take reasonable action to seek recovery of theamount of such RSUs in excess of what would have been granted to or would have vested for you under theRestatement (but in no event more than the total amount of such RSUs), as such excess amount is reasonablydetermined by the Board in its sole discretion, in compliance with Section 409A of the Code. There shall be noduplication of recovery under Article 20 of the Plan and any of 15 U.S.C. Section 7243 (Section 304 of The Sarbanes-Oxley Act of 2002) and Section 10D of the Exchange Act. The clawback provisions of this Agreement are in additionto the forfeiture provisions contained in Section 4 above.
(c) CompensationRecoveryPolicy. Notwithstanding anything in this Agreement to the contrary, you acknowledge andagree that this Agreement and the award described herein (and any settlement thereof) are subject to the terms andconditions of the BW’s clawback policy (if any) as may be in effect from time to time specifically to implementSection 10D of the Exchange Act, and any applicable rules or regulations promulgated thereunder (including

applicable rules and regulations of any national securities exchange on which the Shares may be traded) (the “Compensation Recovery Policy ”), and that the terms of this Agreement shall be deemed superseded by and subject tothe terms and conditions of the Compensation Recovery Policy from and after the effective date thereof.
12. Amendments . Any amendment to the Plan shall be deemed to be an amendment to this Agreement to the extent that theAmendment is applicable hereto; provided , however , that (a) no amendment shall adversely affect your rights under thisAgreement without your written consent, and (b) your consent shall not be required to an amendment that is deemed necessaryby BW to ensure compliance with Section 409A of the Code or Section 10D of the Exchange Act.
13. Severability . In the event that one or more of the provisions of this Agreement shall be invalidated for any reason by a court ofcompetent jurisdiction, any provision so invalidated shall be deemed to be separable from the other provisions hereof, and theremaining provisions hereof shall continue to be valid and fully enforceable.
14. Governing Law . This Agreement shall be governed by and construed in accordance with the internal substantive laws of theState of Delaware, without giving effect to any principle of law that would result in the application of the law of any otherjurisdiction.
15. Successors and Assigns . Without limiting Section 8 hereof, the provisions of this Agreement shall inure to the benefit of, and bebinding upon, your successors, administrators, heirs, legal representatives and assigns, and the successors and assigns of BW.
16. Acknowledgement . You acknowledge that you (a) have received a copy of the Plan, (b) have had an opportunity to review theterms of this Agreement and the Plan, (c) understand the terms and conditions of this Agreement and the Plan and (d) agree tosuch terms and conditions.
17. Other Information . Neither the action of BW in establishing the Plan, nor any action taken by it, by the Committee or by youremployer, nor any provision of the Plan or this Agreement shall be construed as conferring upon you the right to be retained inthe employ of BW.

EXHIBIT 31.1
CERTIFICATION
I, E. James Ferland, certify that:
1. I have reviewed this quarterly report on Form 10-Q of Babcock & Wilcox Enterprises, Inc.;
2. Based on my knowledge, this report does not contain any untrue statement of a material fact or omit to state a material fact necessary tomake the statements made, in light of the circumstances under which such statements were made, not misleading with respect to theperiod covered by this report;
3. Based on my knowledge, the financial statements, and other financial information included in this report, fairly present in all materialrespects the financial condition, results of operations and cash flows of the registrant as of, and for, the periods presented in this report;
4. The registrant’s other certifying officer and I are responsible for establishing and maintaining disclosure controls and procedures (asdefined in Exchange Act Rules 13a-15(e) and 15d-15(e)) for the registrant and have:
a. designed such disclosure controls and procedures, or caused such disclosure controls and procedures to be designed under oursupervision, to ensure that material information relating to the registrant, including its consolidated subsidiaries, is made knownto us by others within those entities, particularly during the period in which this report is being prepared;
b. designed such internal control over financial reporting, or caused such internal control over financial reporting to be designedunder our supervision, to provide reasonable assurance regarding the reliability of financial reporting and the preparation offinancial statements for external purposes in accordance with generally accepted accounting principles;
c. evaluated the effectiveness of the registrant’s disclosure controls and procedures and presented in this report our conclusionsabout the effectiveness of the disclosure controls and procedures, as of the end of the period covered by this report based on suchevaluation; and
d. disclosed in this report any change in the registrant’s internal control over financial reporting that occurred during the registrant’smost recent fiscal quarter that has materially affected, or is reasonably likely to materially affect, the registrant’s internal controlover financial reporting; and
5. The registrant’s other certifying officer and I have disclosed, based on our most recent evaluation of internal control over financialreporting, to the registrant’s auditors and the audit committee of the registrant’s board of directors (or persons performing the equivalentfunctions):
a. all significant deficiencies and material weaknesses in the design or operation of internal control over financial reporting whichare reasonably likely to adversely affect the registrant’s ability to record, process, summarize and report financial information;and
b. any fraud, whether or not material, that involves management or other employees who have a significant role in the registrant’sinternal control over financial reporting.
August 9, 2017 /s/ E. James Ferland E. James Ferland Chairman and Chief Executive Officer

EXHIBIT 31.2
CERTIFICATION
I, Jenny L. Apker, certify that:
1. I have reviewed this quarterly report on Form 10-Q of Babcock & Wilcox Enterprises, Inc.;
2. Based on my knowledge, this report does not contain any untrue statement of a material fact or omit to state a material fact necessary tomake the statements made, in light of the circumstances under which such statements were made, not misleading with respect to theperiod covered by this report;
3. Based on my knowledge, the financial statements, and other financial information included in this report, fairly present in all materialrespects the financial condition, results of operations and cash flows of the registrant as of, and for, the periods presented in this report;
4. The registrant’s other certifying officer and I are responsible for establishing and maintaining disclosure controls and procedures (asdefined in Exchange Act Rules 13a-15(e) and 15d-15(e)) for the registrant and have:f
a. designed such disclosure controls and procedures, or caused such disclosure controls and procedures to be designed under oursupervision, to ensure that material information relating to the registrant, including its consolidated subsidiaries, is made knownto us by others within those entities, particularly during the period in which this report is being prepared;
b. designed such internal control over financial reporting, or caused such internal control over financial reporting to be designedunder our supervision, to provide reasonable assurance regarding the reliability of financial reporting and the preparation offinancial statements for external purposes in accordance with generally accepted accounting principles;
c. evaluated the effectiveness of the registrant’s disclosure controls and procedures and presented in this report our conclusionsabout the effectiveness of the disclosure controls and procedures, as of the end of the period covered by this report based on suchevaluation; and
d. disclosed in this report any change in the registrant’s internal control over financial reporting that occurred during the registrant’smost recent fiscal quarter that has materially affected, or is reasonably likely to materially affect, the registrant’s internal controlover financial reporting; and
5. The registrant’s other certifying officer and I have disclosed, based on our most recent evaluation of internal control over financialreporting, to the registrant’s auditors and the audit committee of the registrant’s board of directors (or persons performing the equivalentfunctions):
a. all significant deficiencies and material weaknesses in the design or operation of internal control over financial reporting whichare reasonably likely to adversely affect the registrant’s ability to record, process, summarize and report financial information;and
b. any fraud, whether or not material, that involves management or other employees who have a significant role in the registrant’sinternal control over financial reporting.
August 9, 2017 /s/ Jenny L. Apker Jenny L. Apker Senior Vice President and Chief Financial Officer

EXHIBIT 32.1
BABCOCK & WILCOX ENTERPRISES, INC.
Certification Pursuant toSection 906 of the Sarbanes-Oxley Act of 2002
(Subsections (a) and (b) of Section 1350, Chapter 63 of Title 18, United States Code)
Pursuant to Section 906 of the Sarbanes-Oxley Act of 2002 (Subsections (a) and (b) of Section 1350, Chapter 63 of Title 18, United StatesCode), I, E. James Ferland, Chairman and Chief Executive Officer of Babcock & Wilcox Enterprises, Inc., a Delaware corporation (the“Company”), hereby certify, to my knowledge, that:
(1) the Company’s Quarterly Report on Form 10-Q for the quarter and six months ended June 30, 2017 (the “Report”) fully complieswith the requirements of Section 13(a) or 15(d) of the Securities Exchange Act of 1934; and
(2) information contained in the Report fairly presents, in all material respects, the financial condition and results of operations of B&Was of the dates and for the periods expressed in the Report.
Dated: August 9, 2017 /s/ E. James Ferland E. James Ferland Chairman and Chief Executive Officer
EXHIBIT 32.2
BABCOCK & WILCOX ENTERPRISES, INC.
Certification Pursuant toSection 906 of the Sarbanes-Oxley Act of 2002
(Subsections (a) and (b) of Section 1350, Chapter 63 of Title 18, United States Code)
Pursuant to Section 906 of the Sarbanes-Oxley Act of 2002 (Subsections (a) and (b) of Section 1350, Chapter 63 of Title 18, United StatesCode), I, Jenny L. Apker, Senior Vice President and Chief Financial Officer of Babcock & Wilcox Enterprises, Inc., a Delaware corporation(the “Company”), hereby certify, to my knowledge, that:
(1) the Company’s Quarterly Report on Form 10-Q for the quarter and six months ended June 30, 2017 (the “Report”) fully complieswith the requirements of Section 13(a) or 15(d) of the Securities Exchange Act of 1934; and
(2) information contained in the Report fairly presents, in all material respects, the financial condition and results of operations of B&Was of the dates and for the periods expressed in the Report.
Dated: August 9, 2017 /s/ Jenny L. Apker Jenny L. Apker Senior Vice President and Chief Financial Officer