babcock & wilcox enterprises, inc. · babcock & wilcox enterprises, inc. (“b&w”)...
TRANSCRIPT

Babcock & Wilcox Enterprises, Inc.Company OverviewNovember 2016

© Babcock & Wilcox Enterprises, Inc. All rights reserved. 22
Safe Harbor Statement
Forward‐looking statements. Babcock & Wilcox Enterprises, Inc. (“B&W”) cautions that this presentation contains forward‐looking statements, including, without limitation, statements relating to our strategic objectives; management’s expectations regarding the industries in which we operate; our guidance and forecasts for 2016, including estimated annual revenue; our projected operating margin improvements, savings and restructuring costs, including pursuant to our restructuring plan announced in June 2016; growth through acquisitions; our projected tax rate; and our July 1, 2016 acquisition of SPIG S.p.A. (“SPIG”). These forward‐looking statements are based on management’s current expectations and involve a number of risks and uncertainties, including, among other things, our ability to realize anticipated savings and operational benefits from the restructuring plan; our ability to successfully integrate SPIG and realize the expected synergies from the acquisition; our ability to realize the benefits of expected cross‐selling opportunities resulting from the SPIG acquisition; changes in the jurisdictional mix of our income and losses; disruptions experienced with customers and suppliers; adverse changes in the industries in which we operate; changes or termination of contracts in backlog; the timing and amount of repurchases of our common stock; and the inability to grow and diversify through acquisitions. If one or more of these risks or other risks materialize, actual results may vary materially from those expressed. For a more complete discussion of these and other risk factors, see B&W’s filings with the Securities and Exchange Commission, including our most recent annual report on Form 10‐K and subsequent quarterly reports on Form 10‐Q. B&W cautions not to place undue reliance on these forward‐looking statements, which speak only as of the date of this presentation, and undertake no obligation to update or revise any forward‐looking statement, except to the extent required by applicable law.
Non‐GAAP financial information. This presentation includes Adjusted Operating Income and Adjusted Earnings per Share as non‐GAAP financial measures. A reconciliation of historical Adjusted Operating Income and Adjusted Earnings per Share to the most directly comparable GAAP measures is included at the end of this presentation. These measures should be considered in addition to resultsprepared in accordance with GAAP, but are not a substitute for GAAP results.

© Babcock & Wilcox Enterprises, Inc. All rights reserved. 33
Company Profile
B&W is a global leader in custom engineered energy and environmental solutions
Headquarters: Charlotte, NC
Ownership: Public (NYSE:BW)
Revenue: ~$1.7B
Chairman & CEO: E. James Ferland
Employees:Approximately 5,700 employees, in addition to 2,500 joint venture employees worldwide
Locations: 28 countries
Founded: 1867
Business model delivers maximum customer value, and thus shareholder value, through
• Custom technologies
• Engineered solutions
• Aftermarket service offerings
33

© Babcock & Wilcox Enterprises, Inc. All rights reserved. 44
Industrial
Renewable
Power Optimize Our Legacy Business and Improve Efficiency
Pursue Core Growth in Global Markets
Execute a Disciplined Acquisition Program to Drive Growth and Diversification
Consistent Strategic Focus…
…is well‐aligned with our business segments

© Babcock & Wilcox Enterprises, Inc. All rights reserved. 55
Power
• Aftermarket parts and services• Utility steam generation• Industrial power• Environmental solutions
Renewable
• Waste‐to‐Energy solutions• Biomass power solutions• Environmental solutions• Operations and maintenance
Industrial
• Air pollution control systems • Engineered equipment• Wet and dry cooling systems• Aftermarket solutions
Business Segment Overview
~$400M
~$1.0B
~$300M
<3%
75 ‐ 80%
<1%
Estimated2016
Revenue% Revenue from Coal
CustomTechnologies
EngineeredSolutions
AftermarketServiceOfferings

© Babcock & Wilcox Enterprises, Inc. All rights reserved. 66
Asia & Other 12%
North America64%
Europe24%
Engineered Products& OtherSolutions
46%
Aftermarket Parts & Services54%
US Coal37%
Non‐US Coal13%
Industrial, Renewable
& Gas50%
Power64%
Industrial12%
Renewable24%
Consolidated LTM Revenue Overview
• Continued organic and inorganic growth potential• Further diversification of end markets exposure is key to strategy
• Strong aftermarket services business• Increasing global presence and brand recognition
Segments End Markets Products & Services Geography
Note: Charts are based on last twelve months (LTM) 9/30/2016 financial data

© Babcock & Wilcox Enterprises, Inc. All rights reserved. 77
• Traditional Power Generation
• Renewable Power Generation
• Pulp and Paper, Wood Products
• Oil, Gas and Chemical
• Mining and Metals
• Iron and Steel
• Food Processing and Agriculture
• Pharmaceutical
• Coatings and Flexible Packaging
• Cement
• Automotive
• General Industry and Manufacturing
• Waste Management
Markets We Serve

© Babcock & Wilcox Enterprises, Inc. All rights reserved. 88
Parts and Technical Services
Service Projects Utility Steam Generation
EnvironmentalSolutions
IndustrialSolutions
Power Segment
• Focused on the supply of and aftermarket services for steam generating, environmental and auxiliary equipment for power generation and other industrial applications
• Services B&W‐installed electricity generation capacity of approximately 300,000 MW in more than 90 countries
• 2016 estimated revenue of ~$1.0B Downward pressure on U.S. coal power generation
Growth potential in international coal power generation and industrial markets
• More than 20% of revenues from industrial customers outside of coal power generation – pulp & paper, carbon black emissions projects, and natural gas fired package boilers
• Strong presence in the U.S. coal power generation aftermarket services
US Coal58%
Non‐US Coal20%
OtherIndustrial
22%
Intl29%
US71%
Other31%
Aftermarket Parts & Services69%
Note: Charts are based on LTM 9/30/2016 financial data
© Babcock & Wilcox Enterprises, Inc. All rights reserved. 99
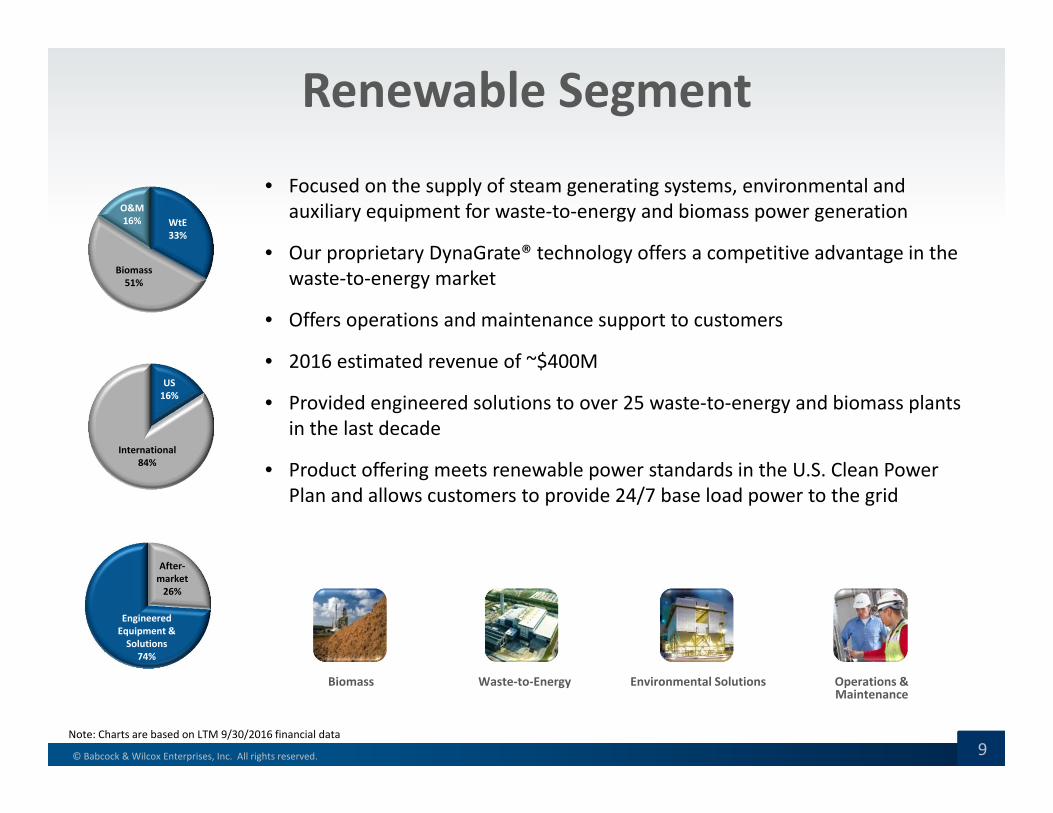
Renewable Segment
• Focused on the supply of steam generating systems, environmental and auxiliary equipment for waste‐to‐energy and biomass power generation
• Our proprietary DynaGrate® technology offers a competitive advantage in the waste‐to‐energy market
• Offers operations and maintenance support to customers
• 2016 estimated revenue of ~$400M
• Provided engineered solutions to over 25 waste‐to‐energy and biomass plants in the last decade
• Product offering meets renewable power standards in the U.S. Clean Power Plan and allows customers to provide 24/7 base load power to the grid
Biomass Waste‐to‐Energy Environmental Solutions Operations & Maintenance
O&M16% WtE
33%
Biomass51%
US 16%
International84%
After‐market 26%
Engineered Equipment & Solutions
74%
Note: Charts are based on LTM 9/30/2016 financial data

© Babcock & Wilcox Enterprises, Inc. All rights reserved. 1010
Air Pollution Control Systems
Engineered Equipment
Wet CoolingSystems
Dry CoolingSystems
AftermarketServices
Industrial Segment
• Focused on custom engineered cooling, environmental and other industrial equipment along with related aftermarket services
• B&W MEGTEC provides custom environmental solutions to a large variety of industrial end markets (~3,100 customers in over 60 countries); driven by industrial capital expenditures and environmental regulations
• B&W SPIG provides custom dry and wet cooling solutions to a variety of production processes using steam including natural gas power generation, oil & gas and other manufacturers; driven by water scarcity, environmental regulations and growth of natural gas power generation
• 2016 estimated revenue of ~$300M (includes only 6 months of B&W SPIG revenue)
• The Industrial segment is expected to be a growth driver for B&W and will be a continued focus for acquisitions
Environmental and Engineered Equipment
53%
Cooling Systems15%
After‐market Services32%
US 47%
International53%
After‐marketServices32%
Engineered Products and
Other68%
Note: Charts are based on LTM 9/30/2016 financial data

© Babcock & Wilcox Enterprises, Inc. All rights reserved. 1111
Summary Historical Financial Information
$ in millions, except per share amounts
ThirdQuarter 2016
ThirdQuarter2015
YTD2016
YTD2015
Revenues 411.0 420.0 1,198.3 1,254.6
GAAP Operating Income 11.1 9.6 (44.2) 31.8
Adjusted Operating Income(1) 15.0 21.9 27.1 64.3
GAAP Earnings per Share, Diluted 0.18 0.11 (0.87) 0.40
Adjusted Earnings per Share, Diluted(1) 0.24 0.25 0.32 0.78
Q3 ’16 Adjusted Operating Income was impacted by:• Lower Power segment revenues
• Higher intangible amortization expense from B&W SPIG acquisition
• Higher Power segment gross margin
• Reductions in other overhead expenses
(1) See Appendix for reconciliation of adjusted, non‐GAAP items
Q3 ‘16 Revenue impacted by:• Decreased volume in Power segment (↓$84.4M)
• Record volume for Renewable (↑$37.4M)
• Acquisition of B&W SPIG (↑$38.3M)

© Babcock & Wilcox Enterprises, Inc. All rights reserved. 1212
Q3 2015 Q3 2016
Q3 Financial Results OverviewSegment Revenue and Gross Profit
$ in Millions
Revenue• Power: Declined due to lower oil sands work in Canada and lower power plant retrofit activity
• Renewable: Record quarterly revenue due to higher volume
• Industrial: Increase driven by B&W SPIG acquisition
Power Renewable Industrial(1)
Q3 2015 Q3 2016
Q3 2015 Q3 2016 Q3 2015 Q3 2016 Q3 2015 Q3 2016
Q3 2015 Q3 201616.2% 23.5% 20.1% 14.8% 34.4% 19.0%
$294.2$209.8
$86.9 $124.3$38.9 $76.8
$47.6 $48.9
$17.5 $18.6 $13.4 $14.6
GM
Revenu
eGross Profit
(1) 2016 financials include B&W SPIG, 2015 does not
Gross Profit Margin• Power: Improvement due to good project performance and benefits from restructuring activities in Q3 2016; one‐time contract and litigation settlement impacted Q3 2015
• Renewable: Q3 2016 impacted by low margin contribution from challenged European renewable contract
• Industrial: Timing of projects for B&W SPIG impacted Q3 2016 and revenue mix for B&W MEGTEC in Q3 2015 produced higher than normal gross profit margin by comparison

© Babcock & Wilcox Enterprises, Inc. All rights reserved. 1313
•Market conditions in the Power segment is creating bookings pressure
• Backlog is down year over year but up slightly from Q2 2016
• Bid pipeline is robust and the number of opportunities is up from the prior period
Bookings Backlog
Bookings Pressure but Stabilizing Backlog
Q3 2015 Q2 2016 Q3 2016 Q3 2015 Q2 2016 Q3 2016
$418M
$266M
$2.44B $2.19B$2.15B
$213M

© Babcock & Wilcox Enterprises, Inc. All rights reserved. 1414
FY 2016 Guidance
• Revenue is expected to be $1.7B
• Full year adjusted EPS in a range of $0.63 to $0.83(1)
• Includes $0.48 impact from European renewable contract loss
• Includes accelerated intangible amortization effects in 2H 2016 from B&W SPIG
• Adjusted EPS estimate excludes any mark‐to‐market adjustment for pension and post‐retirement benefits and restructuring charges
• Includes share repurchase activity through September 30, 2016
(1) See appendix for Reconciliation of Adjusted EPS Guidance
© Babcock & Wilcox Enterprises, Inc. All rights reserved. 1515© Babcock & Wilcox Enterprises, Inc. All rights reserved.
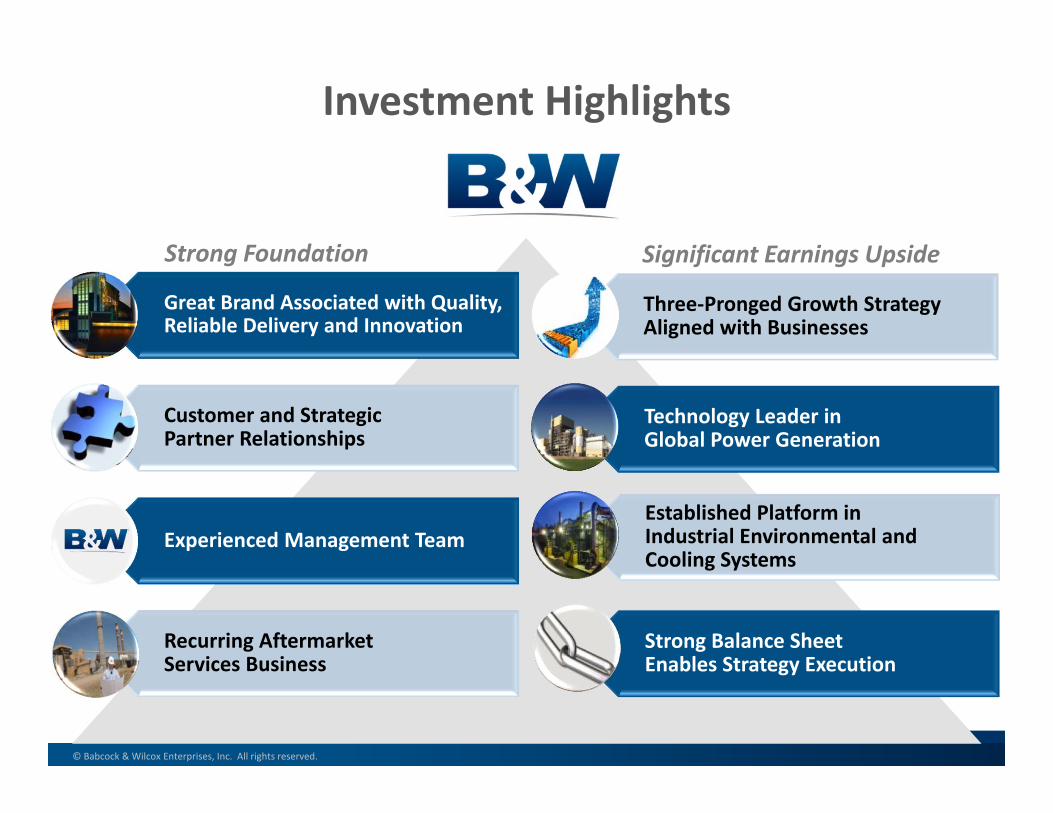
Investment Highlights
Great Brand Associated with Quality, Reliable Delivery and Innovation
Customer and Strategic Partner Relationships
Experienced Management Team
Recurring Aftermarket Services Business
Strong Balance Sheet Enables Strategy Execution
Established Platform in Industrial Environmental and Cooling Systems
Technology Leader in Global Power Generation
Three‐Pronged Growth Strategy Aligned with Businesses
Significant Earnings UpsideStrong Foundation

© Babcock & Wilcox Enterprises, Inc. All rights reserved. 1616
Appendix

© Babcock & Wilcox Enterprises, Inc. All rights reserved. 1717
Skilled Management Team
Jenny ApkerSenior Vice President
& Chief Financial Officer
Finance
Elias GedeonSenior Vice President & Chief Business Development Officer
Business Development
Jim Ferland
Chairman and Chief Executive Officer
Mark CaranoSenior Vice President
& Treasurer
Corporate Developmentand Treasury
André HallSenior Vice President & General Counsel
Jimmy MorganSenior Vice President
Operations
Wendy RadtkeSenior Vice President
Human Resources
Mark LowSenior Vice President
Power
Paul ScavuzzoSenior Vice President
Renewable
Ken ZakSenior Vice President
B&W MEGTEC
Francesco RacheliSenior Vice President
B&W SPIG Legal

© Babcock & Wilcox Enterprises, Inc. All rights reserved. 1818© Babcock & Wilcox Enterprises, Inc. All rights reserved.
Experienced Board of DirectorsThomas A. ChristopherFormer Vice Chairman of AREVA, Mr. Christopher also served as its President and CEO from 2000 to 2009. Before that, he held a number of positions at Westinghouse, including Vice President and General Manager, Westinghouse Power Services.
Cynthia S. DubinMs. Dubin served as Finance Director for JKX Oil & Gas, an LSE‐listed oil and gas exploration and production company, from November 2011 through January 2016. From 2006‐2011 she was co‐founder and CFO of Canamens, a pan European oil and gas company. She was with Edison Mission Energy from 1993‐2005, latterly as VP and CFO for EMEA.
Brian K. FerraioliMr. Ferraioli is the Executive Vice President and Chief Financial Officer for KBR, a global technology, engineering, procurement and construction company. He was formerly Executive Vice President and CFO of The Shaw Group, which was acquired by CB&I in February 2013.
Stephen G. HanksFrom November 2007 until his retirement in January 2008, Mr. Hanks served as President of the Washington Division of URS Corporation, an engineering, construction and technical services company, as well as a member of the Board of Directors. From June 2001 to November 2007, he was President and CEO of Washington Group Intl.
Anne R. PramaggioreMs. Pramaggiore is President and CEO of ComEd, an electric utility company delivering electricity to 3.8 million customers in Chicago and Northern Illinois. Ms. Pramaggiore also serves as a board member of Chicago Federal Reserve Board, Motorola Solutions, and several civic and community organizations.
Larry L. WeyersPrior to his retirement in March 2010, Mr. Weyers served as Chairman of Integrys Energy Group, Inc., a holding company with operations providing products and services in regulated and non‐regulated energy markets. From 2010‐2015, he served as VP and Lead Director of the Board of Directors of Green Bay Packers, Inc., on which he served beginning in 2003.
Jim FerlandChairman and Chief Executive Officer
18

© Babcock & Wilcox Enterprises, Inc. All rights reserved. 1919
Ongoing Rationalization of Operations
Cambridge, Ontario
Ceased fossil operations in 2014 and consolidated into other North American sites
Cambridge, Ontario
Ceased fossil operations in 2014 and consolidated into other North American sites
B&W Foundry (Barberton, OH)Operations closed in
June 2015 and replaced with
strategic partnership
B&W Foundry (Barberton, OH)Operations closed in
June 2015 and replaced with
strategic partnership
Melville, Saskatchewan
Plant mothballed upon completion of contract
work in July 2015
Melville, Saskatchewan
Plant mothballed upon completion of contract
work in July 2015
West Point, MSRelocation to Monterrey facility to be completed
and West Point operations closed in
May 2016
West Point, MSRelocation to Monterrey facility to be completed
and West Point operations closed in
May 2016
Magotteaux PartnershipEntered into a strategic
agreement in January 2015 for the supply of pulverizersand other specialty castings
and wear materials
Magotteaux PartnershipEntered into a strategic
agreement in January 2015 for the supply of pulverizersand other specialty castings
and wear materials
Monterrey, MexicoExpansion completed in December 2015 and will enable high‐quality and cost efficient service to the Americas
Monterrey, MexicoExpansion completed in December 2015 and will enable high‐quality and cost efficient service to the Americas
2014 2015 2016
Through a critical but balanced evaluation approach, B&W is reducing fixed overhead and sustaining margins
Diamond Power Restructuring
Integration of parts businesses and reducing costs
through make/buy decisions
Diamond Power Restructuring
Integration of parts businesses and reducing costs
through make/buy decisions
Ongoing Pipeline of Initiatives
B&W continues to work toward maximum cost effectiveness across all manufacturing assets
Ongoing Pipeline of Initiatives
B&W continues to work toward maximum cost effectiveness across all manufacturing assets
North America Restructuring
Eliminated over 200 positions due to projections that coal utilization is declining faster than previously forecast
North America Restructuring
Eliminated over 200 positions due to projections that coal utilization is declining faster than previously forecast

© Babcock & Wilcox Enterprises, Inc. All rights reserved. 2020
Reconciliation of Adjusted, Non‐GAAP Results
Note: Figures may not be clerically accurate due to rounding.
$ in millions, except per share amounts
GAAPRestructur‐
ing
Acquisition and
Integration Costs
Pension & OPEB MTM (Gain) / Loss
Spin Costs
Non‐GAAP GAAP Restructuring
Pension & OPEB MTM (Gain) / Loss Spin Costs
Acquisition and
Integration Costs
Non‐GAAP
Operating income (loss) $11.1 $2.0 $0.8 $0.6 $0.4 $15.0 ($44.2) $34.6 $30.5 $3.4 $2.8 $27.1Other income (expense) (0.5) — — — — (0.5) (0.4) — — — — (0.4)Income tax (expense) benefit (1.6) (0.7) 0.2 (0.2) — (2.4) 0.8 0.4 (11.1) 0.3 (0.6) (10.3)Net income (loss) 9.0 1.3 1.0 0.5 0.4 12.2 (43.8) 35.0 19.4 3.7 2.2 16.5Net loss attributable to non‐controlling interest (0.1) — — — — (0.1) (0.3) — — — — (0.3)Net income (loss) attributable to B&W shareholders $8.9 $1.3 $1.0 $0.5 $0.4 $12.0 ($44.1) $35.0 $19.4 $3.7 $2.2 $16.2
Diluted EPS ‐ continuing operations $0.18 $0.03 $0.02 $0.01 $0.01 $0.24 ($0.87) $0.69 $0.38 $0.07 $0.04 $0.32
Income tax rate 15.2% 16.3% 1.8% 38.4%
GAAPLitigation Settlement Spin Costs Restructuring
Non‐GAAP GAAP
Litigation Settlement
Impair‐ments
Restructur‐ing
NE Sgmt allocation
Spin Costs
Non‐GAAP
Operating income (loss) $9.6 $9.6 $1.6 $1.1 $21.9 $31.8 $9.6 $9.0 $8.7 $2.7 $2.5 $64.3Other income (expense) (1.6) — — — (1.6) (1.7) — — — — — (1.7)Income tax (expense) benefit (1.8) (3.7) (0.6) (0.4) (6.5) (8.4) (3.7) (3.4) (3.1) (0.7) (1.0) (20.3)Net income (loss) 6.3 5.8 1.0 0.7 13.8 21.8 5.8 5.6 5.6 2.0 1.6 42.3Net loss attributable to non‐controlling interest (0.1) — — — (0.1) (0.2) — — — — — (0.2)Net income (loss) attributable to B&W shareholders $6.2 $5.8 $1.0 $0.7 $13.7 $21.5 $5.8 $5.6 $5.6 $2.0 $1.6 $42.1
Diluted EPS ‐ continuing operations $0.11 $0.11 $0.02 $0.01 $0.25 $0.40 $0.11 $0.10 $0.10 $0.04 $0.03 $0.78
Income tax rate 22.0% 32.1% 27.8% 32.5%
Three Months Ended September 30, 2016 Nine Months Ended September 30, 2016
Nine Months Ended September 30, 2015Three Months Ended September 30, 2015

© Babcock & Wilcox Enterprises, Inc. All rights reserved. 2121
Reconciliation of Adjusted EPS Guidance
Management has provided full year adjusted earnings per diluted share ("adjusted EPS") guidance of $0.63 to $0.83. It is not possible for management to identify the amount or significance of future adjustments associated with potential mark to market adjustments to our pension and other postretirement benefit plan liabilities or other non‐routine costs that we adjust in our presentation of adjusted EPS guidance. These items are dependent on future events and/or market inputs that are not reasonably estimable at this time. Accordingly, management is unable to reconcile without unreasonable effort the Company's forecasted range of adjusted EPS for the full year included in the FY 2016 Guidance slide within this presentation to a comparable GAAP range. However, items excluded from our adjusted EPS guidance include the historical adjustments noted in the prior slides, and our adjusted EPS guidance also excludes future estimable adjusting items, including charges relating to previously announced restructuring initiatives of $0.08‐$0.16 per share, additional spin costs of approximately $0.01 per share and additional acquisition and integration costs of approximately $0.01 per share.