awareness and action: coral bleaching
TRANSCRIPT

1
Awareness and Action: Coral Bleaching
Research study on changed behavior upon receiving
information concerning coral bleaching effects
Dissertation presented as partial requirement for obtaining
the Master’s degree in Statistics and Information
Management
Linda Underwood

2
MEGI

3
NOVA Information Management School
Instituto Superior de Estatística e Gestão de Informação
Universidade Nova de Lisboa
Awareness and Action: Coral bleaching
By:
Linda Underwood
Dissertation presented as partial requirement for obtaining the Master’s degree in Statistics and
Information Management
Advisor / Co Advisor: Ana Cristina Costa

4

5
ACKNOLEDGEMENTS
I would like to begin thanking the many people who supported and helped me throughout this last
school year. Without the experiences and knowledge gained at NOVA IMS, this thesis would not be
possible.
First, I would like to thank my tutor, Ana Cristina Costa for guiding me through this process and
providing insight to my work. Second, I would like to thank my parents, Douglas and Mercedes, for
giving me love and support throughout my time abroad at NOVA IMS and the encouragement to push
myself in both academics as well as life experiences. Third, I would like to thank my siblings and friends
who lifted my spirits when facing difficult tasks. Lastly, I would like to thank my best friend Margarida
Tedim, who introduced me to the incredibly generous and kind Portuguese culture, and who without,
my time at NOVA IMS would not be the same.
This thesis is done for all of you and so many more, so that we may continue to live in a world with
healthy ecosystems, including coral reefs and many species that depend on it.

6
7
ABSTRACT
Coral reefs are living organisms that act as an important ecosystem for many different kinds of
invertebrates and vertebrates. They are essential for marine life to survive yet also provide many benefits
for human life as well. “Coral bleaching” is caused by climate change due to the increase in temperature
in the ocean’s water which starves the organism and what remains is only its white skeleton. This is one
of the biggest threats to coral reefs. This study aims to understand whether, when given information
about coral bleaching specifically, people are more likely to participate in actions that prevent coral
bleaching through global warming and if so, what their main motive is to do so. This is important for
organizations whose goal is to protect the coral reef so that they can make more effective campaigns. A
survey is conducted with questions specifically targeting these main goals and statistically analyzed before
and after a passage containing facts regarding coral bleaching, to determine if there are any changes in
people’s standpoint. Results showed a lack of knowledge of the importance of coral reefs for human life
which increases likelihood to take action against coral bleaching once reading the passage, when
considering all respondents. Previous belief in cause and existence of climate change influences the
likelihood to take action overall. However, Gender and Age play a role in increased awareness and
likelihood to take action against coral bleaching.
KEYWORDS
Coral bleaching, Coral Reefs, Global Warming, Climate Change

8

9
INDEX
Table of Contents 1. Introduction ............................................................................................................................. 14
1.1. Background ....................................................................................................................... 14
1.2. Problem Identification and Relevance .............................................................................. 15
1.3. Objectives .......................................................................................................................... 16
1.4. Dissertation Outline .......................................................................................................... 16
2. Literature Review ..................................................................................................................... 18
2.1. Coral Bleaching .................................................................................................................. 18
2.2. Climate Change Awareness ............................................................................................... 19
3. Methodology ............................................................................................................................ 22
3.1. Survey Design .................................................................................................................... 22
3.1.1. Sampling Design .................................................................................................................. 22
3.1.2. Questionaire ........................................................................................................................ 23
3.1.3. Rationale of Questionairre .................................................................................................. 27
3.1.4. Cleaning, Preparing, and Exporting Data ............................................................................ 30
3.2 Data Analysis ..................................................................................................................... 30
3.2.1 Descriptive Research ........................................................................................................... 30
3.2.2. Mann Whitney U Test ......................................................................................................... 31
3.2.3. Kruskal Wallis Test .............................................................................................................. 31
3.2.4. Wilcoxon Sign Rank Test ..................................................................................................... 31
4. Results of pilot .......................................................................................................................... 33
4.1. Exploratory Analysis .......................................................................................................... 33
4.2. Wilcoxon Sign Rank Test ................................................................................................... 34
4.3. Conclusion of pilot study ................................................................................................... 36
5. Final results .............................................................................................................................. 38
5.1. Descriptive Overview ........................................................................................................ 38
5.2. All respondents ................................................................................................................. 42
5.2.1. Descriptive Statistics ........................................................................................................... 42
5.2.2. Wilcoxon Sign Rank Test ..................................................................................................... 43
5.3. “Take Responsibility” vs “Do not take Responsibility” ..................................................... 44
10
5.3.1. Descriptive .......................................................................................................................... 44
5.3.2. Statistical ............................................................................................................................. 45
5.4. “Active” and “Not Active” ................................................................................................. 48
5.4.1. Descriptive .......................................................................................................................... 48
5.4.2. Statistical ............................................................................................................................. 48
5.5. Male vs Female ................................................................................................................. 51
5.5.1. Descriptive .......................................................................................................................... 51
5.5.2. Statistical ............................................................................................................................. 52
5.6. Age..................................................................................................................................... 56
5.6.1. Descriptive Statistics ........................................................................................................... 56
5.6.2. Statistical ............................................................................................................................. 57
6. Conclusion ................................................................................................................................ 61
6.1. Limitations and Suggestions.............................................................................................. 62
7. References ................................................................................................................................ 64
Appendix ....................................................................................................................................... 67

11
LIST OF TABLES
Table 1: Percentage of respondents for Q4 and Q11 Pilot Test ................................................................. 33
Table 2: Percentage of respondents for Q5 and Q12 Pilot Test ................................................................. 33
Table 3: Percentage of respondents for Q6 and Q13 Pilot Test ................................................................. 34
Table 4: Percentage of respondents for Q7 and Q14 Pilot Test ................................................................. 34
Table 5: WSRT Sum of Ranks for Pilot Test ................................................................................................. 34
Table 6: WSRT Test Statistics for Pilot Test ................................................................................................. 36
Table 7: Count and Percentage of Q3 ......................................................................................................... 39
Table 8: Count and Percentage of Q4 ......................................................................................................... 39
Table 9: Count and Percentage of Q5 ......................................................................................................... 39
Table 10: Count and Percentage of Q6 ....................................................................................................... 40
Table 11: Count and Percentage of Q7 ....................................................................................................... 40
Table 12: Count and Percentage of Q8 ....................................................................................................... 40
Table 13: WSRT Test Statistics for "All" ...................................................................................................... 43
Table 14: "After" Medians for "All"............................................................................................................. 43
Table 15: MWU Test Statistics for “DTR” and “TR”.................................................................................... 45
Table 16: "Before" medians for "DTR" and "TR"......................................................................................... 45
Table 17: Marine life WSRT Test Statistics for "DTR" and "TR" .................................................................. 46
Table 18: Marine life "After" Medians for "DTR" and "TR" ........................................................................ 46
Table 19: Human life WSRT for "DTR" and "TR" ......................................................................................... 47
Table 20: Human life "After" medians for "DTR" and "TR"......................................................................... 47
Table 21: MWU Test Statistics for "Not Active" and "Active" .................................................................... 49
Table 22: "Before" Medians for "Not Active" and "Active" ........................................................................ 49
Table 23: Marine life WSRT Test Statistics for "Not Active" and "Active" .................................................. 50
Table 24: Marine life "After" Medians for "Not Active" and "Active" ........................................................ 50
Table 25: Human life WSRT for "Not Active" and "Active" ......................................................................... 50
Table 26: Human life "After" Medians for "Not Active" and "Active" ........................................................ 50
Table 27: MWU Test Statistics for "Gender" .............................................................................................. 52
Table 28: "Before" Medians for "Gender" .................................................................................................. 52
Table 29: Marine life WSRT Test Statistics for "Gender" ............................................................................ 53
Table 30: Marine life "After" Medians for "Gender" .................................................................................. 53
Table 31: Human life WSRT Test Statistics for "Gender" ............................................................................ 53
Table 32: Human life "After" Medians for "Gender" .................................................................................. 54
Table 33: Q12 and Q17 Ranks for "M/DTR" and "M/TR"............................................................................ 55
Table 34: WSRT Test Statistics for "M/DTR" and "M/TR" ........................................................................... 55
Table 35: "Before" Medians for "Age" ........................................................................................................ 57
Table 36: KW Test Statistics for "Age" ........................................................................................................ 58
Table 37: "After" Medians for "Age"........................................................................................................... 58
Table 38: WSRT Test Statistics for "Age" .................................................................................................... 59

12
LIST OF FIGURES
Figure 1: Gender ......................................................................................................................................... 38
Figure 2: Age ............................................................................................................................................... 38
Figure 3: Clustered bar chart of Q8 by Q7 .................................................................................................. 40
Figure 4: Clustered bar chart of Q8 and Q6 ................................................................................................ 41
Figure 5: Bar Chart of Q13 .......................................................................................................................... 42
Figure 6: "Before" and "After" Boxplots for "All" ....................................................................................... 42
Figure 7: "Before" and "After" boxplots for "TR" and "DTR" ...................................................................... 44
Figure 8: "Before" and "After" Boxplots for "Active" and "Not Active" ..................................................... 48
Figure 9:"Before" and "After" Boxplots for "Gender" ................................................................................ 52
Figure 10: "Before" and "After" Boxplots for "Gender" and "DTR"/"TR" ................................................... 52
Figure 11: Clustered Bar Chart Q18 by Q8 for Female................................................................................ 54
Figure 12: Clustered Bar Chart Q19 by Q8 for Female................................................................................ 54
Figure 13: Clustered bar chart Q18 by Q8 for Male .................................................................................... 56
Figure 14: Clustered bar chart Q19 by Q8 for Male .................................................................................... 56
Figure 15: "Before" and "After" Boxplots for "Age" ................................................................................... 57
Figure 16: Boxplots for Q18 by "Age" ......................................................................................................... 60
Figure 17: Boxplots for Q19 by "Age" ......................................................................................................... 60

13
LIST OF ABBREVIATIONS
WSRT Wilcoxon Sign Rank Test
MWU Mann Whitney U Test
KW Kruskal Wallis
DTR Do not take responsibility
TR Take responsibility
NA Not Active
AC Active
M Male
F Female

14
1. INTRODUCTION
1.1. BACKGROUND
Coral reefs are the most diverse marine ecosystems providing home to 25% of all marine life, yet
covering less than one percent of Earth’s surface. Not only are they essential for the birth, growth, and
survival of many marine species, but they are important for human life as well, providing food, jobs, and
economic income. Therefore, the health of this ecosystem is crucial for the survival of life and its
preservation should be of the utmost importance. However coral bleaching is threatening the survival of
coral reefs around the globe. To best explain coral bleaching, it is necessary to know how coral reefs are
structured.
Coral reefs have existed for as long as 400 million years, and while stony corals have evolved within
the last 25 million years, the more established coral reefs we see today are between 5,000 to 10,000 years
old. These coral reefs are made up of a myriad of groups of corals which are made up of many, many living
organisms called polyps. “A polyp is a small invertebrate marine animal with tentacles that live within a
hard cuplike skeleton that it secretes around itself” (“Coral Reef”, n.d.). A coral polyp can reproduce
sexually, excreting eggs and sperm which get carried away by ocean currents until landing on a hard
surface and secrete their own calcium carbonate cups to form a new coral reef. They can also reproduce
asexually by budding or forming new polyps attached to themselves by thin sheets of tissue and skeletal
material which can also grow into a massive coral over time. The polyp secretes a white skeleton around
itself made up of clusters of calcium carbonate by which it uses the assistance of the zooxanthellae,
microscopic algae, which lives within the lining of the polyp’s gut. The polyp provides the zooxanthellae
with protection and when it secretes carbon dioxide, the zooxanthellae is able to photosynthesize and
provide the polyp with nutrients, glucose, and amino acids. This then allows the polyp to create proteins,
fats, carbohydrates, and calcium carbonate (“Coral Reef”, n.d.). The zooxanthellae provides the polyp with
90% of its energy to stay alive while the polyp can also use its tentacles to catch plankton floating by
during the nighttime (Orlowski, 2016). The polyp itself is clear, while the skeleton it produces is white; the
bright colors that are generally thought of when imagining coral reefs come from the microscopic algae
living with the lining of the polyp’s gut. This is a symbiotic relationship between the polyp and
zooxanthellae in which both are benefited and because of this unique relationship, coral reefs are able to
survive and grow year after year. This process is as magnificent as it is delicate. A slight change in the
amount of sunlight or in the temperature of the water can disturb this process and eventually stopping it
completely.
Global warming1 is the gradual increase in overall temperature in the atmosphere due to increased
levels of carbon dioxide, CFCs, methane, and pollutants that create a barrier which traps in heat, also
known as the greenhouse effect. This increase in temperature causes extreme and abnormal weather
patterns which in turn effects living organisms all around the globe. Burning of fossil fuels is one of the
largest contributors to global warming. The ocean is used as the earth’s cooling system, absorbing 93% of
the heat which otherwise would be in the air and felt by everyone (Knowlton, n.d.). Because it is absorbing
1 Global warming and climate change are used interchangeably, as the focus is concerned on long term global warming as well as short term heat waves which are both a factor of climate change (“What’s in a name? Weather, global warming, and climate change, n.d.)

15
the heat in the air, it is gradually changing the temperature of the water, which effects the organisms in
it. As the coral reefs’ process of receiving energy from zooxanthellae is so delicate and specific to a certain
temperature of water, the effects of global warming in the ocean are interfering with this process leaving
the coral reef without 90% of its energy source. When the temperature of the water is too warm, the
coral begin to reject and evict the zooxanthellae within them leaving them without nutrients needed to
survive. Since the zooxanthellae provide the color, only the white skeleton left behind. The coral reef is
not dead quite yet, but is under a tremendous amount of stress and eventually will die due to lack of the
majority of its nutrition (“Early Warning Signs of Global Warming: Coral Bleaching”, 2003). This
phenomenon is called coral bleaching and is caused by an increase in ocean water temperature, by both
long term increases in ocean temperatures as well as short term extreme heat waves, which are irregular
weather patterns.
Coral bleaching is being observed across the globe with large scale events occurring at an increasing
rate. One study showed that out of 100 corals observed since 1980, 30% bleached in 2015 or 2016 alone.
Also, the Great Barrier Reef saw a record breaking back to back bleaching event in 2016 and 2017 and the
2016 bleaching event killed more than two thirds of the corals along a northern part of the Great Barrier
Reef (Greshko, 2018). The close proximity of these events do not allow the coral reefs a realistic chance
to overcome the bleaching, and increases the risk of them dying exponentially.
The eventual death of coral reefs by coral bleaching have and will continue to impact marine life
directly. Indeed, 25% of marine life will lose their homes, some fish may be become extinct due to lack of
protection from predators. Some classes of fish will have no place to mate or protect their young. Not
only does this affect marine life, but human life as well, as many populations around the world survive off
of the fish found near coral reefs for food. Catching these fish usually found around the coral reef can
have an impact on the economy as well: where there are no fish to catch, there are no fish to sell. Over
500 million people depend on coral reefs for food to survive or on the income fishing provides (Greshko,
2018).
Other jobs related to the ocean, such as tourism, will also disappear and negatively affect the
economy. In 2017, a study revealed that coral reef tourism is worth up to $36 billion each year. Many
island states have very few alternate sources of employment or income (Ullman, 2017). Coral reefs also
act as a barrier, protecting beaches from strong waves which otherwise could damage shorelines and
structures built close to the shorelines. These include business and peoples’ homes. In one way or another,
death of the coral reefs by coral bleaching will have a shocking and profound effect on life around the
globe if positive action is not taken soon.
1.2. PROBLEM IDENTIFICATION AND RELEVANCE
There is growing scientific research explaining coral bleaching, outlining climate change as the main
cause, and highlighting the devastating impacts of the loss of this ecosystem. While studies examining the
perceptions humans have of coral bleaching specifically are lacking, many studies have been done
regarding the perceptions of climate change overall. Climate change can be a delicate and sensitive issue
in regards to attitudes towards it due to people’s confusion on the cause and its impact. Additionally,
people are unaware, or do not acknowledge its threat, or ignore the negative impact of climate change.
By combining information about perceptions of climate change and scientific literature related to coral
16
bleaching, a better understanding of how people feel about coral bleaching and whether those feelings
affect their actions to fight against it can be discussed.
Organizations such as NOAA, National Oceanic and Atmospheric Administration, along with many
others spend time, money, and resources to not only to protect the coral reef and better understand coral
bleaching but to spread the word via campaigns, articles, and collaborations in documentaries. This is
important so that people can be informed of the effects climate change has on coral reefs. The outcome
of the spread of this knowledge may change habits and thus help to stop global warming to protect the
coral reef. By determining why people would change their daily habits, for marine life or for human life,
and what information aided in changing their view to stop coral bleaching, organizations can make their
campaigns more effective. Thereby saving the organization’s time, effort, and money but most
importantly, effectively get this grave message across that without action, we are putting the ocean and
ourselves, at risk.
1.3. OBJECTIVES
The study aims to improve the knowledge on whether people who are more aware of the causes and
effects of coral bleaching due to climate change, are more likely to intend to implement an action in
their life to slow climate change’s effect on coral reefs for marine life or human life, or both. A survey is
designed and implemented to address this research objective.
Several specific objectives emerge from this main objective, namely:
1. Understanding respondents’ knowledge of benefits of coral reef for marine and human life;
2. Assessing the level of importance on whether deterioration of the coral reef as a threat to marine
and human life;
3. Assessing the level of importance on protecting the coral reef for marine and human life; and
4. Understanding respondents’ view on climate change
An initial pilot test of a questionnaire was conducted to address the first three specific
objectives. A passage was included aiming to inform the respondents about climate change and its
causes, how it affects coral reefs, and the effects of coral bleaching to marine and human life. Similar
statements, referred to as “before” and “after” statements, were used to assess if there might be a
change in behavior once people, after having read the passage, were better informed. The data
collected through the pilot questionnaire was then statistically analyzed, and additional research was
done on the complexity of opinions people have about climate change. Afterwards, changes were made
to the questions and passage in order to design the “final” questionnaire, which addresses all specific
objectives of the study. Statistical analysis was then conducted in order to determine any significant
change in opinion regarding the main research objective.
1.4. DISSERTATION OUTLINE
The dissertation is organized in eight chapters and an appendix. The first chapter discusses the
motivation and relevance of the research work, states the objectives, and briefly summarizes the
methodological approach. This chapter ends with a brief overview of each of the main chapters.
17
The second chapter discusses previous studies about awareness of coral bleaching and its media
coverage as well as studies on the perceptions of climate change. The topics discussed form ideas to be
presented in the passage and questionnaire.
The third chapter discusses the sampling design, the reasoning behind the formation of the
questionnaire, and an overview of descriptive and statistical analysis that are carried out.
The fourth chapter begins with a summary of the pilot results, both descriptive and statistical for
all respondents. Then, the major changes implemented in the final questionnaire are reviewed with the
corresponding reasoning.
The fifth chapter includes one section presenting the descriptive statistics for the first 8
questions, the second section analyzing the “before” and “after” statements for all of the respondents,
and the following four sections analyzing the “before” and “after” statements separated in different
groups. Within each of these sections, the groups are compared and interpretation of the results are
discussed. Main results are presented in Figures and Tables, a complete output and supplementary
tables used for interpreting results are located in the appendix.
The sixth chapter first summarizes the statistically significant results with the importance the
information holds for organizations aimed to raise awareness of coral bleaching. The second section
discusses the limitations and suggestions for future work.
The seventh chapter includes the list of references. The eighth chapter is separated into six
appendices with corresponding outputs and tables used in the study.

18
2. LITERATURE REVIEW
This section contains previous studies from a scientific perspective of coral bleaching, as well as
people’s perspective and knowledge of both coral bleaching and climate change. By first understanding
the delicacy in explaining these issues and aims to clarify any doubts people have on these subjects, a
better survey and passage could be created.
2.1. CORAL BLEACHING
An assessment report from the Intergovernmental Panel on Climate Change (IPCC), reported that
“mass coral bleaching and mortality, triggered by positive temperature anomalies is the most
widespread and conspicuous impact of coral bleaching” (Gatusso, Hoegh-Guldberg & Portner, 2014).
The notice of non-local bleaching events occurred during the 1980s, however the first major widespread
and severe appearance of coral bleaching in was observed in 1998. This coincided with the warmest year
of the century as well as the highest tropical sea surface temperatures recorded until that time (“Early
Warning Signs of Global Warming: Coral Reef Bleaching”, 2003). Since then, temperatures have
continued to break record highs and more bleaching has been reported in shorter periods of time. In a
recent study looking at the life of 100 coral reefs from 1980 to 2016, it has been noted that recent short
spikes of extreme heat, a result of climate change, are doing more damage to the corals than longer
exposure of gradual increase, although in tandem they make it worse. As a result, on average the time
between massive bleaching events has been divided by a factor of five. This means that now, on
average, there are massive bleaching events approximately every 6 years, far more than previously
seen, due to climate change. The coral reefs do not have enough time to recover in such short time
periods and therefore are more likely to die (Greshko, 2018).
In 2016, coral bleaching was the worst ever recorded in history for the Great Barrier Reef with 93%
of the northern section already bleached and 22% of it dead. Later that year it was reported that almost
two thirds of the entire reef had been bleached, raising grave concerns (Lewis & Mallela, 2017). Due to
this widespread event, media coverage about coral bleaching increased significantly when compared to
that of 2015. While the scientific research on climate change’s effects on coral bleaching continues to
grow and there are efforts by campaigns to spread the word, there is still little research on the
effectiveness of this information and how people react to it. In international surveys 63% of respondents
reported knowing at least “some” or “a little” about coral bleaching however only 40% knew that it was
the result of global warming. Furthermore, when Americans were asked to describe the current
condition of the Great Barrier Reef, 27% were unsure and 40% replied with “good” or “very good”
(Swann & Campbell, 2016). This is representative of the lack of complete information people have of this
subject and shows scientific based research ought to be included for the respondents to have an
informed opinion. One study suggests the importance of the relationship between Australians and the
Great Barrier Reef, where appreciating this ecosystem encouraged the feeling to protect it (“Climate
change, the Great Barrier Reef and the responses of Australians”, 2016). Therefore, the passage should
emphasize the importance of coral reef for marine life, human life, and economic stability to build a
connection between the respondent and the environmental icon. An effective passage should be
written in order to raise awareness and intention to implement action by combining scientific research
of coral bleaching to counteract the lack of knowledge of coral bleaching and coral reefs.

19
“Chasing Coral” is a documentary with more than 500 hours of underwater footage from over 30
countries capturing the process of coral bleaching while explaining the role climate change has on the
corals and an explanation of what is to come if we do not take action. Its main mission was to “ inspire a
new wave of climate change champions in unexpected places” by using coral bleaching as a symbol for
climate change, inspire actions for clean energy, and educate leaders about what is happening to our
ecosystems. The combination of allowing viewers to experience this in a personal way, going
underwater and seeing for themselves, along with detailed explanation of the science behind it including
evidence of climate change, has impacted the world greatly even a few months after the documentary
was released for the first time. It has been shown in over 60 countries with over 750 screenings2 to
groups of individuals as well as top influencers such as the United Nations, the United States Congress,
Google, the World Bank, and more. The success of this documentary to implement action can be seen
individually, where one woman threw a waste-free birthday party, as well as larger scale, where
environmental organizers showed the film to American students gathering them together to show
support at the climate negotiations in Germany. (“2017 Media Impact Festival Case Study: Chasing
Coral”, 2017). The success of this is documentary is a prime example, based on media reviews and
stories of individual and group action, of how to express the information about coral bleaching and is
important to take into consideration for future campaigns with similar goals.
While no studies were found on directly providing information about coral bleaching and assessing
the influence it had on their awareness of the subject and intended action, the limited studies on recent
opinions and the impact of the documentary “Chasing Coral” can be useful. Emphasis on an
informational passage should be put on climate change’s impacts on coral reefs, the scientific research
on coral bleaching in general, along with building a connection or importance of the loss of coral reef.
2.2. CLIMATE CHANGE AWARENESS
Since the main cause of coral bleaching is climate change, opinions regarding this must be
discussed. This includes overview of beliefs of the existence and cause of climate change, perceptions of
overall threats, and attitudes towards it. While sufficient studies on perceptions and awareness of coral
bleaching is lacking, understanding these topics on climate change overall helps better present the
passage and explain results.
A 2016 study estimates that 69% of Americans believe that global warming is happening and 14%
think the contrary with the rest unsure (Yale Climate Opinion Maps - U.S. 2016). A study in Australia
found similar results with 82.8% of respondents believing that global warming is happening and 17.2%
who do not (Leviston & Walker 2011). A third study shows that the level of certainty in their belief of
whether global warming is happening or not differs, especially in those who do not believe where 47%
responded that they are “somewhat sure that it isn’t happening”, just following 12% of responses saying
they are “not at all sure” it is not happening. Another difference in opinion is whether global warming is
caused by humans or is just a natural fluctuation in the Earth’s climate. This is a surprising concern, as
the majority of scientists do concur that global warming is mainly caused by humans and the 2014 U.S.
National Climate Assessment stated “the global warming of the past 50 years is primarily due to human
activities, predominantly the burning of fossil fuels. Many independent lines of evidence confirm that
2 As of 2017
20
human activities are affecting climate in unprecedented ways.” (“Climate Change in the American
Mind”, April 2014).
The above referenced studies reveal the lack the information people have regarding this issue’s
existence and cause. Most of the respondents trust information given by university scientists, yet one
study shows that only 48% of American respondents believe that “[m]ost scientists believe that global
warming is happening.” (“Yale Climate Opinion Maps - U.S.”, 2016). When in fact 97% of scientists have
agreed, upon reviewing 12,000 related papers on climate change that, in fact, it is happening. (“Climate
Change in the American Mind”, April 2014). This may indicate a lack of an effective outlet to provide
factual information regarding climate change and its causes.
People report many differing opinions on whether global warming is affecting them or their
community negatively to an extreme extent. However there is a strong belief that global warming is
currently and will continue to harm plants and animals as well as future generations. The majority of
respondents increasingly agree that global warming will affect people other than themselves, (for
example, people in developing countries or other people in the United States rather than themselves or
their families). Questions were asked regarding illnesses and deaths caused by global warming
worldwide where almost half responded to “Don’t Know”. One study shows that respondents believed
that in 20 years if nothing has been done about climate change, there will be many more extreme
weather patterns and environmental issues, where 57% of respondents claimed that global warming
was already affecting weather in the US. (“Climate Change in the American Mind”, April 2014). This
further shows that although it may be becoming more obvious that there are abnormal weather
patterns, people do not believe it is quite the threat to themselves than it is for other humans or animal
life. This can play an important role in whether they choose to act on slowing global warming because
they do not feel impacted personally, and they do not have enough information to know what is truly
happening in the world and how detrimental climate change is already beginning to be.
Although there are many who believe humans won’t change their daily behavior, a majority believe
that they will. However they are unsure they can do what is necessary. In addition, a study shows that
the most popular feeling for respondents who do not believe in climate change as well as those who do
but think it is natural, feel irritated when discussing the topic (Leviston & Walker 2011). This means that
any information received about global warming may instantly be discarded, and where knowledge is not
learned there is no possibility of intention of action that could be taken. Presenting facts about climate
change should be handled delicately.
Actions to slow global warming can include every day activities such as using less water, using less
electricity, or using a reusable bag. Other more drastic actions can include buying an electric car or
changing to solar power which may not be in the respondent’s price range. Another upcoming action
that can be done, is signing a petition with a certain number of signatures and aim it towards the
government to show support for a concern in hopes that they take it into account and implement a large
scale decision. This option should be explored as many people believe that one person cannot make a
drastic enough impact to stop global warming, although a majority of people support policies that aim
to reduce CO2 and use renewable resources (“Climate Change in the American Mind”, April 2014). Many
programs use petitions to raise awareness to change a law or to bring attention to an issue. Websites
online such as change.org allow you to easily make a petition and send them out over the internet. The

21
UK even has a part of the governmental website where citizens can create petitions and sign them.
Parliament is required to entertain any petition that receives a certain number of signatures.
Since obtaining information is the first step towards the possibility of initiating action, the studies
discussed above are concerning and many aspects must be taken into account when conducting a
survey regarding coral bleaching. Therefore, a passage is written to inform respondents based on
information presented in this chapter. Along with an explanation of coral bleaching, it must be made as
clear as possible that climate change is real, it is mainly caused by human activity, and is negatively
affecting coral reefs which in turn effects marine life and human life. Emphasis should be put on the
urgency of the situation, with supporting facts from scientists and professionals, and building a
connection between the respondent and the coral reef to encourage the likelihood that action is taken
to save it. By clarifying any doubts and enlightening the reader of this phenomenon of coral bleaching,
respondents can make a more informed decision about taking action and effectiveness of the passage
can be studied.

22
3. METHODOLOGY
In order to understand what motives, if any, could changes the intention of people’s actions to slow
coral bleaching, quantitative research was used. A survey was designed and implemented to collect data
based on the research objectives. This section outlines information on selecting a sample, a replica of the
questionnaire, how and why the questions are included, and procedures implemented in both descriptive
and statistical analysis. Descriptive analysis was used in order to better understand the respondents’
knowledge and beliefs in order to best gain information from statistical analysis. Statistical analysis was
conducted in order to determine any significant change in opinion for the main problem objective.
3.1. SURVEY DESIGN
3.1.1. Sampling Design
The target population for this survey is any individual over 18 years of age with access to internet who
can speak English. There is no limitation as to nationality since climate change affects everyone around
the world and initial information regarding opinions of coral bleaching is desired. It is impossible to have
an exhaustive list of everyone in the world, in which case there is no sampling frame. However, answers
from respondents were bought through Survey Monkey’s Contribute Program. The Survey Monkey’s:
Buying Responses Section, states that “Contribute members take surveys for charity and a chance to win
a sweepstakes prize. We believe that by offering these non-cash incentives, we limit problems such as
satisficing and encourage respondents to provide honest, thoughtful opinions.” In this case, convenience
sampling, a non-probabilistic method, is used on the respondents of the Contribute Panel that Survey
Monkey provides. Although many studies3 regarding climate change have sample sizes of 1,000 or more,
due to cost restrictions, the sample size is set to a 100. As this is a non-probabilistic sampling method, a
specific number of respondents could not be determined based on confidence interval.
Errors can be separated into two main categories: Sampling error and Non-sampling error. Sampling
error occurs because the sample is not representative of the entire target population, while non-sampling
errors occur because of factors that are independent of the survey plan. The main non-sampling errors in
this survey are thought to be non-response and measurement error. For item non-response error, Survey
Monkey will automatically exclude surveys that are incomplete and the researcher will exclude surveys
after the passage if the respondent chooses “I did not read the passage” since it is necessary to complete
and continue the survey. Measurement error is one of the most concerning errors, especially for those
who lie in saying they did read the passage when they actually did not. This cannot be known. However,
the passage has been limited as much as possible and the respondents are warned beforehand that there
is a passage to be read in hopes that they accept this fact, do read it, and respond truthfully. Another
measurement error that may occur is due to the sensitivity of the subject and how “politically correct”
they should be in helping the environment and therefore lie. For this reason, a statement before the
passage is included ensuring that questionnaires are anonymous.
3 This refers to the many studies mentioned in the Literature Review

23
3.1.2. Questionaire
A questionnaire containing 19 questions was created using the tool “Survey Monkey”. Survey
Monkey allows the researcher to create a survey using their own questions and responses on an online
platform. Questions are shown one at a time and responses are instantly recorded without the possibility
of returning to a previous question.
An initial pilot test of a questionnaire with 15 questions was conducted based on the same study
objectives (except for the fourth study objective of climate change) using similar questions, methodology,
and passage as the “final” questionnaire, which is tested in this paper. After analyzing the descriptive
statistics and results of statistical testing for the pilot survey, it was concluded that there must have been
confusion due to the knowledge of the respondents and/or the questions providing inconclusive results.
Additional research was done on the views of climate change and once understanding the complexity of
opinions people have about it, changes were made to the questions and passage, and a specific research
question was added (Understanding respondents’ view on climate change).
The questionnaire of the pilot survey is presented in Appendix A. A summary of pilot survey
results, limitations, and general changes due to these limitations can be seen in “4. Results Pilot” section.
The detailed improvements due to limitations of the pilot survey are discussed in detail throughout
section “3.1.3. Rational of Questionnaire”.
The following is a replica of the Final Questionnaire conducted on Survey Monkey including the
introductory statement, 19 questions, and the informational passage:
This is a research survey for opinions regarding the coral reef used for a Masters Dissertation.
Please answer all of the questions to the best of your knowledge and truthfully as the responses to the
survey will be anonymous. A passage is included and it is mandatory to read the entire passage in order
to continue with the survey. Thank you for your time!
1. What is your gender?
A. Male
B. Female
2. Please select your age group:
A. 18-29
B. 30-44
C. 45-60
D. 60 or over
3. What are some benefits of coral reefs? (can choose more than one)
A. home for marine life

24
B. mating areas
C. protection
D. feeding areas
4. How many people rely on coral reefs for their livelihoods and food?
A. 50 million
B. 500 million
C. 5 billion
D. I don’t know
5. To your best knowledge, how much of the coral reef system will be destroyed by 2050?
A. 30%
B. 60%
C. 90%
D. I don’t know
6. Do you specifically do anything to prevent climate change?
A. Yes
B. No
7. I believe that climate change:
A. is happening
B. is not happening
C. I don’t know
8. I believe that climate change
A. is caused by humans
B. is a natural fluctuation in Earth’s temperature
C. is not happening
D. I don’t know
Please select level of agreement to the following statements where 1 is Strongly Disagree, 5 is
Somewhat Disagree, 6 is Somewhat Agree and 10 is Strongly Agree:
9. I think that a deterioration of the coral reef is a threat to marine life:

25
Strongly Disagree- 1 2 3 4 5 6 7 8 9 10 -Strongly Agree
10. I think that a deterioration of the coral reef is a threat to human life:
Strongly Disagree- 1 2 3 4 5 6 7 8 9 10 -Strongly Agree
11. I think it is important to take action in protecting the coral reef for marine life.
Strongly Disagree- 1 2 3 4 5 6 7 8 9 10 -Strongly Agree
12. I think it is important to take action in protecting the coral reef for human life.
Strongly Disagree- 1 2 3 4 5 6 7 8 9 10 -Strongly Agree
Please read the entire passage and proceed to the next questions:
Coral polyps, which make up coral reefs, are invertebrates that have survived for over 400 million years,
where today’s corals are anywhere from 5,000-10,000 years old. These invertebrates secrete calcium
carbonate to build protective white skeletons which grow to take on beautiful and bright colors which
many people know them for thanks to a symbiotic relationship with algae that live within their tissues.
This algae provides them with over 90% of their energy to survive and flourishes due to a delicate
process, specific to a certain amount of sunlight and temperature of water. EPA (USA Environmental
Protection Agency) has calculated an increasing rise in average sea temperature in the last 3 decades
along with temporary spikes in temperature due to climate change. Temperature increase of just 1.8 to
3.6 degrees Fahrenheit forces the coral to expel the colorful algae, leaving behind only a white skeleton
and the coral without its major food source. The process is known as "coral bleaching" and is the last
warning before death. When this happens it affects marine life, human life, and even economies. The
world has lost roughly half of its coral reef in the past 30 years and it is predicted that by 2050 more
than 90% will die. "This isn't something that's going to happen 100 years from now. We're losing them
right now," said marine biologist Julia Baum from Canada's University of Victoria. Coral reefs are home
to 25% of marine life with the most biodiversity in the ocean whether they live there or come for other
reasons such as feeding and mating, although only covering 1% of the area of the ocean. Without them
the number of species will greatly decrease because prey, and even their offspring, have no protection
from their predators, leading to likelihood of extinction which causes a crash in the food chain due to
entire classes of fish becoming extinct. Fish that for many years have been studied by both scientists and
past generations for mere enjoyment can be lost forever, simply a memory or old photos in a science
book studied by our children. Over 500 million people around the world depend on these areas of
densely packed fish to survive for food alone as well as income, where fisherman and other jobs and
industries related to marine life, even tourism, are at risk. Lack of jobs in turn results in a fall in the
economic income, first locally and then globally. On top of that, corals can provide protection to coasts,
to limit damage due to flooding and structural damage. Consequently, coral bleaching affects us all in
one way or another. When reviewing 12,000 peer-reviewed papers in the climate science literature,
scientists found that of those papers that stated a position on the reality of human-caused global
warming, 97% said it is happening (Climate Change in the American Mind – April 2014) confirming that
our daily actions are contributing to coral bleaching if we continue to not fight against actions that cause
climate change. However, with a few changes in lifestyle or adjustments it is possible to slow this

26
process and reverse its effects as “Researchers emphasize that there’s still time…to prevent existential
damage to the world’s reefs—but only if sweeping action is taken now” (Michael Greshko, National
Geographic 2016).
A. I have read this passage
B. I have not read this passage
13. I feel that I have learned more after reading this passage:
Strongly Disagree- 1 2 3 4 5 6 7 8 9 10 -Strongly Agree
14. After reading the passage, I think that coral bleaching is a threat to marine life:
Strongly Disagree- 1 2 3 4 5 6 7 8 9 10 -Strongly Agree
15. After reading the passage, I think that coral bleaching is threat to human life:
Strongly Disagree- 1 2 3 4 5 6 7 8 9 10 -Strongly Agree

27
16. I am more likely to adjust something in my lifestyle in order to slow climate change knowing the
effects it has on coral bleaching for marine life:
Strongly Disagree- 1 2 3 4 5 6 7 8 9 10 -Strongly Agree
17. I am more likely to adjust something in my lifestyle in order to slow climate change knowing the
effects it has on coral bleaching for human life:
Strongly Disagree- 1 2 3 4 5 6 7 8 9 10 -Strongly Agree
18. After reading this article I would be more likely to sign a petition to raise awareness to encourage
lawmakers to implement policies regarding cleaner energy:
Strongly Disagree- 1 2 3 4 5 6 7 8 9 10 -Strongly Agree
19. After reading this article I am more likely to take action by altering daily lifestyle behavior on climate
change: (ex: using less water, less electricity, using more renewable energy resources)
Strongly Disagree- 1 2 3 4 5 6 7 8 9 10 -Strongly Agree
3.1.3. Rationale of Questionairre
An introductory passage was included to discuss why the survey was being conducted and that
the completion in both reading the passage and answering all questions was mandatory. Questions in this
questionnaire were chosen to obtain information about the respondents’ knowledge of coral reefs, beliefs
in climate change, and opinions on climate change’s effect on coral reefs. Also, four similar statements
referred to as “before” and “after” statements, are used to assess if there was a change in level of
agreement for threat levels for marine and human population as well as level of agreement of the
importance and intention of changing behavior after reading an informational passage. Finally, specific
situations on how much more likely they are to participate in specific situations against climate change
after reading the passage. This section aims to provide insight on the process of formatting and creating
the questionnaire including changes made from pilot survey.
The content of the passage separating the “before” and “after” statements was a crucial part of
the questionnaire because it provides a variety of information aimed to affect the respondents’ levels of
agreement to given statements. The passage was written by the author after a great amount of research
on coral reefs as well as climate change and then checked by a Marine Biologist for accuracy. The passage
includes the major benefits and the importance of coral reefs for marine and human life, information
about climate change and coral bleaching, and connects this information to the effect it will have on
marine and human life if no action against climate change is taken. As discussed in the Literature review,
many people have a lack of true information on whether climate change exists and if it is caused by
humans. Therefore, quotes from scientists were included to validate that it is happening and it is in fact
mostly caused by humans. Quotes by scientific intellectuals on this subject were included because the
same study as mentioned above, show that people trust scientists’ opinions the most when compared
with other sources (Leviston & Walker, 2011). Quotes emphasizing that climate change it is happening
now and not a distant consequence were included because studies showed that people did not believe it
is affecting them now but think it will affect future generations. Although many people have indicated

28
that they believe that it is a problem for animal and plant life now (“Climate Change in the American
Mind”, April 2014), a connection was made to the effects of coral bleaching for human life regarding basic
survival as well as economic consequences, which is another form of survival, and one that people all over
the world can relate to. An optimistic ending was added due to the fact that even those who do believe
that climate change is caused by humans think that they cannot make a big enough impact and have very
low hopeful feelings towards this subject (Leviston & Walker 2011). Graphics were provided after the
passage to make the situation more apparent by showing how quickly coral bleaching kills the coral reef
and what it actually looks like. This is crucial to build a connection between the respondent and the lives
that are affected by a dying coral reef. These are all important points to include in the passage to provide
clarification, through trustworthy sources, that our actions directly affect climate change which is now
causing coral bleaching so that the respondents feel the urgency to act now in order to protect the coral
reef for marine and human life. This resulted in a longer than desired passage, but all information included
was necessary to make an informed opinion.
Questions 1 and 2 provide demographic information.
Questions 3, 4, and 5 provide information on whether the respondents know of the importance
of coral reefs for marine life, human life, and its deterioration rate before they read these exact facts in
the passage. It is important to understand that these questions refer to a group of information that is
presented in the passage, in addition to the correct answers asked, as well as connecting their importance
to each other. By having a general idea of what the respondent is previously aware of, we can better
determine what new information, or on which subject, influenced a change in level of agreement, if one
exists. These questions also provide evidence on whether they did or did not learn something in the
passage, the importance of this will be discussed later in this section.
Questions 6, 7, and 8 provide information on the respondent’s standpoint on climate change.
Question 6 provides insight on whether the respondents currently do something to stop climate change.
It is impossible to tell whether the respondent answers truthfully, however anonymous answered are
insured in hopes to reduce this measurement error. This can be useful for grouping in statistical analysis.
Question 7 is very similar to question 8, with the difference being between existence and cause, and may
be questioned to remove one of them as it would make the survey shorter. However, as studies show that
respondents show uncertainty on their beliefs in climate change (“Climate Change in the American Mind”,
April 2014) by comparing the two, it may provide a more complete understanding of what the respondent
believes. Also, by understanding initial beliefs on climate change, data can be grouped on these beliefs
during statistical analysis in order to better determine what information in the passage had an impact on
results or on which group.
Statements 9, 10, 11, and 12 are considered “before” statements and after reading the passage
compared with 14, 15, 16, and 17, the “after” statements, forming pairs (where 9 was compared with 14,
10 was compared with 15, 11 was compared with 16, and 12 was compared with 17). These statements
can be broken into two groups based on information to be assed: 1. Threat and 2. Action, where each one
is repeated specifically for marine life and for human life. For the “Threat” statements4, it hopes to assess
whether the respondent sees deterioration, and then referred to afterwards as coral bleaching given that
it is a specific type of deterioration, as a threat to marine/human life. Being aware of coral bleaching as a
4 Threat statement pairs are Q9 & Q14 for marine life, and Q10 & Q15 for human life

29
threat is seen as agreeing to these statements, because they could read the information in the passage
however not agree that it is true, and without this then there would be no push to take action. For the
“Action” statements5, there is more variability in the wording from before and after, but the main concept
remains the same. It assesses level of importance for personal action to protect the coral reef but with
emphasis on relating it to the information in the passage, including coral bleaching as a deterioration, and
stopping climate change as the personal action due to the fact that this is the cause of coral bleaching.
The statements after the passage specify the likelihood to adjust their lifestyle based on information in
the passage to better understand if they do intend to do something. This was important to include to best
interpret results because a study showed that there is a gap between awareness and action (McKercher,
Prideaux, Cheung, & Law, 2010). This emphasizes the importance of the information in the passage, to
increase awareness across different uncertainties and use this as motivation to take action while directly
questioning the intention of changed behavior. The “before” and “after” statements almost mimic each
other’s wording in aims to control variation with the “after” statements only providing more detail
relevant to the passage and study objectives.
Data analysis was done on these statements to determine significant differences in level of
agreement and discussed in Statistical analysis section. The aim of these questions was to understand the
level of agreement towards coral deterioration for both marine and human life as well as if they are more
likelihood to change behavior for either one. For each question the respondents can choose their level of
agreement on a 10 point Likert scale with anchors on each side, 1 being Strongly Disagree to 10 being
Strongly Agree; in this case responses 1-5 represents a level of disagreement and 6-10 represents a level
of agreement. By choosing a 10 point scale instead of a lower point scale, such as 4, the respondent has a
broader range of agreement to choose from which is useful so that the respondent has options closer to
what they truly believe and we can determine even a small difference in opinion before and after the
passage. The 10 point scale involves no neutral response, as to say the respondent is forced to choose
between disagreeing and agreeing, increasing in how strongly they feel the closer the respondent chooses
to the anchors. This was chosen over a scale allowing a neutral option, such as an 11 point scale, based
on the details of the study. A neutral response can be seen as a “dumping ground” and may not represent
the midpoint as a “neither agree nor disagree” or “neutral” response (Worcester, Burns, Kulas, 2008). This
“dumping ground” may be due to uncertainty in facts of climate change as well as the confidence that
they have in their beliefs about it (“Climate Change in the American Mind”, April 2014) or the respondents
“may use the midpoint to avoid reporting what they see as a socially acceptable answer” (Johns, 2010).
The main data analysis includes whether there is a change in agreement level to the statements, however
if there is a significant change in agreement and the majority changes to a neutral response after reading
the passage, then it is difficult to determine how the passage impacted the respondent in gaining
meaningful results as it could be multiple different options, and not a neutral response. Opinions on
climate change can be somewhat uncertain, but because the passage provides facts that aim to clarify
this, it is useful to force the respondents to make an opinion based on the knowledge they knew initially
and compare it to the knowledge they have learned.
After reading the passage, the respondent will have qualifying questions for the statistical analysis
which include asking if they did or did not read the passage. If they didn’t read it, they will not be
considered for descriptive or statistical analysis because there is no knowledge learned to influence their
5 Action statement pairs are Q11 &Q16 for marine life and Q12 & Q17 for human life

30
opinion. Question 13 provides information on whether the respondents feel that they have learned more
using a 10 point Linkert scale where 1 is Strongly Disagree and 10 is Strongly Agree, maintaining directions
given before the passage and to continue the survey with the ease. If a respondent chooses some level of
disagreement, a number between 1 and 5, their answers to 3, 4, and 5 are reviewed. In this case, if the
respondent answered those questions correctly and still disagrees on some level, then they will be
disqualified from the survey as they did not learn anything.
Statements 18 and 19 are additional information on if a person would be more likely to sign a
petition or alter their lifestyle and offer examples for altering lifestyle, since some studies suggested
people didn’t know how they could help (Leviston & Walker 2011). A 10 point Linkert scale is used on
these questions to allow variation in the answer closer to what they truly believe and to continue with the
ease of the survey. This points out two ways of action, action by yourself in daily life and action to
encourage response on a larger political scale. This could be even more interesting for future campaigns.
As seen in previous studies even those who do not believe that climate change is caused by humans
believe that governments have a responsibility in changing it (Climate Change in the American Mind –
April 2014), a contradicting statement but can provide some insight on what action is most likely to take
place if they intend to change their behavior. These questions can also justify or explain results.
While the questions used show importance to the objectives, the format and wording were
considered as well. The use of the word “alter” was specifically used against the word “change” to not
make the effort seem so extreme in the after statements. The term “climate change” was used instead of
“global warming” as a study showed that there was a higher level of belief that climate change is
happening rather than global warming (Schuldt, Konrath, & Schwarz, 2011). In this case, it was presented
in the passage to better influence the opinions of respondents as well as throughout the survey. This is
appropriate as well as when reviewing the definition of climate change from NASA, as it includes the
increased temperature trends predominately caused by humans burning fossil fuels as well as irregular
heat waves. These minor changes in wording were taken into consideration in order to best limit variation
of outside factors, including emotions that may arise when reading the questionnaire and influence
opinions that cannot be calculated.
3.1.4. Cleaning, Preparing, and Exporting Data
Once all 100 questionnaires were completed, all responses were uploaded into SPSS and no
transformation of the responses were necessary. Questionnaires of those who selected “I did not read
the passage” were deleted. Those who answered to some level of disagreement on “I feel that I have
learned more after reading this passage” were selected and based on whether they answered incorrectly
to questions 3, 4, or 5 were left in the sample based on the fact that they did learn from the passage.
After this, the descriptive and statistical analysis was proceeded in SPSS.
3.2 DATA ANALYSIS
3.2.1 Descriptive Research
Descriptive research is used throughout the study to gain an initial understanding as well as
interpret results. First, questions 1-8 deal with categorical variables and therfore are shown by
frequencies and/or percentages for all respondents in tables, pie charts, or bar charts. Groups that will be

31
analyzed statistically are outlined in the first section of “5.1. Descriptive Overview”. The following five
sections focus on the same “before” and “after” statements, first for all of the respondents as well as
separated by groups. Boxplots for these “before” and “after” statements are presented for all
respondents as well as each group to gain an initial understanding of differences and changes. Throughout
the sections, references are made to questions 1-8, however tables are referenced in the Appendix. Bar
charts or boxplots are presented for spread of agreement level for statements 18 and 19.
3.2.2. Mann Whitney U Test
Mann-Whitney U test is a non-parametric test that is used to test whether two sample medians
are equal or not. As it is non-parametric, it can be used to compare two independent nominal groups
when the dependent variable is not normally distributed, at least of ordinal scale, and observations in the
groups do not need to be equal. The distribution of both groups must also be compared to determine
whether they are similar or different in shape in order to interpret the results accordingly (“Conduct and
Interpret a Mann-Whitney U Test”). This is tested on the “before”. In the case that the two distributions
have the same distribution, the median can be compared under the following hypothesis:
H0: the medians of the two groups are equal
HA: the medians of the two groups are not equal
A significance level of 5% or less will be used to reject the null hypothesis, unless stated otherwise.
This is useful to determine whether it is valuable for the sample to be separated into groups as well as
interpret differences in changed levels of agreement for one group but not another.
3.2.3. Kruskal Wallis Test
The Kruskal Wallis Test uses one nominal variable, the grouping variable, and a measurement
variable to determine if the mean rank for groups are the same. This is tested on the “before” statements.
The measured observations are transformed into overall ranked measurements for the entire sample,
from 1 being the smallest, 2 the second smallest, and so on; then the mean ranks are taken for each group
(McDonald, n.d.). When the groups have differently shaped distributions or variances, the Kruskal Wallis
tests makes no assumption and uses the following hypothesis:
H0: The mean ranks of the groups are the same
HA: The mean ranks of the groups are not the same
If the null hypothesis is rejected, based on a 5% significance level unless otherwise stated, then at
least one mean ranks differ but it is unsure which group or groups differ from each other. This is used to
understand whether the groups should be separated into groups as well as interpret differences in
changed levels of agreement for one group but not another.
3.2.4. Wilcoxon Sign Rank Test
A Wilcoxon Sign Rank Test is a non-parametric statistical test that uses ordinal data to compare
two sets of scores from the same participants using the ranks and magnitude of differences. The four
paired “before” and “after” statements are used to determine if the information in the passage had a
significant difference in level of agreement. The assumptions of the Wilcoxon Sign Rank Test are the use

32
of ordinal data, that the data are paired, and that the samples were chosen randomly. When the non-zero
differences are large (n>10), then the W statistic approximates a normal distribution under the following
hypothesis:
H0: The difference between the medians of the two levels of agreement is zero
HA: The difference between the medians of the two levels of agreement is not zero
A significance level of 5% or less will be used to reject the null hypothesis, unless otherwise stated.
This test is conducted for all respondents as well as subgroups of the respondents, in order to compare
results and interpret other factors that may influence a difference in level of agreement.
33
4. RESULTS OF PILOT
A pilot test was conducted with the same study objective, to understand awareness of coral
bleaching and intention to change behavior based on additional information, however emphasis on
climate change was not as prominent as it was for the final questionnaire, both in the questions as well
as the passage. Below is a short summary of the exploratory analysis, explaining the background of the
respondents, and statistical analysis, conducting a Wilcoxon Sign Rank Test to determine if there was a
change in level of agreement to statements before and after reading an informational passage. Finally, a
short summary is presented on the limitations of the analysis and how the Final Questionnaire was
improved based on these discoveries.
The questions and responses were uploaded to Survey Monkey and shared through the authors
social media accounts by providing a link to the survey. 136 surveys were collected, however 23
respondents answered that they had not read the passage and therefore were not considered in the
study. The 113 who responded that they had read the passage were then analyzed. The questions in the
survey can be seen in Appendix A.
4.1. EXPLORATORY ANALYSIS
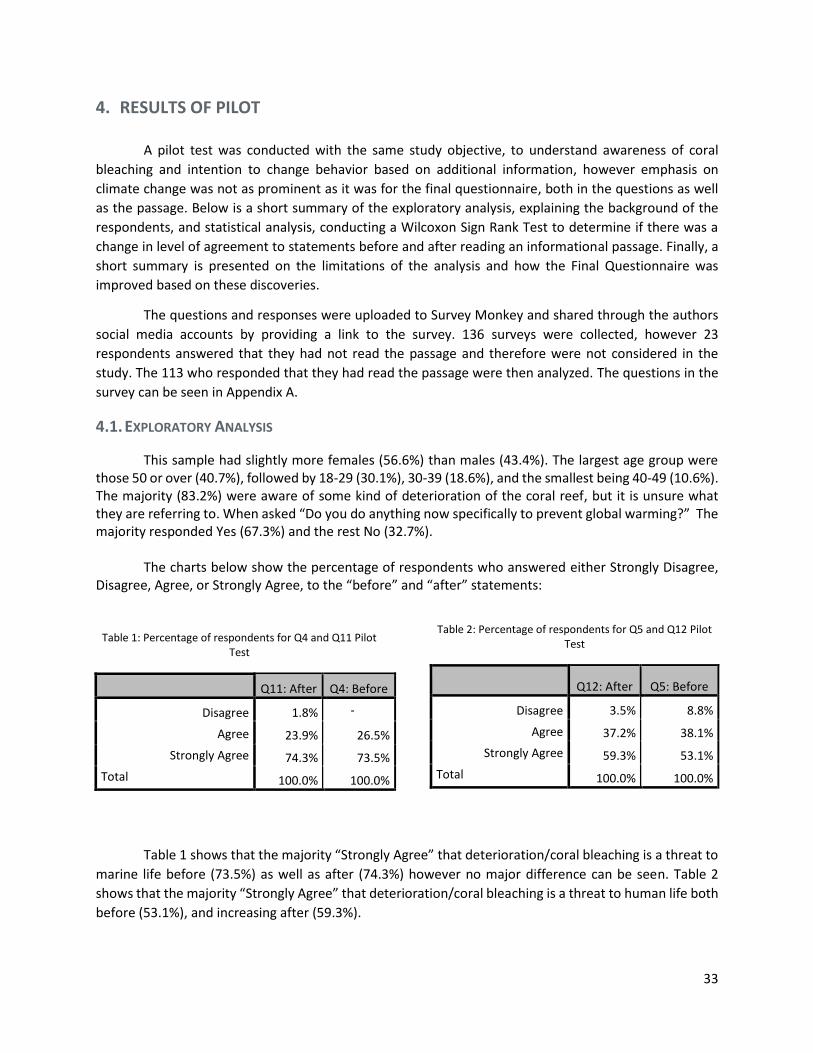
This sample had slightly more females (56.6%) than males (43.4%). The largest age group were those 50 or over (40.7%), followed by 18-29 (30.1%), 30-39 (18.6%), and the smallest being 40-49 (10.6%). The majority (83.2%) were aware of some kind of deterioration of the coral reef, but it is unsure what they are referring to. When asked “Do you do anything now specifically to prevent global warming?” The majority responded Yes (67.3%) and the rest No (32.7%). The charts below show the percentage of respondents who answered either Strongly Disagree, Disagree, Agree, or Strongly Agree, to the “before” and “after” statements:
Table 1: Percentage of respondents for Q4 and Q11 Pilot
Test
Q11: After Q4: Before
Disagree
Agree
Strongly Agree
Total
1.8% -
23.9% 26.5%
74.3% 73.5%
100.0% 100.0%
Table 2: Percentage of respondents for Q5 and Q12 Pilot Test
Q12: After Q5: Before
Disagree
Agree
Strongly Agree
Total
3.5% 8.8%
37.2% 38.1%
59.3% 53.1%
100.0% 100.0%
Table 1 shows that the majority “Strongly Agree” that deterioration/coral bleaching is a threat to
marine life before (73.5%) as well as after (74.3%) however no major difference can be seen. Table 2
shows that the majority “Strongly Agree” that deterioration/coral bleaching is a threat to human life both
before (53.1%), and increasing after (59.3%).

34
Table 3: Percentage of respondents for Q6 and Q13 Pilot Test
Q13: After Q6: Before
Disagree
Agree
Strongly Agree
Total
3.5% 8.8%
37.2% 40.7%
59.3% 50.4%
100.0% 100.0%
Table 4: Percentage of respondents for Q7 and Q14 Pilot Test
Q14:After Q7: Before
Strongly Disagree
Disagree
Agree
Strongly Agree
Total
- 0.9%
7.1% 8.8%
48.7% 38.9%
44.2% 51.3%
100.0% 100.0%
Table 3 shows the agreement level for the statement “I am more likely to change something in
my lifestyle, make an additional change, or feel stronger about what I am already doing, in order to stop
global warming knowing the effects it has on coral bleaching for marine life” has the a slight increase after
reading the passage (59.3%) than before (50.4%). Table 4 shows the agreement level for the statement “I
am more likely to change something in my lifestyle, make an additional change, or feel stronger about
what I am already doing, in order to stop global warming knowing the effects it has on coral bleaching for
human life” is the only statement where someone answered to “Strongly Disagree” (.9%) however after
the passage they chose differently. There is an increase proportion of those responding as “Agree” after
(48.7%), however a decrease in proportion of “Strongly Agree” from before (51.3%) to after (44.2%).
Overall there seems to be no major change in proportions, anything greater than 10%, of
agreement level before and after reading the passage, however when asked to respond to the statement
“I feel that I have become more informed regarding the effects of coral bleaching after reading this
passage” 55.8% said they “Strongly Agree” and 44.2% said they “Agree”, meaning they felt that they did
learn more.
4.2. WILCOXON SIGN RANK TEST
A Wilcoxon Sign Rank Test is conducted on the four “before” and “after” statements to determine
whether there is a significant difference in level of agreement. In order to proceed with this test, these
values were converted into numbers where “Strongly Disagree” =1, “Disagree”=2, “Agree”=3, and
“Strongly Agree”=4. The following output from SPSS, Table 5, is shown below:
Table 5: WSRT Sum of Ranks for Pilot Test
N Mean Rank Sum of Ranks
Q11: After reading the
passage, I think that coral
bleaching is a threat to marine
life: - Q4: I think that a
deterioration of the coral reef
is a threat to marine life:
Negative Ranks 12 12.00 144.00
Positive Ranks 11 12.00 132.00
Ties 90
Total
113

35
Q12: After reading the
passage, I think that coral
bleaching is threat to human
life: - Q5: I think that a
deterioration of the coral reef
is a threat to human life:
Negative Ranks 14 20.00 280.00
Positive Ranks 26 20.77 540.00
Ties 73
Total
113
Q13: I am more likely to
change something in my
lifestyle, make an additional
change, or feel stronger about
what I am already doing, in
order to stop global warming
knowing the effects it has on
coral bleaching for marine life:
- Q6:I think it is important that
I take action in protecting the
deterioration of the coral reef
for marine life.
Negative Ranks 33 28.86 952.50
Positive Ranks 24 29.19 700.50
Ties 56
Total
113
Q14: I am more likely to
change something in my
lifestyle, make an additional
change, or feel stronger about
what I am already doing, in
order to stop global warming
knowing the effects it has on
coral bleaching for human life:
- Q7: I think it is important to
take action in protecting the
deterioration of the coral reef
for human life.
Negative Ranks 30 24.85 745.50
Positive Ranks 22 28.75 632.50
Ties 61
Total
113
A Negative rank means that the respondent decreased their agreement level after the passage,
while a positive rank means that that the respondent increased their level of agreement, after the
passage. This does not necessarily mean that the respondent changed from agreement to disagreement,
but may indicate that there was a change in how strongly they agree or disagree. A tied rank signifies no
change in level of agreement.
When analyzing the first two statements’ number of ranks, there is confusion because the
respondents agreed to learn more after reading the passage, yet there is still a number of people who
lower their agreement level that coral bleaching is a threat to marine life (n=12) and human life (n=24).
When given scientific facts in a passage, with almost the exact same question, there should only be ties
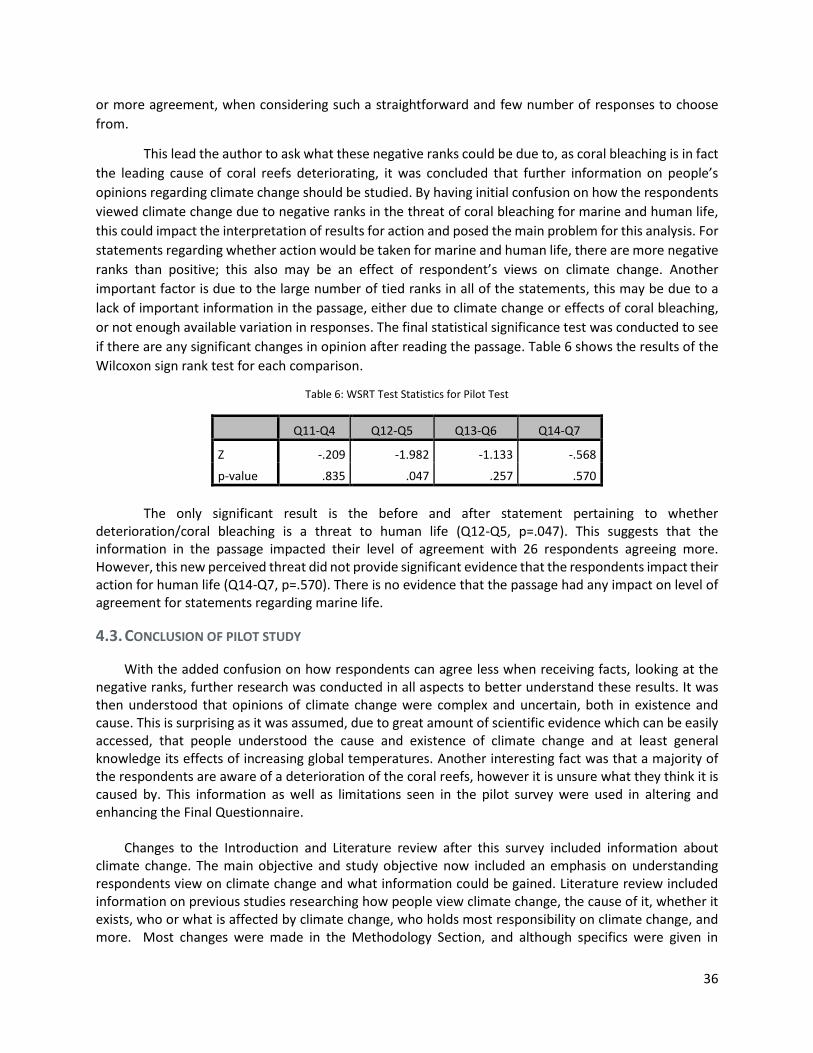
36
or more agreement, when considering such a straightforward and few number of responses to choose
from.
This lead the author to ask what these negative ranks could be due to, as coral bleaching is in fact
the leading cause of coral reefs deteriorating, it was concluded that further information on people’s
opinions regarding climate change should be studied. By having initial confusion on how the respondents
viewed climate change due to negative ranks in the threat of coral bleaching for marine and human life,
this could impact the interpretation of results for action and posed the main problem for this analysis. For
statements regarding whether action would be taken for marine and human life, there are more negative
ranks than positive; this also may be an effect of respondent’s views on climate change. Another
important factor is due to the large number of tied ranks in all of the statements, this may be due to a
lack of important information in the passage, either due to climate change or effects of coral bleaching,
or not enough available variation in responses. The final statistical significance test was conducted to see
if there are any significant changes in opinion after reading the passage. Table 6 shows the results of the
Wilcoxon sign rank test for each comparison.
Table 6: WSRT Test Statistics for Pilot Test
Q11-Q4 Q12-Q5 Q13-Q6 Q14-Q7
Z -.209 -1.982 -1.133 -.568
p-value .835 .047 .257 .570
The only significant result is the before and after statement pertaining to whether
deterioration/coral bleaching is a threat to human life (Q12-Q5, p=.047). This suggests that the information in the passage impacted their level of agreement with 26 respondents agreeing more. However, this new perceived threat did not provide significant evidence that the respondents impact their action for human life (Q14-Q7, p=.570). There is no evidence that the passage had any impact on level of agreement for statements regarding marine life.
4.3. CONCLUSION OF PILOT STUDY
With the added confusion on how respondents can agree less when receiving facts, looking at the negative ranks, further research was conducted in all aspects to better understand these results. It was then understood that opinions of climate change were complex and uncertain, both in existence and cause. This is surprising as it was assumed, due to great amount of scientific evidence which can be easily accessed, that people understood the cause and existence of climate change and at least general knowledge its effects of increasing global temperatures. Another interesting fact was that a majority of the respondents are aware of a deterioration of the coral reefs, however it is unsure what they think it is caused by. This information as well as limitations seen in the pilot survey were used in altering and enhancing the Final Questionnaire.
Changes to the Introduction and Literature review after this survey included information about
climate change. The main objective and study objective now included an emphasis on understanding respondents view on climate change and what information could be gained. Literature review included information on previous studies researching how people view climate change, the cause of it, whether it exists, who or what is affected by climate change, who holds most responsibility on climate change, and more. Most changes were made in the Methodology Section, and although specifics were given in

37
“Rational of Questionnaire”, the passage below explains the major limitations that the Pilot Survey had which influenced these changes.
First, although respondents could answer whether they had or had not learned information in the
pilot survey, it is unsure what exactly they learned. Therefore, questions about coral reefs were added in the Final Questionnaire before the passage to better understand what exactly they would learn in the passage. Second, the Pilot survey only asked whether the respondents do anything to prevent climate change but not their beliefs. Therefore, questions were asked to understand their view on the existence and the cause of climate change before receiving facts in the passage. These questions would help better interpret final results in the analysis section. Third, the passage in the Final Questionnaire took information presented in the Literature review to better explain and present climate change. It also included correct answers to the questions mentioned above, on what they would learn exactly, as well as additional information relating to those subjects. Fourth, while the point initially was to gain an easier understanding of how they felt based off of simply disagree and agree using a 4 point Likert scale, there was not much variation in responses and it proved difficult in detecting a change in level of agreement. Therefore, the Final Questionnaire increased the options for level of agreement, using a Likert scale of 10 rather than 4. Lastly, while more questions were added, questions asking about whether the respondent is aware of deterioration and where they get most of their news from were excluded from the final questionnaire in order to shorten it, as they did not add significant value to interpret the results.

38
5. FINAL RESULTS
The aim of this study is to understand if people who are more aware of causes and effects of coral
bleaching, due to climate change, are more likely to implement an action in their own life to slow climate
change and for what motive. First, descriptive statistics of questions 1-8 are provided to gain initial
information about the demographics, knowledge, and beliefs of the respondents and outline groups that
will be studied. Then, the “before” and “after” statements are analyzed both overall as well as by groups.
These sections include descriptive statistics of the “before” and “after” statements, statistical analysis,
and interpretation of the results found.
5.1. DESCRIPTIVE OVERVIEW
100 completed final questionnaires were collected. Out of the 100, 5 respondents admitted to not
reading the passage6 and therefore were omitted from the analysis. 6 respondents answered in some
level of disagreement on whether they felt they learned more after reading the passage7. However,
reviewing their answers to question 3, 4, and 5, which tested their knowledge about coral reefs, all
respondents answered incorrectly on at least one of the questions. This proves that they in fact did learn
at least one thing and therefore were included in the study. The following section outlines information
collected from the 95 respondents on the first 8 question which were studied to gain demographics,
knowledge of coral reefs, and beliefs on climate change.
Figure 1 and 2 show the proportions of respondents by gender and age. The sample consists of a
slightly higher proportion of females (56.8%) than males (43.2%). The sample consists of similar
proportions for the three different age groups of “18-29”, “30-44”, and “45-60”, ranging between 20.0%
and 25.0%; however, those aged over 60 years of age make up a larger proportion of 35.8% of the sample.
Both Gender and Age are used as groups to compare differences between the “before” and “after”
statements.
Figure 1: Gender
Figure 2: Age
Three questions were asked in order to understand how much the respondents knew about
benefits of the coral reef for marine and human life as well as rate of destruction that the coral reef
6 Collected from a question placed at the end of the passage in Survey Monkey, no number was assigned to this 7 Collected from question 13, where responses “1”-“5” represented some level of disagreement

39
currently faces, before reading the passage. The tables below show the count and proportion of
responses for each question.
Table 7: Count and Percentage of Q3
Q3: What are some benefits of the coral reef? (Please select all that apply)
Count Percentage
A: Home for marine life 89 93.70% B: Mating Areas 68 71.60% C: Protection of shore 73 76.80% D: Feeding areas 72 75.80%
Table 8: Count and Percentage of Q4
Q4: How many people rely on coral reefs for their livelihoods and food?
Count Percentage
A: 50 million 13 13.70%
B: 500 million 13 13.70%
C: 5 billion 6 6.30%
D: I don't know 63 6.30%
Table 9: Count and Percentage of Q5
To your best knowledge, how much of the coral reef system will be destroyed by 2050?
Count Percentage
A: 30% 16 16.80%
B: 60% 20 21.10%
C: 90% 30 31.60%
D: I don't know 29 30.50%
Table 7 shows responses regarding benefits of the coral reef; the most known benefit was “home
for marine life” (93.7%) while the least known benefit was “mating areas ” (71.6%). All possibilities given
for this question were benefits of the coral reef with the first, second, and fourth responses benefiting
marine life. Table 8 shows that the majority of the respondents (66.3%) do not know how many people
around the world rely on coral reefs for their livelihood and food, when in fact only a small percentage
(13.0%) correctly know that 500 million do. Table 9 shows that roughly the same amount of respondents
answered correctly to the proportion of the coral reef system that will be destroyed by 2050 (31.6%) as
those who do not know (30.5%).

40
Three questions were asked in order to understand the respondents’ views on climate change
before reading the passage. The tables below show the counts and proportions of the chosen responses
for each question.
Table 10: Count and Percentage of Q6
Q6: Do you specifically do anything to stop climate change?
Count Percentage
Yes 60 63.20%
No 35 36.80%
Total 95 100.00%
Table 11: Count and Percentage of Q7
Q7: I believe that climate change:
Count Percentage
is happening 77 81.10%
is not happening 11 11.60%
I don't know 7 7.40%
Total 95 100.00%
Table 12: Count and Percentage of Q8
Q8: I believe that climate change:
Count Percentage
is caused by humans 64 67.40%
is a natural fluctuation in Earth's temperature 21 22.10%
is not happening 5 5.30%
I don't know 5 5.30%
Total 95 100.00%
While the majority separately respond to taking action against climate change (63.2%), that
climate change is happening (81.1%), and that climate change is caused by humans (67.4%), below is a
more in depth look of how responses show varying beliefs.
Figure 3: Clustered bar chart of Q8 by Q7

41
Figure 3 shows the groups of responses in question 7, which refers to the existence of climate
change, that make up the responses in question 8, which refers to the beliefs on whether their actions
cause climate change. The majority (66.32%) of all respondents realize that climate change is happening
now and know that it is caused by humans, while other respondents have a differing belief of the existence
of climate change. Those who believe that climate change is a natural fluctuation in Earth’s temperatures,
have the most varied responses previously answering in all three categories about its existence. It is
difficult to assess what each group truly believes, whether they notice a change in climate patterns but
are unaware of the causes of it, are not aware of it (leaving there to be no cause for anything), or just
simply confused on the definition of climate change. All, but one individual, who believe that climate
change is caused by humans know that it is happening now, sharing the same beliefs as the majority of
scientists, while others have differing beliefs of cause and therefore are not accountable for their actions.
Therefore, responses to Question 8 best represents those who are aware of the true cause and existence
of climate change versus those who are mistaken in one way or another, and will be used for further
statistical analysis, rather than responses to Question 7. Two groups will be comprised of those who
believe that climate change is caused by humans and those who answered that it “is a natural fluctuation
in earth’s temperature”, “is not happening”, or “I don’t know”. Essentially, the first group, of 64
respondents, is aware that their actions affect the climate and therefore take responsibility for their
actions, and will be referred to as “Take responsibility”. The other 31 respondents do not believe that
their actions have any impact on the climate and will be referred to as “Do not take responsibility”.
Figure 4 shows the groups of responses in question 8, which refers to the cause of climate change, that make up the responses in question 6, whether or not they specifically do anything to stop climate change. It would seem that only those who believe that their actions affect climate change respond “yes”, but again, we can see uncertainty in their beliefs where respondents believing that it is natural (n=11) and those who are unsure of the cause (n=2) responded that they do actively do something to stop climate change. These groups are used for further statistical analysis where the 60 respondents who responded “yes” are referred to as “Active” and the 35 respondents who responded “no” are referred to as “Not Active” (n=35).
Figure 4: Clustered bar chart of Q8 and Q6
Finally, Figure 5 shows the count of level agreement to the statement “I feel that I have learned
more after reading this passage”. The most chosen response to this statement was “Strongly Agree” with

42
34 people choosing this, while 89 respondents in total agreed on some level that they did learn more,
answering 6 or higher.
Figure 5: Bar Chart of Q13
According to these results, there was information that was previously unknown or uncertain that
the passage effectively covered. However, this alone does not give insight into whether this newly learned
and/or confirmed information raised awareness of threat of coral bleaching. For this reason, the “before”
and “after” statements are studied.
5.2. ALL RESPONDENTS
5.2.1. Descriptive Statistics
Figure 6 shows the boxplots for the “before” and “after” statements for all 95 respondents. For statements regarding the threat of coral bleaching for marine life (Q9 and Q14) as well as likelihood to take action against coral bleaching for marine life (Q11 and Q16), there seem to be no changes in median or distribution of the responses after reading the passage. However, for statements regarding the threat of coral bleaching for human life (Q10 and Q15) there is an increase in median and less varied interquartile range. For the statement regarding likelihood to take action against coral bleaching for human life (Q12 and Q17) there is also an increase in median, however responses seem to vary more after reading the passage.
Figure 6: "Before" and "After" Boxplots for "All"

43
5.2.2. Wilcoxon Sign Rank Test
The aim of this study is to determine if more aware people are more likely to take action against the effects of coral bleaching and for what motive. Therefore, the Wilcoxon Sign Rank test was conducted to determine whether there is evidence of significant differences in the level of agreement for the “before” and “after” statements for all of the respondents (n=95).
Results in Table 13 shows that there is evidence of significant differences in the level of agreement before and after the passage regarding the perception of threat to human life caused by the deterioration of the coral reef (Q10 and Q15; p-value = 0.000). There is also evidence of significant differences regarding taking action in protecting the coral reef for human life (Q12 and Q17; p-value = 0.012). According to the descriptive analysis and table 14, these results indicate that there were significant increases in the medians of both statements regarding human life. On the other hand, as expected from the descriptive analysis, there is no evidence of significant differences for both analogous questions referring to marine life (Q9 and Q14; Q11 and Q16), with a significance level of 5%.
Table 13: WSRT Test Statistics for "All"
Q9 and Q14 Q11 and Q16 Q10 and Q15 Q12 and Q17
Z -0.059 -0.943 -4.920 -2.526
p-value 0.953 0.345 0.000 0.012
Table 14: "After" Medians for "All"
Median +/-
Q14 10 0
Q16 8 0
Q15 9 +2
Q17 8 +1
Although there are significant increases in median level of agreement for statements regarding
human life, the threat of a deteriorating coral reef is slightly less important than that for marine life still
after reading the passage. However when considering taking action to protect the coral reef, respondents
after the passage have the same level of agreement to action against climate change for marine and
human life.
It is not surprising that there was no evidence of significant differences for the threat of marine
life because descriptive overview analysis showed that the majority knew the benefits of coral reef for
marine life8 and studies show that respondents believe that climate change is affecting plant and animal
life right now. Also, the lack of knowledge of the importance of coral reefs for mankind9 allowed
information to be gained in the passage, increasing awareness of the threat of coral bleaching and
8 Question 3, Table 7 9 Question 4, Table 8
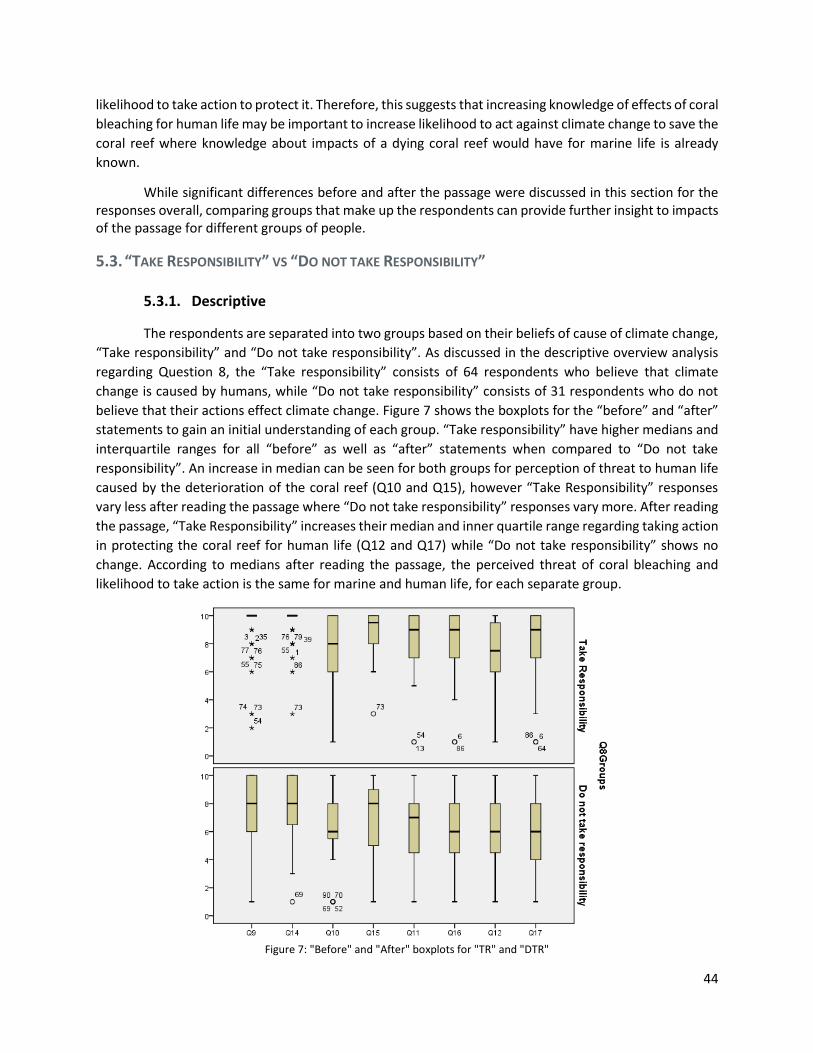
44
likelihood to take action to protect it. Therefore, this suggests that increasing knowledge of effects of coral
bleaching for human life may be important to increase likelihood to act against climate change to save the
coral reef where knowledge about impacts of a dying coral reef would have for marine life is already
known.
While significant differences before and after the passage were discussed in this section for the responses overall, comparing groups that make up the respondents can provide further insight to impacts of the passage for different groups of people.
5.3. “TAKE RESPONSIBILITY” VS “DO NOT TAKE RESPONSIBILITY”
5.3.1. Descriptive
The respondents are separated into two groups based on their beliefs of cause of climate change,
“Take responsibility” and “Do not take responsibility”. As discussed in the descriptive overview analysis
regarding Question 8, the “Take responsibility” consists of 64 respondents who believe that climate
change is caused by humans, while “Do not take responsibility” consists of 31 respondents who do not
believe that their actions effect climate change. Figure 7 shows the boxplots for the “before” and “after”
statements to gain an initial understanding of each group. “Take responsibility” have higher medians and
interquartile ranges for all “before” as well as “after” statements when compared to “Do not take
responsibility”. An increase in median can be seen for both groups for perception of threat to human life
caused by the deterioration of the coral reef (Q10 and Q15), however “Take Responsibility” responses
vary less after reading the passage where “Do not take responsibility” responses vary more. After reading
the passage, “Take Responsibility” increases their median and inner quartile range regarding taking action
in protecting the coral reef for human life (Q12 and Q17) while “Do not take responsibility” shows no
change. According to medians after reading the passage, the perceived threat of coral bleaching and
likelihood to take action is the same for marine and human life, for each separate group.
Figure 7: "Before" and "After" boxplots for "TR" and "DTR"

45
5.3.2. Statistical
5.3.2.1. Mann Whitney U
A Mann Whitney U test is conducted on all four “before” statements to determine if the median levels of agreement for the two groups, “Take responsibility” and “Do not take responsibility”, are significantly different. Results in Table 15 show that there is evidence of significant differences in median level of agreement between “Take Responsibility” and “Do not take responsibility” for all four “before” statements at a significance level of 5%. According to Table 16, and descriptive analysis, these results indicate that “Take Responsibility” respondents have a higher median than “Do not take responsibility” respondents.
Table 15: MWU Test Statistics for “DTR” and “TR”
Q9 Q10 Q11 Q12
Z -3.893 -2.273 -3.565 -1.972
p-value 0.000 0.023 0.000 0.049
Table 16: "Before" medians for "DTR" and "TR"
Q9 Q10 Q11 Q12
Do not take responsibility 8 6 7 6
Take responsibility 10 8 9 7
Reasons for separating the respondents into two groups is due to their responses to beliefs in
climate change before the passage, and the significant evidence of difference in medians for the “before”
statements between the groups further justifies this separation. “Take responsibility” are more informed
about the cause of climate change, but also seem to be more informed about the urgency of the climate
change’s impact on coral reefs. This can be seen in responses to question 5, which asks about the
percentage of coral reef system that will be destroyed by 2050, where 42.2% of “Take Responsibility”
respondents knew that 90% would be destroyed by 2050; however only 9.7% of “Do not take
responsibility” were aware of this (See Appendix C, Table 3). Already we can see that enhanced knowledge
and awareness of issues caused by climate change even before the passage, leads to higher level of
agreement to the threat of coral bleaching and personal importance to take action for both marine and
human life compared to “Do not take responsibility”. By separating them into more similar groups,
additional tests can be conducted in order to gain more useful interpretations based on each group.
5.3.2.2. Wilcoxon Sign Rank Test
The aim of the passage was to inform the respondents about climate change and its causes, how
it affects coral reefs, and the effects of coral bleaching to marine and human life. By separating the
respondents into two groups, “Take Responsibility” and “Do not take responsibility”, we know what each
group has the potential of understanding, and accepting as true, when reading the passage. The
respondents in “Take Responsibility” already recognize that their actions have consequences for climate

46
change, and therefore information about coral bleaching and its effects for both marine and human life
may be new information that could change their level of agreement to the “after” statements. “Do not
take responsibility” respondents will also be presented with this information, however they must first be
convinced by the facts that climate change is happening and that it is caused by humans.
A Wilcoxon Sign Rank test is conducted for all of the “before” and “after” statements for the two
groups separately, “Take Responsibility” and “Do not take responsibility”, in order to determine if there
is evidence of significant difference in the level of agreement. The results of the two groups for the same
“before” and “after” statements in a total of 8 tests, first discussing statements for marine life followed
by human life. The results are compared and analyzed to discuss the effectiveness of the information in
the passage in raising awareness and encouraging action.
Results in table 17 shows that there is no evidence in significant differences in level of agreement before and after the passage regarding the perception of threat to marine life caused by deterioration of coral bleaching (Q9 and Q14; “Do not take responsibility p-value=.565 and “Take responsibility” p-value=.617) as well as taking action in protecting coral reef for marine life (Q11 and Q16; “Do not take responsibility p-value=.439 and “Take responsibility” p-value=.713) for either group. In which case, no significant change can be seen in medians, as shown in table 18, as expected in descriptive analysis.
Table 17: Marine life WSRT Test Statistics for "DTR" and "TR"
Q9 and Q14 Q11 and Q16
Do not take
responsibility Take
Responsibility Do not take
responsibility Take
responsibility
Z -0.575 -0.500 -0.774 -0.381
p-value 0.565 0.617 0.439 0.703
Table 18: Marine life "After" Medians for "DTR" and "TR"
Do not take responsibility
Take responsibility
Median +/- Median +/-
Q14 8 0 10 0
Q16 6 -1 9 0
Results in Table 19 show that there is evidence of significant differences in the level of agreement
after the passage regarding the perception of threat to human life caused by the deterioration of the coral
reef (Q10 and Q15) for “Take Responsibility” (p-value = 0.000). There is also evidence of significant
differences regarding taking action in protecting coral reef for human life (Q12 and Q17) for “Take
responsibility” (p-value=.003). According to table 20, and descriptive analysis, these results indicate an
increase in median for both statements for “Take responsibility” respondents. There is evidence of
significant differences in the level of agreement after the passage regarding the perception of threat to
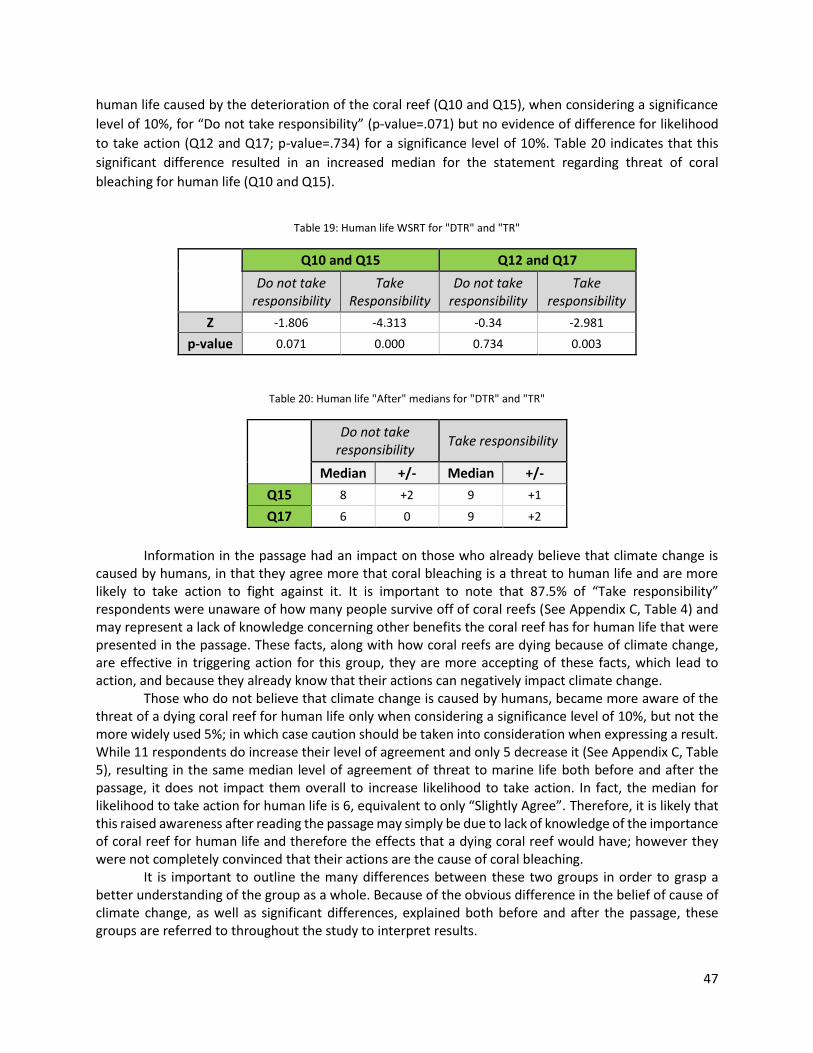
47
human life caused by the deterioration of the coral reef (Q10 and Q15), when considering a significance
level of 10%, for “Do not take responsibility” (p-value=.071) but no evidence of difference for likelihood
to take action (Q12 and Q17; p-value=.734) for a significance level of 10%. Table 20 indicates that this
significant difference resulted in an increased median for the statement regarding threat of coral
bleaching for human life (Q10 and Q15).
Table 19: Human life WSRT for "DTR" and "TR"
Q10 and Q15 Q12 and Q17
Do not take
responsibility Take
Responsibility Do not take
responsibility Take
responsibility
Z -1.806 -4.313 -0.34 -2.981
p-value 0.071 0.000 0.734 0.003
Table 20: Human life "After" medians for "DTR" and "TR"
Do not take responsibility
Take responsibility
Median +/- Median +/-
Q15 8 +2 9 +1
Q17 6 0 9 +2
Information in the passage had an impact on those who already believe that climate change is caused by humans, in that they agree more that coral bleaching is a threat to human life and are more likely to take action to fight against it. It is important to note that 87.5% of “Take responsibility” respondents were unaware of how many people survive off of coral reefs (See Appendix C, Table 4) and may represent a lack of knowledge concerning other benefits the coral reef has for human life that were presented in the passage. These facts, along with how coral reefs are dying because of climate change, are effective in triggering action for this group, they are more accepting of these facts, which lead to action, and because they already know that their actions can negatively impact climate change. Those who do not believe that climate change is caused by humans, became more aware of the threat of a dying coral reef for human life only when considering a significance level of 10%, but not the more widely used 5%; in which case caution should be taken into consideration when expressing a result. While 11 respondents do increase their level of agreement and only 5 decrease it (See Appendix C, Table 5), resulting in the same median level of agreement of threat to marine life both before and after the passage, it does not impact them overall to increase likelihood to take action. In fact, the median for likelihood to take action for human life is 6, equivalent to only “Slightly Agree”. Therefore, it is likely that this raised awareness after reading the passage may simply be due to lack of knowledge of the importance of coral reef for human life and therefore the effects that a dying coral reef would have; however they were not completely convinced that their actions are the cause of coral bleaching. It is important to outline the many differences between these two groups in order to grasp a better understanding of the group as a whole. Because of the obvious difference in the belief of cause of climate change, as well as significant differences, explained both before and after the passage, these groups are referred to throughout the study to interpret results.

48
5.4. “ACTIVE” AND “NOT ACTIVE”
5.4.1. Descriptive
Two groups are formed regarding their responses to question 6: “Do you specifically do anything
to prevent climate change?”. The 60 respondents who answered “yes” are referred to as “Active” while
the 35 respondents who answered “no” are refered to as “Not Active”. Figure 8 shows the boxplots for
the “before” and “after” statements to gain an initial understanding of each group. “Active” respondents
have no major changes levels of agreement after reading the passage for statements regarding marine
life (Q9 and Q14; Q11 and Q16). However, “Not Active” respondents have a slight decrease in median
level of agreement to the statement regarding likelihood to take action against climate change for marine
life (Q11 and Q16). Both “Active” and “Not Active” respondents increase their median level of agreement
and interquartile range for the threat of coral bleaching for human life (Q10 and Q15) as well as likelihood
to take action against coral bleaching for human life (Q12 and Q17). “Active” respondents agree more the
statements both before and after reading the passage compared to “Not Active” respondents.
Figure 8: "Before" and "After" Boxplots for "Active" and "Not Active"
5.4.2. Statistical
5.4.2.1. Mann Whitney U
A Mann Whitney U test is conducted on all four “before” statements to determine if the median
level of agreement for the two groups, “Active” and “Not Active”, are significantly different. Results in
Table 21 show that there is evidence of significant differences in median level of agreement between the
two groups for all four “before” statements, at a significance level of 5%. This difference, as discussed in
the Section 5.4.1., refers to “Active” respondents having a higher median than “Not Active” respondents.

49
Table 21: MWU Test Statistics for "Not Active" and "Active"
Q9 Q10 Q11 Q12
Z -2.314 -2.331 -3.032 -2.374
p-value 0.021 0.02 0.002 0.018
Table 22: "Before" Medians for "Not Active" and "Active"
Q9 Q10 Q11 Q12
Not Active 9 7 7 6
Active 10 8 9 7.5
It is not surprising that “Active” respondents agree more to the “before” statements than “Not
Active” respondents, given that the 78.3% of “Active” respondents are those who believe that climate
change is caused by humans and findings in Section 5.3. revealed that “Take responsibility” respondents
agree more to these statements. However, knowledge of cause of climate change alone does not
automatically mean that the person will take action, as 26.6% of “Take responsibility” respondents
currently do not do anything to stop climate change, making up 48.6% of the “Not Active” respondents,
(See Appendix D, Table 1). Awareness of cause of climate change as well as importance to take action has
lead to significantly higher medians for “Active” versus “Not Active” respondents even before reading the
passage. By separating these two groups, and keeping in mind the their beliefs on cause of climate change,
we can gain a better understanding of what, if anything, can increase liklihood to take action against coral
bleaching, especially for “Not Active” respondents.
5.4.2.2. Wilcoxon Sign Rank Test
While the aim of this study is to determine if people who are more aware of the current situation
are more likely to take action against the effects of coral bleaching, it is necessary to compare those who
currently take action to stop climate change versus those who do not . A Wilcoxon Sign Rank Test is
conducted to determine if there is evidence of significant differences in level of agreement for both
“Active” and “Not Active” respondents. The results of the two groups for the same “before” and “after”
statements are then compared in a total of 8 tests, first discussing statements for marine life followed by
human life. The results are compared and analyzed to discuss the effectiveness of the information in the
passage in raising awareness and encouraging action.
Results in Table 23 show that there is no evidence of significant differences in the level of
agreement before and after the passage for either statement regarding marine life for “Active” and “Not
Active” groups. As expected from the descriptive analysis, Table 24 shows no significant change in
medians.
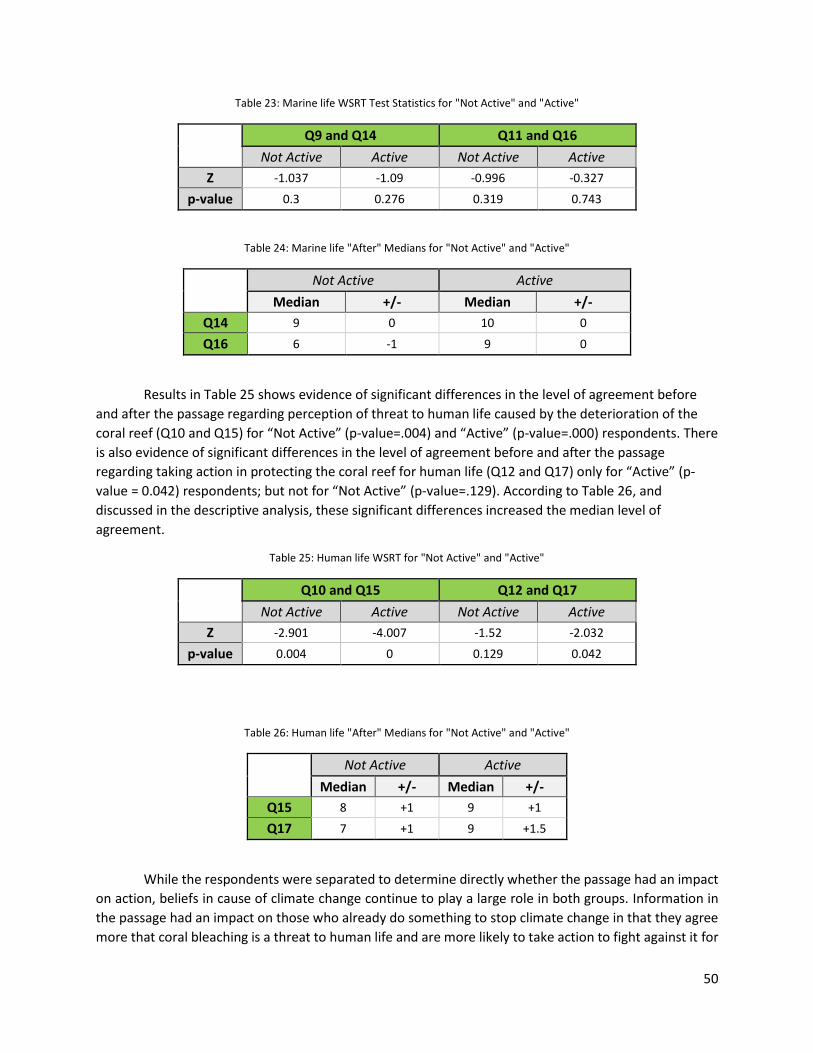
50
Table 23: Marine life WSRT Test Statistics for "Not Active" and "Active"
Q9 and Q14 Q11 and Q16
Not Active Active Not Active Active
Z -1.037 -1.09 -0.996 -0.327
p-value 0.3 0.276 0.319 0.743
Table 24: Marine life "After" Medians for "Not Active" and "Active"
Not Active Active
Median +/- Median +/-
Q14 9 0 10 0
Q16 6 -1 9 0
Results in Table 25 shows evidence of significant differences in the level of agreement before
and after the passage regarding perception of threat to human life caused by the deterioration of the
coral reef (Q10 and Q15) for “Not Active” (p-value=.004) and “Active” (p-value=.000) respondents. There
is also evidence of significant differences in the level of agreement before and after the passage
regarding taking action in protecting the coral reef for human life (Q12 and Q17) only for “Active” (p-
value = 0.042) respondents; but not for “Not Active” (p-value=.129). According to Table 26, and
discussed in the descriptive analysis, these significant differences increased the median level of
agreement.
Table 25: Human life WSRT for "Not Active" and "Active"
Q10 and Q15 Q12 and Q17
Not Active Active Not Active Active
Z -2.901 -4.007 -1.52 -2.032
p-value 0.004 0 0.129 0.042
Table 26: Human life "After" Medians for "Not Active" and "Active"
Not Active Active
Median +/- Median +/-
Q15 8 +1 9 +1
Q17 7 +1 9 +1.5
While the respondents were separated to determine directly whether the passage had an impact
on action, beliefs in cause of climate change continue to play a large role in both groups. Information in
the passage had an impact on those who already do something to stop climate change in that they agree
more that coral bleaching is a threat to human life and are more likely to take action to fight against it for

51
this reason, similar to results in Section 5.3.2.2. While it is important spread the knowledge of the coral
bleaching to those who do take action against climate change to encourage even more activity, the main
aim is to encourage those who do not currently take action against climate change to do so. The
information in the passage did increase awareness of the threat of coral bleaching, however it did not
impact a significant change in intention to take action for those who do not do anything to stop climate
change. Specifically observing those who do not currently take any action, the information in the passage
seemed to mainly impact those who believe that climate change is caused by humans where 62.5%
(10/16) (See Appendix D, Table 4) agreed more and had an overall median of 9, however only 37.5% (6/10)
of those who believe the contrary agreed more and had an overall median of 5, equivalent to “Slightly
Disagree” (See Appendix D, Table 6). This shows continuing differences between the two groups on
whether they currently do something to stop climate change or not. It still holds true that more effort is
needed to convince respondents that our actions cause climate change, which has dangerous results for
marine and human life.
5.5. MALE VS FEMALE
5.5.1. Descriptive
Two groups are formed based on gender, with 41 “Male” respondents and 64 “Female”
respondents. Figure 9 represents the distribution of responses for “before” and “after” statements by
gender. Responses for Males vary more than Females both before and after the statements. This may be
due to Females having a larger proportion of “Take responsibility” (75.9%) respondents where Males have
similar proportions of “Take responsibility” (56.1%) as “Do not take responsbility” (43.9%) respondents.
As discussed throughout Section 5.2., “Do not take responsibility” respondents tend to have lower level
of agreements which may influence the variation of responses when observing Females. Therefore, the
boxplots are separated by gender and beliefs in cause of climate change, as seen in Figure 10. “Male/Do
not take responsibility” have a larger proportion of lower level of agreements and medians than
“Male/Take responsibility” both before and after the passage. The major difference observed is that
“Male/Do not take responsibility” decrease their level of agreement after reading the passage regarding
liklihood to take action against climate change to stop coral bleaching for both marine(Q11 and Q16) and
human life (Q12 and Q17), where the other groups increased their level of agreement. “Female/Do not
take responsibility” have a larger proportion with lower agreement levels before the passage, compared
to “Female/Take responsibility”, however after reading the passage they increase their level of
agreement for all statements except coral bleaching as a threat to marine life (Q9 and Q14), having similar
medians to “Female/Take responsibility”. Although “Female/Do not take responsibility” increase their
median level of agreement for after statements regarding liklihood to take action against climate change
to stop coral bleaching for both marine(Q11 and Q16) and human life (Q12 and Q17), the responses vary
much more than before suggesting that some Female respondents agreed much less to the statement.

52
Figure 9:"Before" and "After" Boxplots for "Gender"
Figure 10: "Before" and "After" Boxplots for "Gender" and
"DTR"/"TR"
5.5.2. Statistical
5.5.2.1. Mann Whitney U
A Mann Whitney U test is conducted on all four “before” statements to determine if the median levels of agreement for Male and Female are significantly different. Table 27 shows evidence of significantly different levels of agreement for Male and Female respondents only for the statement regarding perception of threat of deterioration of coral reef for marine life (Q9; p-value=.002). According to Table 28, as well as descriptive analysis, indicates that Females agree more and responses vary considerably less than Males for this statement. Otherwise, there is no evidence of difference in median agreement levels for the other “before” statements.
Table 27: MWU Test Statistics for "Gender"
Q9 Q10 Q11 Q12
Z -3.150 -0.176 -0.839 -0.488
p-value 0.002 0.860 0.402 0.626
Table 28: "Before" Medians for "Gender"
Q9 Q10 Q11 Q12
Male 9 8 8 7
Female 10 7 8.5 7
While there seems to be no major difference between Male and Female before the passage,
further statistical analysis is conducted to see if they respond differently to the passage.
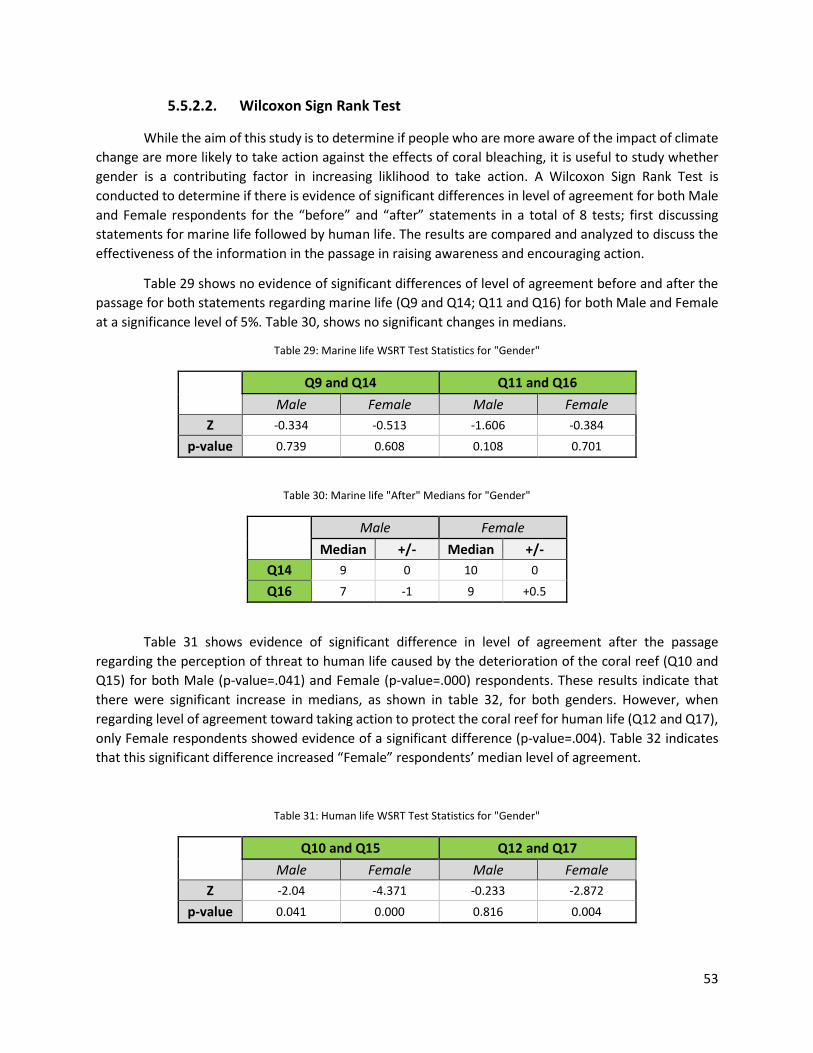
53
5.5.2.2. Wilcoxon Sign Rank Test
While the aim of this study is to determine if people who are more aware of the impact of climate
change are more likely to take action against the effects of coral bleaching, it is useful to study whether
gender is a contributing factor in increasing liklihood to take action. A Wilcoxon Sign Rank Test is
conducted to determine if there is evidence of significant differences in level of agreement for both Male
and Female respondents for the “before” and “after” statements in a total of 8 tests; first discussing
statements for marine life followed by human life. The results are compared and analyzed to discuss the
effectiveness of the information in the passage in raising awareness and encouraging action.
Table 29 shows no evidence of significant differences of level of agreement before and after the
passage for both statements regarding marine life (Q9 and Q14; Q11 and Q16) for both Male and Female
at a significance level of 5%. Table 30, shows no significant changes in medians.
Table 29: Marine life WSRT Test Statistics for "Gender"
Q9 and Q14 Q11 and Q16
Male Female Male Female
Z -0.334 -0.513 -1.606 -0.384
p-value 0.739 0.608 0.108 0.701
Table 30: Marine life "After" Medians for "Gender"
Male Female
Median +/- Median +/-
Q14 9 0 10 0
Q16 7 -1 9 +0.5
Table 31 shows evidence of significant difference in level of agreement after the passage
regarding the perception of threat to human life caused by the deterioration of the coral reef (Q10 and
Q15) for both Male (p-value=.041) and Female (p-value=.000) respondents. These results indicate that
there were significant increase in medians, as shown in table 32, for both genders. However, when
regarding level of agreement toward taking action to protect the coral reef for human life (Q12 and Q17),
only Female respondents showed evidence of a significant difference (p-value=.004). Table 32 indicates
that this significant difference increased “Female” respondents’ median level of agreement.
Table 31: Human life WSRT Test Statistics for "Gender"
Q10 and Q15 Q12 and Q17
Male Female Male Female
Z -2.04 -4.371 -0.233 -2.872
p-value 0.041 0.000 0.816 0.004

54
Table 32: Human life "After" Medians for "Gender"
Male Female
Median +/- Median +/-
Q15 9 +1 9 +2
Q17 6 -1 9 +2
According to the results, increased awareness of the threat of coral bleaching for human life
increased the liklihood to take action for Females. This can be attributed to Females regardless of their
belief, where 63.23% of “Female/Do not take responsibility” and 53.65% of “Female/Take responsibility”
increase their response (See Appendix E, Table 7). In fact, Figure 12 below shows that after reading the
passage, the most commonly chosen response was “Strongly Agree” (10) in altering daily behavior.
However, Figure 11 shows that most “Female/Take responsibility” “Strongly Agree” (10) that they would
take action by signing a petition to raise awareness and encourage lawmakers to invest in clean energy
where most “Female/Do not take responsibility” only “Slightly Agree” (6) to take action in this way.
Therefore, it would be beneficial to reach out to women about this issue with information similar to the
passage written, and encourage them to take action.
Figure 11: Clustered Bar Chart Q18 by Q8 for Female
Figure 12: Clustered Bar Chart Q19 by Q8 for Female
Although awareness of threat of coral bleaching for human life is increased for Males and equal to that of Females, based on medians, it did not increase liklihood to take action against coral bleaching for human life. This is mainly due to differing beliefs on cause of climate change for Males. Table 33 takes a closer look at those who agreed less (Negative Rank) and those who agreed more (Positive Rank) to the statement in question after reading the passage. While overall there are almost an equal number of respondents who agree more as there are who agree less, which does not lead to significant results, 64.28% (9/14) of Negative Ranks are “Male/Do not take responsibility” while 85.61% (11/13) of the Positive Ranks are “Male/Take responsibility”. In fact, at least 44.4% of “Male/Do not take responsibility”

55
agree less after reading the passage for every statement (See Appendix E, Table 7), which differentiates them from all other groups. While belief in cause of climate change was already studied in Section 5.3., by studying Male respondents, we can gain a better understanding of them as a whole and can effectively compare these differences with Females.
Table 33: Q12 and Q17 Ranks for "M/DTR" and "M/TR"
Q12 and Q17
Total Male/Do not
take responsibility
Male/ Take responsibility
Negative Rank 14 9 5
Positive Rank 13 2 11
Tie 14 7 7
Therefore, an additional Wilcoxon Sign Rank test was conducted to determine if there is evidence
of significant differences in level of agreement for for “Male/Take responsibility” and “Male/Do not take
responsibility” respondents for the “before” and “after” statements in a total of 8 tests.
Table 34 shows no evidence of significant difference in level of agreement after the passage
regarding the perception of threat of the deterioration of the coral reef for marine life (Q9 and Q14) or
human life (Q10 and Q15) for “Male/Do not ake responsibility” for a significance level of 5% or 10%.
However, there is evidence of significant difference in level of agreement for likelihood to take action in
protecting the coral reef for marine life (p-value=.062) as well as human life (p-value=.029), for a
significance level of 10%. According to descriptive analysis, this lead to decrease in median for both
statements.
Regarding “Male/Take responsibility”, Table 34 shows evidence of significant difference in level
of agreement after the passage regarding the perception of threat of the deterioration of the coral reef
for human life (Q10 and Q15; p-value=.032), however there was no evidence of significant differences in
level of agreement toward the liklihood to take action to protect the coral reef for human life (Q12 and
Q17; p-value=.152). As discussed in descriptive analysis, this significant difference lead to an increase in
median level of agreement. There is no evidence of significant differences for both analogous questions
referring to marine life (Q9 and Q14; Q11 and Q16), with a significance level of 5% or 10%.
. Table 34: WSRT Test Statistics for "M/DTR" and "M/TR"
Q9 and Q14 Q11 and Q16 Q10 and Q15 Q12 and Q17
"Male/Do not take
responsibility"
Z -1.137 -1.864 -0.666 -2.178
p-value 0.256 0.062 0.506 0.029
"Male/Take responsibility"
Z -0.574 -0.316 -2.139 -1.433
p-value 0.566 0.752 0.032 0.152

56
No major changes were seen in the agreement level to coral bleaching as a threat for “Male/Do not take responsibility”, however agreement level of liklihood to take action for both marine and human life decreased after reading the passage, indicating their strong disagreement with information in the passage and lack of beneficial impact. Although there was increased awareness of coral bleaching as a threat to human life, this had no effect on taking action against it for “Male/Take responsibility”. Figure 13 and figure 14 below show the difference between the Males based on belief and their responses on liklihood to take action in two distinct ways ways. Figure 13 displays an obvious difference on liklihood to sign a petition to raise awareness for cleaner energy between the groups. Figure 14 shows a mixture of levels of agreement for adjusting lifestyle for each group.
Figure 13: Clustered bar chart Q18 by Q8 for Male
Figure 14: Clustered bar chart Q19 by Q8 for Male
In summary, the information in the passage was effective in increasing action for Females but not
Males, even when considering beliefs in cause of climate change, with the same liklihood to act for marine
and human life. It would be beneficial to target women with this information and the importance to take
action themselves as well as begin a conversation with the men in their life. This may be a better approach
to encourage men to take action, given the backlash in opinion or indifference Males had to passage with
scientific facts.
5.6. AGE
5.6.1. Descriptive Statistics
Respondents are separated into four age groups “18-29” (n=23), “30-44” (n=19), “45-60” (n=19),
and “>60” (n=34). Figure 15 represents the distribution of responses for “before” and “after” statements
by age in order to gain an initial understanding of the differences between the groups. For statements
regarding threat of coral bleaching to marine life (Q9 and Q14), medians stay the same or increase after
reading the passage to “Strongly Agree” (10) for all ages. For statements regarding threat of coral
bleaching to human life (Q10 and Q15), median level of agreement increase in all ages and variation of
responses decrease, except for those aged “45-60”. For statements regarding liklihood to take action

57
against climate change to stop coral bleaching for marine life (Q11 and Q16),medians remain the same or
increase for all age groups except those aged “18-29”, who not only have a lower median but also have
more varying responses. For statements regarding liklihood to take action against climate change to stop
coral bleaching for human life (Q12 and Q17), medians for all age groups increase but response levels vary
from “Strongly Disagree” (1) to “Strongly Agree” (10) for all age groups. Those aged “18-29” and “30-44”
have a larger proportion of “Take responsibility” respondents where the older age groups have almost
equal proportions (Appendix F), however it does not seem to impact the changes in age.
Figure 15: "Before" and "After" Boxplots for "Age"
5.6.2. Statistical
5.6.2.1. Kruskal Wallis
Table 35 shows the medians for the “before” statements for each age group. A Kruskal Wallis test was conducted on all four “before” statements for to determine if there is a significant difference in mean ranks for the four age groups. Results in Table 36 show no evidence of significant differences between at least one pair of groups for any of the four “before” statements with a significance level of 5%.
Table 35: "Before" Medians for "Age"
Q9 Q10 Q11 Q12
"18-29" 10 6 9 6
"30-44" 10 8 8 7
"45-60" 10 7 8 7
">60" 9 7.5 8 7
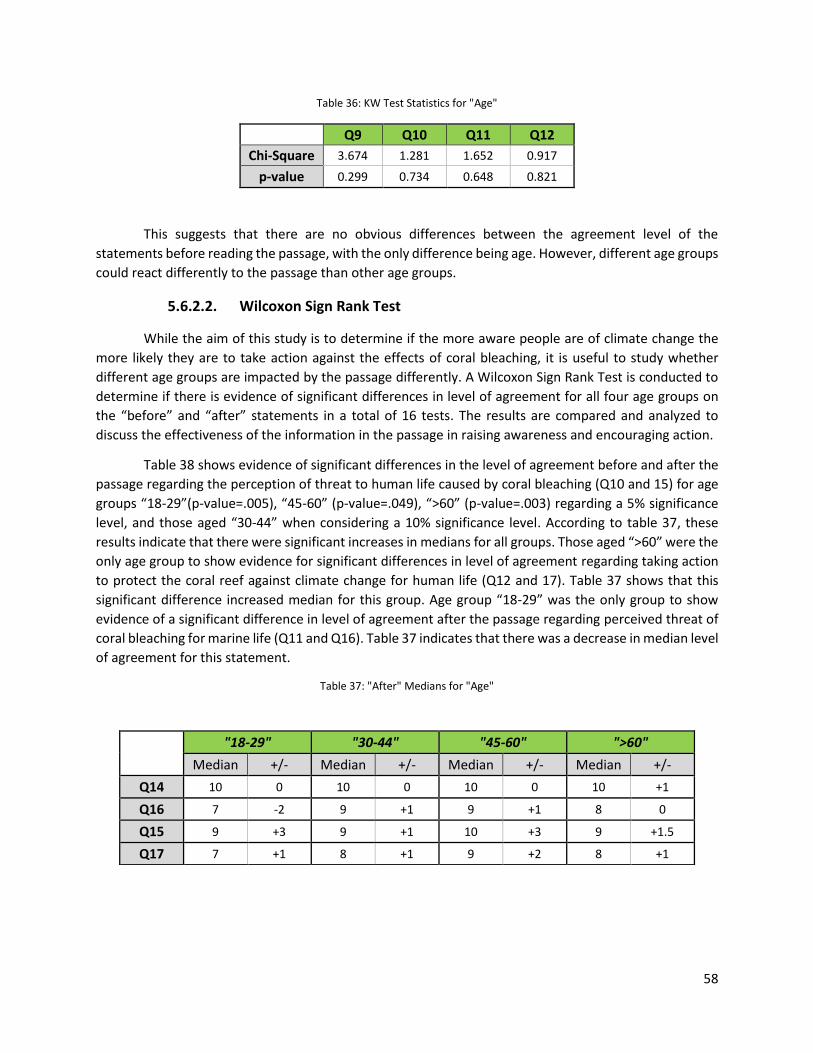
58
Table 36: KW Test Statistics for "Age"
Q9 Q10 Q11 Q12
Chi-Square 3.674 1.281 1.652 0.917
p-value 0.299 0.734 0.648 0.821
This suggests that there are no obvious differences between the agreement level of the
statements before reading the passage, with the only difference being age. However, different age groups
could react differently to the passage than other age groups.
5.6.2.2. Wilcoxon Sign Rank Test
While the aim of this study is to determine if the more aware people are of climate change the
more likely they are to take action against the effects of coral bleaching, it is useful to study whether
different age groups are impacted by the passage differently. A Wilcoxon Sign Rank Test is conducted to
determine if there is evidence of significant differences in level of agreement for all four age groups on
the “before” and “after” statements in a total of 16 tests. The results are compared and analyzed to
discuss the effectiveness of the information in the passage in raising awareness and encouraging action.
Table 38 shows evidence of significant differences in the level of agreement before and after the
passage regarding the perception of threat to human life caused by coral bleaching (Q10 and 15) for age
groups “18-29”(p-value=.005), “45-60” (p-value=.049), “>60” (p-value=.003) regarding a 5% significance
level, and those aged “30-44” when considering a 10% significance level. According to table 37, these
results indicate that there were significant increases in medians for all groups. Those aged “>60” were the
only age group to show evidence for significant differences in level of agreement regarding taking action
to protect the coral reef against climate change for human life (Q12 and 17). Table 37 shows that this
significant difference increased median for this group. Age group “18-29” was the only group to show
evidence of a significant difference in level of agreement after the passage regarding perceived threat of
coral bleaching for marine life (Q11 and Q16). Table 37 indicates that there was a decrease in median level
of agreement for this statement.
Table 37: "After" Medians for "Age"
"18-29" "30-44" "45-60" ">60"
Median +/- Median +/- Median +/- Median +/-
Q14 10 0 10 0 10 0 10 +1
Q16 7 -2 9 +1 9 +1 8 0
Q15 9 +3 9 +1 10 +3 9 +1.5
Q17 7 +1 8 +1 9 +2 8 +1

59
Table 38: WSRT Test Statistics for "Age"
Q9 and Q14 Q11 and Q16 Q10 and Q15 Q12 and Q17
"18-29" Z -1.403 -2.189 -2.836 -0.056
p-value 0.161 0.029 0.005 0.955
"30-44" Z -0.171 -0.718 -1.774 -1.292
p-value 0.865 0.473 0.076 0.196
"45-60" Z -0.586 -0.679 -1.972 -1.516
p-value 0.558 0.497 0.049 0.129
">60" Z -1.113 -0.523 -2.993 -2.389
p-value 0.266 0.601 0.003 0.017
Information in the passage was successful in increasing awareness of the threat of coral bleaching
for human life for all age groups, however only those aged “>60” increased their liklihood to take action
to protect the coral reef for human life against climate change’s effects on coral bleaching. Furthermore,
Figure 15 and 16 show that over half of the respondents “Strongly Agree”, more than any other age group,
that they are more likely to take action by signing a petition to raise awareness and encourage lawmakers
to invest in clean energy as well as to alter daily lifestyle behavior after reading the passage. Therefore, it
is beneficial to use information similar to that in the passage to raise awareness of the threat coral
bleaching has on humans, for this age group.
After reading the passage, respondents aged “18-29” have the least level of agreement of
likelihood to take action for marine or human life, with median responses only one level higher than
“Slightly Agree” (6), despite having similar level of agreements about the threat of coral bleaching for
marine and human life, with the median being either “Strongly Agree” (10) or close to this (9), compared
to other age groups. In fact, they were significantly less likely to take action against coral bleaching for the
benefit of marine life. There was no decrease in perception of threat of coral bleaching for marine life,
and while 76% of the “18-29” year old respondents believe that climate change is caused by human action
(See Appendix F, Table 12) the decrease should not be an issue with convincing what is the cause of
climate change. Figure 15 and 16 reveals that they feel equally likely, according to median and the spread
of responses, to take action by signing a petition to raise awareness and encourage lawmakers to
implement policies regarding clean energy as they do altering daily lifestyle.
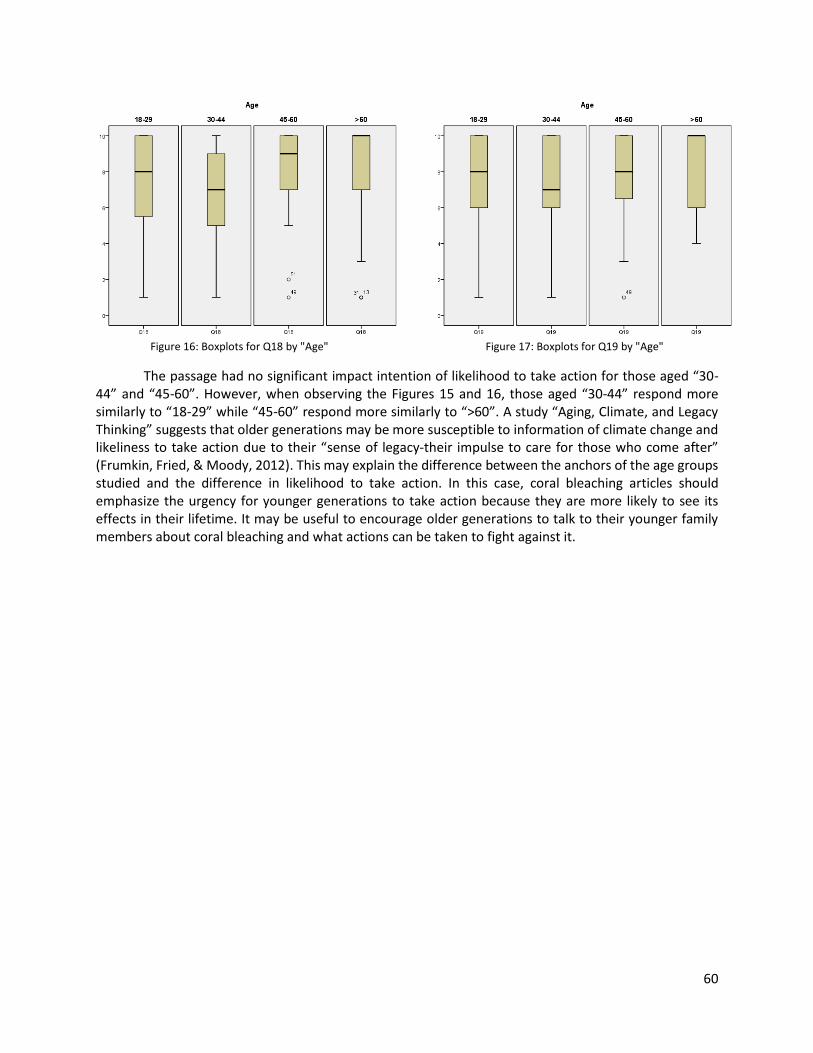
60
Figure 16: Boxplots for Q18 by "Age"
Figure 17: Boxplots for Q19 by "Age"
The passage had no significant impact intention of likelihood to take action for those aged “30-44” and “45-60”. However, when observing the Figures 15 and 16, those aged “30-44” respond more similarly to “18-29” while “45-60” respond more similarly to “>60”. A study “Aging, Climate, and Legacy Thinking” suggests that older generations may be more susceptible to information of climate change and likeliness to take action due to their “sense of legacy-their impulse to care for those who come after” (Frumkin, Fried, & Moody, 2012). This may explain the difference between the anchors of the age groups studied and the difference in likelihood to take action. In this case, coral bleaching articles should emphasize the urgency for younger generations to take action because they are more likely to see its effects in their lifetime. It may be useful to encourage older generations to talk to their younger family members about coral bleaching and what actions can be taken to fight against it.

61
6. CONCLUSION
Coral bleaching is an effect of climate change that is currently starving the coral reef of nutrition and
will be the reason that this incredibly important ecosystem will die. This will impact not only marine life
but humans as well. There is still a chance to stop the effects of climate change and reverse some of the
resultant damage to coral reefs, however immediate action is necessary. The aim of the study was to
understand if people who are more aware of the causes and impacts of coral bleaching due to climate
change, are more likely to intend to implement an action in their life to slow climate change’s effect on
coral reefs for marine life, human life, or both. A passage was written informing the survey respondents
about coral bleaching, including educational information that it is caused by climate change which is
largely caused by humans, as well as the effects that the dying coral reef will have for marine and human
life. Similar statements were used before and after the passage to study whether the information
provided impacted the respondents. Further information was included in the survey to best study and
interpret results. Major findings are summarized with the usefulness it can hold for future campaigns
regarding coral bleaching as well as personal incentives.
The before and after statements regarding the threat of deterioration of coral reef and
importance/likelihood to implement action to stop climate change’s affects on coral bleaching for human
life were the only statements that the showed significant increases in level of agreement overall,
afterwards having similar or equal levels of agreement as the same statements for marine life. While the
majority of respondents knew the importance of coral reefs for marine life, there seems to be a lack of
knowledge of the importance it has for humans and this should be highlighted to increase likelihood to
take action.
Previous knowledge of the cause of climate change plays a very large role throughout the study, where
coral bleaching and its effects are used as motivation, one cannot be convinced to take action if one does
not believe that their own actions cause it in the first place. Those who already knew that climate change
is caused by humans were more concerned about a deterioration of the coral reef than those who didn’t,
and were more likely to take action against coral bleaching. However, using coral bleaching as an example
of climate change impacts to those who don’t believe that it is caused by humans was not effective.
Therefore, a more in depth explanation about climate change and its causes should be used and then
examples about the different effects it has can be included.
Knowledge of the cause of climate change played differing roles when considering gender. While
before the passage there were no significant differences between Male and Female, they responded
differently when considering this position. Females became more aware of coral bleaching and its effects
and were more likely to take action, both every day and involving lawmakers and policies. The passage
did not motivate Males to take action, where those uninformed about the causes of climate change were
significantly less likely to take action. It is extremely important that this information is publicized in
campaigns and implemented in everyday life. A study about recycling activities found that because of
women’s traditional gender roles with household work they were more likely to recycle goods (Arcury,
Scollay, & Johnson, 2017). A study on “Gender perspectives on climate change” shares this view that
women are more likely to take into account the benefit energy efficiency appliances have on the
environment (Mignaquy, n.d.) when making a purchasing decision. These studies, along with the author’s
results, can inform and empower women to first start not only with their personal actions, but incorporate

62
these actions in their households whether they are a mother, daughter, girlfriend, sister, or roommate.
By first incorporating action in the household such as recycling or buying energy efficient appliances, a
dialogue can begin with males in the household- whether that be with father, brother, or friend.
Information in the passage contained scientific facts to convince the cause and urgency to stop climate
change, but did not show any impacts on Males’ awareness and behavior. However, one study found that
after trusting scientists and professors about the facts of climate change, they trust family and friends the
most. Coral bleaching campaigns can take this information to target women, providing them with
scientific facts to present to a male family member or friend, and begin a movement.
Age was also studied as a contributing factor of the effectiveness of the passage, but was only effective
for those aged “>60”, with “18-29” year olds having the lowest likelihood to take action. It is suggested
that it is because older generations have a sense of legacy, of what they leave behind. Coral bleaching
campaigns could target older generations highlighting the urgency of the situation and effects that will be
left not to future generations, but to their kids and grandchildren as another self-interest incentive
(Frumkin, Fried, Moody). Of course it would also be beneficial to include the importance of speaking to
their family members and friends, especially younger generations considering that they will see more of
the effects. It would also be beneficial to target younger generations with information more focused on
the negative impact it will have for them that they will see in their lifetime, considering they have a larger
percentage who are more aware about the cause and existence of climate change.
Climate change is a terrible consequence caused by humans that will eventually affect us all if we do
not come together to fight against it, and coral bleaching is an example of how it is happening now, already
affecting marine life and soon humans. Many variables can affect whether we do take action such as cost,
time, sense of urgency, but awareness of the issue must first be clear. This includes explaining that humans
are the cause of it, that it is happening now, the many effects that it will have on nature, animals, and
humans, and what we can do to stop it. By understanding these facts first and foremost ourselves, and
sharing it with others, each individual will be able to find their own personal motivation to take action
whether it is to have less smog in the air, protect the coastlines from flooding, or save the coral reef from
coral bleaching, a habitat for so much of marine life which benefits us all. By spreading information about
coral bleaching, highlighting the importance not only for marine life but human life as well, and focusing
on women and older generations first, a movement can be started to fight climate change together.
6.1. LIMITATIONS AND SUGGESTIONS
The main limitation was the length of the passage. This limited the number of questions in the
survey so that respondents would respond based on what they truly believed and not rush through them.
It is also unknown if the respondent truly read the passage or merely skimmed over it after seeing how
long it was, thereby influencing the results. For future works, a video explaining the same concepts may
be more helpful to keep the attention of the respondent, better explain the cause and effects of coral
bleaching, include different ways that a respondent can take action. That method could insure that the
respondent watches the entire video instead of skimming over a written passage, and allow more
questions to be asked to better understand differences between respondents and their motives. Many
variables can contribute to whether a person takes action against climate change, therefore more
questions might better explain what in the passage was and wasn’t effective, and for whom.

63
Another limitation was the cost involved in increasing the number of respondents. Most studies
that research people’s perceptions of climate change and action involve significantly more respondents
than this one, however due to cost 100 respondents was the maximum possible.
It would be interesting to compare, on a larger scale, how different effects of climate change
affect different people using the same questions or structure for each example and the same structure of
the passage (or video). It would continue to include explanation of climate change, how this phenomena
is happening, proof from scientists and professors that this particular phenomena is not natural, and
highlighting the multiple negative effects it will have. This could explain whether certain effects pose as a
larger motivation to take action for others using an actual example rather than understanding threats of
climate change over all.

64
7. REFERENCES
2017 Media Impact Festival Case Study: Chasing Coral.(2017). Retrieved October 17, 2018, from
https://mediaimpactfunders.org/wp-content/uploads/2017/12/Chasing-Coral.pdf
Bon, U., Belbase, S., & Lila, R. (2017, July 22). Public Perceptions and Practices of Solid Waste Recycling
in the City of Laramie in Wyoming, U.S.A. Retrieved September 14, 2018, from
file:///C:/Users/HP/Downloads/recycling-02-00011.pdf
“Buying Responses with SurveyMonkey Audience.” SurveyMonkey Help Center,
help.surveymonkey.com/articles/en_US/kb/SurveyMonkey-Audience#Panel.
Coral Reef. (n.d.). Retrieved March 28, 2018, from http://www.scienceclarified.com/landforms/Basins-
to-Dunes/Coral-Reef.html
Coral reefs. (n.d.). Retrieved November 03, 2017, from
http://wwf.panda.org/about_our_earth/blue_planet/coasts/coral_reefs/
Coral reefs support jobs, tourisms, and fisheries. (n.d.). Retrieved November 02, 2017, from
https://floridakeys.noaa.gov/corals/economy.html
Denchack, M. (2017, July 17). How You Can Stop Global Warming. Retrieved November 03, 2017, from
https://www.nrdc.org/stories/how-you-can-stop-global-warming
Early Warning Signs of Global Warming: Coral Reef Bleaching. (November 10, 2003). Retrieved
November 03, 2017, from http://www.ucsusa.org/global_warming/science_and_impacts/impacts/early-
warning-signs-of-global-2.html#.WfhpGmhSzIU
Frost, Jim. “Choosing Between a Nonparametric Test and a Parametric Test.” Minitab, 19 Feb. 2015,
blog.minitab.com/blog/adventures-in-statistics-2/choosing-between-a-nonparametric-test-and-a-
parametric-test.
Frumkin, H., Fried, L., & Moody, R. (2012, August). Aging, Climate Change, and Legacy Thinking.
Retrieved August 28, 2018, from https://www.ncbi.nlm.nih.gov/pmc/articles/PMC3464837/
Gender & Climate: 3 Things You Should Know(Rep.). (n.d.). Retrieved October 2, 2018, from
http://siteresources.worldbank.org/EXTSOCIALDEVELOPMENT/Resources/244362-
1232059926563/5747581-1239131985528/5999762-1321989469080/Gender-Climate-Change.pdf
Goldberg J, Marshall N, Birtles A, Case P, Bohensky E, Curnock M, Gooch M, Parry-Husbands H, Pert P,
Tobin R, Villani C and Visperas B (2016) Climate change, the great barrier reef, and the response of
Australians. Palgrave Communications. 2:15046 doi: 10.1057/palcomms.2015.46.
How to Conduct the Wilcoxon Sign Test. (n.d.). Retrieved May 19, 2018, from
http://www.statisticssolutions.com/how-to-conduct-the-wilcox-sign-test/
Johns, R. (2010). Likert items and scales. Retrieved from Survey Question Bank website. Retrieved
August 13 2018.http://www.surveynet.ac.uk/sqb/datacollection/likertfactsheet.pdf

65
Knowlton, N. (n.d.). Corals and Coral reefs. Retrieved October 31, 2017, from http://ocean.si.edu/corals-
and-coral-reefs
Leiserowitz, A., Maibach, E., Roser-Renouf, C., Feinberg, G., & Rosenthal, S. (2014) Climate change in the
American mind: April, 2014. Yale University and George Mason University. New Haven, CT: Yale Project
on Climate Change Communication.
Leviston, Z., and I.A. Walker. “Baseline Survey of Australian attitudes to climate change: PRELIMINARY
REPORT.” CISRO Publications, Social & Behavioural Sciences Research Group, 2011,
publications.csiro.au/rpr/download?pid=csiro:EP105359&dsid=DS3.
Lewis, S., & Mallela, J. (2017, December 13). It’s official: 2016’s Great Barrier Reef bleaching was unlike
anything that went before. Retrieved October 21, 2018, from http://theconversation.com/its-official-
2016s-great-barrier-reef-bleaching-was-unlike-anything-that-went-before-88078
Marlon, Jennifer, et al. “Yale Climate Opinion Maps - U.S. 2016.” Yale Program on Climate Change
Communication, climatecommunication.yale.edu/visualizations-data/ycom-us-
2016/?est=happening&type=value&geo=county.
Mignaquy, J. (n.d.). Gender perspectives on climate change. Retrieved October 2, 2018, from
https://www.sprc.unsw.edu.au/media/SPRCFile/1_Gender_perspectives_on_climate_change__Jazmin_
Mignaquy.pdf
McKercher, B., Prideaux, B., Cheung, C., & Law, R. (2010). Achieving voluntary reductions in the carbon
footprint of tourism and climate change. Journal of sustainable tourism, 18(3), 297-317.
Gattuso, J.-P., O. Hoegh-Guldberg, and H.-O. Pörtner, 2014: Cross-chapter box on coral reefs. In: Climate
Change 2014: Impacts, Adaptation, and Vulnerability. Part A: Global and Sectoral Aspects. Contribution
of Working Group II to the Fifth Assessment Report of the Intergovernmental Panel on Climate Change
[Field, C.B., V.R. Barros, D.J. Dokken, K.J. Mach, M.D. Mastrandrea, T.E. Bilir, M. Chatterjee, K.L. Ebi, Y.O.
Estrada, R.C. Genova, B. Girma, E.S. Kissel, A.N. Levy, S. MacCracken, P.R. Mastrandrea, and L.L. White
(eds.)]. Cambridge University Press, Cambridge, United Kingdom and New York, NY, USA, pp. 97-100.
Greshko, M. (2018, January 04). Window to Save World's Coral Reefs Closing Rapidly. Retrieved March
28, 2018, from https://news.nationalgeographic.com/2018/01/coral-bleaching-reefs-climate-change-el-
nino-environment/
Oceans and Coasts. (n.d.). Retrieved November 02, 2017, from
https://www.nature.org/ourinitiatives/urgentissues/oceans/coral-reefs/coral-reefs-coral-bleaching-
what-you-need-to-know.xml
Orlowski, J. (Director). (n.d.). Chasing Coral [Video file]. Retrieved October 31, 2017, from
https://www.netflix.com/search?q=chasing%20coral&jbv=80168188&jbp=0&jbr=0
Schuldt, Jonathon P., Sara H. Konrath, and Norbert Schwarz. 2011. “Global warming” or “climate
change”? Whether the planet is warming depends on question wording. Public Opinion Quarterly 75 (1):
115–24.

66
Swann, T., & Campbell, R. (2016). Great Barrier Bleached. Retrieved from
http://www.tai.org.au/sites/defualt/files/Swann Campbell 2016 Great Barrier Bleached FINAL w
cover.pdf
Ullman, K. (2017, May 22). Coral Reef Tourism is worth $36 Billion to the Travel Industry and Host
Nations Every Year. Retrieved July 23, 2018, from
https://www.nature.org/newsfeatures/pressreleases/coral-reef-tourism-is-worth-36-billion-to-the-
travel-industry-and-host-natio.xml
US Department of Commerce, & National Oceanic and Atmospheric Administration. (2010, March 15).
What is coral bleaching? Retrieved March 28, 2018, from
https://oceanservice.noaa.gov/facts/coral_bleach.html
What's in a name? Weather, global warming and climate change. (2016, January 20). Retrieved March
02, 2018, from https://climate.nasa.gov/resources/global-warming/
Worcester, R. M., & Burns, T. R. (1975). A statistical examination of the relative precision of verbal
scales. Journal of the Market Research Society, 17(3), 181-197.

67
APPENDIX
Appendix A: Pilot Survey
1. What is your gender?
A. Male
B. Female
2. Please select your age group:
A. 18-29
B. 30-39
C. 40-49
D. 50 or over
3. Are you aware of any deterioration of the coral reef?
A. Yes
B. No
4. I think that a deterioration of the coral reef is a threat to marine life:
Strongly Disagree, Disagree, Agree, Strongly Agree
5. I think that a deterioration of the coral reef is a threat to human life:
Strongly Disagree, Disagree, Agree, Strongly Agree
6. I think it is important that I take action in protecting the deterioration of the coral reef for marine life.
Strongly Disagree, Disagree, Agree, Strongly Agree
7. I think it is important to take action in protecting the deterioration of the coral reef for human life.
Strongly Disagree, Disagree, Agree, Strongly Agree
8. Do you do anything now specifically to prevent global warming?
A. Yes
B. No

68
9. Passage: Reefs are made up of groups of corals and corals are made up of many living organisms
called polyps. These polyps have a skeleton, digestive and reproductive tissues. Inside each mature
polyp, many single celled algae live, providing 98% of the polyp’s energy to survive through
photosynthesis. This is a delicate process, specific to a certain amount of sunlight and temperature of
water. Due to global warming, the average temperature of the ocean is increasing which interferes with
this process. Therefore, the coral polyp is not getting nutrition and begins to deteriorate leaving nothing
but its white calcium carbonate skeleton. This is referred to as coral bleaching, and is the last sign before
death. When this happens it effects marine life, human life, and even economies. As coral reefs are
home to 25% of marine life and most biodiversity in the ocean, although only covering 1% of the area of
the ocean, without them the number of species will greatly decease. Without corals, prey of larger fish
have no protection from their predators and are more likely to become extinct which will eventually
cause a crash in the food chain due to entire classes of fish becoming extinct. Successful reproduction is
also effected as the marine life that live there do not have a place to protect their young ones from
predators or outside factors or simply to find a place to encounter a mate. Populations around the world
depend on these areas of densely packed fish in order to survive. Survival from the fish can be explained
by simply not having any food to eat or jobs for fisherman and other jobs related to marine life. Lack of
jobs in turn results in a fall in the economy. Areas where the tourism relies on the fish and coral reef for
economic income will also be affected greatly. Because of the reasons mentioned above, coral bleaching
affects us all in one way or another however our daily actions are contributing to this whether we realize
it or not. Simple actions to stop global warming to protect this delicate and essential ecosystem include
but are not limited to: taking public transportation/biking/or walking, using solar energy, using less
electricity or energy efficient appliances, and eat less meat.

69
C. I have read this article
B. I have not read this article
10. I feel that I have become more informed regarding the effects of coral bleaching after reading this
passage:
Strongly Disagree, Disagree, Agree, Strongly Agree
11. After reading the passage, I think that coral bleaching of the coral reef is a threat to marine life:
Strongly Disagree, Disagree, Agree, Strongly Agree
12. After reading the passage, I think that coral bleaching of the coral reef is threat to human life:
Strongly Disagree, Disagree, Agree, Strongly Agree
13. I am more likely to change something in my lifestyle, make an additional change, or feel stronger
about what I am already doing, in order to stop global warming knowing the effects it has on coral
bleaching for marine life:
Strongly Disagree, Disagree, Agree, Strongly Agree
14. I am more likely to change something in my lifestyle, make an additional change, or feel stronger
about what I am already doing, in order to stop global warming knowing the effects it has on coral
bleaching for human life:
Strongly Disagree, Disagree, Agree, Strongly Agree
15. Where do you get most of your news from?
A. TV
B. Online or Mobile Apps
C. Social Media
D. Newspaper/Magazine

70
Appendix B: All Respondents
Table 1: WSRT Sum of Ranks, All
Ranks
All N Mean Rank Sum of Ranks
Q14 - Q9 Negative Ranks 17 18.32 311.50
Positive Ranks 18 17.69 318.50
Ties 60
Total 95
Q15 - Q10 Negative Ranks 10 19.95 199.50
Positive Ranks 46 30.36 1396.50
Ties 39
Total 95
Q16 - Q11 Negative Ranks 33 34.67 1144.00
Positive Ranks 30 29.07 872.00
Ties 32
Total 95
Q17 - Q12 Negative Ranks 24 31.83 764.00
Positive Ranks 44 35.95 1582.00
Ties 27
Total 95
Table 2: WSRT Test Statistics, All
Test Statistics
Q14 - Q9 Q15 - Q10 Q16 - Q11 Q17 - Q12
Z -.059 -4.920 -.943 -2.526
Asymp. Sig. (2-tailed) .953 .000 .345 .012
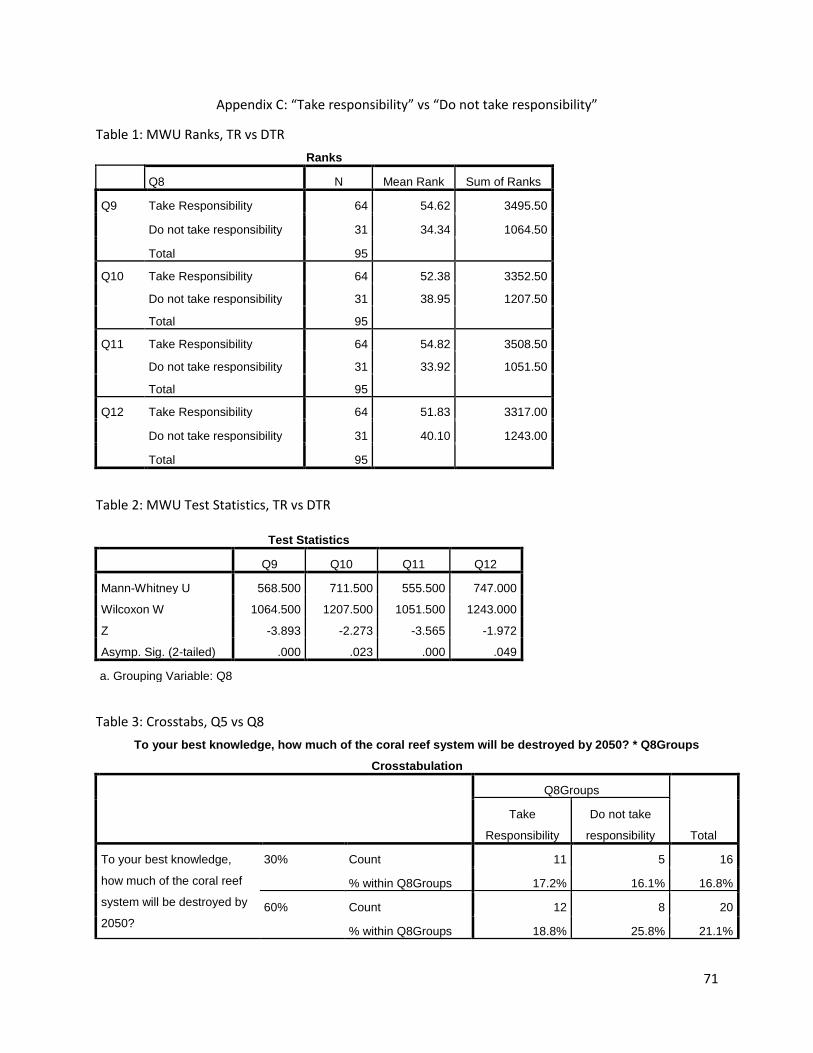
71
Appendix C: “Take responsibility” vs “Do not take responsibility”
Table 1: MWU Ranks, TR vs DTR
Ranks
Q8 N Mean Rank Sum of Ranks
Q9 Take Responsibility 64 54.62 3495.50
Do not take responsibility 31 34.34 1064.50
Total 95
Q10 Take Responsibility 64 52.38 3352.50
Do not take responsibility 31 38.95 1207.50
Total 95
Q11 Take Responsibility 64 54.82 3508.50
Do not take responsibility 31 33.92 1051.50
Total 95
Q12 Take Responsibility 64 51.83 3317.00
Do not take responsibility 31 40.10 1243.00
Total 95
Table 2: MWU Test Statistics, TR vs DTR
Test Statistics
Q9 Q10 Q11 Q12
Mann-Whitney U 568.500 711.500 555.500 747.000
Wilcoxon W 1064.500 1207.500 1051.500 1243.000
Z -3.893 -2.273 -3.565 -1.972
Asymp. Sig. (2-tailed) .000 .023 .000 .049
a. Grouping Variable: Q8
Table 3: Crosstabs, Q5 vs Q8
To your best knowledge, how much of the coral reef system will be destroyed by 2050? * Q8Groups
Crosstabulation
Q8Groups
Total
Take
Responsibility
Do not take
responsibility
To your best knowledge,
how much of the coral reef
system will be destroyed by
2050?
30% Count 11 5 16
% within Q8Groups 17.2% 16.1% 16.8%
60% Count 12 8 20
% within Q8Groups 18.8% 25.8% 21.1%

72
90% Count 27 3 30
% within Q8Groups 42.2% 9.7% 31.6%
I don't know Count 14 15 29
% within Q8Groups 21.9% 48.4% 30.5%
Total Count 64 31 95
% within Q8Groups 100.0% 100.0% 100.0%
Table 4: Crosstabs, Q4 vs Q8
How many people rely on coral reefs for their livelihoods and food? * Q8Groups Crosstabulation
Q8Groups
Total
Take
Responsibility
Do not take
responsibility
How many people rely on
coral reefs for their
livelihoods and food?
50 million Count 9 4 13
% within Q8Groups 14.1% 12.9% 13.7%
500 million Count 8 5 13
% within Q8Groups 12.5% 16.1% 13.7%
5 billion Count 3 3 6
% within Q8Groups 4.7% 9.7% 6.3%
I don't know Count 44 19 63
% within Q8Groups 68.8% 61.3% 66.3%
Total Count 64 31 95
% within Q8Groups 100.0% 100.0% 100.0%
Table 5: WSRT Sum of Ranks, DTR
Ranks
Do Not Take Responsibility N Mean Rank Sum of Ranks
Q14 - Q9 Negative Ranks 8 6.69 53.50
Positive Ranks 5 7.50 37.50
Ties 18
Total 31
Q15 - Q10 Negative Ranks 5 6.70 33.50
Positive Ranks 11 9.32 102.50
Ties 15
Total 31
Q16 - Q11 Negative Ranks 13 12.54 163.00
Positive Ranks 10 11.30 113.00

73
Ties 8
Total 31
Q17 - Q12 Negative Ranks 10 10.60 106.00
Positive Ranks 11 11.36 125.00
Ties 10
Total 31
Table 6: WSRT Test Statistics, DTR
Test Statistics
Q14 - Q9 Q15-Q10 Q16-Q11 Q17-Q12
Z -.575 -1.806 -.774 -.340
Asymp. Sig. (2-tailed) .565 .071 .439 .734
Table 7: WSRT Sum of Ranks, TR
Ranks
Take Responsibility N Mean Rank Sum of Ranks
Q14 - Q9 Negative Ranks 9 12.39 111.50
Positive Ranks 13 10.88 141.50
Ties 42
Total 64
Q15 - Q10 Negative Ranks 6 16.67 100.00
Positive Ranks 35 21.74 761.00
Ties 23
Total 64
Q16 - Q11 Negative Ranks 20 22.98 459.50
Positive Ranks 21 19.12 401.50
Ties 23
Total 64
Q17 - Q12 Negative Ranks 14 20.32 284.50
Positive Ranks 33 25.56 843.50
Ties 17
Total 64
Table 8: WSRT Test Statistics, TR
Test Statistics

74
Q14 - Q9 Q15-Q10 Q16-Q11 Q17-Q12
Z -.500 -4.313 -.381 -2.981
Asymp. Sig. (2-tailed) .617 .000 .703 .003

75
Appendix D: “Active” vs “Not Active”
Table 1: Crosstabes, Q8*Q6
Q8Groups * Q6Groups Crosstabulation
Q6 Groups
Total Yes No
Q8Groups Take Responsibility Count 47 17 64
% within Q6 78.3% 48.6% 67.4%
Do not take responsibility Count 13 18 31
% within Q6 21.7% 51.4% 32.6%
Total Count 60 35 95
% within Q6 100.0% 100.0% 100.0%
Table 2: MWU Ranks, AC vs NA
Ranks
Q6 Groups N Mean Rank Sum of Ranks
Q9 Active 60 52.32 3139.00
Not Active 35 40.60 1421.00
Total 95
Q10 Active 60 52.93 3176.00
Not Active 35 39.54 1384.00
Total 95
Q11 Active 60 54.37 3262.00
Not Active 35 37.09 1298.00
Total 95
Q12 Active 60 53.06 3183.50
Not Active 35 39.33 1376.50
Total 95
Table 3: MWU Test Statistics, AC vs NA
Test Statistics
Q14 - Q9 Q15-Q10 Q16-Q11 Q17-Q12
Z -2.314 -2.331 -3.032 -2.374
Asymp. Sig. (2-tailed) .021 .020 .002 .018

76
Table 4: WSRT Sum of Ranks, AC
Ranks
Active N Mean Rank Sum of Ranks
Q14 - Q9 Negative Ranks 8 9.63 77.00
Positive Ranks 12 11.08 133.00
Ties 40
Total 60
Q15 - Q10 Negative Ranks 7 11.43 80.00
Positive Ranks 29 20.21 586.00
Ties 24
Total 60
Q16 - Q11 Negative Ranks 17 20.79 353.50
Positive Ranks 19 16.45 312.50
Ties 24
Total 60
Q17 - Q12 Negative Ranks 14 20.75 290.50
Positive Ranks 28 21.88 612.50
Ties 18
Total 60
Table 5: WSRT Test Statistics, AC
Test Statisticsa
Q14 - Q9 Q15-Q10 Q16-Q11 Q17-Q12
Z -1.090 -4.007 -.327 -2.032
Asymp. Sig. (2-tailed) .276 .000 .743 .042
Table 6: WSRT Sum of Ranks, NA
Ranks
Not Active N Mean Rank Sum of Ranks
Q14 - Q9 Negative Ranks 9 8.67 78.00
Positive Ranks 6 7.00 42.00
Ties 20
Total 35
Q15 - Q10 Negative Ranks 3 9.33 28.00
Positive Ranks 17 10.71 182.00
Ties 15
Total 35

77
Q16 - Q11 Negative Ranks 16 14.38 230.00
Positive Ranks 11 13.45 148.00
Ties 8
Total 35
Q17 - Q12 Negative Ranks 10 11.65 116.50
Positive Ranks 16 14.66 234.50
Ties 9
Total 35
Table 7: WSRT Test Statistics, NA
Test Statisticsa
Q14 - Q9 Q15-Q10 Q16-Q11 Q17-Q12
Z -1.037 -2.901 -.996 -1.520
Asymp. Sig. (2-tailed) .300 .004 .319 .129
Table 8: Rank Counts, AC vs NA
Q14-Q9
Active Not Active Grand Total
TR DTR Total TR DTR Total
Tie 33 7 40 9 11 20 60
Neg 4 4 8 5 4 9 17
Pos 10 2 12 3 3 6 18
Grand Total 47 13 60 17 18 35 95
Q15-Q10
Active Not Active Grand Total
TR DTR Total TR DTR Total
Tie 17 7 24 7 8 15 39
Neg 4 3 7 1 2 3 10
Pos 26 3 29 9 8 17 46
Grand Total 47 13 60 17 18 35 95
Q16-Q11
Active Not Active Grand Total
TR DTR Total TR DTR Total
Tie 19 5 24 4 4 8 32

78
Neg 13 4 17 7 9 16 33
Pos 15 4 19 6 5 11 30
Grand Total 47 13 60 17 18 35 95
Q17-Q12
Active Not Active Grand Total
TR DTR Total TR DTR Total
Tie 14 4 18 3 6 9 27
Neg 10 4 14 4 6 10 24
Pos 23 5 28 10 6 16 44
Grand Total 47 13 60 17 18 35 95

79
Appendix E: Gender Table 1: MWU Ranks, Gender
Ranks
Gender N Mean Rank Sum of Ranks
Q9 Male 41 39.17 1606.00
Female 54 54.70 2954.00
Total 95
Q10 Male 41 48.56 1991.00
Female 54 47.57 2569.00
Total 95
Q11 Male 41 45.35 1859.50
Female 54 50.01 2700.50
Total 95
Q12 Male 41 46.44 1904.00
Female 54 49.19 2656.00
Total 95
Table 2: MWU Test Statistics, Gender
Test Statistics
Q9 Q10 Q11 Q12
Mann-Whitney U 745.000 1084.000 998.500 1043.000
Wilcoxon W 1606.000 2569.000 1859.500 1904.000
Z -3.150 -.176 -.839 -.488
Asymp. Sig. (2-tailed) .002 .860 .402 .626
Table 3: WSRT Sum of Ranks, Male
Ranks
Male N Mean Rank Sum of Ranks
Q14-Q9 Negative Ranks 10 9.30 93.00
Positive Ranks 8 9.75 78.00
Ties 23
Total 41
Q15-Q10 Negative Ranks 6 7.58 45.50
Positive Ranks 13 11.12 144.50
Ties 22

80
Total 41
Q16-Q11 Negative Ranks 19 14.37 273.00
Positive Ranks 9 14.78 133.00
Ties 13
Total 41
Q17-Q12 Negative Ranks 14 12.82 179.50
Positive Ranks 13 15.27 198.50
Ties 14
Total 41
Table 4: WSRT Test Statistics, Male
Test Statistics
Q14 - Q9 Q15 - Q10 Q16 - Q11 Q17 - Q12
Z -.334 -2.040 -1.606 -.233
Asymp. Sig. (2-tailed) .739 .041 .108 .816
Table 5: WSRT Sum of Ranks, Female
Ranks
Female N Mean Rank Sum of Ranks
Q14-Q9 Negative Ranks 7 9.43 66.00
Positive Ranks 10 8.70 87.00
Ties 37
Total 54
Q15-Q10 Negative Ranks 4 16.13 64.50
Positive Ranks 33 19.35 638.50
Ties 17
Total 54
Q16-Q11 Negative Ranks 14 20.86 292.00
Positive Ranks 21 16.10 338.00
Ties 19
Total 54
Q17-Q12 Negative Ranks 10 21.05 210.50
Positive Ranks 31 20.98 650.50
Ties 13
Total 54
Table 6: WSRT Test Statistics, Female

81
Test Statistics
Q14 - Q9 Q15 - Q10 Q16 - Q11 Q17 - Q12
Z -.513 -4.371 -.384 -2.872
Asymp. Sig. (2-tailed) .608 .000 .701 .004
Table 7: Rank Counts, Gender and TR/DTR
Q14-Q9
Male Female Grand Total
TR DTR Total TR DTR Total
Tie 13 10 23 29 8 37 60
Neg 4 6 10 5 2 7 17
Pos 6 2 8 7 3 10 18
Grand Total 23 18 41 41 13 54 95
Q15-Q10
Male Female Grand Total
TR DTR Total TR DTR Total
Tie 13 9 22 11 6 17 39
Neg 2 4 6 3 1 4 10
Pos 8 5 13 27 6 33 46
Grand Total 23 18 41 41 13 54 95
Q16-Q11
Male Female Grand Total
TR DTR Total TR DTR Total
Tie 8 5 13 15 4 19 32
Neg 8 11 19 12 2 14 33
Pos 7 2 9 14 7 21 30
Grand Total 23 18 41 41 13 54 95
Q17-Q12
Male Female Grand Total
TR DTR Total TR DTR Total
Tie 7 7 14 10 3 13 27
Neg 5 9 14 9 1 10 24
Pos 11 2 13 22 9 31 44

82
Grand Total 23 18 41 41 13 54 95
Table 8: WSRT Sum of Ranks, Male TR
Ranks
Male/Take Responsibility N Mean Rank Sum of Ranks
Q14-Q9 Negative Ranks 4 5.50 22.00
Positive Ranks 6 5.50 33.00
Ties 13
Total 23
Q15-Q10 Negative Ranks 2 3.50 7.00
Positive Ranks 8 6.00 48.00
Ties 13
Total 23
Q16-Q11 Negative Ranks 8 8.19 65.50
Positive Ranks 7 7.79 54.50
Ties 8
Total 23
Q17-Q12 Negative Ranks 5 8.10 40.50
Positive Ranks 11 8.68 95.50
Ties 7
Total 23
Table 9: WSRT Test Statistics, Male TR
Test Statistics
Q14 - Q9 Q15 - Q10 Q16 - Q11 Q17 - Q12
Z -.574 -2.139 -.316 -1.433
Asymp. Sig. (2-tailed) .566 .032 .752 .152
Table 10: WSRT Sum of Ranks, Male DTR
Ranks
Male/Do Not Take Responsibility N Mean Rank Sum of Ranks
Q14-Q9 Negative Ranks 6 4.33 26.00
Positive Ranks 2 5.00 10.00
Ties 10
Total 18
Q15-Q10 Negative Ranks 4 4.25 17.00

83
Positive Ranks 5 5.60 28.00
Ties 9
Total 18
Q16-Q11 Negative Ranks 11 6.55 72.00
Positive Ranks 2 9.50 19.00
Ties 5
Total 18
Q17-Q12 Negative Ranks 9 6.22 56.00
Positive Ranks 2 5.00 10.00
Ties 7
Total 18
Table 11: WSRT Test Statistics, Male DTR
Test Statistics
Q14 - Q9 Q15 - Q10 Q16 - Q11 Q17 - Q12
Z -1.137 -.666 -1.864 -2.178
Asymp. Sig. (2-tailed) .256 .506 .062 .029

84
Appendix F: Age Outputs
Table 1: Kruskal Wallis Ranks, Age
Ranks
Age N Mean Rank
Q9 18-29 23 50.30
30-44 19 53.92
45-60 19 50.00
>60 34 42.01
Total 95
Q10 18-29 23 42.76
30-44 19 51.16
45-60 19 50.37
>60 34 48.46
Total 95
Q11 18-29 23 52.22
30-44 19 51.61
45-60 19 44.21
>60 34 45.25
Total 95
Q12 18-29 23 44.78
30-44 19 49.84
45-60 19 52.16
>60 34 46.82
Total 95
Table 2: Kruskal Wallis Test Statistics, Age
Test Statistics
Q9 Q10 Q11 Q12
Chi-Square 3.674 1.281 1.652 .917
df 3 3 3 3
Asymp. Sig. .299 .734 .648 .821
Table 3: WSRT Sum of Ranks, 18-29
Ranks
Age: 18-29 N Mean Rank Sum of Ranks

85
Q14-Q9 Negative Ranks 5 4.40 22.00
Positive Ranks 2 3.00 6.00
Ties 16
Total 23
Q15-Q10 Negative Ranks 3 7.00 21.00
Positive Ranks 15 10.00 150.00
Ties 5
Total 23
Q16-Q11 Negative Ranks 12 11.29 135.50
Positive Ranks 6 5.92 35.50
Ties 5
Total 23
Q17-Q12 Negative Ranks 9 11.50 103.50
Positive Ranks 11 9.68 106.50
Ties 3
Total 23
Table 4: WSRT Test Statistics, 18-29
Test Statistics
Q14 - Q9 Q15 - Q10 Q16 - Q11 Q17 - Q12
Z -1.403 -2.836 -2.189 -.056
Asymp. Sig. (2-tailed) .161 .005 .029 .955
Table 5: WSRT Sum of Ranks, 30-44
Ranks
Age: 30-44 N Mean Rank Sum of Ranks
Q14-Q9 Negative Ranks 5 3.00 15.00
Positive Ranks 2 6.50 13.00
Ties 12
Total 19
Q15-Q10 Negative Ranks 1 5.50 5.50
Positive Ranks 7 4.36 30.50
Ties 11
Total 19
Q16-Q11 Negative Ranks 4 4.13 16.50

86
Positive Ranks 5 5.70 28.50
Ties 10
Total 19
Q17-Q12 Negative Ranks 4 3.75 15.00
Positive Ranks 6 6.67 40.00
Ties 9
Total 19
Table 6: WSRT Test Statistics, 30-44
Test Statistics
Q14-Q9 Q15-Q10 Q16-Q11 Q17-Q12
Z -.171 -1.774 -.718 -1.292
Asymp. Sig. (2-tailed) .865 .076 .473 .196
Table 7: WSRT Sum of Ranks, 45-60
Ranks
Age: 45-60 N Mean Rank Sum of Ranks
Q14-Q9 Negative Ranks 3 4.67 14.00
Positive Ranks 5 4.40 22.00
Ties 11
Total 19
Q15-Q10 Negative Ranks 3 3.67 11.00
Positive Ranks 8 6.88 55.00
Ties 8
Total 19
Q16-Q11 Negative Ranks 5 5.10 25.50
Positive Ranks 6 6.75 40.50
Ties 8
Total 19
Q17-Q12 Negative Ranks 5 4.80 24.00
Positive Ranks 8 8.38 67.00
Ties 6
Total 19
Table 8: WSRT Test Statistics, 45-60

87
Test Statistics
Q14 - Q9 Q15 - Q10 Q16 - Q11 Q17 - Q12
Z -.586 -1.972 -.679 -1.516
Asymp. Sig. (2-tailed) .558 .049 .497 .129
Table 9: WSRT Sum of Ranks, >60
Ranks
Age: >60 N Mean Rank Sum of Ranks
Q14-Q9 Negative Ranks 4 7.50 30.00
Positive Ranks 9 6.78 61.00
Ties 21
Total 34
Q15-Q10 Negative Ranks 3 7.17 21.50
Positive Ranks 16 10.53 168.50
Ties 15
Total 34
Q16-Q11 Negative Ranks 12 15.13 181.50
Positive Ranks 13 11.04 143.50
Ties 9
Total 34
Q17-Q12 Negative Ranks 6 12.50 75.00
Positive Ranks 19 13.16 250.00
Ties 9
Total 34
Table 10: WSRT Test Statistics, >60
Test Statistics
Q14-Q9 Q15-Q10 Q16-Q11 Q17-Q12
Z -1.113 -2.993 -.523 -2.389
Asymp. Sig. (2-tailed) .266 .003 .601 .017
Table 11: Crosstabs, Age*Q8
Age * Q8 Crosstabulation
Q8 Total

88
Take
Responsibility
Do not take
responsibility
Age 18-29 Count 18 5 23
% within Age 78.3% 21.7% 100.0%
30-44 Count 16 3 19
% within Age 84.2% 15.8% 100.0%
45-60 Count 11 8 19
% within Age 57.9% 42.1% 100.0%
>60 Count 19 15 34
% within Age 55.9% 44.1% 100.0%
Total Count 64 31 95
% within Age 67.4% 32.6% 100.0%
Table 12: Crosstabs, Age*Gender
Age * Gender Crosstabulation
Gender
Total Male Female
Age 18-29 Count 10 13 23
% within Age 43.5% 56.5% 100.0%
30-44 Count 8 11 19
% within Age 42.1% 57.9% 100.0%
45-60 Count 9 10 19
% within Age 47.4% 52.6% 100.0%
>60 Count 14 20 34
% within Age 41.2% 58.8% 100.0%
Total Count 41 54 95
% within Age 43.2% 56.8% 100.0%

89
Title: Awareness and Action: Coral Bleaching
Subtitle: Research study on changed behavior upon receiving information concerning coral bleaching effects
Linda Underwood
Subtitle: Research study on changed behavior upon receiving information concerning coral bleaching effects
MEGI

90