atomization and sprays, vol. 14, pp. 111-126, 2004ucanr.edu/sites/dcslaughter/files/199203.pdf ·...
TRANSCRIPT


/
Atomization and Sprays, vol. 14, pp. 111-126, 2004
LIQUID PROPERTY AND NOZZLE EFFECTS ON FLIGHT TIME OF PULSED JET SPRAY
D. K Giles, D. Downey, and D. C. Slaughter Biological and Agricultural Engineering Department, University of California-Davis, Davis, Calijo1·nia, USA
Tinuofflight ofspray dropletpaduts is an important design parameter in intermittent spraying when there is relative motion between the otomiur and the spray target. Flight times were meomred for j ets of various liquids, pulse durations, and norzlrs wed in roadside herbicide spraying. L iquids included suifoctants to enhance di!posit and po~vmers for stream containment. N ozzle orificr diameter, pulse duration, and liquid properties all hod highly significant effects on flight time. Flight time increased as initial jet velocity decreased. Time of flight decreaud with increasing mifou tension and decreased with addition of polymers. Flight time was highly related to suifau tension of the liquid. Tbis imp/in that jet break.up and subsequent drag on the droplet paclu/J is the predominant effect on flight. A simple parametric equation was developed to predict flight time .from known rdeou conditions, fluid propertifS, and 11orz/e-to-torget co1zjigu.ration.
INTRODUCTION AND PREVIOUS WORK
Roadside vegetation management is costly for highway maintenance departments. Recent work [1] has demonstrated a machine-vision-controlled sprayer to detect plant targets. When the detection system was coupled with an intermittent spray system, target-activated herbicide application was achieved. A weed-activated herbicide application system can significandy reduce herbicide use by applying material exclusi~ely to spray targets. Control of vegetation with herbicides is estimated to be at least 40o/o more efficient and costeffective than mechanical control such as mowing and other alternatives [1]. This previous work [1] used an image acquisition system with valve control events that were controlled by travel distance. In some tests, approximately 3o/o of the spray mixture was used when compared to conventional application methods; this represents significant reduction in chemical use and potential environmental contamination.
With target-detecting sprayers, design of liquid handling and nozzle emission are important since precise timing and accurate spray trajectories are required to maintain registration between the detected target location and the resulting spray deposit. In mobile applications such as roadside spraying, the spray system is mounted on a vehicle that is moving relative to the stationary target. Variability in spray trajectory would cause displacement between the target and the spray impact. Since mobile systems cannot easily have real-time feedback to confirm target deposition, errors would not be detected before loss of weed control. A companion study [2] to the work reported herein is extending previous work [1], to develop a specialized liquid handling system. The system will provide a constant pressure at the inlet of a noz7Je control valve to help maintain consistent jet conditions, regardless of the number of nozzles activated on a nozzle manifold and the corresponding flow rate through the liquid supply system.
Copyright © 2004 by Begell House, Inc. 111

112 D. K GILES ET AL.
NOMENCLATURE
D orifice diameter, mm L distance from nozzle to target, m Re Reynolds number(= UpD/~) t flight time, ms U steady-state velocity, m/s We Webernumber(a lJ2pD/cr) a fitted curve parameter for Eq. (1) J3 fitted curve parameter for Eq. (1) y fitted curve parameter for Eq. (1) 15 fitted curve parameter for Eq. (1) 9 release angle ( tan-1 0 = height of nozzle/horizontal
distance to target) 11 viscosity, Pas (kg/m s) p density, kg/m3
cr surface tension, N/m
When biological targets, such as weeds, are sprayed with biologically active materials such as herbicides, surfactants are often used to increase the surface area of deposition and to promote leaf uptake of the active ingredients. Additionally, liquid adjuvants such as long-chain polymers are often used to inhibit generation of small droplets that can be easily displaced by the wind.
The effect of drift control agents on volumetric droplet size spectra for simulated aircraft-mounted sprayers in wind tunnel trials has been reported [3]. Results showed that some polymer-based adjuvants significantly changed the droplet size spectra of the sprayed formulations. Comparison of the polymers with propanil (a herbicide) alone showed an increase in volume of large and small droplets in the droplet size distribution, indicating reduced coverage and increased spray drift. However, addi~n of polymer material to a liquid flowable formulation resulted in decreased volume of 5!nall droplets, while polymer addition to emulsifiable concentrate increased the volume ofl~ge droplets. Therefore, the performance of polymers for drift reduction is affected by other constituents in the spray mix. Similar results from other studies [ 4] indicated that polymer formulations did not reduce production of smaller drops even though there was a general upward shift in the entire droplet spectrum, indicating that drift losses can still occur. Additional work [ 4] indicated that stream lengths were less than those previously considered when using a polyacrylamide additive; the research concluded that the material tested may have contained other agents affecting rheological behavior.
Use of polyethylene oxide polymer can reduce liquid drag in piping systems [5], and can increase the distance of water travel from fire hose nozzles by up to 50% [ 6]. However, there appears to be a degradation effect over time once the polymer is in solution [5], and research indicates that material injected as a slurry with an appropriate size distribution of polymer particulates will allow a continuous release of the drag-reducing polymer into the flow stream in addition to decreasing power requirements as opposed to an aqueous mixture of polymer in solution.
Cylindrical liquid jets ejected will break up and produce droplets; eventually this production will lead to satellite droplets from the original trajectory stream (7, 8]. Infinite

LIQUID PROPERTY AND NOZZLE EFFECTS ON FLIGHT TIME 113
droplet streams have been shown to influence the immediate surroundings at least 15 diameters away from the original stream axis. The entrained air provides a viscous coupling that reduces effective drag on neighboring droplets [7]. Other research indicated that neighboring droplets affect drag and discussed the effect of subsequent collisions and coalescing of trailing drops [8]. Viscous coupling between spray droplets and ligaments produced from an unstable jet could alter the flight time of the spray mass.
OBJECTIVES
The goals of the work reported herein were to measure spray flight times and develop means for predicting flight times for typical right-of-way herbicide spray configurations and liquids that will be deployed with target-sensing control systems. As a practical design matter, the flight time values are required in order to control system timing so that targets are consistendy hit with emitted spray. The specific objectives were
1. To determine flight time for intermittent spray bursts emitted from typical, straight-stream nozzles using a parametric experiment with test factors of nozzle diameter, jet pulse duration, distance of travel, and liquid formulation
2. To quantify the effects of liquid formulation and nozzle geometry on flight times, and develop predictive equations to describe flight times for given configurations and liquids within the range tested in the experiment
EXPERIMENTAL DESIGN AND METHODS
The parametric experiment was conducted as a factorial design with the test factors of: liquid formulation, nozzle diameter, jet pulse duration, travel distance, and combinations of nozzle height and horizontal distance to target. Six test fluids were used; fluid properties are shown in Table 1. Municipal water was the solvent for all·test fluids. Typical ranges of physical parameters for the municipal water were a temperature range of 19-23·c, pH range of 7.6-8.4, and hardness range of 70-590 (ppm as CaC03). Two types of fluid adjuvants, namely, one surfactant and two polymers, were used. As polymers can degrade over long periods of time and due to elevated temperatures, all fluids during the tests were used within 1-2 h of makeup. The surfactant was an organofunctional, nonionic silicone (Silwet-L77, Loveland Industries, Inc., Greely, CO) added at a rate of0.125% v/v. The
Table 1 Liquid Properties for Liquid Solutions Used in the Experiment'
Fluid additive
None Surfactant 0.125% Polyacrylamide 0.01% Polyethylene oxide 0.01% Surfactant+ polyacrylamide Surfactant + polyethylene oxide
Density (kglm3)
998.2 997.1 999.9 975.9 998.5 965.7
• Solvent was municipal tap water.
Viscosity (Pa·s)
l.OOE-03 1.02E-03 1.36E-03 1.09E-Q3 1.37E-03 1.02E-Q3
Surface tension (N/m)
0.0728 0.0284 0.0479 0.0568 0.0264 0.0259
114 D. K. GILES ET AL.
polymers were a polyetheleyne oxide (Polyox, Amerchol Corp., Edison, NJ) and a polyacrylamide (Target LC, Loveland Industries, Greely, CO), both added at a rate of0.01% w/w. Preliminary results for this research showed that a rate of0.1% w/w polymer caused Rayleigh flow for the spray conditions reported here as opposed to cylindrical spray stream trajectories. This effect has been reported elsewhere [5]. The fluids were selected to test the effects of surfactant and polymers individually and in combination. Liquid properties were measured with a specific-gravity scale (model S-101, Troemner, Inc.) for density, a Ubbelohde tube (model OC, Cannon Instrument Co.) for viscosity, and a surface tensiometer (Surface Tensiomat model 21, Fisher Scientific) for surface tension. The effects of adjuvants on the fluid properties were as expected. Addition of the surfactant reduced surface tension to the range of0.028 N/m and had no effect on viscosity; these effects were virtually unaffected by presence of either polymer. Addition of the polyacrylamide polymer (TLC) increased viscosity of the fluid by 37%, regardless of the presence of surfactant. In the absence of surfactant, addition of the polyetheleyne oxide (PEO) or polyacrylamide polymer reduced the surface tension to 0.057 and 0.048 N/m, respectively.
The three test nozzles were commercial, straight-stream nozzles (Nos. SS0005, SS0010, and SS0015, Spraying Systems Co., Wheaton, IL) with orifice diameters of 1.55, 2.18, and 2.72 mm, respectively, and flow ratings of 1.89, 3.79, and 5.68 L/min, respectively, at 275 kPa liquid pressure. Each nozzle was installed along with a commercial flow straightener (SS-1/4x1/4, Spraying Systems Co.) immediately upstream of the nozzle. Liquid flow into the nozzle/straightener assembly was controlled by a three-way, electrically actuated, 12-Vdc, 10-W solenoid valve (model651064, KIP, Inc., Farmington, CT). The normal (spring) position of the valve routed liquid from the inlet to a bypass line. When actuated, the valve diverted flow from the bypass line to the nozzle. When installed on the mobile vehicle, the bypass line returns liquid to the supply tank and the nozzle actuation from a manifold of nozzles has little effect on system pressure [2]. In these experiments the bypass line was closed, since only one nozzle was actuated at any time. Pulse durations were controlled by a square-valve pulse generator consisting of a digital timing circuit and a field-effect transistor driver with diode suppression of inductive flyback from the valve coil. Pulse durations of 30 and 60 IJ\s were used.
Liquid was supplied to the valve inlet at a pressure bf 550 kPa, representing the pressure commonly maintained on the mobile spray vehicle liquid system. Since the pressure control system on the mobile vehicle is configured to maintain pressure on a liquid supply manifold rather than the actual pressure at the nozzle inlet, the experiments were conducted in that manner. This design functionally treated the valve/flow straightener/ nozzle assembly as a single unit. Since the solenoid valve and the flow straightener constituted a structure creating a pressure drop upstream of the nozzle, the actual pressure at the nozzle inlet was measured with steady-state tests prior to the time-of-flight experiments. As expected, actual inlet pressure at the nozzle decreased as flow capacity of the nozzle, and correspondingly, the flow through the valve, increased. With the 550-kPa valve inlet pressure, the observed pressures at the nozzle inlet were 448, 304, and 207 kPa for the 0005, 0010, and 0015 nozzles, respectively. Pressure drop across the valve was virtually independent of liquid properties. Steady-state flow rates of each liquid from each nozzle were measured by measuring nozzle discharge for a 1-s burst. From the steady-state measurements and nozzle exit area, steady-state velocities were calculated. These results are presented in Table 2, along with corresponding Reynolds and Weber numbers based on the measured liquid properties in Table 1.

LIQUID PROPERTY AND NOZZLE EFFECTS ON FLIGHT TIME 115
Table2 Steady-State Velocity, Reynolds Number, and Weber Number of the Emitted Jet for Different Orifice Diameters and Liquid Formulations at 550 kPa
1.55-mm diameter 2.18-mm di>meter 2. 72-mm di>meter
u u u F1uid (mls) Reno. We no. (mls) Reno. We no. (mls) Reno. We no.
1 Water 21.9 33,884 10,193 17.7 38,517 9,365 14.2 38,554 7,520 2 Surf:tctant 0.125% 22.5 34,092 27,550 18.0 38,572 25,075 14.4 38,289 19,802 3 Polyacrylamide 0.01% 19.9 22,678 12,813 16.7 26,766 12,691 12.9 25,797 9,449 4 Polyethylene oxide 0.01% 21.7 30,114 12,540 17.3 33,961 11,340 13.8 33,607 8,900 5 Surfactant + polyac<ylamide 19.9 22,481 23,216 15.0 23,992 18,800 13.4 26,366 18,198 6 Surf.~ctant + polyethylene oxide 19.9 29,203 22,887 15.0 31,785 19,277 13.0 33,220 16,877
Right-of-way spraying from a moving vehicle is typically done with nozzles mounted on a vertical column and directed outward such that flow from each nozzle sprays a band parallel to the direction of travel. Bands nearest the vehicle are sprayed by nozzles low on the column, while the farthest bands outward from the vehicle are sprayed by the uppermost noz7Jes on the column. Therefore, the greatest travel distance for spray is for the outward band sprayed by the uppermost nozzle, while the least travel distance corresponds to the nearest band sprayed by the lowest nozzle on the column. For this experiment, extreme and midpoint conditions for vertical nozzle positions and horizontal target distances outward were selected from the actual vehicle configuration for which the system was designed (Table 3). Nozzle heights of 1.54, 1.92, and 2.30 m and horizontal target distances (from the nozzle exit) of 0.50, 1.83, and 3.66 m were used. The experimental design tested five conditions, the combinations of 1.54- and 2.30-m nozzle heights with 0.50- and 3.66-m target distances, and the single, mid-range combination of 1.93-m height and 1.83-m target distance.
For each test configuration, the nozzle was positioned at the test height above ground and aimed to strike a target at the test distance horizontally outward at ground level. The target deposition was modeled as a thin, flat stainless steel plate cantilevered on a small floor support. The flex of the plate provided displacement when the spray liquid struck the plate. An accelerometer (model 353B65, PCB Piezotronics, Inc,Y~was mounted on the cantilevered target plate. An optical passage sensor (model PG-602, Keyence Corp.) was placed at the exit of the nozzle orifice. Response times of both sensors were < 0.5 ms, sufficiently small in relation to the measured flight times. Analog voltage outputs from the optical sensor and accelerometer were monitored on separate channels of an oscilloscope (model TDS 3012B, Tektronix, Inc.). Liquid passage through the optical sensor triggered the oscilloscope sweep of both channels. Activation of the nozzle enabled the optical sensor
Table 3 Nozzle Height, Nozzle Horizontal Distance from Target, Release Angle of Fluid, and Vector Travel Distance of Fluid to Target for Experimental Tests
Height Horiz. distance Release angle• Travel distance Position (m) (m) (deg) (m)
1 1.54 0.50 17.9 1.62
2 1.54 3.66 67.2 3.97
3 1.92 1.83 43.6 2.65 4 2.30 0.50 12.3 2.35
5 2.30 3.66 57.9 4.32
. Calculated as 90" - tan-1 (nozzle height/horizontal distance to target) .

116 D. K. GILES ET AL.
signal to be measured on one channel of the oscilloscope as the initial portion of the jet trajectory was ejected from the nozzle orifice. The accelerometer signal from the spray stream impaction onto the stainless steel plate was obtained on a separate channel of the oscilloscope. The oscilloscope programming capabilities allowed the time between liquid ejection from the nozzle and spray stream impaction onto the stainless steel plate to be measured from the rising edge of signal signatures on the separate channels. A typical example of the oscilloscope output is given in Fig. 1. Each test condition (nozzle-to-target position, pulse time, nozzle diameter, and liquid) was replicated four times.
Photographic images of an exiting cylindrical jet of water are shown in Fig. 2. The initial profile of the exiting stream is obseiVed to have an annulus of laminar flow surrounding the turbulent core, preventing particles in the core from disrupting the jet surface. This type of effect has been described elsewhere [9]. Farther downstream the faster turbulent core breaks through the outer protective laminar annulus [9] and begins to disintegrate as well as produce satellite droplets along the cylindrical jet stream. After several hundred diameters downstream of the nozzle exit, the cylindrical jet has completely disintegrated.
RESULTS AND DISCUSSION
The initial data analysis procedure was a straightforward analysis of variance (ANOVA) that followed the factorial experimental design. Since flight time was obviously dependent
ij Measured flight tine. ms
' ·t· · + • t :
~------------------+··~· r·~ - .. .. .. .. ....... .. . . :f: :
. ' i' I
+ • +·
., I
I :
• • • • •• 0 • • • • • •• ·t··: ...... . . t• ·t·'
• ~ • • • 0 • • • • • • ·-
. .; .
·I· ' . . . . ! I .. . I . . . . I· . . ·! · • • · i •
AI Ch 1 f 308mVI
A : 0.00 V ®: -8. 00mV
A: 34.0ms ®: 382ms
Ch1-+Ch2ff-t 469.0ms
Fig. 1 T ypical time of flight generated results from oscilloscope for one replicate of surfactant (0.125%) and polyacrylamide (0.01%) formulation at 550 kPa and 30-ms pulse duration. Signal no. 1 (upper trace) is from the passage detector; signal no. 2 (lower trace) is from the impact plate accelerometer. T ime scale is 100 ms/di,~sion.

LIQUID PROPERTY AND NOZZLE EFFECfS ON FLIGHT TIME 117
A
B
c
D
Fig. 2 Sequential images of water exiting nozzle, where (A) shows an annulus of laminar flow surrounding the tmbulent core, (B) shows effects after the turbulent core breaks through the outer laminar layer, (C) shows the beginning of fluid front disintegration, and (D) shows complete disintegration several hundred nozzle diameters downstream of the nozzle exit.

118 D. K. GILES ET AL.
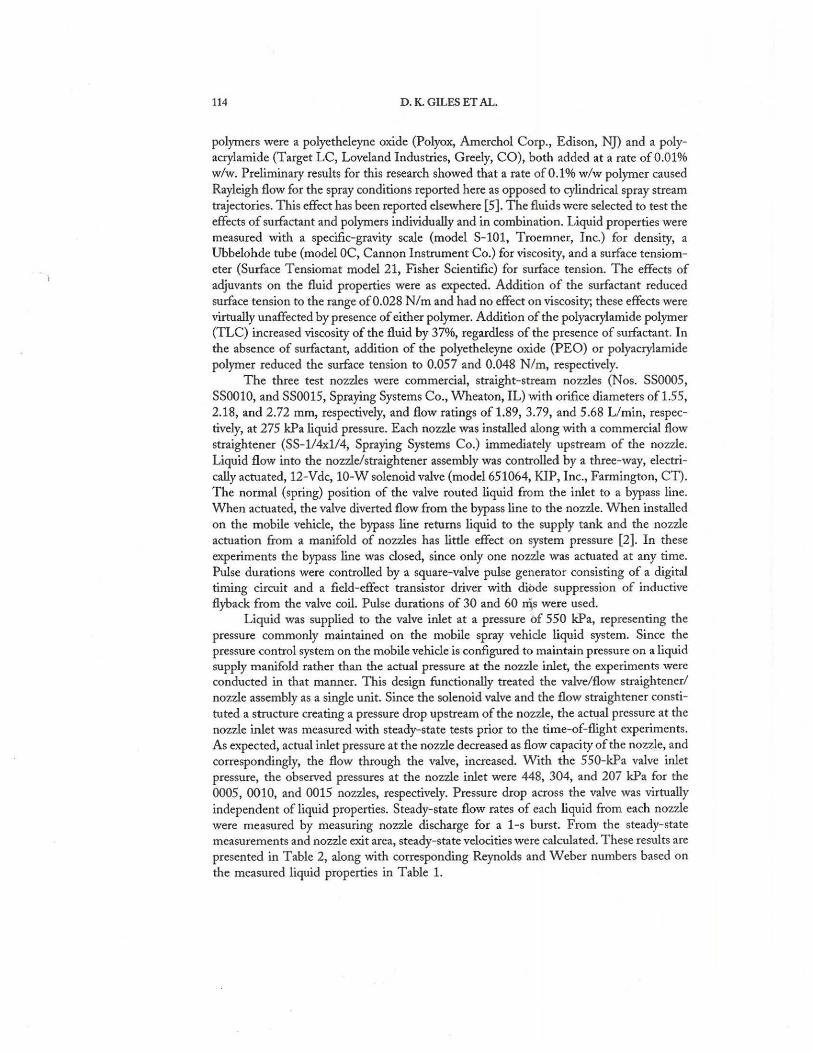
on travel distance, the ANOV A was conducted for each of the five nozzle-to-target configurations. The analysis found that nozzle diameter, fluid, and' pulse time (only at the greatest distance) were all significant (a < 0.05) factors on flight time. The results are shown in Table 4. At each position, the effect of nozzle and fluid was highly significant. The effect of pulse time was relatively minor, as were interactions between pulse time and nozzles or fluid. Since position, nozzle diameter, and test fluid had significant effects on flight time, a tabular presentation of the flight times and standard deviations for each distinct condition are shown in Table 5. Mean flight times ranged from 75 ms at the shortest travel distance to 475 ms at the longest travel distance. These times, in relation to the 10-Hz current operation rate of the target-sensing sprayer, are substantial and confirm that spray flight time and the associated influences of liquid formulation and nozzle geometry are significant process control variables.
The results also indicted that fluid effects are more significant with the larger nozzle orifice diameters and as the total travel distance increased. The general trend was that the solutions with lower surface tension, i.e., the surfactant solution, the surfactant +
polyacrylimide, and the surfactant + polyethelyene oxide, produced longer flight times. However, when compared to solution of surfactant alone, addition of the polyacrlymide and polyethelyene oxide polymers to the surfactant solution reduced the flight times.
The observed results provided the expected flight times for the tested configurations, while the analysis of variance was useful in quantifYing the relative influence of the experimental factors on flight time. However, of greater utility for system design is the ability to predict flight times for various configurations, liquids, and nozzles. Accurate flight-time predictions would facilitate system improvements and reduce tuning and software configuration effort. Additionally, real-time, adaptive control algorithms could use on-board computation of flight times in adapting the system operations to changes in ground speed, nozzle orientations, and target locations.
The observed test data were used to develop predictive equations for flight time. A number of candidate forms of predictive equations were evaluated. The most useful form found was .. :
(1)
where
t = flight time, ms
U = nozzle exit velocity (steady-state velocity), m/s
e = release angle, degrees
L = travel distance from nozzle to target, m
a, p, y, o = fitted curve parameters.
Conceptually, this product string formulation was logical, as it allowed the U term to account for the release conditions, reduced to only the initial velocity, while the trigonometric function tan(9) and L terms accounted for the nozzle-to-target geometry. In an

Table4 Results from Analysis of Variance for Flight Time as Affected by the Factors of Nozzle, Fluid, Pulse Time, and All Interactions•
Position 1 Position 2 Position 3 Position4 Position 5
Test factor F p >F F p>F F p>F F p>F F p>F
Nozzle 1259.4 <0.001 107.0 <0.001 1147.7 <0.001 1762.3 <0.001 43.3 <0.001
Fluid 8.43 0.004 38.6 <0.001 22.2 <0.001 21.1 <0.001 54.8 <0.001
Pulse time 0.12 0.728 0.25 0.617 1.39 0.240 0.02 0.894 5.02 0.027
Nozzle x fluid 6.85 0.010 1.98 0.167 11.3 0.001 32.4 <0.001 0.80 0.373
Nozzle x pulse 3.55 0.062 0.03 0.874 0.33 0.570 0.05 0.819 0.06 0.809
Fluid x pulse 1.05 0.308 O.Ql 0.968 1.44 0.232 4.19 0.043 1.56 0.213
Nozzle x fluid x pulse 4.04 O.<T4i '· 0.02 0.892 0.03 0.857 0.02 0.879 0.14 0.707
• Each parametric condiction was replicated four times.
1:""'
~ t:1 '"C:l
~ ~
~ ~ z 0 N
~ tt1 tt1 ..,., ..,.,
~ ;;s c z ..,., r Q -~ :l :s: tt1
..... ..... -c
.... N Q
Table 5 Mean Flight Times (in ms, with standard deviations in earentheses) by Position, Nozzle Orifice Diameter, and Fluid•
Position 1 Position2 Position 3 Position4 PositionS 1.54 m x 0.50 m 1.54 m x 3.66 m 1.92 m x 1.83 m 2.30 m x 0.50 m 2.30 m x 3.66 m
1.55 2.18 2.72 1.55 2.18 2.72 1.55 2.18 2.72 1.55 2.18 2.72 1.55 2.18 2.72 Fluid (orifice diam., nun) (orifice diam., nun) (orifice diam., mm) (orifice diam., nun) (orifice diam., mm)
1 76.7 87.7 107.7 260.7 278.7 327 147.3 165.7 188 106.8 130.7 152.6 322.1 311.7 359.7 (2.2) (20.5) (4.4) (8.4) (8.0) (9.0) (3.3) (5.4) (3.5) (2.6) (3.6) (2.0) (30.2) (7.5) (7.7)
2 76.8 93.8 112.1 338.7 330.8 413.9 152.2 172.6 201 127.6 134.5 156.6 396 400.4 464.7 (2.8) (6.6) (4.9) (11.4) (13.1) (11.4) (4.9) (3.8) (6.4) (3.6) (5.3) (3.5) (16.0) (11.1) (54.5) ~
r 3 80.6 94.1 112.5 257.2 273.1 323.7 144.6 159.8 191.3 109.5 129.1 157.4 319.5 326 374.2 C) ......
(3.6) (3.1) (4.1) (8.4) (3.5) (14.7) (5.4) (2.5) (5.0) (2.9) (1.9) (1.6) (10.5) (7.6) (17.0) r t"'1 Ul
4 74.2 87.3 108.3 253.8 287.6 332.8 140.2 171.1 192.6 108.4 131.9 159.8 314 339.8 361.2 t-::1 ....,
(1.0) (2.2) (6.1) (7.2) (3.9) (8.9) (5.4) (7.9) (2.67) (2.1) (1.4) (2.3) (10.2) (10.8) (8.7) ~ r-'
5 76.7 98.1 119.1 328.4 357.5 416.1 152.2 170.2 204.4 114 138 167.5 394.6 433.5 462.6 (2.6) (1.9) (2.3) (9.1) (6.7) (13.4) (4.4) (4.5) (8.4) (3.7) (2.7) (5.0) (14.2) (15.1) (10.0)
6 76.4 93.7 113.4 327.8 :l34 · .. 428.3 147.6 180.6 205.3 110.5 136.9 167.2 405 422.4 476.8 (3.4) (5.7) (7.1) (11.3) (11.7) (12.0) (5.5) (6.7) (8.3) (2.6) (4.0) (4.2) (11.6) (16.2) (16.2)
F,,.1 0.8 5.06 7.45 7.54 19.42 17.91 0.02 12.64 18.44 1.04 14.05 108 12.96 34.31 14.51 p>F 0.47 0.03 O.Ql 0 .01 0.001 0.001 0.88 0.01 0.001 0 .31 0.001 0.001 0.001 0.001 0.001
' F and p values shown in bottom row are for fluid effects blocked within position and nozzle orifice diameter.

LIQUID PROPERTY AND NOZZLE EFFECTS ON FLIGHT TIME 121
ideal system with no gravity or drag effects, curve parameters would be a = 1, 13 = -1, y = 0, and 8 = 1. Equation (1) was useful in that all tested nozzles could be pooled, since only the initial velocity was needed. Additionally, this would allow a priori system design in that nozzle exit velocity can be predicted from the volumetric flow rate and the orifice diameter.
Equation (1) was fitted to the observed data for each liquid after data for 30- and 60-ms pulse rimes and the three test nozzles were pooled. Individual equations were fitted for each test liquid, since the equation did not have any terms accounting for formulation effects. It was hypothesized that the resulting least-squares parameter estimates would reveal the effects of fluid properties. Resulting parameter estimates are shown in Table 6. Each fitted equation was based on 120 observations and had 119 corrected total degrees of freedom and 4 regression degrees of freedom. F values are shown for each curve; in all cases the p > F was < 0.001.
The fitted equations closely predicted the flight times of jet pulses from the tested nozzles and fluids and the test configurations (Figs. 3 and 4). Inspection of the results in Table 6 revealed that the flight times were generally proportional to the inverse square root of initial jet velocity; estimates of the 13 parameter ranged from -0.4530 to -Q.5281. The 8 value indicates sensitivity of flight time to increasing flight distance; a strong inverse relationship was observed when surface tension was considered. Data for water, with the highest surface tension (0.0728 N/m), produced a 0 estimate of 1.329. The polyethylene oxide and polyacrylamide solutions without surfactant and with surface tensions of0.0568 and 0.0479 N/m, respectively, had o estimates of 1.379 and 1.395, respectively. The test fluids with surfactants, with surface tensions of 0.0284, 0.0264, and 0.0259 N/ m, had 8 estimates of 1.654, 1.6 73, and 1. 720, respectively.
The general trends were intuitively consistent with expected results. As initial velocity increases, flight time decreases, although this relationship is nonlinear because of drag effects. As surface tension decreases, the jet was more likely to disintegrate, especially
Table6 Least-Squares Parameter Estimates with Standard Errors for Spray F1ightTimes as Predicted by Eq. (1) for the Six Test Fluids
(J. p 'Y 0 Fluid (s.e.) (s.e.) (s.e.) (s.e.) F,,m
1 169.1 -0.4541 -0.0233 1.329 7,630 (17.62) (0.0326) (0.0124) (0.0387)
2 135.4 -0.453 -0.0142 1.6538 4,833 (17.87) (0.0399) (0.0169) (0.0532)
3 180.6 -0.5167 0 .0023 1.3947 9,015 (16.64) (0.0294) (0.0113) (0.0358)
4 185.4 -0.506 -0.0086 1.3789 12,391 (14.64) (0.0246) (0.0097) (0.0306)
5 155.4 -0.5259 -0.0123 1.673 7,922 (17.19) (0.0356) (0.0132) (0.0417)
6 146.8 -0.5281 -0.0024 1.7195 5,272 (18.88) (0.0409) (0.0162) (0.0516)

122 D. K. GILES ET AL.
500 1.27 mm dia.; o obseMJd, Eqn. 1
Cl) 400 2.18 mm dia.; • obseMJd, Eqn. 1 E ..:
2.72 mm dia.; 6 obsel\llld, Eqn. 1 Q)
1 300
A £ Q)
~ :E 200 .Q> ;;:: '0 ·:; u:: 100
0
0 2 3 4 5 Fluid trawl dis lance, m
500 1.27 mm dia.; 0 obsel\llld,- Eqn. 1
Cl) 2.18 mm dia.; I obserwd . ...... Eqn. 1 E 400
~ 2.72 mm dia.; • obserwd, - - Eqn. 1 ti
"' t 300 " B Cl)
£ Q)
,§ 200 E ~ '0 100 ·:; u:
0
0 2 3 .... ~ 4 5 Fluid trawl distance, m
500 1.27 mm dia.; o obseMJd, - Eqn. 1
Cl)
E
~ 400 2.18 mm dia.; I obseMJd, ...... Eqn. 1
.E "' 2.72 mm dia.; • obsel\llld,- - Eqn. 1 ~ 0
c "' 300 -
~ £ Q)
,§ 200
E ~ '0
100 ·:; u:
0
0 2 3 4 5 Fluid trawl distance. m
Fig. 3 Observed and predicted flight times using Eq. (1) for water (A), sur£'lctant (B), and polyacrylamide (C) for
each nozzle size and spray travel distance.

A
B
c
LIQUID PROPERTY AND NOZZLE EFFECTS ON FLIGHT TIME
en 500 E .; :!2 )( 0 400 ., c: ., a; ~ 300 a; >.
& .E 200 ., §
~ 100 "0 ·s u::
0
0
500
1.27 mm dia.; o obserwd, - Eqn.
2.18 mm dia.; 1 observed, ...... Eqn.
2.72 mm dia; " obserwd,- - Eqn. 1 L ...a ,.....~r_ ·n
......
2
...... . . ...... . . " .. . ..
3 Fluid trawl distance. m
1.27 mm dia; o observed, - Eqn. 1
4
+ 2.18 mm dia. ; 1 observed, ...... Eqn. 1 ~ 400
u en 2.72 mm dia.; " observed, -- Eqn. 1 {gE ~ ;300 ~-o
E '~ ~2-= g200 .C:>.
~8. ., ·s u:: 100
0
0 2 3 . Fluid trawl distanc~~ m
4
500 1.27 mm dla; o obserwd, - Eqn. 1
400 2.18 mm dia.; 1 observed . ...... Eqn. 1
+ 2. 72 mm dia; " obserwd, - - Eqn. 1
~ en300 g E
"§-8 r§200 ., .§ .c 100 ~ "0 ·s
5
5
u:: 0 +----~-----,-----,-----· r- - -----,
0 2 3 4 5 Fluid trawl distance, m
123
Fig. 4 Observed and predicted flight time using Eq. (1) for polyethylene oxide (A), surfactant+ polyacrylamide (B), and surfactant+ polyethylene oxide (C) for each nozzle size and spray travel distance.

124 D. K GILES ET AL.
with increasing flight distance. As the jet disintegrates into smaller ligaments and droplet packets, relative drag increases and reduces the bulk velocity of the jet, resulting in longer flight times.
The results suggested that the six test fluids could possibly be considered as two fluids, viz., a high-surface-tension fluid and a low-surface-tension fluid. For analysis, water, water + polyacrylamide, and water + polyethelyene oxide solutions were pooled as one fluid type, and the water + surfactant, water + surfactant + polyacrylamide, and water + surfactant+ polyethelyene oxide solutions were pooled as the other fluid type. Effectively, this partitioning of fluids combined liquids with surface tension values of 0.0259 to 0.0284 N/m into a low-surface-tension group and liquids with surface tensions from 0.0479 to 0.0728 N/m into a high-surface-tension group.
Equation (1) was fitted to the two liquid groups; resulting parameter estimates and standard errors are shown in Table 7. The results show that the o exponent is significantly greater with the low-surface-tension group, confirming that the reduced surface tension results in greater deceleration of the jet. While the a parameter is greater for the highsurface-tension fluid, the effect of the higher 0 predominates the relationship between nozzle-to-target distance and flight time. This can be illustrated by considering the partial derivative of flight time with respect to distance from Eq. (1). Considering a typical configuration with experimental conditions of U = 17.0 m/s, tan(9) = 3.0, and distance= 3.0 m, the resulting numerical values for a(time)/o(distance) = 89 and 124 ms/m for the high-surface-tension and the low-surface-tension fluids, respectively.
The utility of Eq. (1) with the least-squares parameter estimates of Table 7 was further investigated by comparing the flight times predicted by the equation with the experimentally observed values for the entire experimental data set. For the high-surfacetension liquids, the average difference between observed and predicted flight times was 0.182 ms (std. dev. = 13.15) and the maximum differences were -33.9 and +72.4 ms. For low-surface-tension liquids, the average difference between observed and predicted flight times was 0.821 ms (std. dev. = 20.38) and the maximum differences were -63.9 and +82. 9 ms. Differences between the observed and the predicted flight times for the two liquid types, versus the observed flight times, are shown in Fig. 5,
The fitted equations provide a useful a priori estimate of spray flight time that could be used in process control algorithms where timing of intermittent spray release is critical. Once a nozzle is installed, the nozzle-to-target configuration defined, and the fluid type (high or low surface tension) determined, the flight times can be estimated. All these input conditions are known prior to sprayer operation in roadside spraying. While this experiment did not consider the practical case where the nozzle is in motion and there is
Table7 Parameter Estimates with Standard Errors for Spray Flight Times as Predicted by Eq. (1) for the Two Groups ofT est Fluids
a. p y I)
Surface tension (N/m) {s.e.) (s.e.) {s.e.) {s.e.) F4,JS9
High surface tension, 170.7 -0.4771 -0.0095 1.3684 25,971 0.0479 < cr < 0.0728 {9.25) {0.0170) {0.0067) {0.0211)
Low surface tension, 129.9 -0.4614 -0.0095 1.6838 16,212 0.0259 < (1 < 0.0284 {9.19) (0.0219) (0.0092) (0.0292)

I
LIQUID PROPERTY AND NOZZLE EFFECTS ON FLIGHT TIME 125
Q) c Q) ;;. s: Qj >- 500 0 Cl.
~ ~ 400 e .. ~
A :6 C/)
>-E 8..,; 300 _, CD ·x ~ 0
~ Q)
,g 200
:;: ~ i 100 :2 ~ Cl.
0 0 100 200 300 400 500 600
Observed flight time, ms
600 -.---- - - ----- - ----- -, !6 ~ ~ 500 ~ u ., :::-"' 8.E +.g 400 · ~ ·;;c - 0
a! "' B '§~
C/) >-...: ~ 300 !6 >-~8. -.:: +
:ra o- 200 - u Q) ..
E5 = CIJ
:;: ~
100 al t)
i Cl.
0 0 100 200 300 400 500 600
Observed flight time, ms
Fig. 5 Observed and predicted flight times for all fluids and conditions: (A) shows results for water, polyacrylamide, and polyethylene oxide; (B) shows results for surfactant, surfactant + polyacrylamide, and surfactant+ polyethylene oxide.
126 D. K. GILES ET AL.
aerodynamic drag normal to the jet motion, the results provide a useful initial estimate from which the operating system can be tuned based on observed performance.
CONCLUSIONS
Flight times for pulsed jets from straight-stream nozzles were electronically measured using an optical detector and an impact plate. Jet diameters of 1.5-2.7 mm and jet velocities of 13- 22 m/s were created for pulse durations of30 and 60 ms. Flight distances ranged from 1.6 to 4.3 m. For the nozzle, fluid, and nozzle-to-target geometries tested in this experiment, the flight times ranged from 75 to 475 ms. These times represent substantial periods for designing process control of automated intermittent spraying with relative motion between the nozzle and the target. Flight time was significandy affected by initial jet velocity, relative angle of jet release with respect to gravity, and the surface tension of the liquid. A simple, product-string model was developed to predict flight time from the jet initial velocity, the angle of release, the nozzle-to-target distance, and the liquid surface tension. While the best predictions resulted from fitting an equation for each tested fluid, prediction equations developed for high- versus low-surface-tension fluids were comparably accurate for prediction. The predictive equations were simple enough to be implemented in a real-time process controller where the user need enter only the spray configuration, fluid type, and nozzle characteristics of diameter and volumetric flow rate.
REFERENCES
1. D. C . Slaughter, D. K. Giles, and C. Tauzer, Precision Offset Spray System for Roadway Shoulder Weed Control, J Transp. Eng., vol. 125, pp. 364-371, 1999.
2. K. P. Gillis, D. K. Giles, D. C. Slaughter, and D. Downey, InJection Mixing System for Boomless, Target-Activated Herbicide Spraying, Tram. ASAE, vol. 46, pp. 997-1008, 2003.
3. M.A. Apodaca, R. Sanderson, E. W . Huddleston, D. L. Clason,A.J.Hewitt, T . M. Ledson, ]. B. Ross, and M. Ortiz, Drift Control Polymers and Formulation !ype Affect Volumetric Droplet Size Spectra ofPropanil Sprays,] Environ. Sci. Health B, vol. 31, pp. 859--870, 1996.
4. N. B. Akesson, W . E. Steinke, and W. E. Yates, Spray Atomization Characteristics as a Function of Pesticide Formulations and Atomizer Design, J Environ. Sci. Health B, vol. 29, pp. 785-814, 1994.
5. R. L ittle, S. Smidt, P. Huang, J. Romans, J. Dedrick, and J. S. Matuszko, Improved Drag Reduction by Control of Polymer Particle Size, Ind. Eng. Chern. Res., vol. 30, pp. 403-407, 1991.
6. H . F. Mark, M . Grayson, and D. Eckroth (eds.), Encyclopedia of Chemical Technology, 3d ed., vol. 19, p. 716, Wiley, New York, NY, 1978.
7. C. S. Connon and D. Dunn-Rankin, Flow Behavior near an Infinite Droplet Stream, Exp . .Fluids, vol. 21, pp. 80-86, 1996.
8. Q V. Nguyen, R. H . Rangel, and D. Dunn-Rankin, Measurement and Prediction of Trajectories and Collision of Droplets, Int.] Multiphase Flow, vol. 17, pp. 159-177, 1991.
9. A. H. Lefebvre, Atomization and Spmys, chap. 2, Hemisphere, New York, NY, 1989.

/
'
CONTENTS
93 Pulsed-Jet Microspray Applications for High Spatial Resolution of Deposition on Biological Targets D. Downey, D. K. Giles, & D. C. Slaughter
111 Liquid Property and Nozzle Effects on Flight Time of Pulsed Jet Spray D. K. Giles, D. Downey, & D. C. Slaughter
127 Design Issues Concerning Charge Injection Atomizers & A. J. Yule
J. S. Shrimpton
143 Accuracy Evaluation of Improvements to the Madejski Splat-Quench Solidification Model Salvador M. Aceves, Joel Martinez-Frias, & Vivek Sahai
159 Spray and Flow-Field Interaction of Gasoline Direct Injection Jaejoon Choi, Seokhwan Lee, & Choongsik Bae
175 Change of Atomization Performance With Selection of Nozzle Materials in Electrohydrodynamic Spraying Myoung Chan Kim, Sang Yong Lee, & Wamadeva Balachandran