atlantic tropical cyclogenetic processes during sop … · atlantic tropical cyclogenetic processes...
TRANSCRIPT

Atlantic tropical cyclogenetic processesduring SOP-3 NAMMA
in the GEOS-5 global data assimilationand forecast system.
Oreste Reale∗†
William K. LauKyu-Myong Kim
‡
Eugenia Brin§
Laboratory for AtmospheresNASA Goddard Space Flight Center
Greenbelt, Maryland 20771
February 27, 2009
∗Email [email protected]†Additional Affiliation: University of Maryland, BaltimoreCounty, Baltimore, Maryland‡Additional Affiliation: University of Maryland, BaltimoreCounty, Baltimore, Maryland§Science Applications International Corporation, Beltsville, Maryland
1
https://ntrs.nasa.gov/search.jsp?R=20090013075 2018-08-29T06:57:08+00:00Z

This article investigates the role of the Saharan Air Layer (SAL) in tropical cy-
clogenetic processes associated with a non-developing anda developing African
easterly wave observed during the Special Observation Period (SOP-3) phase of
the 2006 NASA African Monsoon Multidisciplinary Analyses (NAMMA). The
two waves are chosen because both interact heavily with Saharan air. A global
data assimilation and forecast system, the NASA GEOS-5, is being run to pro-
duce a set of high-quality global analyses, inclusive of allobservations used op-
erationally but with denser satellite information. In particular, following previous
works by the same Authors, the quality-controlled data fromthe Atmospheric In-
frared Sounder (AIRS) used to produce these analyses have a better coverage than
the one adopted by operational centers. From these improvedanalyses, two sets of
31 5-day high resolution forecasts, at horizontal resolutions of both half and quar-
ter degrees, are produced. Results show that very steep moisture gradients are
associated with the SAL in forecasts and analyses even at great distance from the
Sahara. In addition, a thermal dipole (warm above, cool below) is present in the
non-developing case. Moderate Resolution Imaging Spectroradiometer (MODIS)
show that aerosol optical thickness is higher in the non-developing case. Alto-
gether, results suggest that radiative effect of dust may play some role in produc-
ing a thermal structure less favorable to cyclogenesis. Results also indicate that
only global horizontal resolutions on the order of 20-30 kilometers can capture
the large-scale transport and the fine thermal structure of the SAL, inclusive of the
sharp moisture gradients, reproducing the effect of tropical cyclone suppression
which has been hypothesized by previous authors from observational and regional

modeling perspectives. These effects cannot be fully represented at lower resolu-
tions. Global resolution of a quarter of a degree is a minimumcritical threshold
to investigate Atlantic tropical cyclogenesis from a global modeling perspective.

1. Introduction
African Easterly Waves (AEWs) have been recognized as prominent weather-
producing events of northern tropical Africa (e.g Burpee 1974; Asnani 2005) and
have been extensively studied from observational and modeling perspectives (e.g
Hsieh and Cook 2005; Kiladis et al. 2006). However, the development of AEWs
into tropical depressions remains one of the most challenging problems in the
prediction and modeling of Atlantic tropical cyclones.
Investigations of tropical cyclogenesis have been generally carried out from
either strictly observational or high-resolution mesoscale points of view, because
the lower resolution used in most global models is deemed to be inadequate to
trigger spontaneous cyclogenesis. However, in recent years a number of global
models have reached the resolution of 10-40 km and have started to display some
tropical cyclogenesis capability. Atlas et al. (2005) shown that a semi-operational
version of the model being run at NASA at that time was capableof produc-
ing well-defined tropical cyclone structures even if initialized with low-resolution
analyses in which cyclones were either not present or analyzed properly. Shen et
al. (2006) used a higher resolution research version of the same model producing
center pressures on the order of 920 hPa for hurricane Katrina; Reale et al. (2007)
analyzed the performance of the European Center for Medium Range Weather
Forecasts (ECMWF) so-called Nature Run (a 13-month long simulation in free
running mode performed with the then-operational ECMWF model) and verified
that the simulation contained realistic AEW activity and a realistic number of At-
1
lantic tropical cyclones.
Strictly speaking, the resolutions adopted by the above referenced studies can-
not be considered adequate yet to resolve the fine structure of tropical cyclogenetic
processes, because the organization of several convectivecenters into a rotating
system requires cloud-resolving resolutions which are notyet possible in real-
time global numerical weather prediction models. Despite these limitations, it is
nonetheless remarkable that the aforementioned high-resolution global models,
with different experimental or operational configurations, display distinct cyclo-
genetic capabilities.
Moreover, it is important to emphasize that the processes ofcyclogenesis and
cyclogenesis suppression should be studied from differentperspectives, and global
models do have the unquestionable advantages of 1) better capturing the large-
scale forcings involved, and 2) not relying upon somewhat questionable boundary
conditions imposed on the domain’s boundaries of limited area models.
Among the large-scale problems connected with tropical cyclogenesis, one of
the most debated is perhaps the role of the Saharan Air Layer (SAL). The SAL,
a layer of hot dry air rich in dust and produced over the SaharaDesert (Carlson
and Prospero 1972), has been subject to intense scrutiny in order to understand its
possible connection with tropical cyclone development or suppression.
Dunion and Velden (2004) investigate the SAL with the aid of Geostationary
Operational Environmental Satellite (GOES) and recognizeit as a possible mech-
anism linked to tropical cyclone suppression, emphasizingthree possible cycloge-
nesis inhibiting actions: increased static stability, increased vertical shear and dry
2

air inclusion. On a longer temporal scale, Lau and Kim (2007)present evidence
on that the mean activity of the SAL is likely to impact the large-scale environ-
ment, including sea-surface temperature (SST) and mean vertical shear, during
the entire hurricane season.
However, Jenkins and Pratt (2008) have investigated the connection between
dust, observed lightning and tropical cyclones during NAMMA-06, with empha-
sis on mycrophysical processes, confirming that SAL increases static stability and
may reduce SST, but also suggesting that SAL may invigorate rain bands con-
nected with cyclogenesis, and can also increase cyclonic vorticity of AEWs. In
the subsequent paper by the same first Author, Jenkins et al. (2008) present more
evidence of a possible tropical cyclone rain band invigoration due to Saharan dust.
At this time, it appears that there is no conclusive evidenceon a clear, unam-
biguous role of the SAL with respect to cyclogenesis, and theonly certain fact is
the extreme complexity of the interaction between the SAL and tropical weather
systems, which requires much more research.
In this paper, it is shown that a high resolution global data assimilation system
(DAS) coupled with a global model of comparable or even higher resolution are
suitable tools to investigate the role of the SAL not only on the wave scale, but
also from the point of view of the large-scale transport fromits source region, and
can therefore represent the possible modifications of SAL asthe waves propagate
over thousands of kilometers.
At the same time, it is shown that model horizontal resolution not lower than
a quarter of a degree is needed to unveil some of the SAL thermodynamic and
3

kinematic features, such as the increasingly narrow structure of the dry air fila-
ments being intruded in a tropical circulation, and the sharpness of the boundaries
between Saharan and non-Saharan air.
In this work, we explore processes associated with two waveswhich were ob-
served during the Special Observing Phase (SOP-3) of NAMMA,with the aid
of the global data assimilation and forecasting system called NASA GEOS-5. Of
particular concern for this article is the representation of the thermal structure dur-
ing cyclogenesis, and in particular the possible role of SAL. Section 2 describes
the data assimilation, computational aspects and simulations performed, Section
3 analyzes the results, Section 4 presents a general discussion and Section 5 states
the conclusion of this work.
2. The NASA GEOS-5 Data Assimilation and Fore-casting System
The effect of Saharan air on Atlantic tropical cyclogenesisis investigated using
a high-resolution global DAS based upon the Gridpoint Statistical Interpolation
(GSI) analysis algorithm co-developed by the National Centers for Environmen-
tal Predictions (NCEP) Environmental Modeling Center, documented in Wu et al.
(2002). The NASA GEOS-5 combines the above referenced DAS with the NASA
atmospheric global forecast model documented in Bosilovich et al. (2006) and
used, among others, by Reale et al. (2008) and Reale et al. (2009). The fore-
cast model shares the same dynamical core (Lin, 2004) with the so-called NASA
finite-volume General Circulation Model (fvGCM) which, in the version known
4
as GEOS-4, demonstrated remarkable capabilities in hurricane forecasting (Atlas
et al., 2005; Shen et al., 2006).
The GEOS-5 however contains a new physics (convective and boundary layer
parametrizations), developed predominantly by the GlobalModeling and Assim-
ilation Office (GMAO). The changes in physics made the systemquite different
from its predecessor. From one side global forecasting skill has substantially in-
creased, with the performance of the model becoming comparable to major oper-
ational centers (e.g. Reale et al. 2008). Moreover, the heavy reliance on satellite
data has made the performance quite symmetric between the two hemispheres, un-
like many operational models which rely more on conventional observations and
consequently display a substantial difference in performance between the north-
ern and the southern Hemisphere. However, the capability ofrepresenting very
deep tropical cyclones, which was remarkable in the previous versions (Atlas et
al. 2005; Shen et al. 2006) seem to have disappeared in the current configuration,
possibly because of a different convection parametrization adopted.
However, the most important difference between the GEOS-5 and the sys-
tem used in these two previous studies is in the initialization. Both Atlas et al.
(2005) and Shen et al. (2006), despite running the model at horizontal resolu-
tions of0.25o and0.125o respectively, used initial conditions at about1o resolu-
tion obtained from the NCEP operational analyses. On the other contrary, this
study makes full use of the data assimilation system included in the GEOS-5, and
produces its own set of global, high-resolution0.5o, high-quality analyses. The
analyses contain all the operational data used by NCEP at that time, but a much
5

denser satellite information. In particular, a much improved coverage from the
Atmospheric Infrared Sounder (AIRS) is utilized, as compared to the one used
by operational forecasts. Instead of clear-sky AIRS radiances, which make use of
AIRS data only from channels completely unaffected by clouds, we use quality-
controlled temperature retrievals obtained also under partly cloudy conditions,
following Susskind et al. (2006) and Susskind (2007). Despite the widespread
general assumption that clear-sky radiances are the best way to assimilate AIRS
data, Reale et al (2009) have shown retrievals under partialcloudy conditions to
provide better analyses of a tropical cyclone in the Indian ocean than the clear-sky
radiance methodology. Finally it should be stressed that the DAS for this exper-
iment is configured without any bogus vortex or vortex relocation technique. As
a consequence, tropical development, if any, is spontaneously produced by the
model.
One 35-day global data assimilation, starting at 00z 13 August 2006, is per-
formed with the GEOS-5 DAS, to cover the entire period of the SOP-3 phase of
the NAMMA campaign. From the analyses, two sets of 31 five-dayforecasts, at
two different resolutions, are performed. The DAS and forecast model configura-
tion is the same used by Reale et al. (2008) but at higher resolution: the DAS is
being run at a horizontal resolution of0.67o × 0.5o and the forecast model is run
at and0.25o × 0.33o and0.67o × 0.5o, both with 72 vertical levels.
Analyses and forecasts are validated and verified against operational NCEP
analyses. The analyses correspond remarkably well to the operational NCEP
analyses, as it will shown later, but with more information available, due to higher
6

resolution and possibly denser satellite information assimilated. Global and hemi-
spheric forecast skills, investigated through the anomalycorrelation for 500 hPa
geopotential as a function of forecast time, range from approximately 0.76 to 0.80
at day 5 (not shown), indicating that the forecast skill for boreal summer condi-
tions is reasonable, and comparable to the slightly superior forecast skill obtained
for boreal winter conditions (Reale et al. 2008).
3. Analysis and Simulation
3a. Validation
In this work we focus on two events of the SOP-3: one non-developing and one
developing AEW, appearing quite similar in terms of the intensity of the low-level
circulation, vertical shear and other dynamical forcings,and we investigate their
different evolution and the different properties of the corresponding SAL intru-
sions. Figure 1 shows a Hovmøller diagram of 700 hPa relativevorticity and rela-
tive humidity obtained from the GEOS-5 analyses, to emphasize AEWs observed
during the SOP-3, covering the second half of August. From Fig. 1, left panel,
the strongest wave of the period appears on 23 August at about5oW , undergoing
transition from continental to oceanic environment on the following day (hereafter
W1). An evident sharp strip of dry air shows the same propagation speed and am-
plitude of the wave and is clearly associated with a Saharan Air outbreak which
shortly precedes the wave. There is a hint of another SAL outbreak appearing on
Fig. 1 at about20oW and lagging of about 1 day, but this is not fully captured here
because the outbreak occurs at higher latitude.
7

In Figure 2 the same Hovmøller diagram is extracted from operational NCEP
analyses (interpolated on pressure levels at1o×1o), for validation purposes. There
is a very good correspondence in the vorticity fields, exceptthat the GEOS-5
analyses show a higher amount of detail, due to the higher resolution. As for the
moisture, it is intrinsically a very noisy field, but the correspondence between the
basic features is very good.
To further confirm the legitimacy of our analyses, we also useNAMMA data
for validation. In Figure 3, the profiles of the zonal and meridional wind com-
ponents, obtained from the vertical grand-based soundingsfrom the Cape Verde
Islands, at14.926111N, 23.494611W and an altitude of 85m, are reported (ra-
diosonde data are available online at: http://namma.msfc.nasa.gov). The zonal
wind time-series clearly shows the African Easterly Jet (AEJ) located between
700hPa and 600hPa with its amplited being modulated at time scale of two to
seven days. The weakening of the AEJ is associated with the passage of waves,
shown as sign inversions in the meridional wind time-series. The northerly to
southerly change occurred at Aug 26 coincide with the passage of the positive
vorticity over Cape Verde Islands shown in Figures 1 and 2.
In Figure 4, zonal and meridional wind profiles extracted at the same coor-
dinates from the GEOS-5 analyses are provided. Despite thatthe two data sets
are not strictly comparable, (the GEOS-5 sequence of profiles is computed con-
tinuously every 6 hours, whereas the plot in Figure 3 is an interpolation of daily
profiles), the GEOS-5 analyses match very well with the observed data: the four
episodes of maximum zonal wind on 19-21 Aug, 22Aug, 1-3 September, 5-7
8
September, and 11-13 September correspond perfectly to theobservations. The
height of the maximum wind is at about 600hPa, exactly as in the observed profiles
and, most important, even the maximum values of zonal wind are comparable, be-
ing on the order of20m s−1.
Also a comparison of the meridional component reveal that the major wave
passages are captured: the positive values of v, corresponding to northerly com-
ponent (23 August, 27 August, 4 September, and 13 September)on the order of
5 − 15m s−1, indicating a wave passage, and present in Figure 3, are clearly re-
produced in the GEOS-5 high resolution analyses.
3b. Nondeveloping wave
With the strong confidence provided by the good quality of theGEOS-5 analy-
ses, we investigate the structure and kinematics of the major nondeveloping wave
observed in the first part of the campaign.
In Figure 5, 700 hPa specific humidity and 900 hPa flow are showntogether
to emphasize the relationship between two different levelsin the analysis (00z 26
August) and across 3 forecast times (24, 48 and 72 hour forecast, corresponding
to verification times of 00z 27, 28 and 29 August respectively). The 700hPa and
900hPa levels correspond approximately to the vertical center and the base of the
SAL, with the latter emphasizing the low-level circulation. Despite the strength
of the wave, and the short-lasting apparent formation of a vertically aligned circu-
lation evident in the analyses from lower levels up to almost500hPa (not shown),
W1 becomes a nondeveloping wave. Figure 5 shows that dry air at 700hPa,
9
present at 00Z 26 Aug to the west of the 900 hPa circulation center (at about
17oN ; 21oW ), is being advected in 24 hours on the top of it (about30oW ). After
that, the rotating system becomes elongated and then rapidly evolves into an open
wave (48 and 72 forecasts). This is even more evident while analyzing intermedi-
ate time-steps (not shown).
In Figure 6, a zonal vertical cross-section of specific humidity at 20oN is ex-
tracted from the GEOS-5 24-hour forecast (displayed in Fig 5), intersecting the
SAL outbreak between40oW and35oW . The signature of the SAL as a sharply
defined ‘corridor’ of extremely dry air centered at about38oW (with values less
2gKg−1, surrounded by values larger than8gKg−1) can be seen down to 800 hPa.
Remarkable moisture gradients are present on both sides. A zonal temperature
anomaly is obtained by subtracting the zonal mean between80oW and0o: a well-
defined thermal dipole, stronger than any other anomaly in the range of longitudes
selected, (represented by a warm anomaly between 800hPa and400hPa and a cool
anomaly between 825 hPa and the surface) can be seen in correspondence to the
dry tongue. Since the cross-section cuts across the SAL intrusion, it appears that
temperature, in the core of the SAL, is up to3oC warmer than the surroundings at
the same latitude. Most important, in the section there is also evidence of a thin
dry air intrusion being entangled in the circulation at about 48o − 51oW . This
intrusion is not associated to a thermal dipole. A step-by-step streamline analysis
compared with microwave geostationary imagery (not shown)show quite clearly
that this is a fine intrusion of midlatitude air, produced by alarge anticyclone in
the Atlantic, dry because of subsidence. The GEOS-50.25o forecasts keep these
10
two air masses well separate.
In Figure 7, for verification purposes, the same figure is extracted from the full-
resolution NCEP operational analyses in model sigma levels(0.5 corresponding
roughly to 500 hPa). Despite small-scale differences, the NCEP analysis confirms
the thermal structure depicted in the GEOS-5 24-hour forecast and the presence
of a very well-defined dry intrusion at about35o − 40oW . Most remarkable is
the presence of a similar thermal dipole seen in Figure 3. A positive anomaly
of up to about3oC, even stronger than the GEOS-5 forecast, is present in the
mid-troposphere, and a corresponding cool anomaly in the low moist layer. Both
anomalies are obtained, as in Figure 3, by subtracting the80oW − 0o mean. This
is in partial agreement with Dunion and Velden, (2004). The relatively new aspect
of this analysis is that also anegative value appears in the moist low-level layer at
the base of the column. Finally, it is important to notice that the thin midlatitude
dry air intrusion, clearly seen in the GEOS-5 analyses and maintained in the 24-
hour GEOS-5 forecasts as a separate air mass (Figure 6), is not represented in the
NCEP analyses (Figure 7), possibly being merged with the surrounding air mass.
3c. Developing wave
The Hovmøller computed in Figure 1 shows a strong wave movingfrom about
10oW to 40oW between 00z 10 and 15 September (hereafter W2). Saharan Air
precedes the wave: however, in contrast with W1, values of low humidity are less
extended, suggesting that the SAL intrusion was not at strong. This is the wave
that is associated with the system eventually named as Helene.
11

In Figure 8, the GEOS-5 forecast for the genesis of Helene is shown. The
900 hPa circulation shows a clearly defined vortex (at about25oW and 12oN
in the analyses) progressing westward and then recurving northwestward, being
entangled in corresponding high levels of 700 hPa moisture.The displacement
error of the predicted center with respect to the observed position is smaller than
2o at all times (not shown).
In Figure 9 a zonal cross-section at13oN (similarly to what was done to in-
vestigate W1 in Figure 6) is produced, intersecting both thecenter of the system
W2 (which is a precursor of Hurricane Helene), and the SAL intrusion. The ver-
tically aligned vorticity column at about30o − 33oW , stretching from the surface
to the the tropopause, is the signature of the Tropical Storm, named Helene at
00z 14 September 2006 (Brown, 2006). A positive temperatureanomaly of more
than2o at about35 − 45oW in the lower midtroposphere is associated with the
same Saharan air outbreak which in the Hovmøller in Figure 1 reaches40oW on
14 September. The anomalies seen within the vorticity column associated to He-
lene are not associated to the SAL but are due to the tropical storm development
(a hint of a warm core above 500hPa and some cooling possibly due to rainfall
evaporation in the lower levels).
Comparing this cross-section with the one relative to the nondeveloping W1
(Figure 6), two prominent differences can be seen: there is minimal cool anomaly
in the lowest levels, and the dry air appears more diluted with less sharp horizontal
gradients.
In Figure 10, for validation purposes, we plot the same vertical zonal cross-
12
section seen in Figure 9, but this time from the full-resolution NCEP analyses in
sigma levels. The vertical column of vorticity present at about 30o − 33oW is
the analyzed signature of Tropical Storm Helene, and a warm anomaly of up to
3oC at about40o, corresponding to the SAL intrusion, is also present in the mid-
lower troposphere. Despite the much weaker NCEP representation of Helene with
respect to the GEOS-5 (the latter being closer to observations since Helene at that
time was already a named system) the NCEP and GEOS-5 systems agree well on
the overall scenario of a SAL intrusion preceding Helene, but not as strong as the
case seen in W1.
4. Discussion
4a. Possible role of the SAL
W1 and W2 do present some similarities: among them, verticalshear, computed
as difference between the vertically integrated 100-200hPa and 800-900hPa wind
speed, does not reach10m s−1. Other environmental conditions, such as sea sur-
face temperature and low-level vorticity appear very favorable in both W1 and
W2 case (not shown); however only the latter underwent development becoming
Helene. The only difference appears to be the intensity of the Saharan Air intru-
sion depicted in analyses and GEOS-5 forecasts. In the model, the temperature
dipole associated with the SAL affecting W1 can be followed at each time step
and can be considered a possible cause of suppression (increasing static stability
in the wave) together with the SAL dryness. In the precursor of Helene, while dry
air being present especially on its northern and western quadrants, the low-level
13

negative anomaly is minimal or absent, and therefore the effect on static stability
is smaller.
The positive anomaly can be simply attributed to the signature of warm air
originated over the Sahara but the cool anomaly in the lower levels does not have
any plausible explanation relying on transport only. Thereis no source of lo-
calized cooler temperatures at that latitude, away from landmass and in a very
homogeneous marine tropical environment. At this time a possible explanation is
that the low-level cool temperatures are at least partly an indirect evidence of dust
amount. The thermal effect of Saharan mineral dust is a net reduction of down-
wave shortwave radiation in the near-surface levels, and a heating in the lower
midtroposphere, corresponding to the core of the SAL.
To support this possibility, we present in Fig. 11 the aerosol optical depth
measured from the Moderate Resolution Imaging Spectroradiometer (MODIS) is
compared between the periods of 26-29 August 2006 and 13-16 September 2006.
These periods encompass the snapshots of the circulations in Figures 5 and 8.
Notwithstanding some contamination of MODIS data by clouds, the air advected
by the large-scale flow in W1 circulation, especially on its northern side, is likely
to contain a larger amount of dust. The different amount of dust must have a dif-
ferent impact on the thermal structure of the atmosphere. Itappears that the high-
resolution analyses and forecasts can represent these different thermal structures
and that the GEOS-5 model initialized by such analyses can retain it for 24-72
hours advecting it into the circulation and producing a realistic cyclone dissipa-
tion. In the case of the GEOS-5 forecast, the nature of the finite-volume dynamics
14

(Lin, 2004) is such that is a particularly suitable tool to generally maintain sharp
gradients by minimizing unrealistic diffusion processes.The finite-volume dy-
namics has been shown to be very efficient in the mid latitudeswhere localized
temperature gradients associated with sharp fronts can be very realistically simu-
lated and maintained. This work documents that the same skill can be very useful
also in the tropics when dealing with Saharan Air.
4b. Critical role of data coverage and model resolution
In this work, as stated in the introduction, two sets of forecasts were produced
from the GEOS-5 high quality analyses, at resolution of halfand a quarter of a
degree. The most prominent result is that the forecasts issued at a half degree,
when compared to the quarter degree, are not as suitable to retain all the infor-
mation present in the analyses, and, especially with respect to the SAL, tend to
irreparably blur the sharpness of its boundaries. Also the thermal information is
sometimes diluted and spread unrealistically. To provide evidence of this prob-
lem, in Figure 11 shows the same section of Figure 6 (which wasobtained from
the 24-hour forecast at0.25o) but from the corresponding forecast at0.5o. The
most prominent difference is that there the SAL filament is much broader and
with less sharply-defined borders. Moreover, there is no clear separation between
the midlatitude dry air at about50oW and the SAL (at about35o − 42o) as seen
in Figure 6. In addition, the cool anomaly in the lower level is substantially less
confined and spread in the lower resolution forecasts. Finally, Figure 6 shows a
moist column at25o−30oW which is associated with W1; this feature is basically
15

absent from the half degree forecast.
It is important to stress that it is not only the resolution ofthe model or of the
data assimilation system which can suppress the fine structure of the SAL and its
thermal properties. On data poor area, such as the Sahel and the eastern tropical
Atlantic the optimal use of satellite information, far for being implemented in any
operational system, is probably as important as the resolution.
One of the purposes of the GEOS-5 development was to contribute to the
creation of a new set of analyses, the Modern Era Retrospective Analysis for Re-
search and Applications (MERRA), documented by Bosilovich(2008) by making
a much more extensive use of all satellite information. The GEOS-5 used in this
work is almost the same version adopted for MERRA. The difference between the
NCEP operational analyses and the GEOS-5 analyses (which are of comparable
resolution) evident for example between Figures 9 and 10 in terms of sharpness of
moisture boundaries, and the intensity of Helene, are probably due to the different
assimilation of satellite data.
5. Conclusion
This work investigates AEW development during the the SOP-3phase of the
NAMMA campaign with the aid of the NASA GEOS-5 data assimilation and
forecasting system. A data assimilation run is performed toproduce a high qual-
ity set of global analyses which make heavy use of satellite information. From
these improved analyses, two sets of 30 5-day forecasts at two different resolution
are produced. Forecasts are validated against operationalNCEP analyses.
16

A very strong non-developing wave is selected and is compared with the wave
that eventually developed into Hurricane Helene. Analysesand forecasts docu-
ment the presence of a strong temperature dipole associatedwith the Saharan air
intrusion. This dipole is advected into the circulation of the wave, and may have
contributed to inhibit further development by increasing static stability. No such
dipole is found for the Saharan air that intruded in Helene’sprecursor. MODIS
optical thickness show that the SAL outbreak of the first casecontained a higher
amount of dust. The lower tropospheric cooling associated with the strong Saha-
ran air outbreak suggests that the high resolution global simulations and analyses
can capture not only the SAL intrusion but also possibly partof the thermal effect
consequent to downward shortwave reduction caused by largeamounts of Saharan
dust. When this thermal structure is well-represented in the initial conditions, a
high-resolution global model can have more skill in predicting the impact of SAL
on a tropical cyclone.
At this time, the role of dust on tropical cyclogenesis is still subject to a vigor-
ous debate and contrasting evidence have been presented by Dunion and Velden
(2004) in which a cyclogenesis suppression is suggested, and Jenkins et al. (2008)
which provide evidence of rain band invigoration attributed to dust.
It is clear that the details of possible radiative effects bydust on cyclogene-
sis will have to be investigated by a high-resolution GCM with interactive dust
aerosol. This capability is not yet available anywhere within the scientific com-
munity, but this work aims to provide a set of important needed requirements to
even plan such research.
17

In particular, we have emphasized how the resolution is a critical parameter
in being able to represent with some degree of confidence the fine sharpness of
SAL intrusions in tropical circulations. No simulation canbe reasonably hope to
investigate the complexity of the mechanisms involved withinteraction of SAL
and tropical cyclones at a resolution lower than a quarter ofa degree. This is a
demanding standard for global modeling but the evidence provided in this paper
suggests that it is an inescapable necessity.
Second, in this work it is shown that even at the respectable resolution of the
current operational analyses, inadequate use of satellitedata, especially on data
poor areas, may be a serious limitation. On the other hand, the density of satellite
information adopted and, most important, the quality of thecoverage, may bring
substantial improvement to our understanding of processesassociated to tropical
cyclogenesis.
Acknowledgments Authors acknowledge support from Dr. Ramesh Kakar, NASA
Headquarters, through the NAMMA Project, and use of NASA High-End Com-
puting resources.
18
REFERENCES
Asnani, G. C., 2005:Tropical Meteorology. Publisher: Indian Institute of
Tropical Meteorology, Pashan, Pune-411008, India. 3 vols.
Atlas, R., O. Reale, B.-W. Shen, S.-J. Lin, J.-D. Chern, W. Putman, T. Lee, K.-
S. Yeh, M. Bosilovich, and J. Radakovich, 2005: Hurricane forecasting
with the high-resolution NASA finite-volume general circulation model.
Geophys. Res. Letters,32, L03807, doi:10.1029/2004GL021513.
Bosilovich, M. G., S.D. Schubert, M. Rienecker, R. Todling,M. Suarez, J.
Bacmeister, R. Gelaro, G.-K. Kim, I. Stajner, and J. Chen, 2006: NASA’s
Modern Era Retrospective-analysis for Research and Applications. U.S.
CLIVAR Variations,4, (2,) 5-8.
—: NASA’s Modern Era Retrospective-analysis for Research and Applica-
tions: Integrating Earth Observations. Earthzine. Available online at:
http://www.earthzine.org/2008/09/26/nasas-modern-era-retrospective-analysis
Brown, D. P., 2006: Tropical Cyclone Report. Hurricane Helene (AL082006).
12-24 September 2006. Available online at http://www.nhc.noaa.gov/pdf/TCR-
AL082006Helene.pdf
Burpee, R. W., 1974: Characteristics of north African Easterly waves during
the summers of 1968 and 1969. J. Atmos. Sci,31, 1556-1570.
Carlson, T. N., and J. M. Prospero, 1972: The large-scale movements of Saha-
ran air outbreaks over the northern equatorial Atlantic. J.Appl. Meteorol.,
11, 283-297.
19
Dunion, J., and C. S. Velden, 2004: The impact of the Saharan Air Layer on
Atlantic Tropical Cyclone activity.Bull. Am. Meteorol. Soc., 85, 353-365.
Hsieh, J.-S., and K. Cook, 2005: Generation of African Easterly Wave distur-
bances: Relationship to the African Easterly Jet.Mon. Wea. Rev. 133,
1311-1327.
Jenkins, G. S., A. Pratt, and A. Heymsfield, 2008: Possible linkages be-
tween Saharan dust and tropical cyclone rain band invigoration in the
eastern Atlantic during NAMMA-06.Geophys. Res. Lett., 35, L08815,
doi:10.1029/2008GL034072.
—, and —, 2008: Saharan dust, lightning and tropical cyclones in the eastern
tropical Atlantic during NAMMA-06. Geophys. Res. Lett., 35, L12804,
doi:10.1029/2008GL033979.
Kiladis, G. N., C. D. Thorncroft, and N. M. J. Hall (2006), Three-Dimensional
Structure and Dynamics of African Easterly Waves. Part I:Observations,
J. Atmos. Sci., 63, 2212-2230.
Lau, K. M. and K.-M. Kim, 2007: Cooling of the Atlantic by Saharan dust.
Geophys. Res. Lett., 34, L23811, doi:10.1029/2007GL031538.
Lin, S.-J., 2004: A ‘vertically lagrangian’ finite-volume dynamical core for
global models,Mon. Wea. Rev., 132, 2293-2307.
Reale, O., J. Terry, M. Masutani, E. Andersson, L. P. Riishojgaard, J. C.
Jusem, 2007: Preliminary evaluation of the European Centrefor Medium-
Range Weather Forecasts (ECMWF) Nature Run over the Tropical At-
20

lantic and African Monsoon region.Geophys. Res. Lett., 34, L22810,
doi:10.1029/2007GL31640.
—, J. Susskind, R. Rosenberg, E. Brin, E. Liu, L. P. Riishojgaard, J. Terry,
J. C. Jusem, 2008: Improving forecast skill by assimilationof quality-
controlled AIRS temperature retrievals under partially cloudy conditions.
Geophys. Res. Lett., 35, L08809, doi:10.1029/2007GL033002.
—, W. K. Lau, J. Susskind, E. Brin, E. Liu, L. P. Riishojgaard,M. Fuentes,
R. Rosenberg, 2009: AIRS Impact on the Analysis and ForecastTrack
of Tropical Cyclone Nargis in a global data assimilation andforecasting
system.Geophys. Res. Lett., in press.
Shen, B.-W., R. Atlas, O. Reale, S.-J. Lin, J.-D. Chern, J. Chang, C. Henze,
and J.-L. Li, 2006: Hurricane forecasts with a global mesoscale-resolving
model: Preliminary results with Hurricane Katrina (2005).Geophys. Res.
Lett., 33, L13813, doi:10.1029/2006GL026143.
Susskind, J., C. Barnet, J. Blaisdell, L. Iredell, F. Keita,L. Kouvaris, G. Mol-
nar, and M. Chahine, 2006: Accuracy of geophysical parameters derived
from Atmospheric Infrared Sounder/Advanced Microwave Sounding Unit
as a function of fractional cloud cover,J. Geophys. Res., 111, D09S17,
doi:10.1029/2005JD006272.
—, 2007: Improved atmospheric soundings and error estimates from analysis
of AIRS/AMSU data, Proc.of SPIE Vol. 6684, Atmospheric and Environ-
mental Remote Sensing Data Processing and Utilization III:Readiness for
21

GEOSS, San Diego, California, August 27-28, 2007.
Wu, W.-S., R.J. Purser and D.F. Parrish, 2002: Three-dimensional variational
analysis with spatially inhomogeneous covariances,Mon. Wea. Rev., 130,
2905-2916.
22

List of Figures
1 Hovmøller of 700 hPa relative vorticity (s−1, left panel) and relative hu-
midity (right panel) from the GEOS-5 operational analyses,latitudinally
averaged (12o − 20oN ), covering the SOP-3 period from 15 August to
15 September. . . . . . . . . . . . . . . . . . . . . . . . . . . . . 26
2 Hovmøller of 700 hPa relative vorticity (s−1, left panel) and relative
humidity (right panel) from the NCEP operational analyses,latitudinally
averaged (12o − 20oN ), covering the SOP-3 period from 15 August to
15 September. . . . . . . . . . . . . . . . . . . . . . . . . . . . . 27
3 Sequence of the observed profiles of the zonal (above) and meridional
(below) components of the wind, taken daily at 12Z at the CapeVerde
station (Latitude14.926111oN , Longitudie23.494611oW , and altitude
85m) during the SOP-3 campaign.. . . . . . . . . . . . . . . . . . . 28
4 Same as Figure 3, but extracted from the GEOS-5 analyses: sequence
of the observed profiles (at each synoptic time) of the zonal (above) and
meridional (below) components of the wind, taken at the samelatitude
and longitude of the sation.. . . . . . . . . . . . . . . . . . . . . . 29
5 GEOS-5 (at0.25o): 700 hPa specific humidity (g Kg−1) and 900 hPa
wind (streamlines) in the GEOS-5 analyses (upper left) for 00z 26 Au-
gust, and relative to the 24, 48 and 72 hour forecasts for 00z 26, 27 and
28 August. . . . . . . . . . . . . . . . . . . . . . . . . . . . . . . 30
23

6 GEOS-5 (at0.25o): zonal vertical cross-section of specific humidity
(g Kg−1, shaded) and temperature anomaly (oC, red/blue contour, pos-
itive/negative, subtracting the zonal mean between80oW and 0
o) at
20oN for 00z 27 August, 24 hour forecast initialized at 00z 26 August.
W1 located at about25 − 30oW . . . . . . . . . . . . . . . . . . . . 31
7 As Figure 6, but extracted from NCEP full-resolution analyses in model
levels for validation purpose: zonal vertical cross-section of specific hu-
midity (gKg−1, shaded) and temperature anomaly (C, red/blue contour,
positive/negative, subtracting the zonal mean between80oW and0
o) at
20oN for 00z 27 August. W1 located at about25 − 30
oW The verti-
cal dimension is only approximately comparable with Figure3 since the
spacing between model levels and pressure levels is different. . . . . . . 32
8 GEOS-5 (at0.25o): 700 hPa specific humidity (gKg−1, shaded) and 900
hPa wind (streamlines) in the Analyses (upper left) for 00z 13 Septem-
ber, and relative to the 24, 48 and 72 hour forecasts for 00z 14, 15 and
16 September. . . . . . . . . . . . . . . . . . . . . . . . . . . . . 33
9 GEOS-5 (at0.25o): zonal vertical cross-section of specific humidity
(g Kg−1, shaded), temperature anomaly (oC, red/blue contour, posi-
tive/negative, subtracting the zonal mean between80oW and 0
o) and
cyclonic vorticity (darker red, contours at1, 2, 3 × 10⁻⁴s−1 at 20
oN
for 00z 14 September, 24 hour forecast initialized at 00z 13 September.
The developing TS Helene, identifiable by the vertical column of strong
cyclonic vorticity, is located at about32oW . . . . . . . . . . . . . . . 34
24
10 As Figure 9, but extracted from NCEP full-resolution analyses in model
levels for validation purpose: zonal vertical cross-section of specific hu-
midity (g Kg−1, shaded), temperature anomaly (oC, red/blue contour,
positive/negative, subtracting the zonal mean between80oW and 0
o)
and cyclonic vorticity (darker red, contours at1, 2, 3×10⁻⁴s−1 at20oN
for 00z 14 September. The developing TS Helene, identifiableby the
vertical column of strong cyclonic vorticity, is located atabout32oW . . 35
11 Four-day mean MODIS aerosol optical depth for (a) 26-29 August 2006
and (b) 13-16 September 2006. The MODIS data show much larger
amount of dust for the first wave, which is the non-developingone. . . . 36
12 As Figure 6, but produced from GEOS-5 at the lower resolutionof 0.5o
zonal vertical cross-section of specific humidity (g Kg−1, shaded) and
temperature anomaly (oC, red/blue contour, positive/negative, subtract-
ing the zonal mean between80oW and0o) at 20oN for 00z 27 August,
24 hour forecast initialized at 00z 26 August.. . . . . . . . . . . . . 37
25

Figure 1:Hovmøller of 700 hPa relative vorticity (s−1, left panel) and relative humidity(right panel) from the GEOS-5 operational analyses, latitudinally averaged (12o−20
oN ),covering the SOP-3 period from 15 August to 15 September.
26

Figure 2:Hovmøller of 700 hPa relative vorticity (s−1, left panel) and relative humidity(right panel) from the NCEP operational analyses, latitudinally averaged (12o − 20
oN ),covering the SOP-3 period from 15 August to 15 September.
27
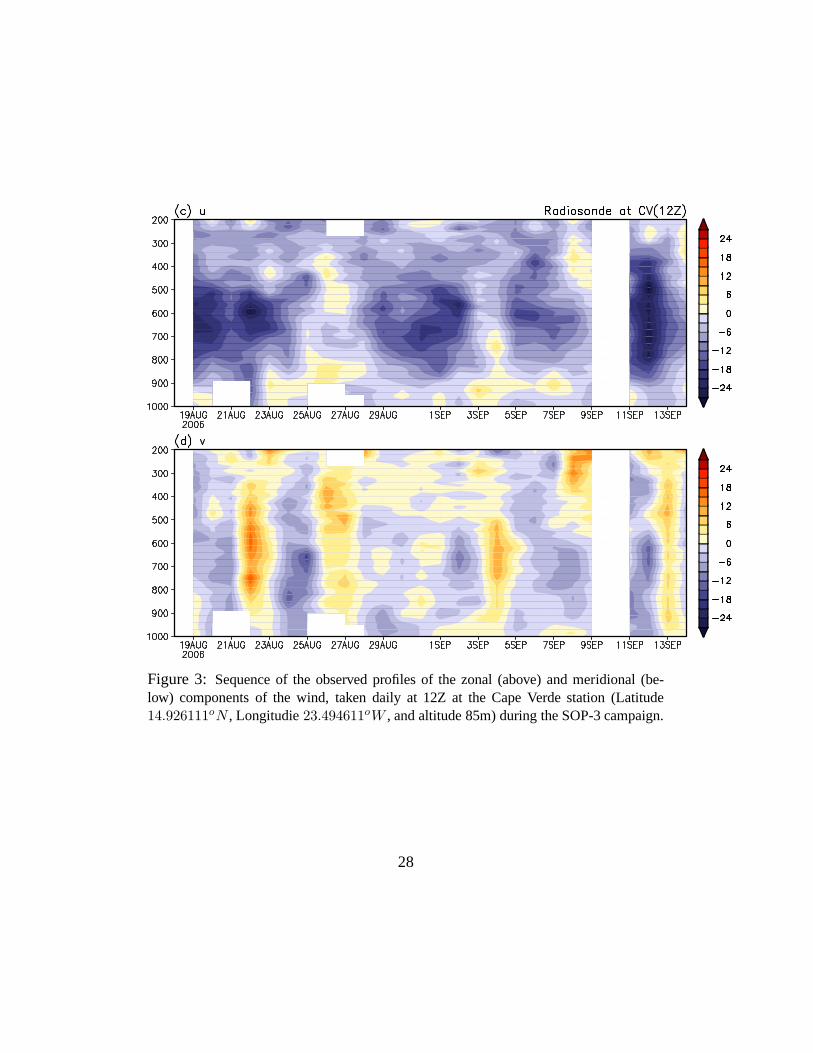
Figure 3: Sequence of the observed profiles of the zonal (above) and meridional (be-low) components of the wind, taken daily at 12Z at the Cape Verde station (Latitude14.926111oN , Longitudie23.494611oW , and altitude 85m) during the SOP-3 campaign.
28

Figure 4: Same as Figure 3, but extracted from the GEOS-5 analyses: sequence of theobserved profiles (at each synoptic time) of the zonal (above) and meridional (below)components of the wind, taken at the same latitude and longitude of the sation.
29

Figure 5: GEOS-5 (at0.25o): 700 hPa specific humidity (g Kg−1) and 900 hPa wind(streamlines) in the GEOS-5 analyses (upper left) for 00z 26August, and relative to the24, 48 and 72 hour forecasts for 00z 26, 27 and 28 August.
30

Figure 6:GEOS-5 (at0.25o): zonal vertical cross-section of specific humidity (g Kg−1,shaded) and temperature anomaly (oC, red/blue contour, positive/negative, subtractingthe zonal mean between80oW and 0
o) at 20oN for 00z 27 August, 24 hour forecast
initialized at 00z 26 August. W1 located at about25 − 30oW .
31

Figure 7:As Figure 6, but extracted from NCEP full-resolution analyses in model levelsfor validation purpose: zonal vertical cross-section of specific humidity (gKg−1, shaded)and temperature anomaly (C, red/blue contour, positive/negative, subtracting the zonalmean between80oW and0
o) at20oN for 00z 27 August. W1 located at about25−30oW
The vertical dimension is only approximately comparable with Figure 3 since the spacingbetween model levels and pressure levels is different.
32

Figure 8:GEOS-5 (at0.25o): 700 hPa specific humidity (gKg−1, shaded) and 900 hPawind (streamlines) in the Analyses (upper left) for 00z 13 September, and relative to the24, 48 and 72 hour forecasts for 00z 14, 15 and 16 September.
33

Figure 9:GEOS-5 (at0.25o): zonal vertical cross-section of specific humidity (g Kg−1,shaded), temperature anomaly (oC, red/blue contour, positive/negative, subtracting thezonal mean between80oW and0
o) and cyclonic vorticity (darker red, contours at1, 2, 3×
10−4s−1 at20oN for 00z 14 September, 24 hour forecast initialized at 00z 13 September.
The developing TS Helene, identifiable by the vertical column of strong cyclonic vorticity,is located at about32oW .
34
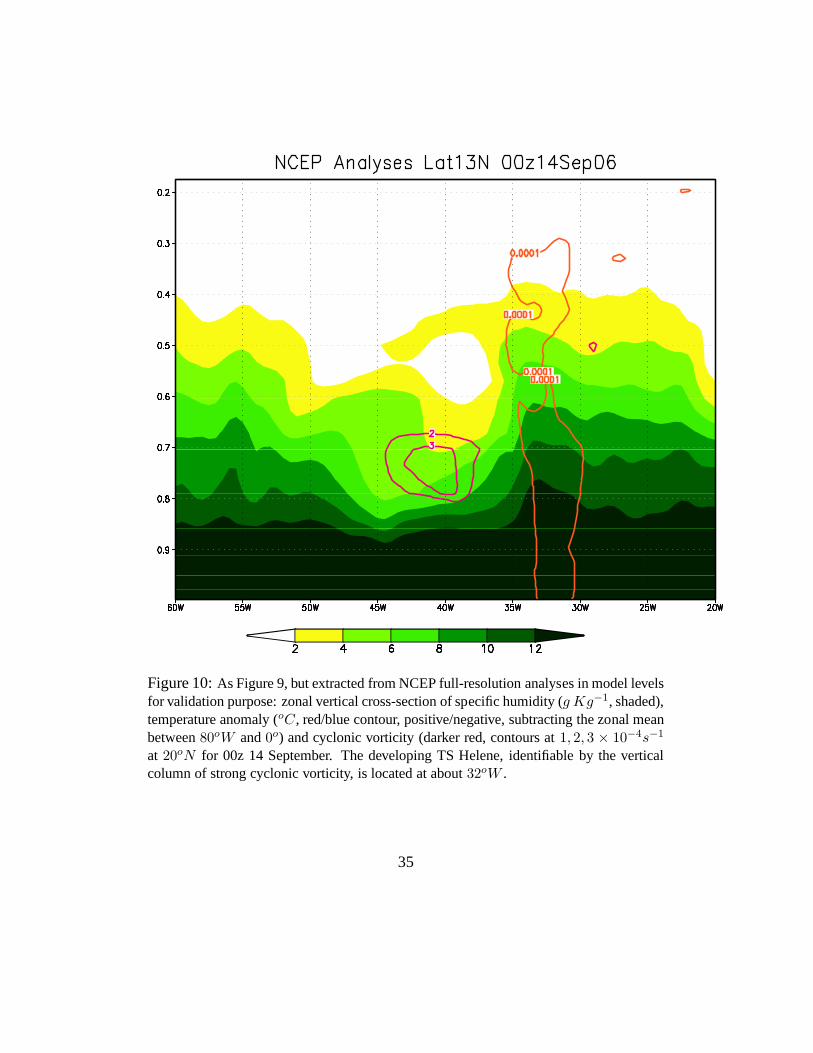
Figure 10:As Figure 9, but extracted from NCEP full-resolution analyses in model levelsfor validation purpose: zonal vertical cross-section of specific humidity (g Kg−1, shaded),temperature anomaly (oC, red/blue contour, positive/negative, subtracting the zonal meanbetween80oW and0
o) and cyclonic vorticity (darker red, contours at1, 2, 3 × 10⁻⁴s−1
at 20oN for 00z 14 September. The developing TS Helene, identifiableby the vertical
column of strong cyclonic vorticity, is located at about32oW .
35

Figure 11:Four-day mean MODIS aerosol optical depth for (a) 26-29 August 2006 and(b) 13-16 September 2006. The MODIS data show much larger amount of dust for thefirst wave, which is the non-developing one.
36

Figure 12:As Figure 6, but produced from GEOS-5 at the lower resolutionof 0.5o zonalvertical cross-section of specific humidity (g Kg−1, shaded) and temperature anomaly(oC, red/blue contour, positive/negative, subtracting the zonal mean between80oW and0
o) at20oN for 00z 27 August, 24 hour forecast initialized at 00z 26 August.
37