influence of the tropical atlantic versus the tropical … of the tropical atlantic versus the...
TRANSCRIPT
Influence of the tropical Atlantic versus the tropical Pacific on
Caribbean rainfall
Michael A. TaylorDepartment of Physics, University of the West Indies, Mona, Jamaica
David B. EnfieldPhysical Oceanography Division, NOAA/AOML, Miami, Florida, USA
A. Anthony ChenDepartment of Physics, University of the West Indies, Mona, Jamaica
Received 13 August 2001; revised 25 April 2002; accepted 9 May 2002; published 20 September 2002.
[1] The Caribbean rainfall season runs from May through November and is distinctlybimodal in nature. The bimodality allows for a convenient division into an early season(May–June–July) and a late season (August–September–October). Evidence suggeststhat interannual variability in the early season is influenced strongly by anomalies in thesea surface temperatures of the tropical North Atlantic, with positive anomalies over anarrow latitudinal band (0�–20�N) being associated with enhanced Caribbean rainfall.The coincidence of this band with the main development region for tropical wavessuggests a modification of the development of the waves by the warmer tropical Atlantic.The strong influence of the tropical North Atlantic wanes in the late season, with theequatorial Pacific and equatorial Atlantic becoming more significant modulators ofinterannual variability. The spatial pattern of significant correlation suggests strongly theinfluence of the El Nino/La Nina phenomenon, with a warm Pacific associated with adepressed late season and vice versa. There additionally seems to be a robust relationshipbetween late season Caribbean rainfall and an east-west gradient of sea surfacetemperature (SST) between the two equatorial oceanic basins. Oppositely signed SSTanomalies in the NINO3 region and the central equatorial Atlantic (0�–15�W, 5�S–5�N)are well correlated with Caribbean rainfall for this period. INDEX TERMS: 3309 Meteorology
and Atmospheric Dynamics: Climatology (1620); 3319 Meteorology and Atmospheric Dynamics: General
circulation; 4215 Oceanography: General: Climate and interannual variability (3309); KEYWORDS: Caribbean,
rainfall, El Nino, tropical Atlantic, warm pool, model
Citation: Taylor, M. A., D. B. Enfield, and A. A. Chen, Influence of the tropical Atlantic versus the tropical Pacific on Caribbean
rainfall, J. Geophys. Res., 107(C9), 3127, doi:10.1029/2001JC001097, 2002.
1. Introduction
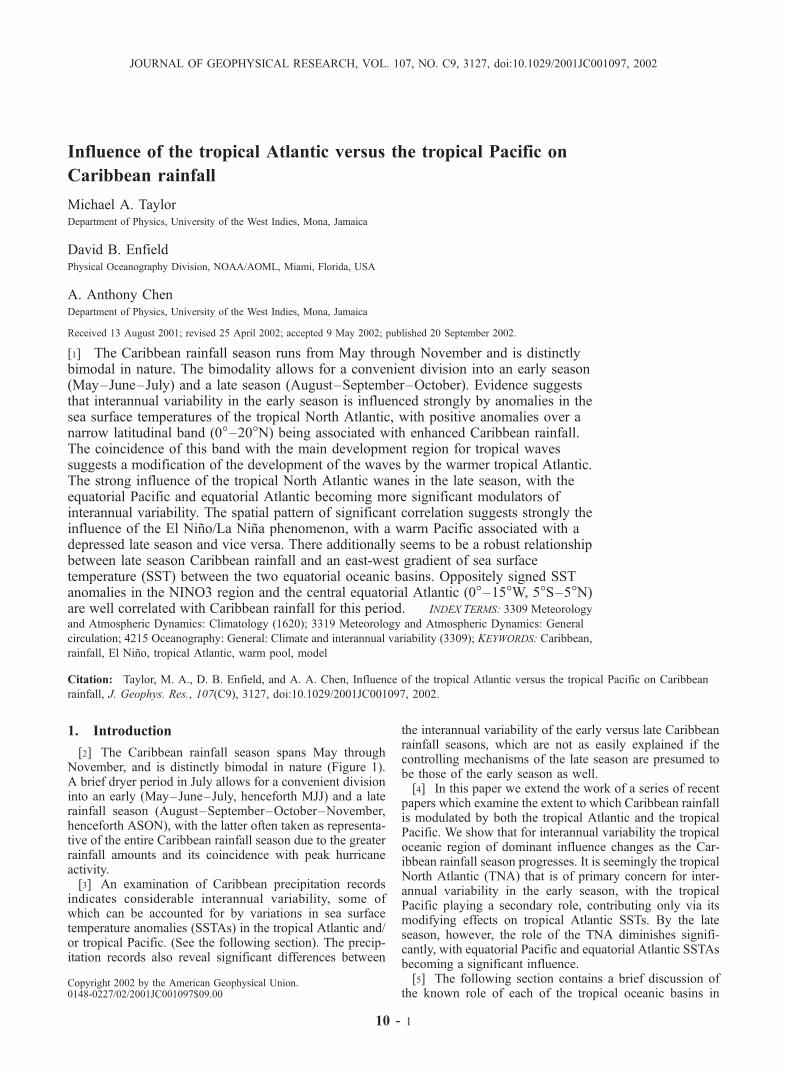
[2] The Caribbean rainfall season spans May throughNovember, and is distinctly bimodal in nature (Figure 1).A brief dryer period in July allows for a convenient divisioninto an early (May–June–July, henceforth MJJ) and a laterainfall season (August–September–October–November,henceforth ASON), with the latter often taken as representa-tive of the entire Caribbean rainfall season due to the greaterrainfall amounts and its coincidence with peak hurricaneactivity.[3] An examination of Caribbean precipitation records
indicates considerable interannual variability, some ofwhich can be accounted for by variations in sea surfacetemperature anomalies (SSTAs) in the tropical Atlantic and/or tropical Pacific. (See the following section). The precip-itation records also reveal significant differences between
the interannual variability of the early versus late Caribbeanrainfall seasons, which are not as easily explained if thecontrolling mechanisms of the late season are presumed tobe those of the early season as well.[4] In this paper we extend the work of a series of recent
papers which examine the extent to which Caribbean rainfallis modulated by both the tropical Atlantic and the tropicalPacific. We show that for interannual variability the tropicaloceanic region of dominant influence changes as the Car-ibbean rainfall season progresses. It is seemingly the tropicalNorth Atlantic (TNA) that is of primary concern for inter-annual variability in the early season, with the tropicalPacific playing a secondary role, contributing only via itsmodifying effects on tropical Atlantic SSTs. By the lateseason, however, the role of the TNA diminishes signifi-cantly, with equatorial Pacific and equatorial Atlantic SSTAsbecoming a significant influence.[5] The following section contains a brief discussion of
the known role of each of the tropical oceanic basins in
JOURNAL OF GEOPHYSICAL RESEARCH, VOL. 107, NO. C9, 3127, doi:10.1029/2001JC001097, 2002
Copyright 2002 by the American Geophysical Union.0148-0227/02/2001JC001097$09.00
10 - 1
determining Caribbean rainfall variability. Arising from thediscussion we identify specific investigative tasks. Theensuing sections of the paper then (i) outline the data setsand methodology employed in the investigation (section 3)(ii) present the major results of the investigation (sections4–7), (iii) examine a potential predictive model for earlyand late season Caribbean rainfall (section 8), and (iv) offera physical mechanism to account for the changing oceanicinfluence with season (section 9). Section 10 offers asummary of our findings and examines their implicationsfor the development of predictive schemes for Caribbeanrainfall.
2. Background
2.1. Tropical Pacific Influence
[6] A number of studies to date have addressed year-to-year fluctuations in Caribbean rainfall, with much earlyemphasis placed on establishing an equatorial Pacific con-nection. As early as 1976, Hastenrath [1976, 1978] com-posited tropical Pacific SSTs (among other variables) for the10 wettest and 10 driest Caribbean summers (July August),utilizing as an index of Caribbean rainfall an average ofnormalized rainfall records over 48 stations in Central andSouth America which kept records for the period 1911–1972. His results showed a drier Caribbean as coincidentwith higher SSTs in the equatorial Pacific, setting the stagefor the (to become popular) dry Caribbean-ENSO relation-ship, while establishing the tropical Pacific as an influenceon the region’s rainfall.[7] The results of Hastenrath are echoed in the global
surveys of ENSO teleconnections produced by Ropelewskiand Halpert [1986], Ropelewski [1987, 1989, 1996], andKiladis and Diaz [1989]. These indicate a tendency towarda drier Caribbean during July to October of the mature ElNino year (i.e., just prior to the NDJ peak in equatorialPacific SSTAs associated with El Ninos), though theresponse is not as strong as might be inferred by Hasten-rath’s early work, especially when the Caribbean signal iscompared to that of neighboring regions. Rogers [1988],and Aceituno [1988a] likewise reinforced the idea of a
drying El Nino influence during the period of heaviestrainfall in the Caribbean.[8] The common inference of the abovementioned stud-
ies is the restriction of the equatorial Pacific influence to thelater Caribbean rainfall season, i.e., onward of July. In somecases (e.g. Hastenrath) this resulted from ascribing thecharacteristics of the late rainfall season (due to its largeraccumulations) to the entire Caribbean rainy season, whilein others (particularly the surveys) the restriction seems thebyproduct of the research. The results suggest the tropicalPacific as primarily an interannual influence on late seasonCaribbean rainfall and it is an examination of this latterassertion (and by extension the lack of influence of thetropical Pacific on the early season), which is undertaken inthis paper. We also examine the extent to which the Atlanticmay be an interannual modulator during the same lateseason period given that none of the papers deliberatelyor otherwise do so.
2.2. Tropical Atlantic Influence
[9] Recently, Chen et al. [1997], Taylor [1999], Gian-nini et al. [2000], and Chen and Taylor [2002] address tovarying extents influences on the rainfall rates in the earlypart of the rainy season (May through July). Giannini etal. [2000] use PCA analysis to extract relationshipsbetween leading modes of SLP and SST variability andCaribbean rainfall, and show that during the mature phaseof ENSO a divergent surface flow dominates the easterntropical Pacific and western tropical Atlantic. The domi-nant divergent pattern contributes to the previously men-tioned tendency for a drier Caribbean during the laterrainfall season. The corresponding weakened SLP gradientover the TNA also yields for the same region a weakertrade wind regime and the opportunity for a gradualwarming of the sea surface [Enfield and Mayer, 1997].Four to six months after the mature ENSO phase (i.e.,boreal spring of the ensuing year), anomalously warmSSTs prevail over the TNA, which Giannini et al associatewith the likelihood of a wetter Caribbean at the start ofthe new rainy season.[10] The lag relationship between SSTAs of the tropical
Atlantic and those of the equatorial Pacific is confirmed byCurtis and Hastenrath [1995], Nobre and Shukla [1996],and Enfield and Mayer [1997], who additionally note thespring TNA SSTs to be particularly enhanced between the0�–20�N latitudinal band. Using a regional model centeredover the Caribbean, Taylor [1999] argues that SST varia-tions over this region during May–July alter Caribbeanrainfall totals for the same period by producing a morefavorable large-scale circulatory pattern for tropical wavedevelopment.[11] While concurrent anomalies in the equatorial Pacific
seem to influence late season Caribbean rainfall, TNASSTAs (e.g. those induced by changes in the equatorialPacific) seem a significant influence at the start of theCaribbean rainy season. In this study we inquire as towhether tropical North Atlantic conditions, regardless oftheir cause, affect Caribbean rainfall in the same way.Should this be true, it is a strong indication that even ENSOrelated early season rainfall anomalies [Chen and Taylor,2002] are due directly to Atlantic warming and onlyindirectly to the Pacific ENSO. We additionally will show
Figure 1. Mean monthly precipitation for the Caribbean.The time series is calculated from the 1958–1998 baseperiod monthly means averaged over the area 10�–20�N,65�–83�W. Units are mm/month.
10 - 2 TAYLOR ET AL.: TROPICAL PACIFIC/ATLANTIC AND CARIBBEAN RAINFALL
the waning influence of the TNA with the onset of the laterainfall season.
2.3. A Tropical Atlantic–Pacific GradientRelationship?
[12] Finally, a singular value decomposition (SVD) byEnfield and Alfaro [1999] shows the existence of a relation-ship between Caribbean rainfall and concurrent SSTAs inboth the tropical Atlantic and tropical Pacific. An SVDdecomposes the cross-covariance structures between twovariable fields (in this case, SSTA and rainfall anomaly),and breaks down into separate modes according to the wayin which the two variables are spatially and temporallyassociated with each other. Enfield and Alfaro find a strongresponse in the Caribbean to oppositely signed concurrentanomalies in the TNA and tropical Pacific, with the ten-dency being for enhanced rainfall over the Caribbean andCentral America and a possible early onset to the rainyseason under a warm Atlantic-cool Pacific scenario.[13] Since Enfield and Alfaro considered a Caribbean
rainfall season averaged over May–November (the entirerainfall season), it is not obvious whether the observedrelationship between Caribbean rainfall and the oppositelysigned oceanic anomalies is valid for the duration of theentire rainfall season, or a computational superposition ofthe tendency for a warm Atlantic to enhance rainfall in theearly season, and a cool Pacific to do the same in the laterseason. An assessment of the tropical Atlantic–Pacific SSTgradient influence throughout both seasons is undertaken. Inthis study we fashion an oceanic basin gradient indexindicative of the difference between SST anomalies in thetropical Atlantic and Pacific, and assess its potential as apredictor and/or modulator of Caribbean rainfall activity inboth the early and late season.
3. Data and Methodology
3.1. Data
[14] We take for our definition of the Caribbean basin aregion covering 5�N and 25�N, and 90�Wand 60�W. This isapproximately the same region used by both Giannini et al.[2000] and Chen et al. [1997] in their respective analyses.The spatial and temporal variabilities of rainfall over theCaribbean are represented by the 0.5� � 0.5� monthlygridded analysis of Magana et al. [1999] for the 1958–1998 period, from which the climatology for the sameperiod has been removed.[15] The Magana data set is a hybrid of rainguage,
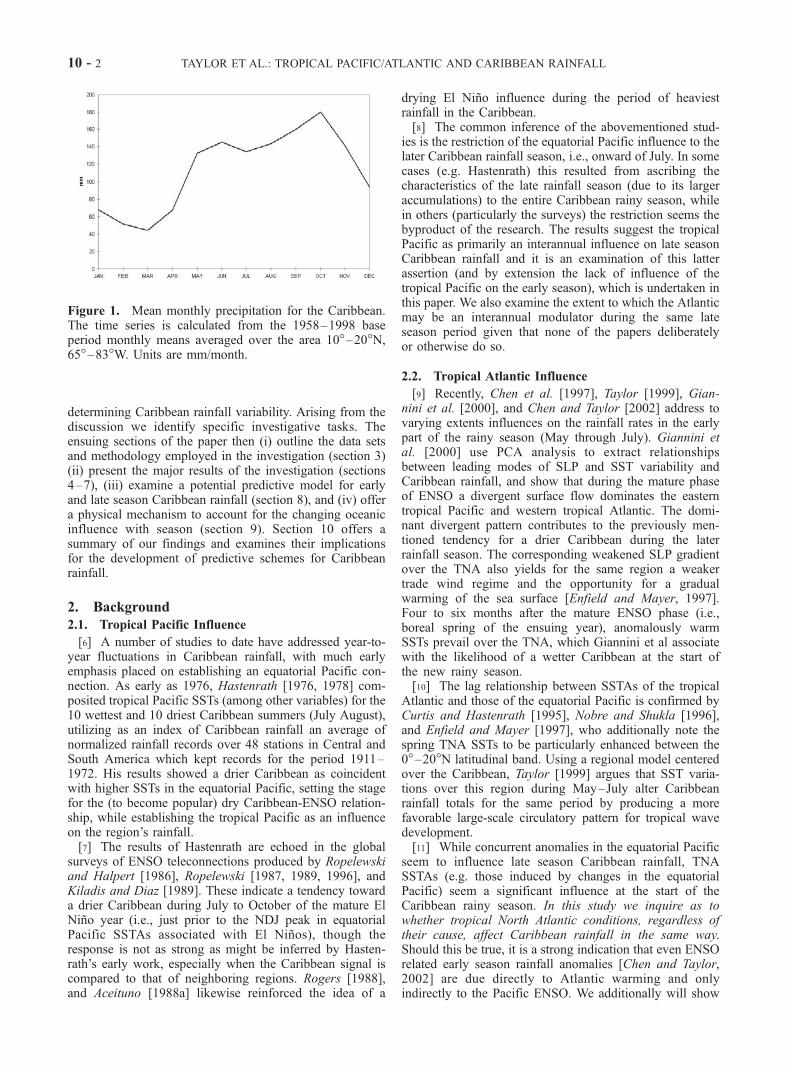
satellite and model (reanalysis) data. Daily precipitationstation data was compiled from the archives of (i) theNational Center for Atmospheric Research (NCAR) forthe southern United States, northern South America andthe Caribbean Islands (ii) the Mexican Weather Service, and(iii) the National Weather Services of Central America.These are complemented with microwave sounding unitdaily precipitation estimates over the oceans for the period1979–1996 [Spencer, 1993], while for the pre-satellite eradaily reanalysis precipitation estimates over the IntraAmer-ican Seas are utilized given the lack of any other source datain this region during this period.[16] Figure 2 shows that the blended analyses reason-
ably captures the precipitation variability over the Carib-
bean and Central American region. For Figure 2, monthlyprecipitation data from over 300 Central American andCaribbean stations, which possess more than 18 years ofdata between 1958 and 1995, are correlated with thenearest grid point of the gridded Magana data set forthe period of overlap. (The monthly station data set for theCaribbean and Central American region was independ-ently compiled from the rain gauge data archives ofmultiple sources, including University of Costa Rica,University of Florida, National Climatic Data Center(NOAA, USA), and the Meteorological services of indi-vidual countries. The data set comprises 1128 stationswith data over all or part of the period 1950–1995. Thecompilation was done under the auspices of an InitialScience Project (ISP-1), David B. Enfield (NOAA/AOML) principal investigator, funded by the Inter-Amer-ican Institute for Global Change Research (IAI) throughthe U.S. National Science Foundation (Division of Atmos-pheric Sciences).) All the stations correlated positively(crosses in the diagram), with most correlating signifi-cantly at greater than 0.5 (*’s). Over 200 stations corre-lated significantly at greater than 0.8 (solid circles) includingmost of the coastal stations surrounding our defined regionof interest. Comparison of the Magana data set with both theshorter Climate Prediction Center (CPC) merged rain gaugeand satellite gridded data set [Xie and Arkin, 1997] and thesmaller domain of the gridded University of the West Indies(UWI) station data set [Chen and Taylor, 2002], similarlyyielded high significant correlations over 12 regions of theCaribbean defined in the latter study. In all cases statisticallysignificant correlations are at the 95% level or higher, andsignificance is determined by the random phase method[Ebisuzaki, 1997], which accounts for serial correlation inthe data.[17] Though the resolution of the Magana et al. data set is
better than the 2.5� � 2.5� of the CPC data set used byEnfield and Alfaro [1999], we note that it is still too coarseto distinguish inhomogeneities across sharp orographicfeatures in the region, and as such the results obtained inthis study are representative only in a large-scale sense, anddo not speak to relationships on smaller scales whereorography may be important.
Figure 2. Map depicting correlations between stationswith at least 18 years of monthly rainfall data between 1958and 1995 and the nearest grid point of the Magana rainfalldata set. Key: solid circles, stations with significantcorrelations >0.8; asterisks, stations with significant corre-lations >0.5; and crosses, all other stations. Significantcorrelations are at the 95% level.
TAYLOR ET AL.: TROPICAL PACIFIC/ATLANTIC AND CARIBBEAN RAINFALL 10 - 3
[18] The SST anomaly (SSTA) data used are from theglobal analyses generated by Kaplan et al. [1998] (seeEnfield and Mestas-Nunez [1999] for a brief description).The Kaplan analyses are monthly deviations from a 1951–1980 climatology, for the period 1856–1891, and aregridded in 5� � 5� boxes. We examine SSTA data over aregion spanning 20�S–45�N and 175�W–0�W. All otherexamined variables (vector wind) are from the NCEP-reanalyzed 2.5� � 2.5� X monthly gridded data set [Kalnayet al., 1996].
3.2. Methodology
[19] We extract from the Magana et al. data set twosmaller data sets representing departures in the early andlate rainfall seasons respectively. The early season data setconsists of the gridded anomaly averaged over the 3 monthperiod May, June, and July for each year, while the lateseason data set is the same but averaged over August,September and October. To characterize Caribbean rainfallvariability, we extract from each seasonal data set a timeseries (CPINDX) consisting of a simple area average overthe region 10�N–20�N, and 83�W–65�W. The area defi-nition for the CPINDX is based on the distributions ofvariance explained by the first empirical orthogonal func-tion (EOF) mode for the early and late season data sets. Inthe early season the first mode accounts for 38% of the totalprecipitation variance while in the late season it accounts for23%. In both the early and late season the first modeexplains large fractions (50–95% and 50–85% respec-tively) of the precipitation variance over sizable and nearlyidentical regions approximated by the area averaged. TheCPINDX is an efficient representation of the overall Car-ibbean rainfall anomaly variability and has for each season acorrelation higher than 0.95 with the first EOF of regionalrainfall for the corresponding season.[20] The time series of the CPINDX for the early and late
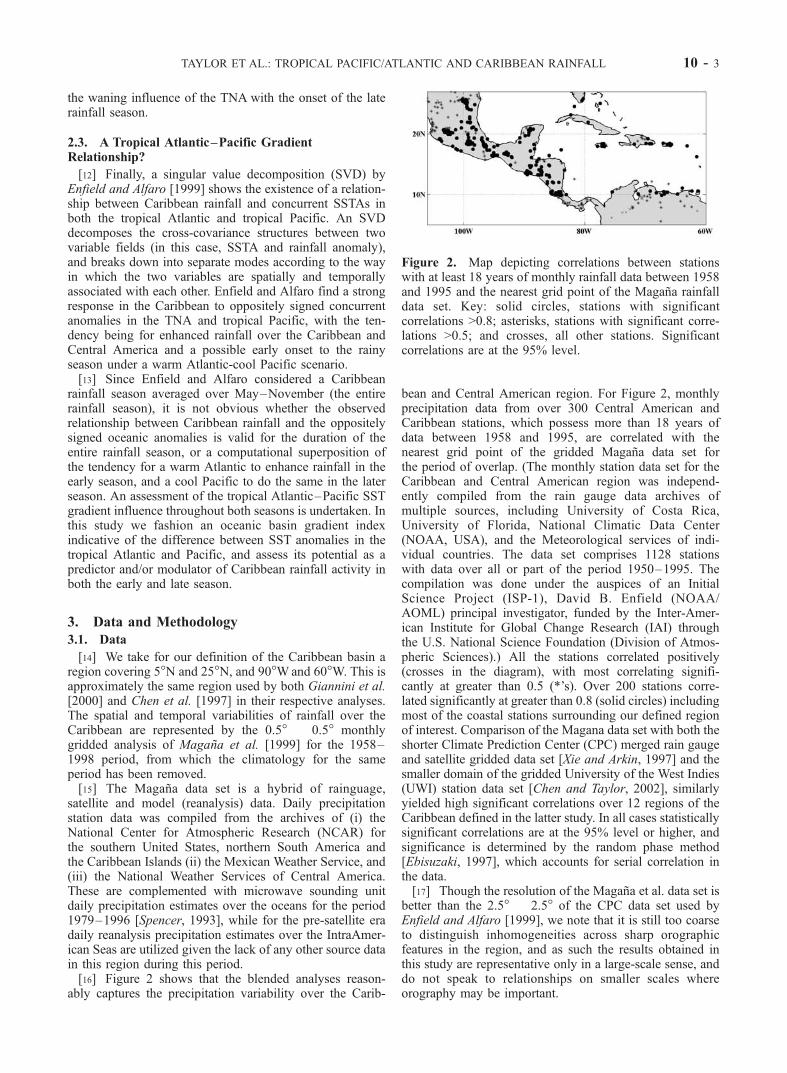
seasons are shown in Figures 3a and 3c, respectively. Toextract only an interannual component of the early and lateseason rainfall variability, the CPINDX for each season wassmoothed by applying a 7 year running mean and the
resulting smoothed time series (bold lines in Figures 3aand 3c) subtracted. As a consequence the time period underanalysis in this paper is 1961–1995. It is the detrendedCPINDX for each season (hereafter referred to as DCPINDXand shown in Figures 3b and 3d) which is analyzed in thispaper.[21] To determine the existence of a relationship between
SSTAs in one or both of the tropical basins and rainfallvariability in the early and late season, simple correlationsare calculated and composites created. Correlations arecalculated between the DCPINDX for each season andSST indices characterizing variability in the tropical Pacific(NINO3), the tropical north Atlantic (TNA) and the centralequatorial Atlantic (EqATL) for seasons leading up to andincluding the rainfall season under analysis. NINO3 andTNA are as defined by Enfield [1996] and cover the regions6�S–6�N and 150�–90�W and 6�S–22�N and 80�–15�Wrespectively. EqATL is the area average of SSTAs over theregion 0�–15�W and 5�S–5�N. Composite maps of SSTAsare also generated for years when the DCPINDX for eachrainfall season falls above or below given thresholds indi-cative of wet and dry conditions.[22] Finally, we attempt to create separate predictive
models for the early and late Caribbean rainfall seasonson the basis of the correlation and composite averaging. Todo so gridded rainfall anomalies for each season areregressed on selected seasonal SSTA indices that exhibitthe strongest relationships with the early and late rainfallseason precipitation indices. If no difference exists betweenthe controlling mechanism of the early and late seasons thenthe resulting models will be nearly identical.[23] Selected results from the analyses are presented and
discussed in the ensuing sections, with the early and lateCaribbean rainfall seasons considered separately. We firsthowever briefly examine the original and detrended timeseries of the early and late season rainfall.
4. CPINDX and DCPINDX
[24] The time series of Caribbean rainfall (CPINDX) forthe early and late seasons (Figures 3a and 3c, respectively)show the Caribbean as prone to prolonged periods ofanomalously wet conditions prior to the early 1970s, witha predominantly drier regime thereafter. The linear trend inthe index is more pronounced in the early season than thelate season, and is consistent with that seen in other analysesof Caribbean precipitation indices (see, e.g., T. C. Peterson,Recent changes in climate extremes in the Caribbean region,submitted to Journal of Geophysical Research, 2002, Figure7). It is also well represented in many of the surroundingCaribbean coastal stations as suggested by the strongcorrelations of Figure 2.[25] The shift around 1970 is also in phase with a similar
change in the 10 year running average of North AtlanticSST and the onset of drier conditions over most of thecontinental United States [Enfield et al., 2001]. This lattersimilarity suggests that both the U.S. and the Caribbeanmay be part of the same multidecadal covariability betweenrainfall and North Atlantic SSTA. If so, the phase similarityis more an initial indicator of early season rainfall sensitivityto SSTA variations in the North Atlantic than of the lateseason. This is also echoed in the power spectrum of the
Figure 3. Time series of CPINDX (filled) and thesmoothed CPINDX (bold line) for (a) MJJ and (c) ASO.The time series are derived from the Magana data set for the1958–1998 period, with climatology removed. CPINDX isan area average over the region 10�N–20�N and 83�–65�W. Units are cm. Figures 3b and 3d depict DCPINDX,(i.e., CPINDX minus the smoothed CPINDX).
10 - 4 TAYLOR ET AL.: TROPICAL PACIFIC/ATLANTIC AND CARIBBEAN RAINFALL
MJJ CPINDX index (not shown) which indicates maximumpower on decadal timescales (approximately 20 and 10years respectively). SSTs of the TNA region are known topossess similarly strong decadal components with 10–20year periodicities [Carton and Huang, 1994; Mehta andDelworth, 1995; Chang et al., 1997].[26] Figures 3b and 3d characterize the interannual var-
iability of the early and late season rainfall, i.e., once thedominant linear trend has been removed. Though the twoDCPINDX time series correlate significantly at +0.45, thisis less than would have been anticipated if late seasonrainfall activity is indeed characteristic of the entire year.Several years exist when the rainfall anomalies in consec-utive seasons of the same year are oppositely signed (see,for example, 1975, 1984, 1985, 1986, and 1991, and 1992)with 1986 and 1992 particularly noteworthy as an enhancedearly season is followed by a depressed late season. Thespectral analysis of the detrended series (not shown) like-wise indicates notable difference between the two seasons.Whereas the spectrum for the late season possesses max-imum power at periodicities of 6.7, 3.8, and 4.3 years, theearly season exhibits several periodicities (6.7, 4.6, and 2.9years) of comparable power, respectively.
5. Early Season
5.1. Correlations
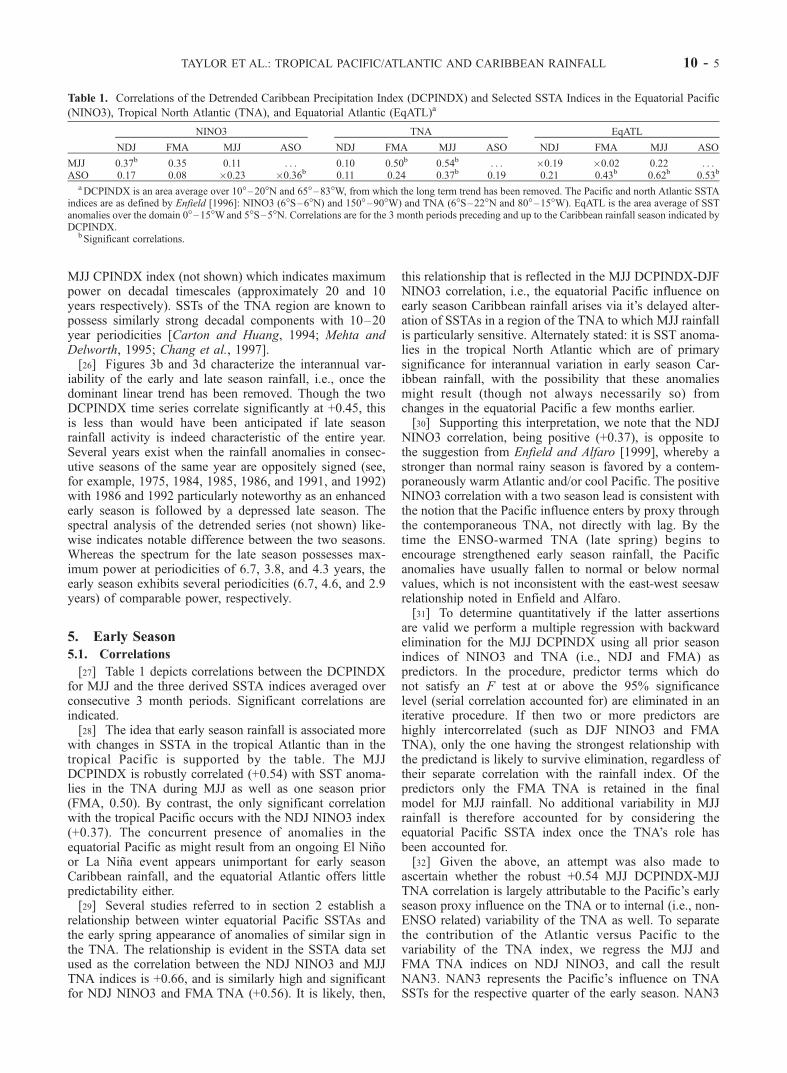
[27] Table 1 depicts correlations between the DCPINDXfor MJJ and the three derived SSTA indices averaged overconsecutive 3 month periods. Significant correlations areindicated.[28] The idea that early season rainfall is associated more
with changes in SSTA in the tropical Atlantic than in thetropical Pacific is supported by the table. The MJJDCPINDX is robustly correlated (+0.54) with SST anoma-lies in the TNA during MJJ as well as one season prior(FMA, 0.50). By contrast, the only significant correlationwith the tropical Pacific occurs with the NDJ NINO3 index(+0.37). The concurrent presence of anomalies in theequatorial Pacific as might result from an ongoing El Ninoor La Nina event appears unimportant for early seasonCaribbean rainfall, and the equatorial Atlantic offers littlepredictability either.[29] Several studies referred to in section 2 establish a
relationship between winter equatorial Pacific SSTAs andthe early spring appearance of anomalies of similar sign inthe TNA. The relationship is evident in the SSTA data setused as the correlation between the NDJ NINO3 and MJJTNA indices is +0.66, and is similarly high and significantfor NDJ NINO3 and FMA TNA (+0.56). It is likely, then,
this relationship that is reflected in the MJJ DCPINDX-DJFNINO3 correlation, i.e., the equatorial Pacific influence onearly season Caribbean rainfall arises via it’s delayed alter-ation of SSTAs in a region of the TNA to which MJJ rainfallis particularly sensitive. Alternately stated: it is SST anoma-lies in the tropical North Atlantic which are of primarysignificance for interannual variation in early season Car-ibbean rainfall, with the possibility that these anomaliesmight result (though not always necessarily so) fromchanges in the equatorial Pacific a few months earlier.[30] Supporting this interpretation, we note that the NDJ
NINO3 correlation, being positive (+0.37), is opposite tothe suggestion from Enfield and Alfaro [1999], whereby astronger than normal rainy season is favored by a contem-poraneously warm Atlantic and/or cool Pacific. The positiveNINO3 correlation with a two season lead is consistent withthe notion that the Pacific influence enters by proxy throughthe contemporaneous TNA, not directly with lag. By thetime the ENSO-warmed TNA (late spring) begins toencourage strengthened early season rainfall, the Pacificanomalies have usually fallen to normal or below normalvalues, which is not inconsistent with the east-west seesawrelationship noted in Enfield and Alfaro.[31] To determine quantitatively if the latter assertions
are valid we perform a multiple regression with backwardelimination for the MJJ DCPINDX using all prior seasonindices of NINO3 and TNA (i.e., NDJ and FMA) aspredictors. In the procedure, predictor terms which donot satisfy an F test at or above the 95% significancelevel (serial correlation accounted for) are eliminated in aniterative procedure. If then two or more predictors arehighly intercorrelated (such as DJF NINO3 and FMATNA), only the one having the strongest relationship withthe predictand is likely to survive elimination, regardless oftheir separate correlation with the rainfall index. Of thepredictors only the FMA TNA is retained in the finalmodel for MJJ rainfall. No additional variability in MJJrainfall is therefore accounted for by considering theequatorial Pacific SSTA index once the TNA’s role hasbeen accounted for.[32] Given the above, an attempt was also made to
ascertain whether the robust +0.54 MJJ DCPINDX-MJJTNA correlation is largely attributable to the Pacific’s earlyseason proxy influence on the TNA or to internal (i.e., non-ENSO related) variability of the TNA as well. To separatethe contribution of the Atlantic versus Pacific to thevariability of the TNA index, we regress the MJJ andFMA TNA indices on NDJ NINO3, and call the resultNAN3. NAN3 represents the Pacific’s influence on TNASSTs for the respective quarter of the early season. NAN3
Table 1. Correlations of the Detrended Caribbean Precipitation Index (DCPINDX) and Selected SSTA Indices in the Equatorial Pacific
(NINO3), Tropical North Atlantic (TNA), and Equatorial Atlantic (EqATL)a
NINO3 TNA EqATL
NDJ FMA MJJ ASO NDJ FMA MJJ ASO NDJ FMA MJJ ASO
MJJ 0.37b 0.35 0.11 . . . 0.10 0.50b 0.54b . . . �0.19 �0.02 0.22 . . .ASO 0.17 0.08 �0.23 �0.36b 0.11 0.24 0.37b 0.19 0.21 0.43b 0.62b 0.53b
aDCPINDX is an area average over 10�–20�N and 65�–83�W, from which the long term trend has been removed. The Pacific and north Atlantic SSTAindices are as defined by Enfield [1996]: NINO3 (6�S–6�N) and 150�–90�W) and TNA (6�S–22�N and 80�–15�W). EqATL is the area average of SSTanomalies over the domain 0�–15�Wand 5�S–5�N. Correlations are for the 3 month periods preceding and up to the Caribbean rainfall season indicated byDCPINDX.
bSignificant correlations.
TAYLOR ET AL.: TROPICAL PACIFIC/ATLANTIC AND CARIBBEAN RAINFALL 10 - 5

was then subtracted from TNA for each respective quarterand the residual called NANA. NANA is that portion ofTNA variability due to the tropical Atlantic alone. Thecorrelations of Table 1 were repeated for MJJ DCPINDX,NANA and NAN3. The results are shown in Table 2.
[33] Table 2 shows significant correlations between theearly rainfall season index and NAN3 (i.e., the Pacificcomponent of early season SSTA) for both FMA andMJJ. The correlations are predictably consistent with thatbetween MJJ DCPINDX and NDJ NINO3 (Table 1). Table2 however also shows significant correlations of roughlyequal magnitude between MJJ DCPINDX and NANA forboth FMA (+0.37) and MJJ (+0.41). It is variations in TNASSTA which are significant for early season rainfall,whether they are due to ENSO influences or otherwise.
5.2. Composites
[34] To examine the contemporaneous state of the trop-ical Atlantic and Pacific when the early season is anom-alously wet (dry) we construct composites of MJJ SSTAfor years when the DCPINDX for MJJ falls in the upper(lower) tercile of all the values of DCPINDX. Figures 4aand 4b show respectively the wet and dry compositeswhile Figure 4c shows the difference between Figures 4aand 4b with darkest shading highlighting regions of largestdifference. Bold lines on the difference map denoteregions where the mean wet and dry SSTAs are statisti-cally different from each other at the 95% significancelevel using a t test.[35] Consistent with a wet early season rainfall index is
the appearance in the tropical Atlantic of a swath ofanomalously warm water immediately north of the equatorand through approximately 20�N (Figure 4a). The warmwater spans the breadth of the tropical Atlantic, engulfs theCaribbean to the west and seemingly spills over into northtropical Pacific. Just north of the warm band, cooler SSTs(though still with positively signed anomalies) pervade thesubtropical north Atlantic. When the DCPINDX for MJJindicates dry conditions (Figure 4b), the TNA is opposite tothat just described, with cold SSTAs replacing the previ-ously noted warm anomalies of the tropical North Atlanticand warmer SSTs characterizing the subtropical northAtlantic.[36] The difference map of Figure 4c suggests that for the
Atlantic, the largest region of statistically significant differ-ence between a wet and dry early season resides in the TNAbetween 0� and 20�N. North of this band, a smaller area isalso significantly different, but is oppositely signed. Thetropical Atlantic SSTA pattern of Figure 4c is nearlyidentical to the second EOF mode of Atlantic SST depar-tures (strong TNA, little tropical south Atlantic) shown byEnfield and Mayer [1997], or the first unrotated principal
component of tropical Atlantic SSTAs shown by Vuille et al.[2000].[37] Table 3 shows a contingency matrix classifying all
the wet and dry early season years into three groups. Thewet MJJ periods were classified as occurring in the yearprior to the mature El Nino peak (NDJ) in equatorialPacific SSTAs, subsequent to the peak, or neither, whiledry MJJ periods were similarly classified with respect toLa Nina (NDJ) extremes. The table shows that the effectof ENSO is to produce a wet (dry) early season in theyear following an El Nino (La Nina) event, rather than inthe year prior to the event. SST composite maps for MJJ,based solely on the post-ENSO events, reveal TNAextremes similar to those of Figure 4 and so also dothe maps for non-ENSO wet/dry seasons. This is addi-tional evidence that the direct effect on rainfall is throughTNA temperatures regardless of whether they are ofPacific or Atlantic origin. The table entries also suggestthat the rainfall-associated TNA extremes are aboutequally divided between the two sources (Pacific andinternal Atlantic).[38] In the Pacific two adjacent regions alternate sign
when the early season changes from wet to dry conditions(see again Figure 4). The first is located in the midlatitudes
Table 2. As in Table 1 but for DCPINDX NAN3 and NANAa
NAN3 NANA
FMA MJJ FMA MJJ
MJJ 0.37b 0.37b 0.34b 0.41b
aNAN3 and NANA are as defined in the text and represent the ENSOand non-ENSO contributions to the TNA index, respectively.
bSignificant correlations.
Figure 4. Composite map of MJJ Pacific and Atlantic SSTanomalies: composites for (a) wet and (b) dry early seasonyears (see text), (c) the difference between Figures 4a and4b. Bold lines on Figure 4c indicate regions where thedifference between mean SSTAs in Figures 4a and 4c aresignificant at the 95% significance level using a t test. Unitsare �C.
Table 3. Compilation of the Number of Wet (Dry) Early Season
Years (as Defined in the Text) Which Occurred Prior or Subsequent
to the NDJ Peak in Equatorial Pacific SSTAs Associated With the
End of the El Nino (La Nina) Onset Yeara
El Nino La Nina
Prior Subsequent Other Prior Subsequent Other
Wet years 2 6 5Dry years 2 5 4
aYears that fell in neither category are classified as other.
10 - 6 TAYLOR ET AL.: TROPICAL PACIFIC/ATLANTIC AND CARIBBEAN RAINFALL

of the north Pacific (centered on 160�W, 40�N), andpossesses negative SSTAs during a wet early season andvice versa. The second, located in the east north Pacific(centered on 130�W, 20�N), shows warm anomalies duringthe wet early season, with indications of the opposite whenthe Caribbean is dry. Both regions have difference compo-site amplitudes comparable to those observed in the tropicalAtlantic in Figure 4c, yet linear correlation maps betweenthe DCPINDX for MJJ and MJJ SSTA in the Pacific andAtlantic (not shown) indicate only the subtropical Pacific aspossessing a significant relationship (�0.30) with earlyseason rainfall. One possible implication is that tropicalAtlantic transitivity is greater with respect to early seasonCaribbean rainfall, and hence a greater SST anomaly inthe tropical Pacific is required to elicit the same rainfallresponse in the Caribbean as a TNA anomaly.[39] We also note that the Pacific pattern of the wet
composite is strongly reminiscent of the Pacific DecadalOscillation (PDO). We suggest that the pattern likely arisesbecause more of the wet early seasons which form thecomposite of Figure 4a occur subsequent to 1978, the yearof phase shift in the PDO. The composite mean is thereforebiased to reflect the decadal signature even though decadalfrequencies have been high pass filtered from the precip-itation index. By contrast the dry Caribbean early seasonsthat make up Figure 4b are evenly distributed between thepre and post-1978 period, and thus there is an absence of thePDO-like pattern in Figure 4b, and a more ENSO likepattern is observed.
6. Late Season
6.1. Correlations
[40] As presented for the early season, Table 1 also liststhe correlations between the DCPINDX for ASO and theNINO3, TNA, and EqATL indices averaged over threemonth periods prior to and including the late season.Whereas the NINO3 index is concurrently correlated(�0.36) with the late season rainfall index, significantcorrelations with the TNA occur only for the preceding
months. The EqATL index however indicates robust corre-lations between late season rainfall and concurrent and priorseason SSTA in the central equatorial Atlantic.
6.2. Composites
[41] Repeating the composite analysis for the late season(Figure 5) reveals a relationship between Caribbean rainfalland a seesaw in equatorial Pacific and equatorial AtlanticSSTA. The pattern of Figure 5c is similar to the first SVDmode of Enfield and Alfaro [1999], which they associatedwith a weak tendency for dryness in the Caribbean.[42] Considering the ocean basins separately, we first
note a linear relationship between contemporaneous SSTAanomalies of the equatorial Pacific and late season Carib-bean rainfall. For a dry late season Figure 5b reveals acentral and eastern equatorial Pacific characterized by aband of positive SSTAs, with largest positive anomalies justwest of the Galapagos Islands. During a wet late season theequatorial Pacific is by contrast cooler, resulting in a differ-ence composite (Figure 5c) dominated by a narrow band ofcool anomalies all along the equator. The pattern of Figure5c is easily recognizable as that characteristic of an ENSOevent. Table 4 groups the wet (dry) late season yearsaccording to their occurrence just prior (subsequent) to theNDJ peak of a mature La Nina (El Nino) event, and in an‘other’ category. Approximately half of the years in eachcase occur just prior to the peak, indicating a sensitivityduring the late rainfall season to a developing ENSOextreme.[43] The correlations (Table 1), the composite maps
(Figure 5) and the contingency matrix (Table 4) all showthat heavy late season rainfall is associated with concurrentcool equatorial Pacific conditions (developing La Nina), andvice versa. This contrasts with the early season, which seesgreater rainfall when the concurrent TNA is typically warmand El Nino reached a peak two seasons before. Theconcurrency and the opposite sign of the ENSO-DCPINDXrelationship strongly suggest a direct influence on lateCaribbean rainfall from the Pacific.[44] In the tropical Atlantic, oppositely signed SST dis-
tributions are also associated with wet and dry late seasons.Positive SSTAs exist across the TNA (0�–20�N) inclusiveof the Caribbean Sea for a wet late season, with thesereplaced by negative anomalies and a marked cooling of theCaribbean Sea during a dry ASO. The resulting differencecomposite (Figure 5c) does not however show the means inthis region to be significantly different for the wet and dryscenarios.[45] A reversal in the sign of the SSTAs for a wet and
dry late season also occurs over the central and eastern
Figure 5. As in Figure 4 but for ASO rainfall and SSTanomalies.
Table 4. Compilation of the Number of Wet (Dry) Late Season
Years (as Defined in the Text) Which Occurred Prior or Subsequent
to the NDJ Peak in Equatorial Pacific SSTAs Associated With the
End of the La Nina (El Nino) Onset Yeara
La Nina El Nino
Prior Subsequent Other Prior Subsequent Other
Wet years 6 1 6Dry years 5 1 5
aYears that fell in neither category are classified as other.
TAYLOR ET AL.: TROPICAL PACIFIC/ATLANTIC AND CARIBBEAN RAINFALL 10 - 7
equatorial Atlantic between 0�W and 15�W. The signchange in this equatorial region is opposite to that occur-ring in the equatorial Pacific, hence the previous referenceto an equatorial ‘seesaw’ in SSTAs. Significantly warmerwaters (i.e., than compared with the rest of the tropicalNorth Atlantic) appear in this equatorial region duringrainy phases, with cooler anomalies during the dry period.We note again the robust correlation between the lateseason rainfall and contemporaneous equatorial AtlanticSSTAs, which accounts for an even higher percentage ofASO DCPINDX variability (i.e., R2) than the ASO NINO3index.[46] For both seasons therefore the Atlantic represents a
significant modulator of Caribbean rainfall. For the lateseason however it is variations in the equatorial Atlantic thatprove significant with little evidence of the strong TNAinfluence which proved important for the early season.Contemporaneous SSTAs in the equatorial Pacific alsorepresent a significant influence on late season Caribbeanrainfall, unlike the early season.
7. East–West Gradient Relationships
[47] The associations found with the tropical Atlantic andequatorial Pacific (particularly in the late season) raisesimilar questions to those posed by Enfield and Alfaro[1999], who suggested that rainfall in the Caribbeanresponds to specific configurations of the two tropicaloceans. To determine if a concurrent configuration of oppo-site SSTAs in the two tropical basins is of any significanceto Caribbean rainfall variability in separate seasons, wecreate two gradient indices. The first accounts for theimportance of the TNA to early season rainfall, and iscreated by subtracting the TNA index from the NINO3index (i.e., NINO3-TNA). We deem this new index thePACTNA. The second is predicated on the strong associa-tion between late season Caribbean rainfall and the centralequatorial Atlantic (see Figure 5) and is created by sub-tracting EqATL from NINO3 (i.e., NINO3-EqATL). Thislatter index is called the PACEqATL index. In both instan-ces, a positive value for the index suggests a warmerequatorial Pacific than Atlantic and vice versa. Each ofthe two new indices is further stratified by seasons (as inTable 1) and correlated with the DCPINDX for both earlyand late season with up to 3 seasons lag.[48] It is noted that the creation of the two new indices
does not imply that oppositely signed SSTAs in the twobasins are ubiquitous in nature (as would be the case of adipole or anticorrelated relationship between oceans). Withthe exception of NINO3 and EqATL during the earlyseason (which correlate significantly at �0.32), there areno anticorrelations between the NINO3 index and thecontemporaneous Atlantic indices (TNA, EqATL) for boththe early and late season. We therefore take the correla-tions between the rainfall and seesaw indices as indicatingthe influence of east–west gradients at low latitudes on theCaribbean trade flow and associated tropospheric stability[Knaff, 1997]. The gradients may arise from anomalousextremes in either basin alone as well as from dipoleconfigurations, although the latter will typically indicate astronger rainfall response. The results of the correlationsbetween DCPINDX and the PACTNA and PACEqATL
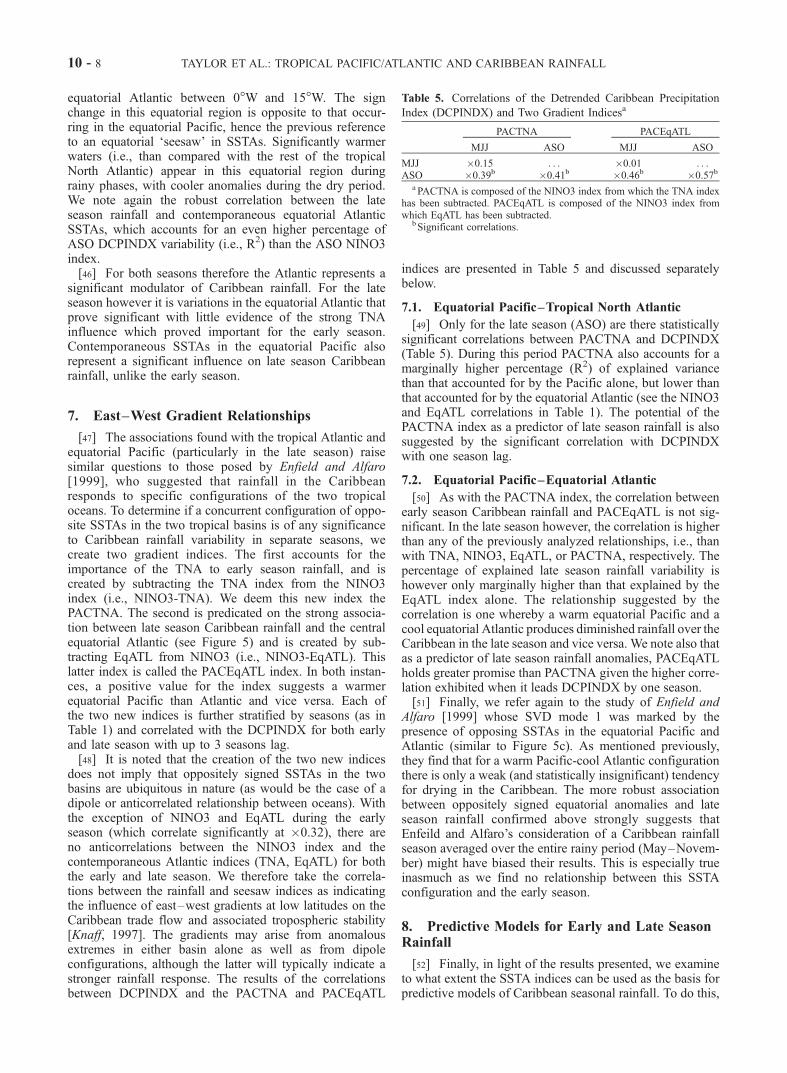
indices are presented in Table 5 and discussed separatelybelow.
7.1. Equatorial Pacific–Tropical North Atlantic
[49] Only for the late season (ASO) are there statisticallysignificant correlations between PACTNA and DCPINDX(Table 5). During this period PACTNA also accounts for amarginally higher percentage (R2) of explained variancethan that accounted for by the Pacific alone, but lower thanthat accounted for by the equatorial Atlantic (see the NINO3and EqATL correlations in Table 1). The potential of thePACTNA index as a predictor of late season rainfall is alsosuggested by the significant correlation with DCPINDXwith one season lag.
7.2. Equatorial Pacific–Equatorial Atlantic
[50] As with the PACTNA index, the correlation betweenearly season Caribbean rainfall and PACEqATL is not sig-nificant. In the late season however, the correlation is higherthan any of the previously analyzed relationships, i.e., thanwith TNA, NINO3, EqATL, or PACTNA, respectively. Thepercentage of explained late season rainfall variability ishowever only marginally higher than that explained by theEqATL index alone. The relationship suggested by thecorrelation is one whereby a warm equatorial Pacific and acool equatorial Atlantic produces diminished rainfall over theCaribbean in the late season and vice versa. We note also thatas a predictor of late season rainfall anomalies, PACEqATLholds greater promise than PACTNA given the higher corre-lation exhibited when it leads DCPINDX by one season.[51] Finally, we refer again to the study of Enfield and
Alfaro [1999] whose SVD mode 1 was marked by thepresence of opposing SSTAs in the equatorial Pacific andAtlantic (similar to Figure 5c). As mentioned previously,they find that for a warm Pacific-cool Atlantic configurationthere is only a weak (and statistically insignificant) tendencyfor drying in the Caribbean. The more robust associationbetween oppositely signed equatorial anomalies and lateseason rainfall confirmed above strongly suggests thatEnfeild and Alfaro’s consideration of a Caribbean rainfallseason averaged over the entire rainy period (May–Novem-ber) might have biased their results. This is especially trueinasmuch as we find no relationship between this SSTAconfiguration and the early season.
8. Predictive Models for Early and Late SeasonRainfall
[52] Finally, in light of the results presented, we examineto what extent the SSTA indices can be used as the basis forpredictive models of Caribbean seasonal rainfall. To do this,
Table 5. Correlations of the Detrended Caribbean Precipitation
Index (DCPINDX) and Two Gradient Indicesa
PACTNA PACEqATL
MJJ ASO MJJ ASO
MJJ �0.15 . . . �0.01 . . .ASO �0.39b �0.41b �0.46b �0.57b
aPACTNA is composed of the NINO3 index from which the TNA indexhas been subtracted. PACEqATL is composed of the NINO3 index fromwhich EqATL has been subtracted.
bSignificant correlations.
10 - 8 TAYLOR ET AL.: TROPICAL PACIFIC/ATLANTIC AND CARIBBEAN RAINFALL

we perform a multiple linear regression of gridded rainfallanomalies for each season on selected seasonal SSTAindices, using the results of the previous sections as a guide.In the regression procedure, predictor terms that did notsatisfy an F test at or above the 95% significance level (serialcorrelation accounted for) were successively eliminated inan iterative backward procedure [Draper and Smith, 1966].[53] For the early season we use FMA-TNA and NDJ-
NINO3 as our predictors, given that these yielded thehighest lagged correlation with early season Caribbeanrainfall (see again Table 1). For the late season we attemptedthe regression technique using a combination of SSTindices: MJJ-TNA, MJJ-NINO3, FMA- and MJJ-EqATL,MJJ-PACTNA, MJJ-PACEqATL. In the end, the resultsshown represent the regression on MJJ-TNA and MJJ-PACEqATL, as (i) of all the indices it is these whichaccounted for the largest percentage of explained variationsin late season rainfall and (ii) the other potential predictorseither did not survive the backward elimination procedureor they only survived at a few sporadic grid points. Theresults of the procedure are presented as a pair of maps foreach season (Figure 6 and Figure 7), depicting the percentof rainfall variance explained by the final regression model(upper panel) and the predictors retained in the final model(lower panel) for each grid point. In the lower panels eachpredictor is signified by either light gray or dark gray, withblack indicating areas were both predictors were retained bythe procedure. White areas in the lower panels indicate areaswhere neither predictor survived elimination.
[54] Note also that unlike the correlation analysis, theseasonal rainfall anomalies used in this section have not beendetrended and represent deviations only from climatology.The trend was not removed so as to increase the degrees offreedom in the calculations. However, since the predictorsare trendless the results should be unaffected. The anoma-lies have also been regridded to 1.5� � 1.5� squares to easethe computational load and the analysis is done for the fullperiod of available data, i.e., 1958–1998. The models aspresented in Figures 6 and 7 represent good indicators of thepredictability of each rainfall season but are not meant to betaken as conclusive.[55] For the early season a model was extracted over the
entire Caribbean region south of 20�N (Figure 6). Over thisregion the tropical North Atlantic (dark gray) dominatesthe rainfall model, with explained variance ranging between15% and 50%. Although ENSO-related variability survivesin the near equatorial Pacific and a few grid points near theLesser Antilles, the emergence of TNA SSTanomalies as thelikely dominant predictor of early season Caribbean againsuggests that for most of the region during MJJ the equatorialPacific is significant only via its alteration of the tropicalNorth Atlantic. We also note a TNA influence on the earlyseason rainfall of northern Central America.[56] The overall predictive skill of the SSTA indices
diminishes significantly with the evolution of the Caribbeanrainfall season. Though both the PACEqATL and TNAindices are retained in the predictive model of late season(ASO) rainfall for a sizable portion of the central Caribbeanbasin, the percentage variance explained is significantlysmaller (15–25%) than that explained by the early seasonmodels. This is also the case over the other contiguousregions of the Caribbean and Central America where one of
Figure 6. Results of a multiple linear regression withbackward elimination of predictors, of the 1.5� by 1.5�gridded rainfall anomalies for MJJ on the DJF-NINO3 andFMA-TNA indices of sea surface temperature anomalies asdescribed in the text. (top) Percent variance explained by thefinal model at each grid location (white is insignificant <15%). (bottom) The model composition as being NINO3only (light gray), TNA only (dark gray), or both indices(black).
Figure 7. As for Figure 6 but for ASO rainfall anomaliesregressed on the MJJ TNA and MJJ PACEqATL indices ofSSTA. (bottom) Model composition is depicted as beingTNA alone (light gray), PACEqATL alone (dark gray), orboth indices (black).
TAYLOR ET AL.: TROPICAL PACIFIC/ATLANTIC AND CARIBBEAN RAINFALL 10 - 9
the two SST indices is retained in a predictive model insteadof both. However, since our intention is to select the bestmodel for the Caribbean, it is possible that better SSTmodels exist for these other regions. The ASO retentionof both predictors over the eastern Caribbean and the Pacificside of Central America is consistent with the importance ofthe interocean gradient relationship referred to earlier, aswell as the results of Enfield and Alfaro [1999].
9. Evolution of the Rainy Season
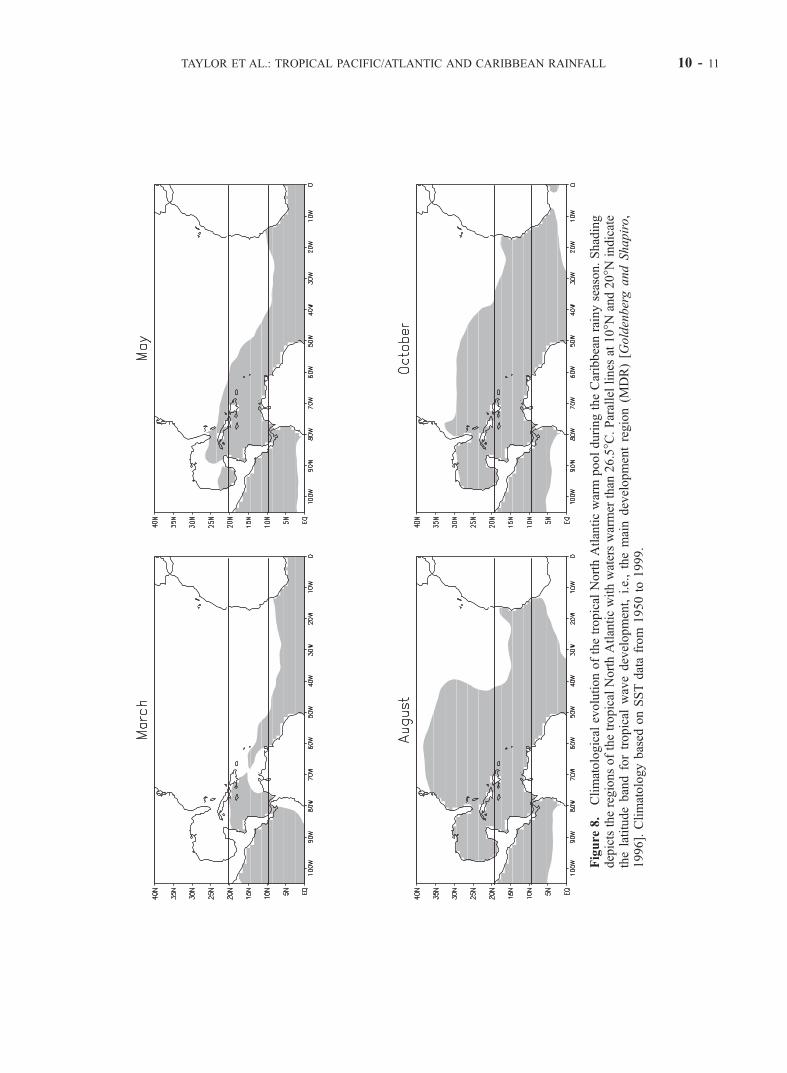
[57] Our explanation for the shifting regions of dominantoceanic influence during the progression of the Caribbeanrainfall season (i.e., TNA versus equatorial Pacific andAtlantic) is rooted in the climatological evolution of theSSTs of the tropical North Atlantic and Caribbean Sea.Figure 8 shows the climatological march of SST over thewestern hemisphere warm pool [Wang and Enfield, 2001]just prior to the start of the Caribbean rainfall season and atvarious points throughout the season. Shading denotesregions with SSTs > 26.5�C, a useful diagnostic for con-vective development [Gray, 1968]. The parallel lines oneach figure straddle the 10�–20�N latitudinal band whichGoldenberg and Shapiro [1996] denote the main develop-ment region (MDR) for easterly waves, which are convec-tion centers that frequently mature into tropical storms andhurricanes. With easterly waves being the primary source ofCaribbean rainfall, it is likely that atmospheric and oceanicchanges in this region are of primary significance toCaribbean rainfall variability.[58] Prior to the onset of the Caribbean rainfall season
(March), SSTs of the tropical North Atlantic are well below26.5�C, with only the far western Caribbean capable ofsupporting convective activity. At the onset of the Caribbeanrainfall season (May), SSTs in excess of the 26.5�C thresholdbarely reach the leeward islands of the eastern Caribbean.The warm SSTs gradually spread eastward in the ensuingmonths and byAugust (the start of the late rainfall season) theregion of favorable SST encompasses the entire Caribbeanand extends through the mid TNA and the MDR. By Octoberhowever, the entire TNA through to the west Coast of Africais bathed in the warm waters that by now also exceed 28�Cover much of the western and central tropical Atlantic.[59] We consider the area of waters in excess of 26.5�C to
be a significant factor in the explanation of Caribbeanrainfall variability. Considering first the early season, wenote that for this period only the Caribbean and westernAtlantic basin are conducive to convective activity on thebasis of the SST criterion. (This likely is a considerationwhen accounting for the smaller rainfall totals in MJJ thanASO). During years with an anomalously warm (cold)TNA, the region in excess of the SST threshold wouldhowever expand (contract) zonally across the regionupwind/east (downwind/west) of the Caribbean. A moreeastwardly extensive warm pool over the source region forCaribbean convection during warm TNA years would inturn favor greater convective development. Knaff [1997]shows that the tropospheric characteristics associated with awarm TNA, i.e., low pressure, low vertical shear, weaksurface easterlies, high moisture content, and lower con-vective stability all favor increased convection. The sensi-tivity of the early rainfall season to anomalies in the TNA,
particularly those across the 10�–20�N latitudinal band,therefore seems plausible.[60] Wang and Enfield [2001] show that there is in fact
considerable interannual variation in the size of the warmpool, with the range of interannual departures in its sizebeing as large as the climatological size, and that the largestquartile of the warm pool area distribution is about twice thesize of the smallest quartile. They also define a westernhemisphere warm pool index consisting of the area of theTNA and eastern tropical Pacific in excess of 28.5�C. Wecorrelate this index averaged over MJJ with the DCPINDXfor the same period. Not surprisingly we find a significantcorrelation of +0.33. When the analysis is repeated for ASOthe correlation does not prove significant.[61] The waning influence of the tropical Atlantic and
increasing significance of the equatorial Pacific in the lateseason is also linked to the spreading warm pool. By thelate rainfall season, the entire breadth of the TNAincluding the MDR exceeds the threshold for convectionby 1�–2�C. With the late season SSTs so high, even thelargest (negative) TNA anomalies measured do notdecrease SST below the range conducive for convection.Consequently only drastic (and uncharacteristic) changesin TNA temperatures can make the region unfavorable torainfall with respect to SST. SSTs of the TNA do notexert primary control over rainfall variability in the lateseason.[62] Once the SST criterion is met throughout the TNA,
the major modulator of convective activity in the tropicalAtlantic becomes the atmosphere, likely via the verticalshear of the horizontal wind. If strong, the vertical shear,defined as the difference in the vector winds at upper (200mb) and lower (850 mb) troposphere, hinders the verticaldevelopment of convective systems which yield rainfall forthe region [Gray, 1968].[63] A connection between a warm equatorial Pacific and
enhanced vertical shear in the Caribbean has long beenestablished by those investigating global ENSO teleconnec-tions [see, e.g., Arkin, 1982; Aceituno, 1988b] and furtherby numerous hurricane development studies [Gray et al.,1994; Goldenberg and Shapiro, 1996]. Consequently, givenan already climatologically warm TNA during the lateseason, the equatorial Pacific via the control it exerts onfavorable or unfavorable shear conditions becomes a mod-ulator of Caribbean rainfall, or otherwise stated, rainfallvariability of the late season occurs primarily by shearmodification of convective conditions as opposed to directSST modulation during the early season. This may accountfor the inability to model as much of the region during thelate season (Figure 7) based solely on SST criteria.[64] In an attempt to explain the strong association
between west-to-east SSTA gradient indices (PACTNAand PACEqATL) and late season rainfall, we examine differ-ence composites for the 925 mb vector wind (Figure 9a) andthe vertical shear vector (Figure 9b) for ASO. The compo-sites are created in an identical manner to those of Figure 5c(i.e., using wet minus dry late season years) and areconsistent with the oceanic SSTA state seen in Figure 5c,i.e., a cold equatorial Pacific but warm equatorial Atlantic.Vertical shear was calculated using respectively the differ-ence between the u and v wind components at 200 mb and850 mb.
10 - 10 TAYLOR ET AL.: TROPICAL PACIFIC/ATLANTIC AND CARIBBEAN RAINFALL
Figure
8.
Climatological
evolutionofthetropical
NorthAtlanticwarm
poolduringtheCaribbeanrainyseason.Shading
depictstheregionsofthetropicalNorthAtlanticwithwaterswarmer
than
26.5�C
.Parallellines
at10�N
and20�N
indicate
thelatitudebandfortropical
wavedevelopment,i.e.,themaindevelopmentregion(M
DR)[G
oldenbergandShapiro,
1996].Climatologybased
onSSTdatafrom
1950to
1999.
TAYLOR ET AL.: TROPICAL PACIFIC/ATLANTIC AND CARIBBEAN RAINFALL 10 - 11

[65] The anomalous low level wind vectors of Figure 9aare directed eastward across Central America and the south-ern Caribbean, from the east equatorial Pacific where theyoriginate over the region of cold waters. They are deflectednorthward around the South American landmass and to theequatorial Atlantic where warm waters reside. The resultantweakening of the normal (easterly) Caribbean Low-LevelJet is one of the tropospheric factors associated with greaterCaribbean rainfall and major hurricane development [Knaff,1997]. Weakened trades in turn result in reduced heat loss inthe surface mixed layer due to evaporation and entrainment,which besides favoring greater tropospheric moisture con-tent, would also account for the positive SST anomaliesobserved in the tropical North Atlantic through 20�N duringan enhanced late rainfall season (Figure 5a). We suggest thata similar mechanism explains the robust equatorial Atlanticrelationship with late season rainfall, though the weakeningof the Caribbean Low-Level Jet might not be as severe aswhen the west-east gradient is maximized by a La Ninaoccurrence.[66] The relationship between low level wind strength
and west–east SST gradients is further evident in thesignificant negative correlations between the ASO 925 mbzonal wind averaged over the CPINDX index region and thePACEqATL index for MJJ (�0.47) and ASO (�0.39).Significant correlations are also obtained between theASO zonal wind and the PACTNA index for MJJ (�0.52)and ASO (�0.39).
[67] Weakened trades would also contribute to decreasedvertical shear which characterizes the region under a coolPacific and/or warm Atlantic scenario. The difference com-posite of Figure 9b shows the vertical shear vectors to bedirected southwesterly over much of the Caribbean basin,indicating for a wet late season, a weakening of thenormally strong southeasterly directed shear. As with thelow level winds, strong relationships exist between the SSTgradient indices and a contemporaneous vertical shear indexaveraged over the CPINDX region during the late season.The correlations with PACEqATL and PACTNA are +0.52,and +0.59 respectively with both being significant. The signof the correlation indicates stronger shear over the Carib-bean during a warm Pacific and/or cool Atlantic scenario(and vice versa), consistent with a diminished (enhanced)late season rainfall [Knaff, 1997].[68] We interestingly find that the correlation between the
vertical shear index and PACEqATL is not as strong in theearly season (+0.33) as for the late season, though there isfor MJJ a robust relationship between the shear index andcontemporaneous TNA (�0.54). The implication is thatvertical shear can be altered by SSTAs of one basin as wellas by west–east gradient anomalies. For the early seasonthen, the vacillation of SST between subcritical conditionsfor convection also determines the region of conducivevertical shear. This is further indication of the importanceof the tropical north Atlantic to rainfall during this period.
10. Conclusions
[69] Because of the location of the Caribbean along arelatively land-free tropical strip, the interannual variabilityof its rainy season is strongly influenced by both the tropicalAtlantic in which it resides and the nearby tropical andequatorial Pacific. Additional factors making the rainyseason climate unique include: (1) position in the middleof a significant tropical warm pool; (2) low latitude withageostrophy and direct circulation dynamics; (3) tropicalconvection mediated by vertical shear; and (4) a large suiteof tropospheric characteristics that covary in a consistentmanner. As has been shown in this paper, the relativeinfluence of each oceanic basin changes as the rainfallseason progresses in ways related to these factors.[70] During the early part of the rainy season (MJJ), the
tropical Atlantic led by the eastward march of warm SSTs,is under transition from a region not conducive to con-vective development to one favorable to such activity.During this period we show SSTAs of the tropical NorthAtlantic to be a primary modulator of Caribbean rainfallactivity, a warm TNA being coincident with a moreextensive warm pool and greater rainfall amounts, and viceversa. Concurrent anomalies in the equatorial Pacific proveinsignificant in the interannual variability of early seasonrainfall, though anomalies in the same basin a few monthsprior are primary contributors to the warmings or coolingsof the tropical North Atlantic during boreal spring [Enfieldand Mayer, 1997]. Hence the equatorial Pacific can alterearly season rainfall indirectly through its effect on thetropical Atlantic SST.[71] During the late season (ASO), there is a distinct
waning of influence of the tropical North Atlantic, with theequatorial Pacific and equatorial Atlantic becoming signifi-
Figure 9. Map depicting the difference between ASOcomposites of (a) 925 mb vector wind and (b) vertical shearfor years when the DCPINDX indicates wet and dryconditions.
10 - 12 TAYLOR ET AL.: TROPICAL PACIFIC/ATLANTIC AND CARIBBEAN RAINFALL
cant influences on Caribbean rainfall. We suggest this is dueto their association with an altered vertical shear structure inthe tropical North Atlantic troposphere. The shear is relatedto the efficiency of convective development and is itselfassociated with other factors related to vertical stability[Knaff, 1997]. The importance of vertical shear in the lateseason as opposed to the early season arises out of thenecessary precondition of a warm sea surface already beingmet throughout the tropical North Atlantic during the latterperiod. It is a cold equatorial Pacific or a warm equatorialAtlantic which is linked to enhanced late season rainfall.[72] These findings provide empirical guidance for pre-
dicting Caribbean wet season rainfall. Though the Carib-bean rainfall season runs from May to November, ameaningful predictive scheme must stratify the period intoat least an early and late rainfall season, as the factorsaffecting each are different and possibly related to differentmechanisms. A single predictive scheme for a mean rainfallseason averaged over the entire period of May–Novemberwould therefore be inadequate and would in fact maskpotentially strong signals.[73] For the early season, the state of the tropical North
Atlantic one to two seasons prior along with those factorsknown to alter the sea surface temperatures of the sameregion (including El Nino occurrences) would be viablecandidates for any prediction scheme. A strong El Nino (LaNina) departure of the NINO3 index in November–Decem-ber–January is an early harbinger of a wetter (drier) thannormal early wet season. However, this relationship ismediated through SSTA in the TNA region, which maybe independently affected by non-ENSO variability and istherefore a more reliable predictor in the boreal spring. Forthe late season, a cool equatorial Pacific and/or warmequatorial Atlantic one season in advance are optimalindicators for a wet late season, and if both conditions existsimultaneously the wet conditions are more likely. It isimportant to note that most of our results are based onanalysis of only the interannual component of the early andlate season Caribbean precipitation. It is likely however thatAtlantic SSTAwill affect rainfall in a similar way regardlessof the cause or timescale, though the length of record didnot allow us to determine this.[74] Finally, we do see evidence of the effect of east–
west gradients of SST anomalies in the tropical Pacific andAtlantic on Caribbean rainfall, with a tendency for a warmAtlantic-cool Pacific to favor Caribbean rainfall. We how-ever note that the relationship seems true only for the lateCaribbean rainfall season, with a zonal SSTA gradient indexcomposed of the NINO3 and EqATL indices holding great-est promise for predicting rainfall anomalies during thatperiod.
[75] Acknowledgments. This work was facilitated by a grant fromthe Inter-American Institute for Global Change Research (IAI) through theirPESCA initiative, the IAI Collaborative Research Network program, a grantfrom the Office of Global Programs (PACS), and National ScienceFoundation grant number ATM-9815922 through the Inter AmericanInstitute (IAI) for Global Change.
ReferencesAceituno, P., On the functioning of the Southern Oscillation in the SouthAmerican sector, part I, Surface climate, Mon. Weather Rev., 116, 505–524, 1988a.
Aceituno, P., On the functioning of the Southern Oscillation in the SouthAmerican sector, part II, Upper-air circulation, J. Clim., 2, 341–355,1988b.
Arkin, P. A., The relationship between the interannual variability in the 200mb tropical wind field and the Southern Oscillation, Mon. Weather Rev.,110, 1393–1401, 1982.
Carton, J., and B. Huang, Warm events in the tropical Atlantic, J. Phys.Oceanogr., 24, 888–903, 1994.
Chang, P., L. Ji, and H. Li, A decadal climate variation in the tropicalAtlantic Ocean from thermodynamic air-sea interactions, Nature, 385,516–518, 1997.
Chen, A. A., and M. Taylor, Investigating the link between early seasonCaribbean rainfall and the El Nino + 1 year, Int. J. Climatol., 22, 87–106,10.1002/joc.711, 2002.
Chen, A. A., A. Roy, J. McTavish, M. Taylor, and L. Marx, Using seasurface temperature anomalies to predict flood and drought conditions forthe Caribbean, COLA Tech. Rep. 49, 24 pp., Cent. for Ocean Land At-mos. Stud., Calverton, Md., 1997.
Curtis, S., and S. Hastenrath, Forcing of anomalous sea surface temperatureevolution in the tropical Atlantic during Pacific warm events, J. Geophys.Res., 100, 15,835–15,847, 1995.
Draper, N., and H. Smith, Applied Regression Analysis, 709 pp., JohnWiley, New York, 1966.
Ebisuzaki, W., A method to estimate the statistical significance of a correla-tion when the data are serially correlated, J. Clim., 10, 2147–2153, 1997.
Enfield, D. B., Relationships of inter-American rainfall to tropical Atlanticand Pacific SST variability, Geophys. Res. Lett., 23, 3305–3308, 1996.
Enfield, D. B., and E. J. Alfaro, The dependence of Caribbean rainfall onthe interaction of the tropical Atlantic and Pacific Oceans, J. Clim., 12,2093–2103, 1999.
Enfield, D. B., and D. A. Mayer, Tropical Atlantic sea surface temperaturevariability and its relation to El Nino-Southern Oscillation, J. Geophys.Res., 102, 929–945, 1997.
Enfield, D. B., and A. M. Mestas-Nunez, Multiscale variabilities in globalsea surface temperatures and their relationships with tropospheric climatepatterns, J. Clim., 12, 2719–2733, 1999.
Enfield, D. B., A. M. Mestas-Nunez, and P. J. Trimble, The Atlantic multi-decadal oscillation and its relationship to rainfall and river flows in thecontinental U.S., Geophys. Res. Lett., 28, 2077–2080, 2001.
Giannini, A., Y. Kushnir, and M. A. Cane, Interannual variability of Carib-bean rainfall, ENSO and the Atlantic Ocean, J. Clim., 13, 297–311, 2000.
Goldenberg, S. B., and L. J. Shapiro, Physical mechanism for the associa-tion of El Nino and West African rainfall with major hurricane activity,J. Clim., 9, 1169–1187, 1996.
Gray, W. M., Global view of the origin of tropical disturbances and storms,Mon. Weather Rev., 96, 669–700, 1968.
Gray, W. M., C. W. Landsea, P. W. Miekle Jr, and K. J. Berry, PredictingAtlantic basin seasonal tropical cyclone activity by 1 June, WeatherForecasting, 9, 103–115, 1994.
Hastenrath, S., Variations in the low-latitude circulation and extreme cli-matic events in the tropical Americas, J. Atmos. Sci., 33, 202–215, 1976.
Hastenrath, S., On modes of tropical circulation and climate anomalies,J. Atmos. Sci., 35, 2222–2231, 1978.
Kalnay, E., et al., The NCEP/NCAR 40-year reanalysis project, Bull. Am.Meteorol. Soc., 77, 3437–3471, 1996.
Kaplan, A., M. A. Cane, Y. Kushnir, A. C. Clement, M. B. Blumethal, andB. Rajagopalan, Analysis of global sea surface temperatures 1856–1991,J. Geophys. Res., 103, 18,567–18,589, 1998.
Kiladis, G. N., and H. F. Diaz, Global climatic anomalies associated withextremes in the Southern Oscillation, J. Clim., 2, 1069–1090, 1989.
Knaff, J. A., Implications of summertime sea level pressure anomalies inthe tropical Atlantic region, J. Clim., 10, 789–804, 1997.
Magana, V., J. A. Amador, and S. Medina, The midsummer drought overMexico and Central America, J. Clim., 12, 1577–1588, 1999.
Mehta, V. M., and T. Delworth, Decadal variability of the tropical AtlanticOcean surface temperature in shipboard measurements and in a globalocean-atmosphere model, J. Clim., 8, 172–190, 1995.
Nobre, P., and J. Shukla, Variations of sea surface temperature, wind stressand rainfall over the tropical Atlantic and South America, J. Clim., 9,2464–2479, 1996.
Rogers, J. C., Precipitation variability over the Caribbean and tropicalAmericas associated with the Southern Oscillation, J. Clim., 1, 172–182, 1988.
Ropelewski, C. F., Global and regional scale precipitation patterns asso-ciated with the El Nino/Southern Oscillation, Mon. Weather Rev., 115,1606–1626, 1987.
Ropelewski, C. F., Precipitation patterns associated with the high indexphase of the Southern Oscillation, J. Clim., 2, 268–284, 1989.
Ropelewski, C. F., Quantifying Southern Oscillation-precipitation relation-ships, J. Clim., 9, 1043 –1059, 1996.
TAYLOR ET AL.: TROPICAL PACIFIC/ATLANTIC AND CARIBBEAN RAINFALL 10 - 13

Ropelewski, C. F., and M. S. Halpert, North American precipitation andtemperature patterns associated with the El Nino/Southern Oscillation,Mon. Weather Rev., 114, 2352 –2362, 1986.
Spencer, R. W., Global oceanic precipitation from the MSU during 1979–91 and comparisons to other climatologies, J. Clim., 6, 1301–1326,1993.
Taylor, M., October in May: The effect of warm tropical Atlantic SSTs onearly season Caribbean rainfall, Ph.D. thesis, Univ. of Md., College Park,1999.
Vuille, M., R. S. Bradley, and F. Keimig, Climate variability in the Andesand its relation to tropical Pacific and Atlantic sea surface temperatureanomalies, J. Clim., 13, 2520–2535, 2000.
Wang, C., and D. B. Enfield, The tropical western hemisphere warm pool,Geophys. Res. Lett., 28, 1635–1638, 2001.
Xie, P., and P. Arkin, Global precipitation: A 17-year monthly analysisbased on observations, satellite estimates and numerical model outputs,Bull. Am. Meteorol. Soc., 78, 2539–2558, 1997.
�����������A. A. Chen and M. A. Taylor, Department of Physics, University of the
West Indies, Mona, Jamaica. ([email protected])D. B. Enfield, Physical Oceanography Division, NOAA/AOML, 4301
Rickenbacker Causeway, Miami, FL 33149, USA.
10 - 14 TAYLOR ET AL.: TROPICAL PACIFIC/ATLANTIC AND CARIBBEAN RAINFALL