revised prediction of seasonal atlantic basin tropical
TRANSCRIPT

Revised Prediction of Seasonal Atlantic Basin Tropical Cyclone Activity from 1 August
PHILIP J. KLOTZBACH
Department of Atmospheric Science, Colorado State University, Fort Collins, Colorado
(Manuscript received 12 October 2006, in final form 6 February 2007)
ABSTRACT
Predictions of the remainder of the season’s Atlantic basin tropical cyclone activity from 1 August havebeen issued by Gray and his colleagues at the Tropical Meteorology Project at Colorado State Universitysince 1984. The original 1 August prediction scheme utilized several predictors, including measures of thestratospheric quasi-biennial oscillation (QBO), West African rainfall, El Niño–Southern Oscillation, andthe sea level pressure anomaly and upper-tropospheric zonal wind anomalies in the Caribbean basin. Therecent failure of the West African rainfall and QBO relationships with Atlantic hurricanes has led to ageneral degradation of the original 1 August forecast scheme in recent years. It was decided to revise thescheme using only surface data. The development of the National Centers for Environmental Prediction–National Center for Atmospheric Research reanalysis has provided a vast wealth of globally griddedmeteorological and oceanic data from 1948 to the present. In addition, other datasets have been extendedback even further (to 1900), which allows for a large independent dataset. These longer-period datasetsallow for an extended period of testing of the new statistical forecast scheme. A new prediction scheme hasbeen developed on data from 1949 to 1989 and then tested on two independent datasets. One of thesedatasets is the 16-yr period from 1990 to 2005, and the other dataset is from 1900 to 1948. This allows foran investigation of the statistical significance over various time periods. The statistical scheme showsremarkable stability over an entire century. The combination of these four predictors explains between 45%and 60% of the variance in net tropical cyclone activity over the following separate time periods: 1900–48,1949–89, 1949–2005, and 1900–2005. The forecast scheme also shows considerable skill as a potentialpredictor for giving the probabilities of United States landfall. Large differences in U.S. major hurricanelandfall are also observed between forecasts that call for active seasons compared with those that call forinactive seasons.
1. Introduction
Seasonal prediction of Atlantic basin (the AtlanticOcean north of the equator, the Caribbean Sea, and theGulf of Mexico) hurricane activity has been conductedsince 1984 when Gray began issuing forecasts fromColorado State University in early June and early Au-gust (Gray 1984). Although the hurricane season offi-cially starts on 1 June, an average season has over 90%of its seasonal tropical cyclone activity and approxi-mately 95% of its major [categories 3–5 on the Saffir–Simpson scale; Simpson (1974)] hurricane activity after1 August. Therefore, a prediction on 1 August is still of
considerable usefulness despite being issued 2 monthsinto the hurricane season.
The earlier prediction schemes for Atlantic basintropical cyclone activity from early August utilized sta-tistical relationships between El Niño, the quasi-biennial oscillation (QBO), and spring and early sum-mer values of Caribbean Basin sea level pressure (Gray1984). When eastern and central Pacific Ocean equato-rial sea surface temperatures were above normal (i.e.,El Niño conditions), Atlantic basin hurricane activitytended to be reduced because of an increase in upper-level westerlies and a concomitant increase in verticalwind shear (Gray 1984). The east phase of the QBOwas hypothesized to increase upper tropospheric–lowerstratospheric vertical wind shear and increase ventila-tion at upper levels in tropical cyclones, thereby inhib-iting their intensification. Finally, although not com-pletely explained in the original paper, high values ofCaribbean sea level pressure imply increased subsi-
Corresponding author address: Philip J. Klotzbach, Dept. ofAtmospheric Science, Colorado State University, Fort Collins,CO 80523.E-mail: [email protected]
VOLUME 22 W E A T H E R A N D F O R E C A S T I N G OCTOBER 2007
DOI: 10.1175/WAF1045.1
© 2007 American Meteorological Society 937
WAF1045

dence, drier air, and likely stronger trade winds (Knaff1997). All three of these factors inhibit tropical cyclonedevelopment. A more in-depth discussion of early At-lantic basin tropical cyclone forecasts is given in Hessand Elsner (1994).
Additional predictors were added to the early Au-gust forecast scheme during the first part of the 1990s.These predictors included measures of West Africanrainfall and upper-tropospheric zonal wind anomaliesin the Caribbean (Gray et al. 1993). Drought in theSahel during the early part of the hurricane season(June–July) was hypothesized to indicate weaker Afri-can easterly waves and increased dry air and verticalwind shear in the tropical Atlantic (Landsea and Gray1992). Positive upper-tropospheric zonal wind anoma-lies (e.g., stronger westerlies) imply increased verticalwind shear and a southward-shifted intertropical con-vergence zone, causing anomalous low-level divergenceand upper-level convergence in the tropical Atlantic.Both of these conditions are unfavorable for an activehurricane season (Goldenberg and Shapiro 1996; Knaffet al. 2004). Figure 1 shows the locations of the predic-tors utilized in the early 1990s version of the 1 Augustforecast scheme.
The Atlantic basin seasonal hurricane forecast from 1August showed considerable hindcast skill over the pe-riod 1950–90, explaining over 60% of the variance inmajor hurricane activity (Gray et al. 1993). However,this scheme has not worked as well in real-time fore-casting since the mid-1990s when the Atlantic returnedto very active hurricane conditions associated with theonset of a positive phase of the Atlantic multidecadaloscillation (AMO; Goldenberg et al. 2001).
The primary reason for the failure of the statisticalscheme in recent years is a result of the failure of theAfrican rainfall predictors, as well as a noticeableweakening of the relationship between Atlantic hurri-canes and the QBO. It is difficult to say why the Africanrainfall predictors have failed. It could be because of abreakdown in the linkage between African rainfall and
Atlantic hurricane activity, or it could be an artifact ofchanging station measurement quality in West Africa.In addition, Bell and Chelliah (2006) have noted thatupper-level divergence over West Africa varies on mul-tidecadal time scales. Therefore, it could be possiblethat this is more of a multidecadal than year-to-yearrelationship. Research is ongoing as to why the QBO–Atlantic hurricane relationship has weakened in recentyears. Recently, an unpublished manuscript has notedthe strong degradation of the QBO–Atlantic hurricanerelationship in recent years (C. Landsea 2007, personalcommunication).
Another reason for redoing the early August statis-tical forecast is to develop a simple, more concisescheme. The original statistical scheme expanded overtime, to include consideration of 16 predictors by Au-gust 2001. Mostly different predictors were utilized topredict each tropical cyclone metric (i.e., named storms,hurricanes, etc.). Because the pool of predictors was solarge, it often led to somewhat divergent statistical fore-casts for individual tropical cyclone parameters. There-fore, these statistical forecasts lacked internal consis-tency. For example, in August 2001, 6.7 named stormswere predicted (about 75% of the post–1 August cli-matological average), whereas 5.5 major hurricane dayswere predicted (about 110% of the post–1 August cli-matological average) (Gray et al. 2001). For reference,a total of 15 named storms and 4.25 major hurricanedays occurred during 2001; so clearly, for this particularforecast, the statistical prediction of major hurricanedays was much closer to the mark than was the namedstorm prediction.
Several new datasets have recently been developedthat provide data on a global grid for a variety of me-teorological and oceanic parameters including zonalwind, sea level pressure, sea surface temperature, etc.Some of these datasets, especially those that evaluatesurface parameters, extend back to 1900 or even as farback as the mid–nineteenth century. It was decided todevelop a new 1 August seasonal forecast scheme that
FIG. 1. Locations of areas from which meteorological parameters used in the earlier 1 AugAtlantic basin seasonal forecast were derived. Reproduced from Gray et al. (1993).
938 W E A T H E R A N D F O R E C A S T I N G VOLUME 22

utilizes these new datasets as well as some recent physi-cal insights into other potential modulators of Atlantichurricane activity. Section 2 discusses the data used inthis new 1 August forecast, and section 3 examines theconsiderable multidecadal variability that is evident inAtlantic basin tropical cyclone activity. Section 4 ex-plains the methodology used to develop the new fore-cast. Section 5 discusses the results of the forecast de-velopment, and section 6 examines the likely physicalrelationships between the predictors and Atlanticbasin hurricane activity. Section 7 discusses the poten-tial use of the scheme for issuing U.S. tropical cyclonelandfall probabilities, and conclusions are presented insection 8.
2. Data
Atlantic basin hurricane activity from 1900 to 2005was calculated from the National Hurricane Center’s“best track” data files (Jarvinen et al. 1984). Thisdataset provides the best estimate of a storm’s intensityin 5-kt increments for every 6-h period of the storm’sexistence. Recent changes made by the Atlantic Hurri-cane Database Reanalysis Project for tropical cyclonesthat occurred during the early part of the twentiethcentury (1900–14) (Landsea et al. 2004) have been in-cluded in this analysis.
The primary data source used for selecting predictorswas the National Centers for Environmental Predic-tion–National Center for Atmospheric Research(NCEP–NCAR) reanalysis from 1949 to 2005 (Kalnayet al. 1996; Kistler et al. 2001). The reanalysis providesglobal data on a 2.5° � 2.5° grid for a large number ofatmospheric and oceanic parameters including sea sur-face temperature, sea level pressure, zonal wind, me-ridional wind, etc. The model used to generate the re-analysis product was frozen at the beginning of the re-analysis, and, therefore, there should not be anyspurious jumps or discontinuities in the data due tomodel changes. It should also be noted that all dataused as predictors selected were from the reanalysis“A” variables (Kalnay et al. 1996). These variableshave more consistency checks (e.g., wind–pressure re-lationships, thermal wind balance, etc.) and are moreconstrained by observations than are some other vari-ables (e.g., velocity potential, outgoing longwave radia-tion, etc.).
One of the predictors selected for forecasting Atlan-tic basin hurricane activity was the Niño-3 index locatedin the tropical eastern Pacific. This index is a measureof sea surface temperatures from 5°S to 5°N and 150° to90°W. The Climate Prediction Center’s analysis of theNiño-3 index is utilized in this paper for the 1950–2005
period. Values were obtained from the Climate Predic-tion Center’s Web site (http://www.cpc.ncep.noaa.gov/data/indices/sstoi.indices). The Niño-3 index from 1900to 1949 was derived from the Hadley Centre’s Sea Iceand Sea Surface Temperature dataset (Rayner et al.2003) using calculations available from the Climate Di-agnostics Center’s time series Web page (http://www.cdc.noaa.gov/Pressure/Timeseries/).
Two additional datasets were utilized for the earlierindependent dataset from 1900 to 1948. Sea level pres-sure values were calculated from the Hadley CenterSLP dataset (Basnett and Parker 1997). Earlier-periodsea surface temperatures were calculated from theKaplan SST dataset (Kaplan et al. 1998).
3. Atlantic basin multidecadal variability
The Atlantic basin has more year-to-year and mul-tidecadal variability than does any other tropical cy-clone basin. There are distinct periods in the historicalhurricane record, of approximately 25–40 yr in length,when Atlantic major (categories 3–5) hurricane activitywas much more frequent than in other periods of asimilar length. For example, many more major hurri-canes were observed in the Atlantic from 1926 to 1969and 1995 to the present than were observed from 1900to 1925 and from 1970 to 1994. This variability has beendiscussed at length in several recent papers and hasbeen termed the AMO (Goldenberg et al. 2001). Ingeneral, when the AMO is positive, North Atlantic andtropical Atlantic sea surface temperatures are warmer,vertical wind shear is reduced, and consequently moreactive tropical cyclone seasons occur (Bell and Chelliah2006).
Atlantic basin multidecadal variability is greatest formajor hurricanes, which, although accounting for onlyapproximately 25% of all Atlantic basin tropical cy-clones, do approximately 80%–85% of the total dam-age when normalized by population, inflation, andwealth per capita (Pielke and Landsea 1998). Table 1displays the average number of named storms, namedstorm days, hurricanes, hurricane days, major hurri-canes, major hurricane days, and net tropical cyclone(NTC) activity for the multidecadal periods of 1900–25,1926–69, 1970–94, and 1995–2005. See section 4 for amore in-depth discussion of NTC activity. The earlierperiods were likely underestimated somewhat becauseof a lack of satellite imagery and aircraft reconnais-sance. More than twice as many major hurricanes andmajor hurricane days occurred during the 1926–69 and1995–2005 periods, when the AMO was in its positivephase, compared with 1900–25 and 1970–94, when theAMO was in its negative phase.
OCTOBER 2007 K L O T Z B A C H 939
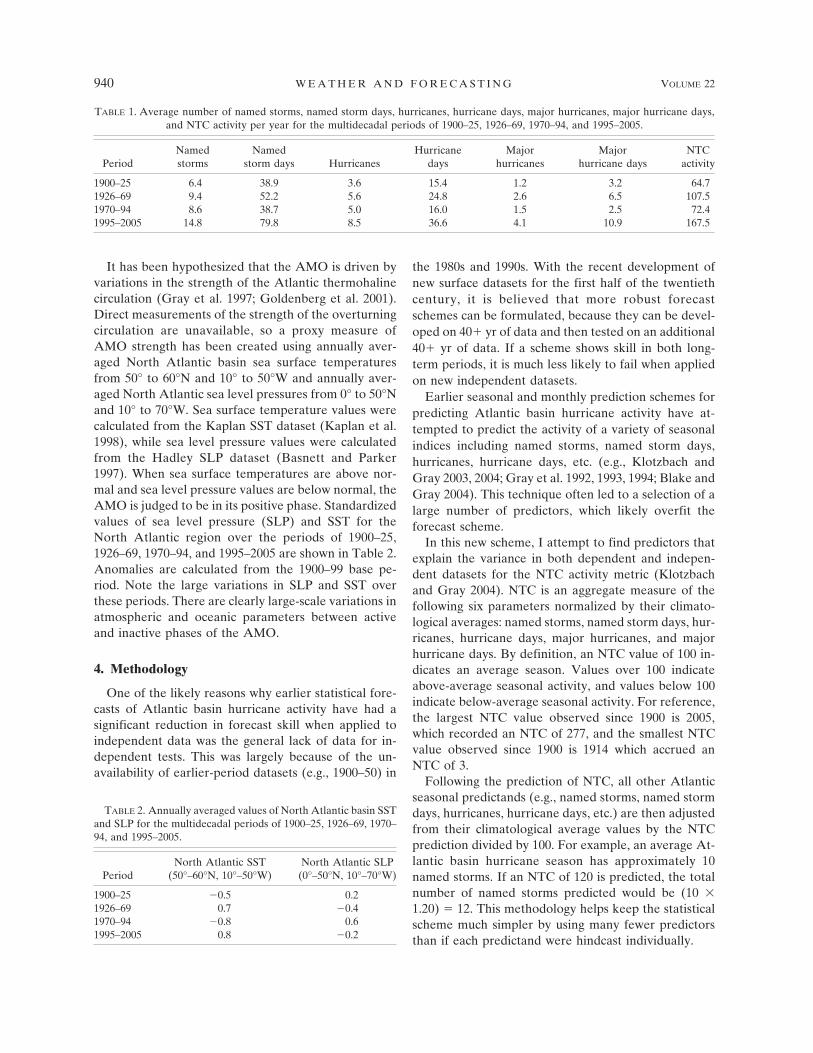
It has been hypothesized that the AMO is driven byvariations in the strength of the Atlantic thermohalinecirculation (Gray et al. 1997; Goldenberg et al. 2001).Direct measurements of the strength of the overturningcirculation are unavailable, so a proxy measure ofAMO strength has been created using annually aver-aged North Atlantic basin sea surface temperaturesfrom 50° to 60°N and 10° to 50°W and annually aver-aged North Atlantic sea level pressures from 0° to 50°Nand 10° to 70°W. Sea surface temperature values werecalculated from the Kaplan SST dataset (Kaplan et al.1998), while sea level pressure values were calculatedfrom the Hadley SLP dataset (Basnett and Parker1997). When sea surface temperatures are above nor-mal and sea level pressure values are below normal, theAMO is judged to be in its positive phase. Standardizedvalues of sea level pressure (SLP) and SST for theNorth Atlantic region over the periods of 1900–25,1926–69, 1970–94, and 1995–2005 are shown in Table 2.Anomalies are calculated from the 1900–99 base pe-riod. Note the large variations in SLP and SST overthese periods. There are clearly large-scale variations inatmospheric and oceanic parameters between activeand inactive phases of the AMO.
4. Methodology
One of the likely reasons why earlier statistical fore-casts of Atlantic basin hurricane activity have had asignificant reduction in forecast skill when applied toindependent data was the general lack of data for in-dependent tests. This was largely because of the un-availability of earlier-period datasets (e.g., 1900–50) in
the 1980s and 1990s. With the recent development ofnew surface datasets for the first half of the twentiethcentury, it is believed that more robust forecastschemes can be formulated, because they can be devel-oped on 40� yr of data and then tested on an additional40� yr of data. If a scheme shows skill in both long-term periods, it is much less likely to fail when appliedon new independent datasets.
Earlier seasonal and monthly prediction schemes forpredicting Atlantic basin hurricane activity have at-tempted to predict the activity of a variety of seasonalindices including named storms, named storm days,hurricanes, hurricane days, etc. (e.g., Klotzbach andGray 2003, 2004; Gray et al. 1992, 1993, 1994; Blake andGray 2004). This technique often led to a selection of alarge number of predictors, which likely overfit theforecast scheme.
In this new scheme, I attempt to find predictors thatexplain the variance in both dependent and indepen-dent datasets for the NTC activity metric (Klotzbachand Gray 2004). NTC is an aggregate measure of thefollowing six parameters normalized by their climato-logical averages: named storms, named storm days, hur-ricanes, hurricane days, major hurricanes, and majorhurricane days. By definition, an NTC value of 100 in-dicates an average season. Values over 100 indicateabove-average seasonal activity, and values below 100indicate below-average seasonal activity. For reference,the largest NTC value observed since 1900 is 2005,which recorded an NTC of 277, and the smallest NTCvalue observed since 1900 is 1914 which accrued anNTC of 3.
Following the prediction of NTC, all other Atlanticseasonal predictands (e.g., named storms, named stormdays, hurricanes, hurricane days, etc.) are then adjustedfrom their climatological average values by the NTCprediction divided by 100. For example, an average At-lantic basin hurricane season has approximately 10named storms. If an NTC of 120 is predicted, the totalnumber of named storms predicted would be (10 �1.20) � 12. This methodology helps keep the statisticalscheme much simpler by using many fewer predictorsthan if each predictand were hindcast individually.
TABLE 2. Annually averaged values of North Atlantic basin SSTand SLP for the multidecadal periods of 1900–25, 1926–69, 1970–94, and 1995–2005.
PeriodNorth Atlantic SST
(50°–60°N, 10°–50°W)North Atlantic SLP
(0°–50°N, 10°–70°W)
1900–25 �0.5 0.21926–69 0.7 �0.41970–94 �0.8 0.61995–2005 0.8 �0.2
TABLE 1. Average number of named storms, named storm days, hurricanes, hurricane days, major hurricanes, major hurricane days,and NTC activity per year for the multidecadal periods of 1900–25, 1926–69, 1970–94, and 1995–2005.
PeriodNamedstorms
Namedstorm days Hurricanes
Hurricanedays
Majorhurricanes
Majorhurricane days
NTCactivity
1900–25 6.4 38.9 3.6 15.4 1.2 3.2 64.71926–69 9.4 52.2 5.6 24.8 2.6 6.5 107.51970–94 8.6 38.7 5.0 16.0 1.5 2.5 72.41995–2005 14.8 79.8 8.5 36.6 4.1 10.9 167.5
940 W E A T H E R A N D F O R E C A S T I N G VOLUME 22

Predictors were selected from the NCEP–NCAR re-analysis using the Climate Diagnostic Center’s “LinearCorrelations” Web page (http://www.cdc.noaa.gov/Correlation), which allows for correlating various at-mospheric and oceanic fields with a particular index. Inthis case, sea level pressure and sea surface tempera-ture fields were correlated with NTC activity for 1949–89. The 1990–2005 period was set aside as an indepen-dent dataset, and the predictors selected were alsotested over an earlier 49-yr period (1900–48). The ear-lier-period (1900–48) correlation tests were done utiliz-ing the Hadley SLP and Kaplan SST datasets discussedpreviously. Figure 2 shows an example of the linearcorrelation map between June–July sea level pressureand post–1 August NTC activity from 1949 to 1989.
Predictors were added using a stepwise regressiontechnique (Wilks 1995), and they were only kept in theforecast scheme if they explained an additional 2% ofthe variance in the dependent data (1949–89), the re-cent independent dataset (1990–2005), and the olderindependent dataset (1900–48). It is believed that if apredictor added additional variance in all threedatasets, it is likely robust and is explaining additionalvariance not explained by the other predictors.
5. Results
Figure 3 and Table 3 display and describe the pre-dictors selected for the 1 August forecast for the re-mainder of the hurricane season. Table 4 shows the
FIG. 3. Map of the predictors utilized in the new 1 Aug forecast scheme for Atlantic basin hurricaneactivity. See Table 3 for exact locations.
FIG. 2. Linear correlation map between June–July sea level pressure and post–1 Aug NTC from 1949to 1989. Areas shaded in gray correlated at (r � |0.4|), which is approximately the 99% confidence levelof statistical significance for a two-tailed Student’s t test. Note the large shaded area in the subtropicalAtlantic.
OCTOBER 2007 K L O T Z B A C H 941

increase in variance explained for NTC using the step-wise regression technique for each time period (1949–89, 1990–2005, 1900–48, 1949–2005, and 1900–2005).The increases in variance explained for the time periodsof 1990–2005, 1900–48, 1949–2005, and 1900–2005 werecalculated using the equations developed on 1949–89.The variance explained is even higher in the 1990–2005independent dataset than over the 1949–89 develop-mental dataset. This is a testament to the remarkablestability of the scheme. It should also be noted that thisindependent dataset is only 16 yr in length. Often, largecorrelations can be obtained when evaluating a schemeover a short time period. If the scheme were to fail inone or two years, the variance explained would fall tovalues more similar to what were observed during the1949–89 period.
Note that the addition of each predictor to the fore-cast scheme adds at least 2% in additional varianceexplained for each time period. The equations for1949–89 were derived from the predictor’s standardizedanomaly values. This was done because data from 1900to 1948 use different time series, and, therefore, themeans and standard deviations are slightly different.
The forecast scheme showed considerable stabilitybetween time periods, and therefore, it was decided
that for real-time forecasts of post–1 August NTC in2006 and in future years, equations from 1949 to 2005would be used. Table 5 displays the stepwise regressiontechnique for 1949–2005 using equations developedover the full period (e.g., 1949–2005). Also, the skill ofthe independent dataset from 1900 to 1948 is evaluatedusing equations developed from 1949 to 2005. Note thatthe skill over the 1900–48 time period improves slightlyusing the equations developed over the longer period(e.g., 1949–2005 compared with 1949–89).
When evaluating the hindcast skill of the equationsdeveloped over the 1949–2005 period, it is encouragingto note that the variance explained over the indepen-dent dataset from 1900 to 1948 shows similar levels ofvariance explained [47% (1900–48) compared with52% (1949–2005) in the dependent dataset]. This levelof forecast degradation is slightly less than what wouldbe expected from jackknife or cross-validation regres-sion techniques (Elsner and Schmertmann 1994). In across-validation exercise, the year that is being hindcastis omitted from the development dataset. This exerciseis generally considered to provide an upper bound onlikely real-time forecast skill for the statistical scheme.When cross-validation is applied to the 1949–2005 de-pendent dataset, the variance explained over the periodis 42%, which is smaller than the variance explained inthe independent dataset. This adds increased confi-dence that this forecast scheme is quite stable betweentime periods and should be reasonably skillful in thefuture. The prediction scheme shows remarkable skillover the entire time period (1900–2005), explaining63% of the variance in NTC activity over the past106 yr.
Table 6 displays hindcasts of post–1 August NTC byyear from 1949 to 2005, using equations developed onthe full 1949–2005 period. The hindcast scheme im-proves upon a climatological forecast by 35% for aver-age error, 52% for mean square error, and 31% forroot-mean-square error. It should be noted that thehindcasts tend to underestimate NTC during warmAMO periods while hindcasts tend to overestimateNTC during cool AMO periods. This is to be expected,
TABLE 3. Locations of predictors utilized in the new 1 Augforecast for Atlantic basin hurricane activity. The sign of the pre-dictor associated with increased Atlantic basin tropical cycloneactivity is in parentheses.
PredictorNo. Predictor name Location
1 Jun–Jul SST in thesubtropical Atlantic (�)
20°–40°N, 35°–15°W
2 Jun–Jul SLP in thetropical and subtropicalAtlantic (�)
10°–20°N, 60°–10°W
3 Jun–Jul Niño-3 SST index(�)
5°S–5°N, 150°–90°W
4 Before 1 Aug tropicalAtlantic named stormdays (�)
South of 23.5°N, eastof 75°W
TABLE 4. Stepwise regression technique showing the improvement in variance explained for NTC with the addition of predictors tothe August forecast scheme for seasonal Atlantic basin hurricane activity from 1949–89, 1990–2005, 1900–48, and 1900–2005, respec-tively. The variance explained values are calculated based on equations developed over 1949–89. Predictor numbers are the same as inTable 3.
Predictor No. 1949–89 (r2) (41 yr) 1990–2005 (r2) (16 yr) 1900–48 (r2) (49 yr) 1949–2005 (r2) (57 yr) 1900–2005 (r2) (106 yr)
1 0.16 0.41 0.23 0.25 0.321, 2 0.39 0.56 0.32 0.37 0.451, 2, 3 0.43 0.67 0.38 0.41 0.511, 2, 3, 4 0.45 0.71 0.45 0.49 0.60
942 W E A T H E R A N D F O R E C A S T I N G VOLUME 22

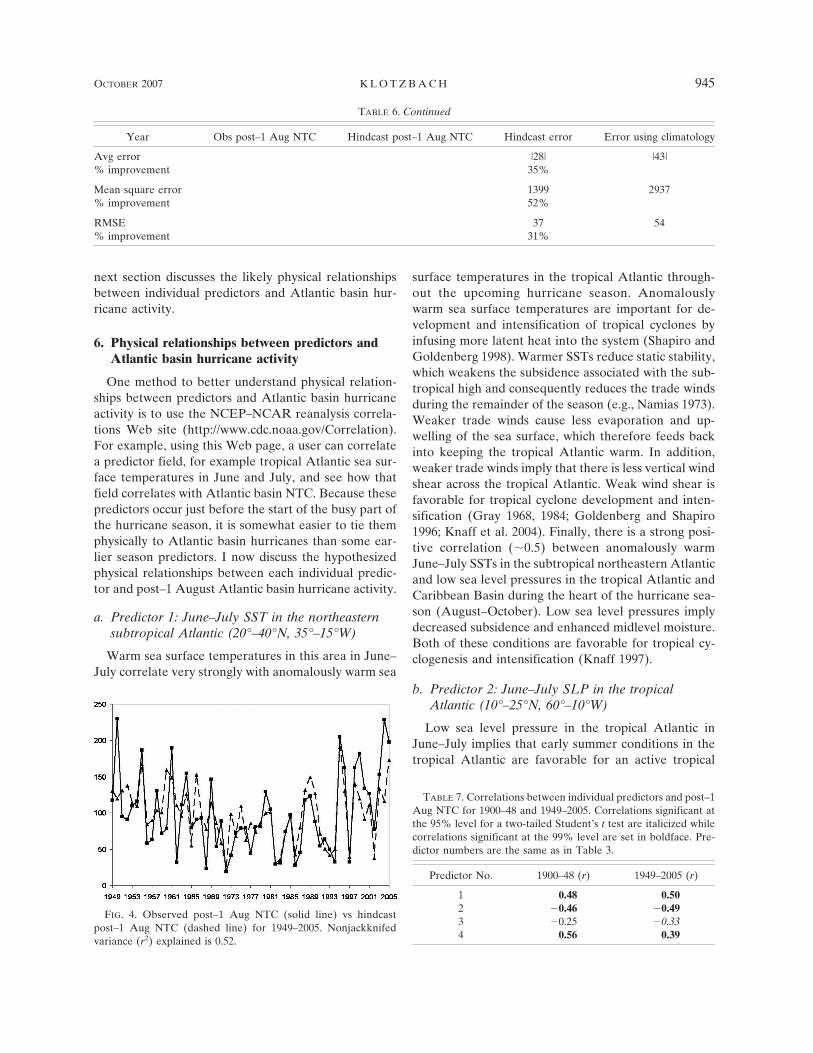
because statistical techniques based on linear regres-sion analysis are conservative by their definition. Fig-ure 4 displays a time series of post–1 August NTC hind-casts compared with observed post–1 August NTCfrom 1949 to 2005. Note that the hindcasts generallyfollow the observations quite closely, as evidenced bythe 52% variance explained over the 1949–2005 timeperiod.
Table 7 displays the individual correlations betweeneach predictor and post–1 August NTC for the de-pendent dataset of 1949–2005 and the independentdataset of 1900–48. The statistical significance of eachpredictor is tested using a two-tailed Student’s t test.Although several of these predictors had already beenknown to be related to upcoming hurricane activity, itwas decided to use a two-tailed Student’s t test in orderto be conservative with statistical significance esti-mates.
For the 1949–2005 time period, a correlation of 0.26is required for 95% significance and a correlation of0.34 is required for 99% significance. For the 1900–48time period, a correlation of 0.28 is required for 95%significance and a correlation of 0.37 is required for99% significance. All correlations are significant at the95% level except for the Niño-3 index from 1900 to1948. However, this correlation is just slightly below the95% level, and it has been well documented that ENSOeffects Atlantic hurricane activity (Gray 1984; Golden-berg and Shapiro 1996; Klotzbach and Gray 2004). Inaddition, the quality of sea surface temperature dataprior to 1949 is somewhat suspect, especially in data-void regions such as Niño-3. In earlier-period SSTdatasets such as the Hadley SST dataset during the pe-riod 1900–48, EOF analysis was used to spatiallysmooth data, and therefore, some of the predictive sig-nal may have been lost in the smoothing. The stabilityof the correlations in both dependent and independentdatasets gives us increased confidence in the use ofthese predictors in the forecast scheme.
Table 8 displays the intercorrelations between thefour predictors over the dependent dataset from 1949to 2005, while Table 9 displays these intercorrelationsover the independent dataset from 1900 to 1948. Allcorrelations are below r � |0.4| (r2 � 0.16). There is amarginally significant (90% level) negative correlationbetween the subtropical Atlantic SST and the tropicalAtlantic SLP predictor over both time periods (1949–2005 and 1900–48). This is to be expected, as higher sealevel pressure values indicate stronger trade winds,driving more upwelling and cooling sea surface tem-peratures. However, the location of these two predic-tors is such that they are only weakly positively corre-lated, and there is considerable additional informationadded by considering both predictors. The correlationstend to be fairly stable between the two time periods.Having predictors that are mostly independent of eachother is important, because this implies that new inde-pendent information is being added to the scheme withthe addition of another predictor. The independence ofthese predictors is not surprising, as it has already beennoted that each predictor added at least an additional2% of the variance to the forecast scheme.
As was briefly mentioned earlier, the forecastscheme works quite well on independent data. Usingthe exact same equations as were used from 1949 to2005, 47% of the variance is explained over the 1900–48time period. It is interesting to note that NTC valuesare overforecast considerably during the first part ofthe twentieth century. The mean for observed NTCfrom 1900 to 1948 is 68, while the mean for predictedNTC from 1900 to 1948 is 97 based on equations de-veloped on 1949–2005 data. This is likely because theobservational network during the first part of the twen-tieth century missed several tropical cyclones each year,especially systems that formed and dissipated over theopen Atlantic. Therefore, observed NTC values duringthe first part of the twentieth century are most likelyunderestimated somewhat.
Equations for the 1900–48 time period using data forthat same time period are then developed. In a sense,this is making the earlier period also a hindcast dataset.The variance explained only increases slightly when thisis done (improves r2 from 47% to 51%), but it removesany NTC over- or underestimate, because the equa-tions are now trained to the earlier-period dataset. Fig-ure 5 displays a time series of post–1 August NTC hind-casts compared with observed post–1 August NTCfrom 1900 to 1948 using these new equations.
The stability of the forecast scheme and the stabilityof the individual correlations between predictors andpost–1 August NTC gives increased confidence that thisforecast scheme will likely have long-term stability. The
TABLE 5. Stepwise regression technique showing the improve-ment in variance explained for NTC with the addition of predic-tors to the August forecast scheme for seasonal Atlantic basinhurricane activity from 1949–2005, 1900–48, and 1900–2005. Thevariance explained values are calculated based on equations de-veloped over 1949–2005. Predictor numbers are the same as inTable 3.
Predictor No.1949–2005(r2) (57 yr)
1900–48(r2) (49 yr)
1900–2005(r2) (106 yr)
1 0.25 0.23 0.321, 2 0.38 0.34 0.471, 2, 3 0.43 0.39 0.531, 2, 3, 4 0.52 0.47 0.63
OCTOBER 2007 K L O T Z B A C H 943

TABLE 6. Observed post–1 Aug NTC, hindcast post–1 Aug NTC, hindcast error, and error using a climatological forecast of post–1Aug NTC of 92. Hindcast values are derived from equations based on the 1949–2005 period.
Year Obs post–1 Aug NTC Hindcast post–1 Aug NTC Hindcast error Error using climatology
1949 117 131 �14 251950 230 120 110 1381951 95 131 36 �31952 91 138 �47 �11953 110 114 �4 181954 116 110 6 241955 187 167 20 951956 58 84 �26 �341957 63 90 �27 �291958 131 104 27 391959 72 100 �28 �201960 79 160 �81 �131961 190 149 41 981962 32 111 �79 �601963 111 96 15 191964 155 126 29 631965 79 55 24 �131966 91 153 �62 �11967 93 95 �2 11968 23 78 �55 �691969 146 114 32 541970 54 86 �32 �381971 89 59 30 �31972 19 22 �3 �731973 42 99 �57 �501974 72 69 3 �201975 79 109 �30 �131976 79 63 16 �131977 45 86 �41 �471978 81 74 7 �111979 81 87 �6 �111980 129 100 29 371981 105 101 4 131982 30 30 0 �621983 31 36 �5 �611984 74 75 �1 �181985 97 95 2 51986 28 43 �15 �641987 46 80 �34 �461988 118 132 �14 261989 123 149 �26 311990 88 127 �39 �41991 54 71 �17 �381992 64 51 13 �281993 50 42 8 �421994 32 50 �18 �601995 205 191 14 1131996 163 130 33 711997 33 39 �6 �591998 163 140 23 711999 182 120 62 902000 134 92 42 422001 127 111 16 352002 78 38 40 �142003 153 133 20 612004 228 116 112 1362005 198 173 25 106
944 W E A T H E R A N D F O R E C A S T I N G VOLUME 22
next section discusses the likely physical relationshipsbetween individual predictors and Atlantic basin hur-ricane activity.
6. Physical relationships between predictors andAtlantic basin hurricane activity
One method to better understand physical relation-ships between predictors and Atlantic basin hurricaneactivity is to use the NCEP–NCAR reanalysis correla-tions Web site (http://www.cdc.noaa.gov/Correlation).For example, using this Web page, a user can correlatea predictor field, for example tropical Atlantic sea sur-face temperatures in June and July, and see how thatfield correlates with Atlantic basin NTC. Because thesepredictors occur just before the start of the busy part ofthe hurricane season, it is somewhat easier to tie themphysically to Atlantic basin hurricanes than some ear-lier season predictors. I now discuss the hypothesizedphysical relationships between each individual predic-tor and post–1 August Atlantic basin hurricane activity.
a. Predictor 1: June–July SST in the northeasternsubtropical Atlantic (20°–40°N, 35°–15°W)
Warm sea surface temperatures in this area in June–July correlate very strongly with anomalously warm sea
surface temperatures in the tropical Atlantic through-out the upcoming hurricane season. Anomalouslywarm sea surface temperatures are important for de-velopment and intensification of tropical cyclones byinfusing more latent heat into the system (Shapiro andGoldenberg 1998). Warmer SSTs reduce static stability,which weakens the subsidence associated with the sub-tropical high and consequently reduces the trade windsduring the remainder of the season (e.g., Namias 1973).Weaker trade winds cause less evaporation and up-welling of the sea surface, which therefore feeds backinto keeping the tropical Atlantic warm. In addition,weaker trade winds imply that there is less vertical windshear across the tropical Atlantic. Weak wind shear isfavorable for tropical cyclone development and inten-sification (Gray 1968, 1984; Goldenberg and Shapiro1996; Knaff et al. 2004). Finally, there is a strong posi-tive correlation (�0.5) between anomalously warmJune–July SSTs in the subtropical northeastern Atlanticand low sea level pressures in the tropical Atlantic andCaribbean Basin during the heart of the hurricane sea-son (August–October). Low sea level pressures implydecreased subsidence and enhanced midlevel moisture.Both of these conditions are favorable for tropical cy-clogenesis and intensification (Knaff 1997).
b. Predictor 2: June–July SLP in the tropicalAtlantic (10°–25°N, 60°–10°W)
Low sea level pressure in the tropical Atlantic inJune–July implies that early summer conditions in thetropical Atlantic are favorable for an active tropical
FIG. 4. Observed post–1 Aug NTC (solid line) vs hindcastpost–1 Aug NTC (dashed line) for 1949–2005. Nonjackknifedvariance (r2) explained is 0.52.
TABLE 7. Correlations between individual predictors and post–1Aug NTC for 1900–48 and 1949–2005. Correlations significant atthe 95% level for a two-tailed Student’s t test are italicized whilecorrelations significant at the 99% level are set in boldface. Pre-dictor numbers are the same as in Table 3.
Predictor No. 1900–48 (r) 1949–2005 (r)
1 0.48 0.502 �0.46 �0.493 �0.25 �0.334 0.56 0.39
TABLE 6. Continued
Year Obs post–1 Aug NTC Hindcast post–1 Aug NTC Hindcast error Error using climatology
Avg error |28| |43|% improvement 35%
Mean square error 1399 2937% improvement 52%
RMSE 37 54% improvement 31%
OCTOBER 2007 K L O T Z B A C H 945

cyclone season with increased vertical motion, de-creased stability, and enhanced midlevel moisture.There is a strong autocorrelation (r � 0.5) betweenJune–July sea level pressure anomalies and August–October sea level pressure anomalies in the tropicalAtlantic. Low sea level pressure in the tropical Atlanticalso correlates quite strongly (r � 0.5) with reducedtrade winds (weaker easterlies) and anomalously east-erly upper-level winds (weaker westerlies). The combi-nation of these two features implies weaker verticalwind shear and therefore more favorable conditions fortropical cyclone development in the Atlantic (Gray1968, 1984; Goldenberg and Shapiro 1996). In addition,lower-than-normal sea level pressure usually indicatesmore midlevel moisture, which is an important ingredi-ent for tropical cyclone genesis and intensification(Gray 1968).
c. Predictor 3: June–July Niño-3 index (5°S–5°N,150°–90°W)
Cool sea surface temperatures in the Niño-3 regionduring June–July imply that a La Niña event is cur-rently present. In general, positive or negative anoma-lies in the Niño-3 region during the early summer per-sist throughout the remainder of the summer and fall.El Niño conditions shift the center of the Walker cir-culation eastward, which causes increased convectionover the central and eastern tropical Pacific. This in-creased convection in the central and eastern Pacificmanifests itself in anomalous upper-level westerliesacross the Caribbean and tropical Atlantic, thereby in-creasing vertical wind shear and reducing Atlantic basin
hurricane activity. The relationship between ENSO andAtlantic hurricane activity has been well documented inthe literature (e.g., Gray 1984; Goldenberg and Shapiro1996; Elsner 2003; Bell and Chelliah 2006).
d. Predictor 4: Named storm days south of 23.5°N,east of 75°W
Most years do not have named storm formations inJune and July in the tropical Atlantic; however, if tropi-cal Atlantic formations do occur, it indicates that anactive hurricane season is likely. For example, the 6 yrwith the most named storm days in the deep Tropics inJune and July (since 1949) are 1966, 1969, 1995, 1996,1998, and 2005. All six of these seasons were very ac-tive. When storms form in the deep Tropics in the earlypart of the hurricane season, it indicates that conditionsare already very favorable for TC development. In gen-eral, the start of the hurricane season is restricted bythermodynamics (warm SSTs, unstable lapse rates, andmidlevel moisture) (DeMaria et al. 2001), and thereforedeep tropical activity early in the hurricane season im-plies that the thermodynamics in the tropical Atlanticare already quite favorable for tropical cyclone (TC)development. Also, this predictor’s correlation withseasonal NTC is 0.39 over the 1949–2005 period, andwhen tested on independent data (1900–48), the corre-lation actually improves to 0.56, which gives us in-creased confidence in its use as a seasonal predictor.
7. Post–1 August NTC prediction and U.S.landfalling hurricanes
It has been shown in previous forecast papers thatthere is a strong relationship between hindcast values of
FIG. 5. Observed post–1 Aug NTC (solid line) vs hindcastpost–1 August NTC (dashed line) for 1900–48. Nonjackknifedvariance (r2) explained is 0.51.
TABLE 8. Intercorrelations between predictors over the depen-dent dataset from 1949 to 2005. Predictor numbers are the same asin Table 3.
Predictor No. 1 2 3 4
1 — �0.28 0.02 0.142 �0.28 — 0.36 �0.173 0.02 0.36 — 0.014 0.14 �0.17 0.01 —
TABLE 9. Intercorrelations between predictors over the inde-pendent dataset from 1900 to 1948. Predictor numbers are thesame as in Table 3.
Predictor No. 1 2 3 4
1 — �0.32 �0.02 0.322 �0.32 — 0.04 �0.363 �0.02 0.04 — �0.214 0.32 �0.36 �0.21 —
946 W E A T H E R A N D F O R E C A S T I N G VOLUME 22

NTC and U.S. landfalling tropical cyclones (Klotzbachand Gray 2003; Blake and Gray 2004; Klotzbach andGray 2004). These relationships are usually strongestfor major hurricanes, which are the storms that are ofgreatest importance. Major hurricanes, although ac-counting for only 20%–25% of all named storms, doapproximately 80%–85% of the total economic damagewhen normalized by population, inflation, and wealthper capita (Pielke and Landsea 1998). The relationshipbetween landfalling tropical cyclones after 1 Augustand hindcast values of post–1 August NTC is quite sig-nificant. For example, using the hindcast equations de-veloped over the 1949–2005 period, in the 10 yr from1949 to 2005, where the largest values of NTC werehindcast, 23 hurricanes made U.S. landfall after 1 Au-gust compared with only 9 hurricanes in the 10 yr withthe lowest hindcast NTC values—a ratio of greater than2.5 to 1. Eight major hurricanes made landfall in the topfive hindcasts compared with only one major hurricanein the five lowest hindcasts. Table 10 displays landfall-ing named storms, hurricanes, and major hurricanes forthe U.S. east coast (EC), the Gulf coast (GC) and U.S.coastline for the top 5–bottom 5, top 10–bottom 10, andtop 15–bottom 15 NTC hindcast values from 1949 to2005. For reference, the EC–GC breakdown for land-falling storms is approximately 100 mi north of Tampa,Florida. Storms making landfall in southwest Florida,including the Florida Keys, are counted as EC storms inthis analysis. The breakdown of the coastline was donethis way, because, in general, storms making landfallalong the Florida panhandle and westward tend to havetheir genesis in the Gulf of Mexico, while storms insouthwest Florida and eastward tend to have their gen-esis in the North Atlantic.
To provide a visualization of some of the significantdifferences between storms making landfall in high andlow NTC hindcast years, Fig. 6 displays EC landfallinghurricanes for the top 10 and bottom 10 NTC hindcast
years. Thirteen storms made landfall in the top 10 NTChindcast years compared with only four storms in thebottom 10 NTC hindcast years.
These ratios become even stronger in the indepen-dent dataset from 1900 to 1948 (Table 11). The equa-
TABLE 10. Number and ratio of landfalling named storms (NS), hurricanes (H), and major hurricanes (MH) for the United States(US), EC, and GC for the top 5 and bottom 5, the top 10 and bottom 10, and the top 15 and bottom 15 post 1–Aug NTC hindcast yearsfrom 1949 to 2005.
Hindcastlandfall occurrences US NS US H US MH EC NS EC H EC MH GC NS GC H GC MH
Top 5 18 14 8 11 9 5 7 5 3Bottom 5 13 3 1 5 0 0 8 3 1Ratio (%) 138 467 800 220 n/a n/a 88 167 300Top 10 35 23 10 18 13 6 17 10 4Bottom 10 23 9 6 12 4 3 11 5 3Ratio (%) 152 256 167 150 325 200 155 200 133Top 15 46 28 12 25 16 8 21 12 4Bottom 15 33 15 7 18 7 3 15 8 4Ratio (%) 139 187 171 139 229 267 140 150 100
FIG. 6. Hurricanes making landfall along the east coast of theUnited States in the top 10 and bottom 10 NTC hindcast yearsfrom 1949 to 2005. Dotted lines represent tropical storm strength,thin solid lines represent hurricane strength, and thick solid linesrepresent major hurricane strength.
OCTOBER 2007 K L O T Z B A C H 947
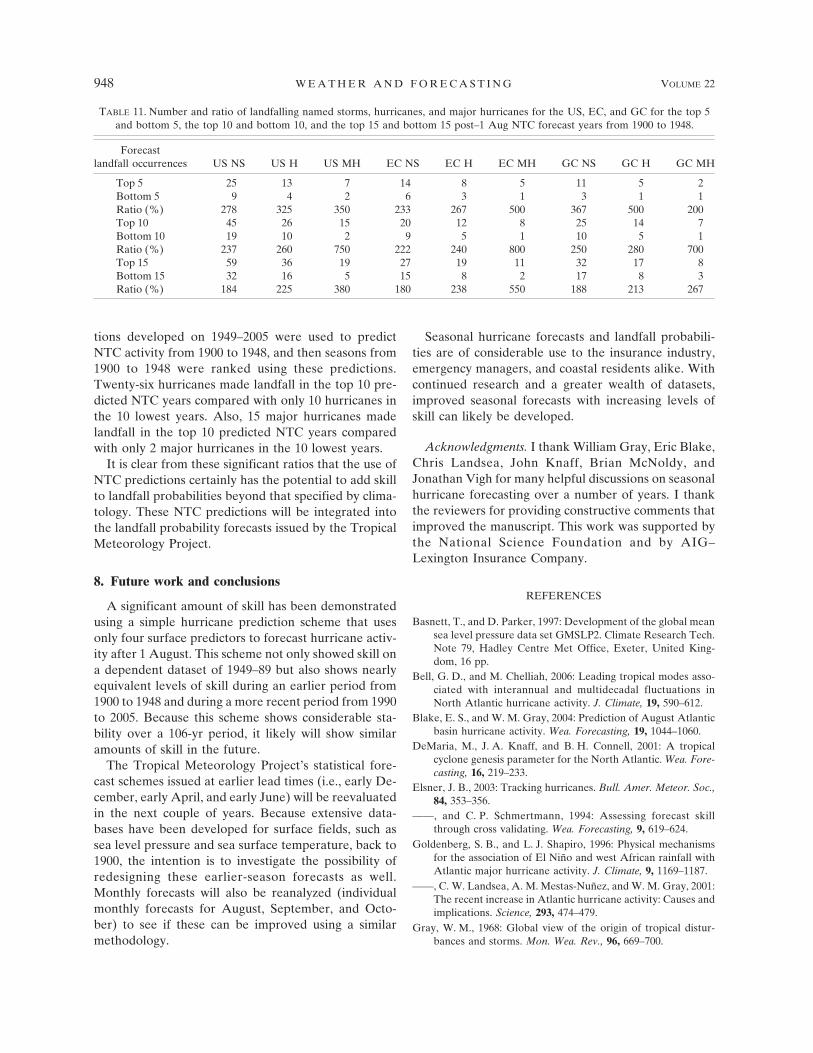
tions developed on 1949–2005 were used to predictNTC activity from 1900 to 1948, and then seasons from1900 to 1948 were ranked using these predictions.Twenty-six hurricanes made landfall in the top 10 pre-dicted NTC years compared with only 10 hurricanes inthe 10 lowest years. Also, 15 major hurricanes madelandfall in the top 10 predicted NTC years comparedwith only 2 major hurricanes in the 10 lowest years.
It is clear from these significant ratios that the use ofNTC predictions certainly has the potential to add skillto landfall probabilities beyond that specified by clima-tology. These NTC predictions will be integrated intothe landfall probability forecasts issued by the TropicalMeteorology Project.
8. Future work and conclusions
A significant amount of skill has been demonstratedusing a simple hurricane prediction scheme that usesonly four surface predictors to forecast hurricane activ-ity after 1 August. This scheme not only showed skill ona dependent dataset of 1949–89 but also shows nearlyequivalent levels of skill during an earlier period from1900 to 1948 and during a more recent period from 1990to 2005. Because this scheme shows considerable sta-bility over a 106-yr period, it likely will show similaramounts of skill in the future.
The Tropical Meteorology Project’s statistical fore-cast schemes issued at earlier lead times (i.e., early De-cember, early April, and early June) will be reevaluatedin the next couple of years. Because extensive data-bases have been developed for surface fields, such assea level pressure and sea surface temperature, back to1900, the intention is to investigate the possibility ofredesigning these earlier-season forecasts as well.Monthly forecasts will also be reanalyzed (individualmonthly forecasts for August, September, and Octo-ber) to see if these can be improved using a similarmethodology.
Seasonal hurricane forecasts and landfall probabili-ties are of considerable use to the insurance industry,emergency managers, and coastal residents alike. Withcontinued research and a greater wealth of datasets,improved seasonal forecasts with increasing levels ofskill can likely be developed.
Acknowledgments. I thank William Gray, Eric Blake,Chris Landsea, John Knaff, Brian McNoldy, andJonathan Vigh for many helpful discussions on seasonalhurricane forecasting over a number of years. I thankthe reviewers for providing constructive comments thatimproved the manuscript. This work was supported bythe National Science Foundation and by AIG–Lexington Insurance Company.
REFERENCES
Basnett, T., and D. Parker, 1997: Development of the global meansea level pressure data set GMSLP2. Climate Research Tech.Note 79, Hadley Centre Met Office, Exeter, United King-dom, 16 pp.
Bell, G. D., and M. Chelliah, 2006: Leading tropical modes asso-ciated with interannual and multidecadal fluctuations inNorth Atlantic hurricane activity. J. Climate, 19, 590–612.
Blake, E. S., and W. M. Gray, 2004: Prediction of August Atlanticbasin hurricane activity. Wea. Forecasting, 19, 1044–1060.
DeMaria, M., J. A. Knaff, and B. H. Connell, 2001: A tropicalcyclone genesis parameter for the North Atlantic. Wea. Fore-casting, 16, 219–233.
Elsner, J. B., 2003: Tracking hurricanes. Bull. Amer. Meteor. Soc.,84, 353–356.
——, and C. P. Schmertmann, 1994: Assessing forecast skillthrough cross validating. Wea. Forecasting, 9, 619–624.
Goldenberg, S. B., and L. J. Shapiro, 1996: Physical mechanismsfor the association of El Niño and west African rainfall withAtlantic major hurricane activity. J. Climate, 9, 1169–1187.
——, C. W. Landsea, A. M. Mestas-Nuñez, and W. M. Gray, 2001:The recent increase in Atlantic hurricane activity: Causes andimplications. Science, 293, 474–479.
Gray, W. M., 1968: Global view of the origin of tropical distur-bances and storms. Mon. Wea. Rev., 96, 669–700.
TABLE 11. Number and ratio of landfalling named storms, hurricanes, and major hurricanes for the US, EC, and GC for the top 5and bottom 5, the top 10 and bottom 10, and the top 15 and bottom 15 post–1 Aug NTC forecast years from 1900 to 1948.
Forecastlandfall occurrences US NS US H US MH EC NS EC H EC MH GC NS GC H GC MH
Top 5 25 13 7 14 8 5 11 5 2Bottom 5 9 4 2 6 3 1 3 1 1Ratio (%) 278 325 350 233 267 500 367 500 200Top 10 45 26 15 20 12 8 25 14 7Bottom 10 19 10 2 9 5 1 10 5 1Ratio (%) 237 260 750 222 240 800 250 280 700Top 15 59 36 19 27 19 11 32 17 8Bottom 15 32 16 5 15 8 2 17 8 3Ratio (%) 184 225 380 180 238 550 188 213 267
948 W E A T H E R A N D F O R E C A S T I N G VOLUME 22

——, 1984: Atlantic seasonal hurricane frequency. Part II: Fore-casting its variability. Mon. Wea. Rev., 112, 1669–1683.
——, C. W. Landsea, P. W. Mielke, and K. J. Berry, 1992: Pre-dicting Atlantic seasonal hurricane activity 6–11 months inadvance. Wea. Forecasting, 7, 440–455.
——, ——, ——, and ——, 1993: Predicting Atlantic basin sea-sonal tropical cyclone activity by 1 August. Wea. Forecasting,8, 73–86.
——, ——, ——, and ——, 1994: Predicting Atlantic basin sea-sonal tropical cyclone activity by 1 June. Wea. Forecasting, 9,103–115.
——, J. D. Sheaffer, and C. W. Landsea, 1997: Climate trendsassociated with multi-decadal variability of Atlantic hurri-cane activity. Hurricanes: Climate and Socioeconomic Im-pacts, H. F. Diaz and R. S. Pulwarty, Eds., Springer-Verlag,15–53.
——, C. W. Landsea, E. S. Blake, P. W. Mielke, and K. J. Berry,2001: Updated early August forecast of Atlantic seasonalhurricane activity and U.S. landfall strike probability for2001. Dept. of Atmospheric Science Rep., Colorado StateUniversity, Fort Collins, CO, 30 pp.
Hess, J. C., and J. B. Elsner, 1994: Historical developments lead-ing to current forecast models of annual Atlantic hurricaneactivity. Bull. Amer. Meteor. Soc., 75, 1611–1622.
Jarvinen, B. R., C. J. Neumann, and M. A. S. Davis, 1984: A tropi-cal cyclone data tape for the North Atlantic basin, 1886–1983:Contents, limitations, and uses. NOAA Tech. Memo. NWSNHC 22, Miami, FL, 21 pp.
Kalnay, E., and Coauthors, 1996: The NCEP/NCAR 40-Year Re-analysis Project. Bull. Amer. Meteor. Soc., 77, 437–471.
Kaplan, A., M. Cane, Y. Kushnir, A. Clement, M. Blumenthal,and B. Rajagopalan, 1998: Analyses of global sea surfacetemperature 1856–1991. J. Geophys. Res., 103, 567–589.
Kistler, R., and Coauthors, 2001: The NCEP–NCAR 50-Year Re-analysis: Monthly means CD-ROM and documentation. Bull.Amer. Meteor. Soc., 82, 247–267.
Klotzbach, P. J., and W. M. Gray, 2003: Forecasting September
Atlantic basin tropical cyclone activity. Wea. Forecasting, 18,1109–1128.
——, and ——, 2004: Updated 6–11-month prediction of Atlanticbasin seasonal hurricane activity. Wea. Forecasting, 19, 917–934.
Knaff, J. A., 1997: Implications of summertime sea level pressureanomalies in the tropical Atlantic region. J. Climate, 10, 789–804.
——, S. A. Seseske, M. DeMaria, and J. L. Demuth, 2004: On theinfluences of vertical wind shear on symmetrical tropical cy-clone structure derived from AMSU. Mon. Wea. Rev., 132,2503–2510.
Landsea, C. W., and W. M. Gray, 1992: The strong associationbetween western Sahelian monsoon rainfall and intense At-lantic hurricanes. J. Climate, 5, 435–453.
——, and Coauthors, 2004: The Atlantic hurricane database re-analysis project: Documentation for the 1851–1910 alter-ations and additions to the HURDAT database. Hurricanesand Typhoons: Past, Present and Future, R. J. Murnane andK.-B. Liu, Eds., Columbia University Press, 177–221.
Namias, J., 1973: Thermal communication between the sea surfaceand the lower troposphere. J. Phys. Oceanogr., 3, 373–378.
Pielke, R. A., Jr., and C. W. Landsea, 1998: Normalized hurricanedamage in the United States: 1925–95. Wea. Forecasting, 13,621–631.
Rayner, N. A., D. E. Parker, E. B. Horton, C. K. Folland, L. V.Alexander, D. P. Rowell, E. C. Kent, and A. Kaplan, 2003:Globally complete analyses of sea surface temperature, seaice and night marine air temperature, 1871–2000. J. Geophys.Res., 108, 4407, doi:10.1029/2002JD002670.
Shapiro, L. J., and S. B. Goldenberg, 1998: Atlantic sea surfacetemperatures and tropical cyclone formation. J. Climate, 11,578–590.
Simpson, R. H., 1974: The hurricane disaster potential scale.Weatherwise, 27, 169, 186.
Wilks, D. S., 1995: Statistical Methods in the Atmospheric Sciences:An Introduction. Academic Press, 464 pp.
OCTOBER 2007 K L O T Z B A C H 949