at-a-glance school and district profiles technical manual
TRANSCRIPT
AT-A-GLANCE SCHOOL
AND DISTRICT PROFILES
2020-2021 TECHNICAL MANUAL
2
TABLE OF CONTENTS
Updates & Changes ......................................................................................................................... 3
What are the At-A-Glance Profiles? ................................................................................................ 4
Staff Responsibilities & Contact List ............................................................................................... 6
Elementary/Middle and High School Profiles ................................................................................. 7
Students We Serve ...................................................................................................................... 7
Special Note ................................................................................................................................ 9
School Environment .................................................................................................................... 9
Academic Progress .................................................................................................................... 10
Academic Success ..................................................................................................................... 11
Our Staff (rounded FTE) ............................................................................................................ 13
Outcomes .................................................................................................................................. 16
About Our School ...................................................................................................................... 18
District Profiles .............................................................................................................................. 19
Students We Serve .................................................................................................................... 19
Special Note .............................................................................................................................. 21
Start Strong ............................................................................................................................... 21
High School Success .................................................................................................................. 22
District and State Goals ............................................................................................................. 24
Our Staff (rounded FTE) ............................................................................................................ 24
Outcomes .................................................................................................................................. 26
Table 1: Data Elements Included on At-A-Glance by Institution Type ......................................... 28
3
UPDATES & CHANGES
Updated July 28, 2021
Special Note:
New on the 2020-21 At-A-Glance School and District Profiles is a text section, “Special Note,” that
describes the impact to the data included on the At-A-Glance School and District Profiles and directs the
public to where they can find more information that was not included on the At-A-Glance School and
District Profiles due to space limitations. This new text section is written by the Oregon Department of
Education (ODE) and is the same for each At-A-Glance Profile.
To make room for the “Special Note” on the Elementary/Middle and High School profiles, the Class Size
dial was removed. To find more information on class size, visit the Class Size Report webpage.
To make room for the “Special Note” on the District profile, the Individual Student Progress dial was
removed. The Accountability Waiver that ODE received from the U.S. Department of Education removes
the requirement to calculate and report Individual Student Progress (growth) data. Accordingly, the
student group disaggregations for Individual Student Progress were removed from the back page on the
district profile.
Assessment Data:
Assessment data are not included on the 2020-21 At-A-Glance School and District profiles. The
Assessment Waiver allowed ODE to shorten test blueprints and reduce the number of required
assessments by grade and test subject. Due to the Assessment Waiver and the anticipated impacts to
assessment participation, there is not enough room on the At-A-Glance School and District Profiles to
provide adequate context and caution for interpreting the 2020-21 assessment data.
2020-21 English Language Arts, Math, and Science assessment data will be published on ODE’s webpage
instead.
Regular Attenders Data:
Regular Attenders data are not included on the 2020-21 At-A-Glance School and District profiles. Due to
updates to reporting attendance and the suspension of the 10-Day drop rule in the Cumulative ADM
collection, there is not enough room on the At-A-Glance School and District Profiles to provide adequate
context and caution for interpreting 2020-21 Regular Attendance data.
2020-21 Regular Attenders data will be published on ODE’s webpage instead.
Prior Year Comparison Arrows:
The prior year comparison arrows were removed for all dials on the front page of the At-A-Glance profiles.
4
On-Time Graduation Suppression
The On-Time Graduation data element was updated to apply suppression to the student group
disaggregations. The total school and district level rates remain unsuppressed. See the Outcomes section
for more information.
Free/Reduced Price Lunch:
Schools that offered Free or Reduced Price Lunch to all students regardless of their individual eligibility
will appear as “>95”. In prior report years these were schools operating under the U.S. Department of
Agriculture’s (USDA) Community Eligibility Provision or Provision 2. In 2020-21 this provision expanded to
include schools that participated in the expanded Seamless Summer Option or the Summer Food Service
Program under the USDA’s COVID-19 waiver.
Homeless Student Group:
Homeless students were added as a student group disaggregation for all three At-A-Glance profile types.
Homeless student data is sourced from the 2020-21 McKinney-Vento Homeless collection.
College Going:
Calculation updated to include students that have a postsecondary enrollment start date within 16
months of completing high school. Updated College Going data for students that graduated in 2018-19
will not be available to be included on the 2020-21 At-A-Glance profiles. Instead, the At-A-Glance Profiles
will display previously calculated rates for students that graduated in 2017-18. See the College Going
section for more details.
Our Staff:
Starting with the 2019-20 Adapted At-A-Glance profiles, the Counselor adjusted FTE count was updated
to include Psychologist adjusted FTE on the school profiles. The label for this data point has been updated
to, “Counselors/Psychologists” to reflect the new calculation. See the Counselors/Psychologists section
for more information.
Starting with the 2019-20 Adapted At-A-Glance profiles, the Average Teacher Turnover Rate was replaced
with Average Teacher Retention Rate. See the Average Teacher Retention section for more information.
Starting with the 2019-20 Adapted At-A-Glance profiles, the Teacher Experience calculation was
updated to no longer connect with the Teacher Standards and Practices Commission (TSPC) data.
Instead, licensure for this metric is determined based on the License Flag in the Staff Position collection.
See the Teacher Experience section for more information.
WHAT ARE THE AT-A-GLANCE PROFILES?
The At-A-Glance School and District profiles are published each year alongside the Accountability Detail
sheets. Together, the At-A-Glance School and District Profiles and the Accountability Detail Sheets
5
comprise the Oregon Department of Education’s larger reporting system as required by the Oregon State
legislature and the Every Student Succeeds Act (ESSA). The At-A-Glance School and District Profiles were
designed by and for parents and community members to be an understandable and easy to read overview
of how schools and districts serve their students. For more information on the redesign project, go to the
Report Card Redesign webpage.
The At-A-Glance School and District Profiles do not rate or grade schools and districts and they are not
used to determine levels of support under ESSA.
Districts can preview the data published on the At-A-Glance in the Achievement Data Insight (ADI)
application. District staff should contact their district security administrator for access to the ADI.
All data is based on the 2020-21 school year unless otherwise noted. Exceptions include the On-Time
Graduation, Five-Year Completion, College Going, Teacher Retention, and Same Principal data elements.
The following document provides business rules for the data elements included on the At-A-Glance School
and District Profiles. The data elements included in profiles vary depending on institution type.
There are three profile types: Elementary/Middle, High School, and District. This document is organized
into two sections. This first section describes the data included on the Elementary/Middle and High School
profiles. The second section describes the data included on the District profiles.
6
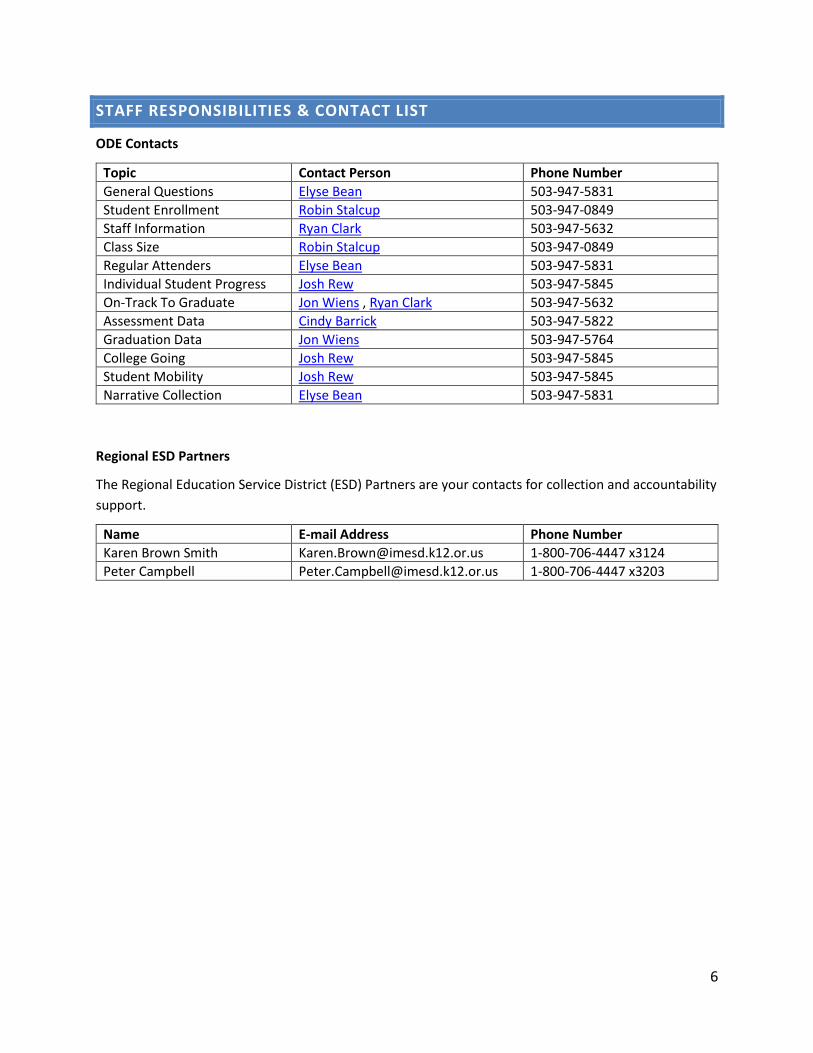
STAFF RESPONSIBILITIES & CONTACT LIST
ODE Contacts
Topic Contact Person Phone Number
General Questions Elyse Bean 503-947-5831
Student Enrollment Robin Stalcup 503-947-0849
Staff Information Ryan Clark 503-947-5632
Class Size Robin Stalcup 503-947-0849
Regular Attenders Elyse Bean 503-947-5831
Individual Student Progress Josh Rew 503-947-5845
On-Track To Graduate Jon Wiens , Ryan Clark 503-947-5632
Assessment Data Cindy Barrick 503-947-5822
Graduation Data Jon Wiens 503-947-5764
College Going Josh Rew 503-947-5845
Student Mobility Josh Rew 503-947-5845
Narrative Collection Elyse Bean 503-947-5831
Regional ESD Partners
The Regional Education Service District (ESD) Partners are your contacts for collection and accountability
support.
Name E-mail Address Phone Number
Karen Brown Smith [email protected] 1-800-706-4447 x3124
Peter Campbell [email protected] 1-800-706-4447 x3203
7
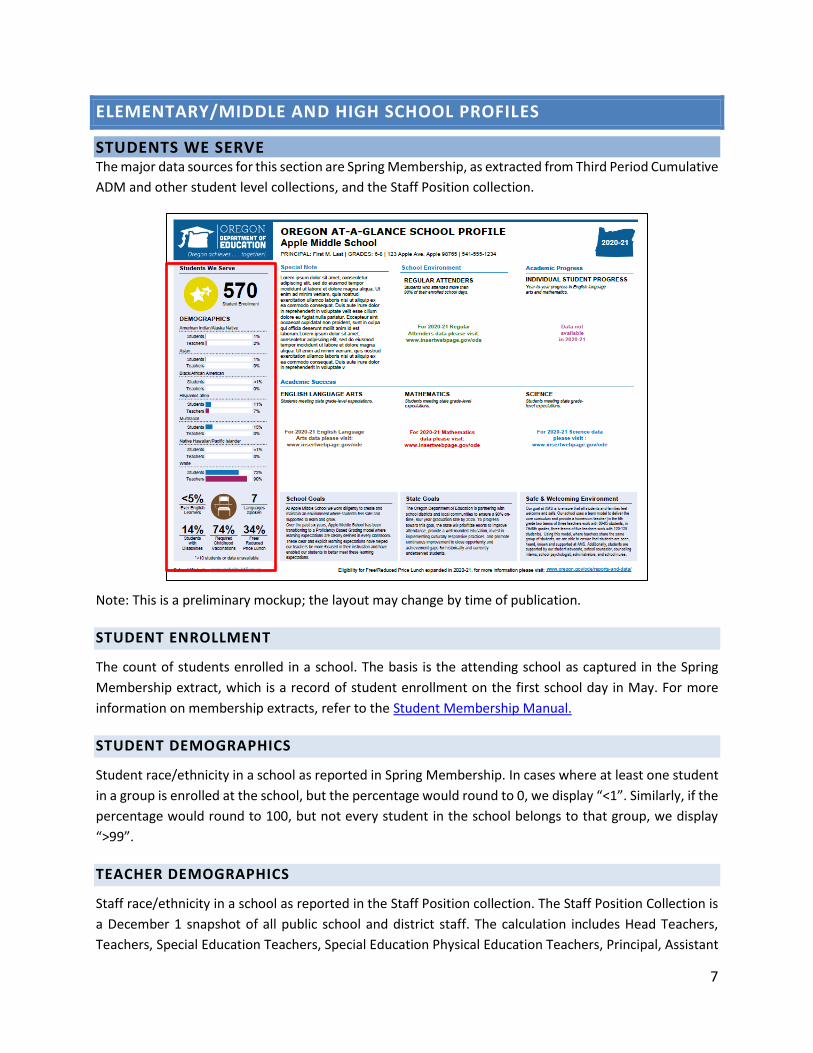
ELEMENTARY/MIDDLE AND HIGH SCHOOL PROFILES
STUDENTS WE SERVE The major data sources for this section are Spring Membership, as extracted from Third Period Cumulative
ADM and other student level collections, and the Staff Position collection.
Note: This is a preliminary mockup; the layout may change by time of publication.
STUDENT ENROLLMENT
The count of students enrolled in a school. The basis is the attending school as captured in the Spring
Membership extract, which is a record of student enrollment on the first school day in May. For more
information on membership extracts, refer to the Student Membership Manual.
STUDENT DEMOGRAPHICS
Student race/ethnicity in a school as reported in Spring Membership. In cases where at least one student
in a group is enrolled at the school, but the percentage would round to 0, we display “<1”. Similarly, if the
percentage would round to 100, but not every student in the school belongs to that group, we display
“>99”.
TEACHER DEMOGRAPHICS
Staff race/ethnicity in a school as reported in the Staff Position collection. The Staff Position Collection is
a December 1 snapshot of all public school and district staff. The calculation includes Head Teachers,
Teachers, Special Education Teachers, Special Education Physical Education Teachers, Principal, Assistant
8
Principal, Licensed Librarians, and Guidance Counselors (position codes 3, 4, 5, 8, 9, 10, 22, or 23). In cases
where at least one staff member in a group is reported at the school, but the percentage would round to
0, we display “<1”. Similarly, if the percentage would round to 100, but not every staff member in the
school belongs to that group, we display “>99”. For more information, refer to Staff Position Manual.
EVER ENGLISH LEARNERS
The percentage of students in Spring Membership who are current or former English learners. The data
source is the Title III English Learners Spring Collection, matched to Spring Membership records. Students
are considered Ever English Learners if they appear in the current year unduplicated Title III English
Learner collection with a record type other than ‘3H’, ‘2J’, ‘SE’, or ‘EI’. The data are suppressed when the
number of students in the denominator is less than ten then this indicator is suppressed with an ‘*’; when
the percentage is less than 5 or greater than 95, we display “<5” and “>95”, respectively.
LANGUAGES SPOKEN
The number of distinct languages in a school as reported in the “Language of Origin” field in Spring
Membership.
STUDENTS WITH DISABILITIES
The percentage of students on an Individualized Education Plan (IEP) at any time in the school year, as
reported in Spring Membership. The data are suppressed when necessary: if the number of students in
the denominator is less than ten then this indicator is suppressed with an ‘*’; when the percentage is less
than 5 or greater than 95, we display “<5” and “>95”, respectively.
REQUIRED CHILDHOOD VACCINATIONS
The percentage of students in a school with all required childhood vaccinations. Note that this does not
include the COVID-19 vaccine. The denominator is attending school enrollment as reported to the Oregon
Health Authority (OHA). The numerator is the total number of students with all required vaccinations. An
‘*’ is displayed for schools where no vaccination data are available. ODE receives immunization data from
the OHA; for more information, go to the OHA’s School Immunization Rates web page.
FREE/REDUCED PRICE LUNCH
The percentage of students in Spring Membership that were eligible for Free or Reduced Price school
meals at any time in the school year, as reported in Spring Membership. The data are suppressed when
the number of students in the denominator is less than ten then this indicator is suppressed with an ‘*’;
when the percentage is less than 5 or greater than 95, we display “<5” and “>95”, respectively.
Note: Schools that offered Free or Reduced Price school meals to all students regardless of their individual
eligibility will appear as “>95”. This includes schools operating under the Community Eligibility Provision,
Provision 2, or schools that participated in the expanded summer meals programs under the U.S.
Department of Agriculture’s COVID-19 waiver.
9
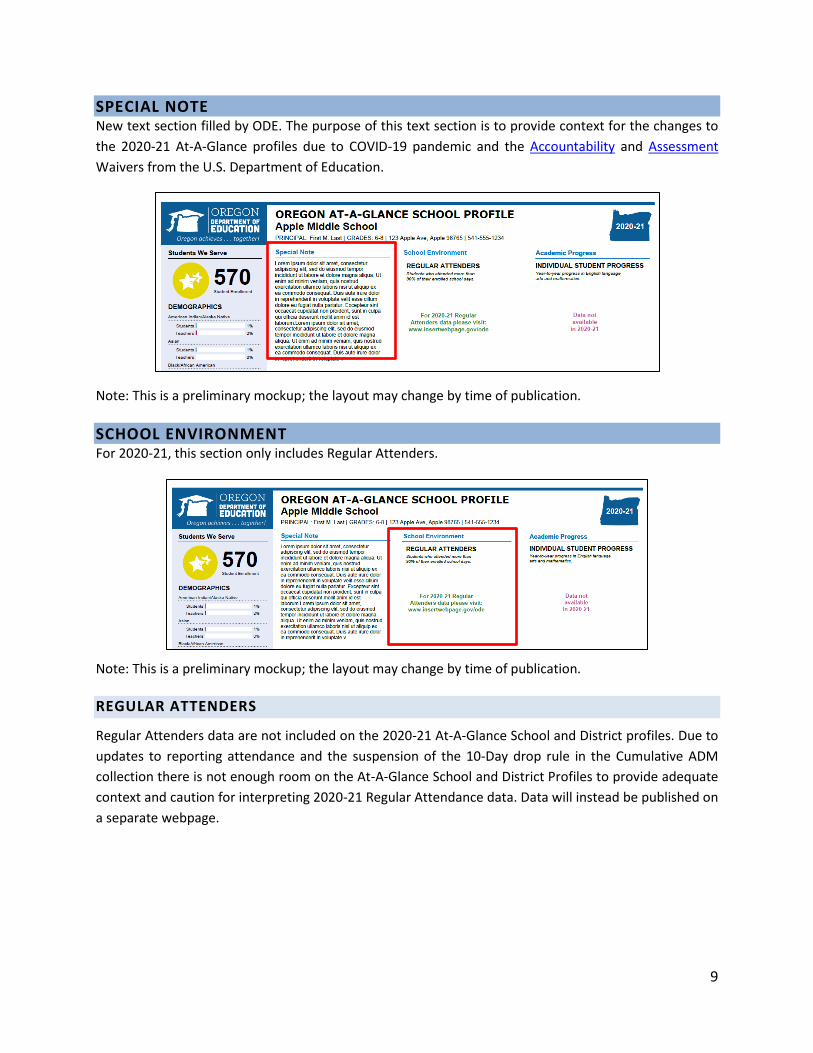
SPECIAL NOTE New text section filled by ODE. The purpose of this text section is to provide context for the changes to
the 2020-21 At-A-Glance profiles due to COVID-19 pandemic and the Accountability and Assessment
Waivers from the U.S. Department of Education.
Note: This is a preliminary mockup; the layout may change by time of publication.
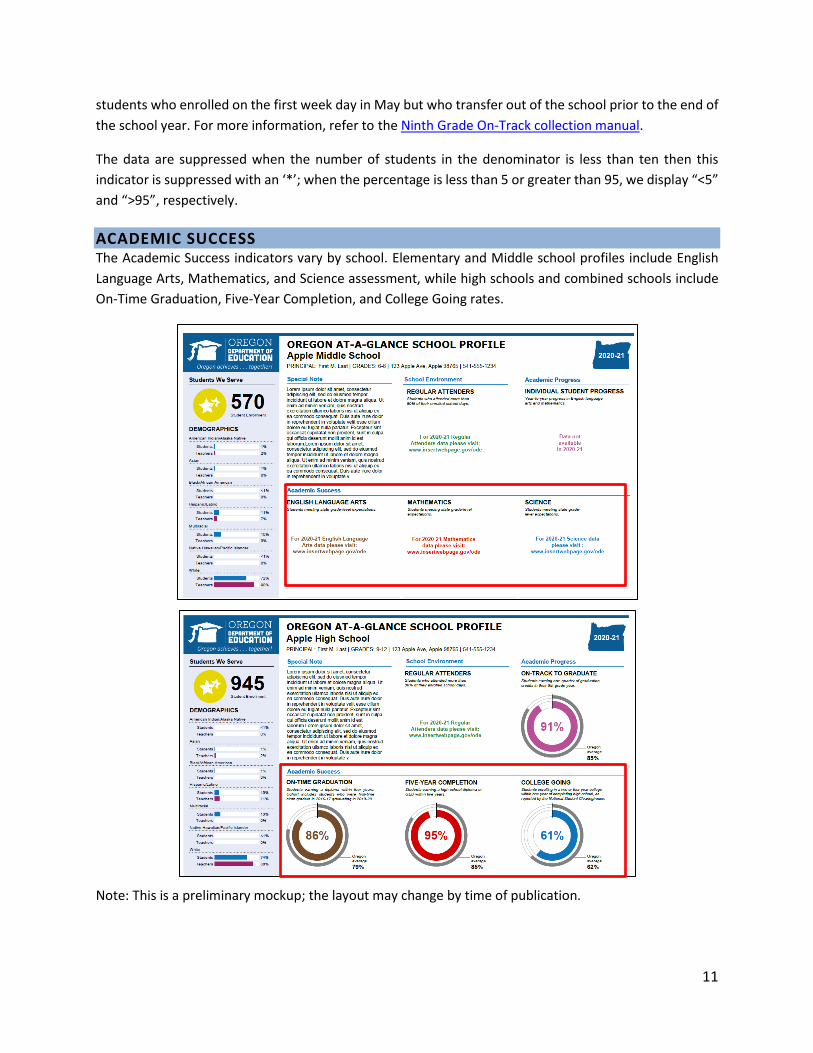
SCHOOL ENVIRONMENT For 2020-21, this section only includes Regular Attenders.
Note: This is a preliminary mockup; the layout may change by time of publication.
REGULAR ATTENDERS
Regular Attenders data are not included on the 2020-21 At-A-Glance School and District profiles. Due to
updates to reporting attendance and the suspension of the 10-Day drop rule in the Cumulative ADM
collection there is not enough room on the At-A-Glance School and District Profiles to provide adequate
context and caution for interpreting 2020-21 Regular Attendance data. Data will instead be published on
a separate webpage.

10
ACADEMIC PROGRESS The Academic Progress indicator varies by school. Elementary and middle school profiles include
Individual Student Progress, based on individual student growth on the English language arts (ELA) and
Mathematics statewide assessments. High schools and combined schools use On-Track to Graduate.
Note: This is a preliminary mockup; the layout may change by time of publication.
INDIVIDUAL STUDENT PROGRESS
Individual Student Progress data are not included on 2020-21 At-A-Glance School and District profiles. The
Accountability Waiver that ODE received from the U.S. Department of Education removes the
requirement to calculate and report Individual Student Progress (growth) data.
ON-TRACK TO GRADUATE
The percentage of students that have earned at least one quarter of their required credits for graduation
in their first year in high school. The denominator is the number of resident students in Spring
Membership that are full academic year at the school and have a high school entry year of 2020-2021.
The numerator is the number of students earning at least one quarter of required credits by August 31,
2021 following their first year in high school.
Students are full academic year if the total ADM for their May 3, 2021 spring membership record is greater
than 0.5 ADM across all of their Third Period Cumulative ADM records. The denominator excludes
11
students who enrolled on the first week day in May but who transfer out of the school prior to the end of
the school year. For more information, refer to the Ninth Grade On-Track collection manual.
The data are suppressed when the number of students in the denominator is less than ten then this
indicator is suppressed with an ‘*’; when the percentage is less than 5 or greater than 95, we display “<5”
and “>95”, respectively.
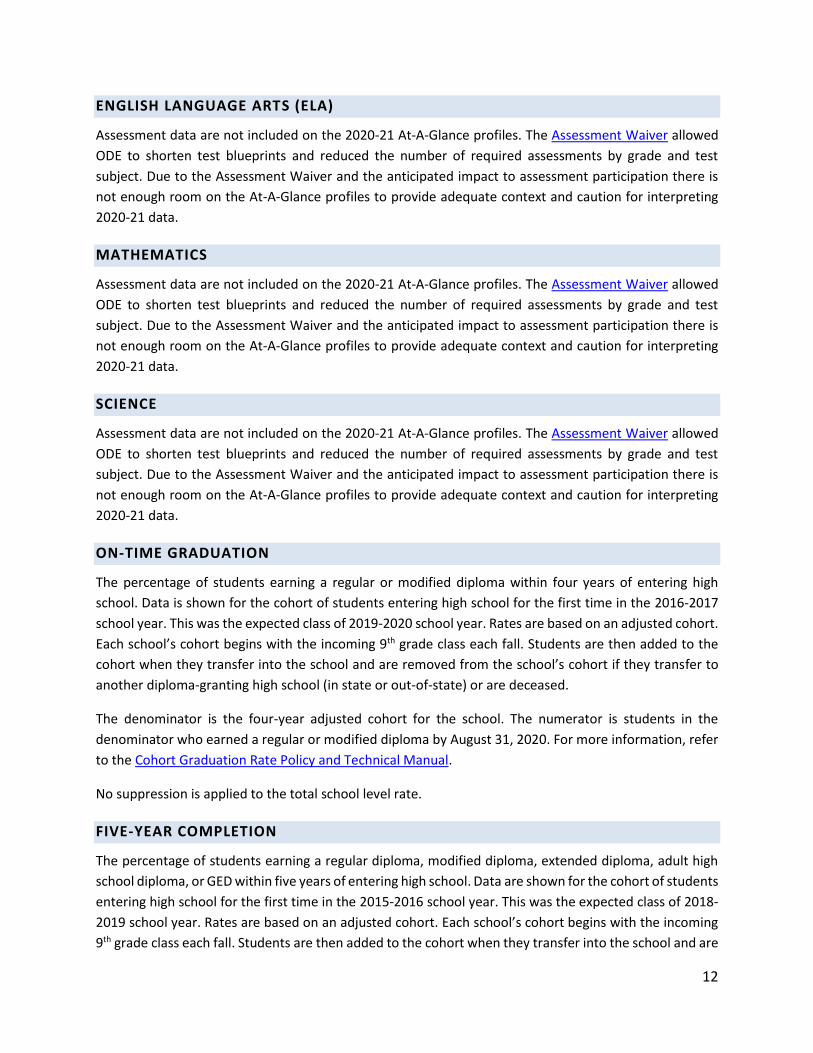
ACADEMIC SUCCESS The Academic Success indicators vary by school. Elementary and Middle school profiles include English
Language Arts, Mathematics, and Science assessment, while high schools and combined schools include
On-Time Graduation, Five-Year Completion, and College Going rates.
Note: This is a preliminary mockup; the layout may change by time of publication.
12
ENGLISH LANGUAGE ARTS (ELA)
Assessment data are not included on the 2020-21 At-A-Glance profiles. The Assessment Waiver allowed
ODE to shorten test blueprints and reduced the number of required assessments by grade and test
subject. Due to the Assessment Waiver and the anticipated impact to assessment participation there is
not enough room on the At-A-Glance profiles to provide adequate context and caution for interpreting
2020-21 data.
MATHEMATICS
Assessment data are not included on the 2020-21 At-A-Glance profiles. The Assessment Waiver allowed
ODE to shorten test blueprints and reduced the number of required assessments by grade and test
subject. Due to the Assessment Waiver and the anticipated impact to assessment participation there is
not enough room on the At-A-Glance profiles to provide adequate context and caution for interpreting
2020-21 data.
SCIENCE
Assessment data are not included on the 2020-21 At-A-Glance profiles. The Assessment Waiver allowed
ODE to shorten test blueprints and reduced the number of required assessments by grade and test
subject. Due to the Assessment Waiver and the anticipated impact to assessment participation there is
not enough room on the At-A-Glance profiles to provide adequate context and caution for interpreting
2020-21 data.
ON-TIME GRADUATION
The percentage of students earning a regular or modified diploma within four years of entering high
school. Data is shown for the cohort of students entering high school for the first time in the 2016-2017
school year. This was the expected class of 2019-2020 school year. Rates are based on an adjusted cohort.
Each school’s cohort begins with the incoming 9th grade class each fall. Students are then added to the
cohort when they transfer into the school and are removed from the school’s cohort if they transfer to
another diploma-granting high school (in state or out-of-state) or are deceased.
The denominator is the four-year adjusted cohort for the school. The numerator is students in the
denominator who earned a regular or modified diploma by August 31, 2020. For more information, refer
to the Cohort Graduation Rate Policy and Technical Manual.
No suppression is applied to the total school level rate.
FIVE-YEAR COMPLETION
The percentage of students earning a regular diploma, modified diploma, extended diploma, adult high
school diploma, or GED within five years of entering high school. Data are shown for the cohort of students
entering high school for the first time in the 2015-2016 school year. This was the expected class of 2018-
2019 school year. Rates are based on an adjusted cohort. Each school’s cohort begins with the incoming
9th grade class each fall. Students are then added to the cohort when they transfer into the school and are
13
removed from the school’s cohort if they transfer to another diploma-granting high school (in state or
out-of-state) or are deceased.
The denominator is the five-year adjusted cohort for the school. The numerator is students in the
denominator who earned a GED or a regular, modified, extended, or adult high school diploma by August
31, 2020. For more information, refer to the Cohort Graduation Rate Policy and Technical Manual.
No suppression is applied to the total school level rate.
COLLEGE GOING
This is the percentage of On-Time graduates who enroll in a postsecondary institution after graduating
and before the end of the first academic year that follows the cohort’s graduation. The source of the
postsecondary enrollment data is the National Student Clearinghouse.
The denominator includes the cohort of students entering high school for the first time in the 2014-2015
school year and earning a regular or modified diploma by the 2017-2018 school year (within four years of
entering high school). The numerator is students in the denominator who have a postsecondary
enrollment begin date that follows their high school exit date and is on or after June 1, 2018 and before
October 1, 2019.
The data are suppressed when the number of students in the denominator is less than ten then this
indicator is suppressed with an ‘*’; when the percentage is less than 5 or greater than 95, we display “<5”
and “>95”, respectively.
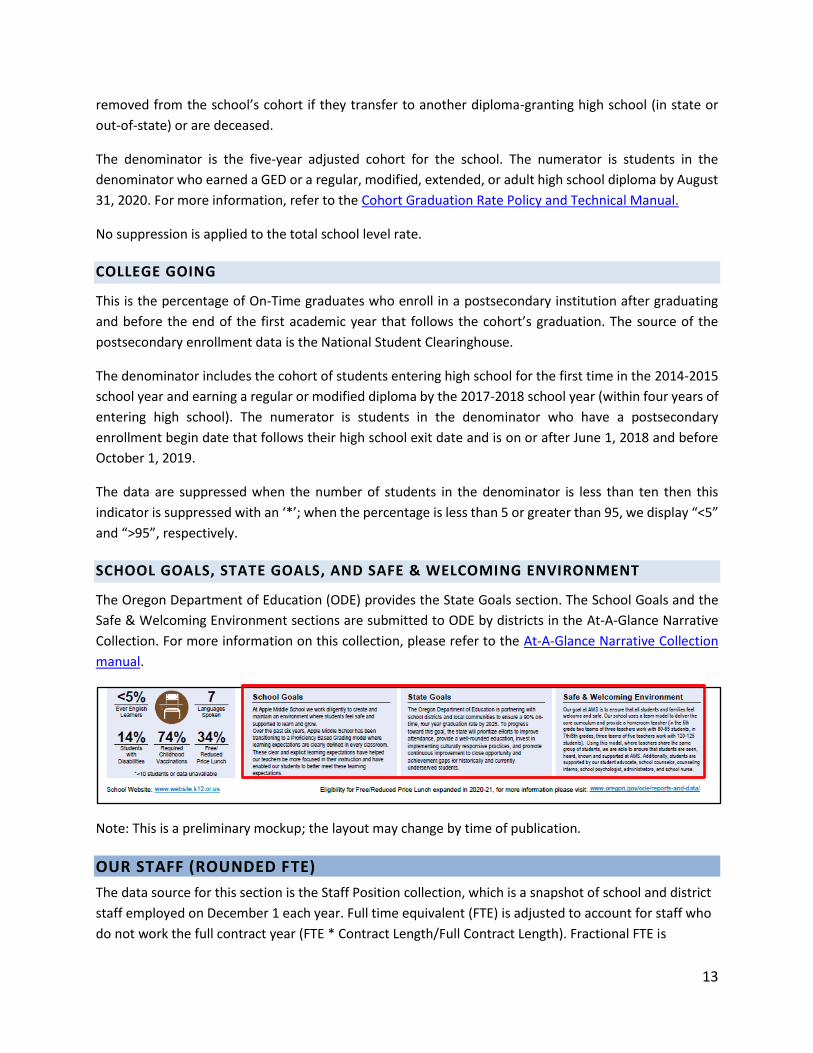
SCHOOL GOALS, STATE GOALS, AND SAFE & WELCOMING ENVIRONMENT
The Oregon Department of Education (ODE) provides the State Goals section. The School Goals and the
Safe & Welcoming Environment sections are submitted to ODE by districts in the At-A-Glance Narrative
Collection. For more information on this collection, please refer to the At-A-Glance Narrative Collection
manual.
Note: This is a preliminary mockup; the layout may change by time of publication.
OUR STAFF (ROUNDED FTE)
The data source for this section is the Staff Position collection, which is a snapshot of school and district
staff employed on December 1 each year. Full time equivalent (FTE) is adjusted to account for staff who
do not work the full contract year (FTE * Contract Length/Full Contract Length). Fractional FTE is
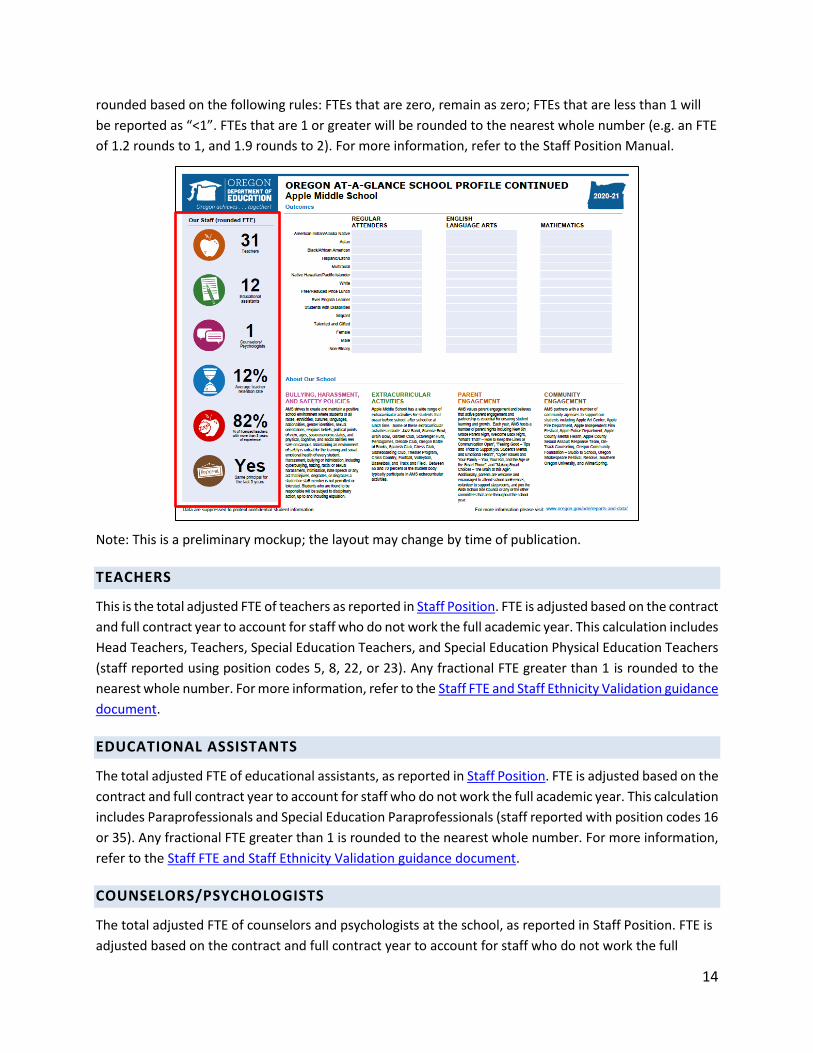
14
rounded based on the following rules: FTEs that are zero, remain as zero; FTEs that are less than 1 will
be reported as “<1”. FTEs that are 1 or greater will be rounded to the nearest whole number (e.g. an FTE
of 1.2 rounds to 1, and 1.9 rounds to 2). For more information, refer to the Staff Position Manual.
Note: This is a preliminary mockup; the layout may change by time of publication.
TEACHERS
This is the total adjusted FTE of teachers as reported in Staff Position. FTE is adjusted based on the contract
and full contract year to account for staff who do not work the full academic year. This calculation includes
Head Teachers, Teachers, Special Education Teachers, and Special Education Physical Education Teachers
(staff reported using position codes 5, 8, 22, or 23). Any fractional FTE greater than 1 is rounded to the
nearest whole number. For more information, refer to the Staff FTE and Staff Ethnicity Validation guidance
document.
EDUCATIONAL ASSISTANTS
The total adjusted FTE of educational assistants, as reported in Staff Position. FTE is adjusted based on the
contract and full contract year to account for staff who do not work the full academic year. This calculation
includes Paraprofessionals and Special Education Paraprofessionals (staff reported with position codes 16
or 35). Any fractional FTE greater than 1 is rounded to the nearest whole number. For more information,
refer to the Staff FTE and Staff Ethnicity Validation guidance document.
COUNSELORS/PSYCHOLOGISTS
The total adjusted FTE of counselors and psychologists at the school, as reported in Staff Position. FTE is
adjusted based on the contract and full contract year to account for staff who do not work the full
15
academic year. This calculation includes Guidance Counselors and Special Education Counselors,
Rehabilitation Counselors (staff reported with position codes 10 and 33), Psychologists, and Special
Education Psychologists (staff reported with position codes 7 and 27). Any fractional FTE greater than 1
is rounded to the nearest whole number. For more information, refer to the Staff FTE and Staff
Ethnicity Validation guidance document.
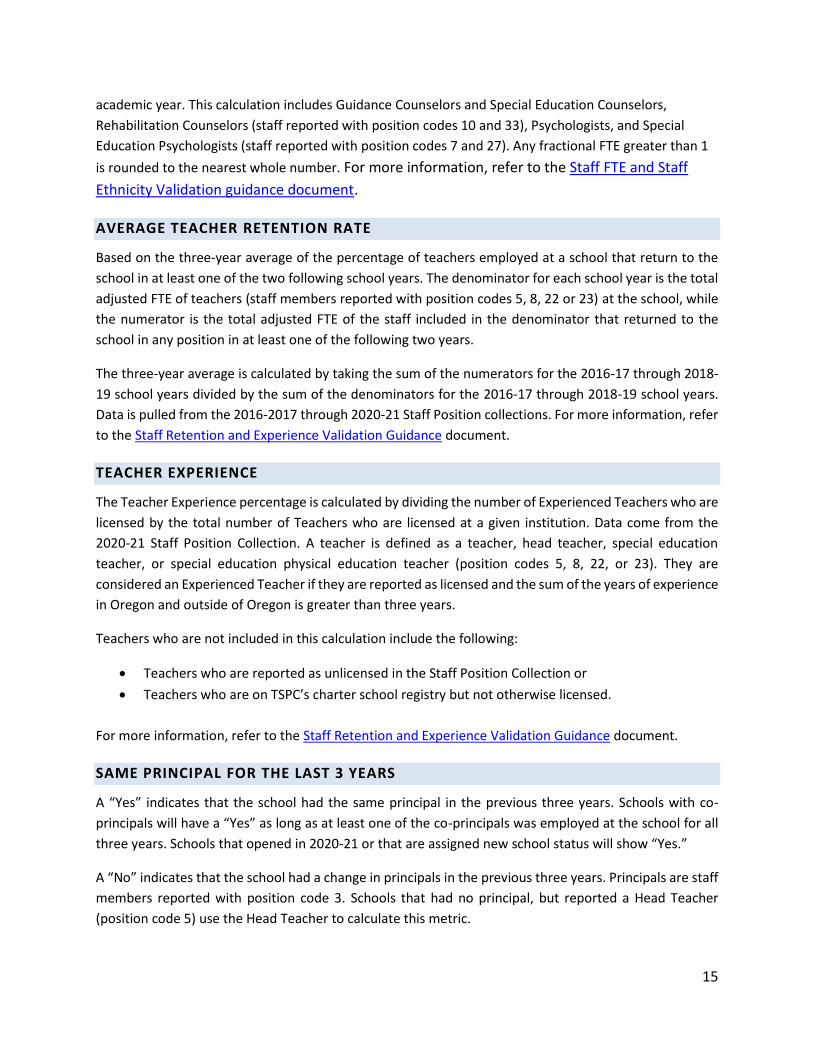
AVERAGE TEACHER RETENTION RATE
Based on the three-year average of the percentage of teachers employed at a school that return to the
school in at least one of the two following school years. The denominator for each school year is the total
adjusted FTE of teachers (staff members reported with position codes 5, 8, 22 or 23) at the school, while
the numerator is the total adjusted FTE of the staff included in the denominator that returned to the
school in any position in at least one of the following two years.
The three-year average is calculated by taking the sum of the numerators for the 2016-17 through 2018-
19 school years divided by the sum of the denominators for the 2016-17 through 2018-19 school years.
Data is pulled from the 2016-2017 through 2020-21 Staff Position collections. For more information, refer
to the Staff Retention and Experience Validation Guidance document.
TEACHER EXPERIENCE
The Teacher Experience percentage is calculated by dividing the number of Experienced Teachers who are
licensed by the total number of Teachers who are licensed at a given institution. Data come from the
2020-21 Staff Position Collection. A teacher is defined as a teacher, head teacher, special education
teacher, or special education physical education teacher (position codes 5, 8, 22, or 23). They are
considered an Experienced Teacher if they are reported as licensed and the sum of the years of experience
in Oregon and outside of Oregon is greater than three years.
Teachers who are not included in this calculation include the following:
Teachers who are reported as unlicensed in the Staff Position Collection or
Teachers who are on TSPC’s charter school registry but not otherwise licensed.
For more information, refer to the Staff Retention and Experience Validation Guidance document.
SAME PRINCIPAL FOR THE LAST 3 YEARS
A “Yes” indicates that the school had the same principal in the previous three years. Schools with co-
principals will have a “Yes” as long as at least one of the co-principals was employed at the school for all
three years. Schools that opened in 2020-21 or that are assigned new school status will show “Yes.”
A “No” indicates that the school had a change in principals in the previous three years. Principals are staff
members reported with position code 3. Schools that had no principal, but reported a Head Teacher
(position code 5) use the Head Teacher to calculate this metric.
16
Data are from the 2018-19 through 2020-21 Staff Position collections. For more information, refer to the
Staff Retention and Experience Validation Guidance document.
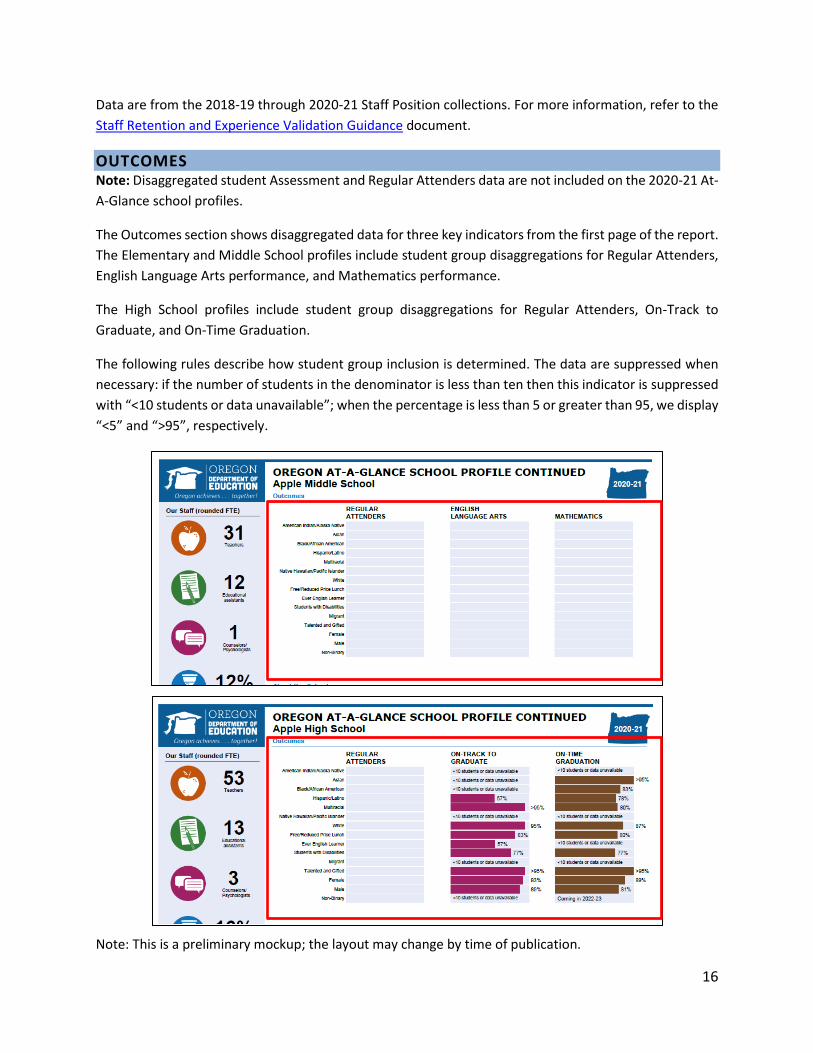
OUTCOMES Note: Disaggregated student Assessment and Regular Attenders data are not included on the 2020-21 At-
A-Glance school profiles.
The Outcomes section shows disaggregated data for three key indicators from the first page of the report.
The Elementary and Middle School profiles include student group disaggregations for Regular Attenders,
English Language Arts performance, and Mathematics performance.
The High School profiles include student group disaggregations for Regular Attenders, On-Track to
Graduate, and On-Time Graduation.
The following rules describe how student group inclusion is determined. The data are suppressed when
necessary: if the number of students in the denominator is less than ten then this indicator is suppressed
with “<10 students or data unavailable”; when the percentage is less than 5 or greater than 95, we display
“<5” and “>95”, respectively.
Note: This is a preliminary mockup; the layout may change by time of publication.
17
REGULAR ATTENDERS
Disaggregated student Regular Attenders data are not included on the 2020-21 At-A-Glance school
profiles.
ENGLISH LANGUAGE ARTS
Disaggregated student English Language Arts data are not included on the 2020-21 At-A-Glance school
profiles.
MATHEMATICS
Disaggregated student Mathematics data are not included on the 2020-21 At-A-Glance school profiles.
ON-TRACK TO GRADUATE
● Race/Ethnicity: as reported in Spring Membership.
● Free/Reduced Price Lunch: students eligible at any time during the school year, as reported in
Spring Membership.
● Ever English Learners: students submitted as current or former English Learners in the 2020-21
Title III English Learners Spring Collection with a record type code other than ‘3H’, ‘2J’, ‘SE’, or ‘EI’.
● Students with Disabilities: students on an IEP at any time during the school year, as submitted in
Third Period Cumulative ADM.
● Migrant: students submitted to the Oregon Migrant Student Information System (OMSIS)
collection.
● Homeless: students submitted to the 2020-21 McKinney-Vento Homeless collection.
● Talented and Gifted: students with ‘Y’ in any of the seven TAG fields in Spring Membership.
● Female/Male/Non-Binary: as reported in Spring Membership.
ON-TIME GRADUATION
● Race/Ethnicity: as reported on the record with the student’s highest ranked outcome.
● Free/Reduced Price Lunch: students eligible at any time during high school, as reported in Spring
Membership.
● Ever English Learners: students submitted as current or former English Learners in the Title III
English Learners Spring Collection. This would be any student reported in the English Learner’s
collection with record type code other than ‘3H’ or ‘2J’ during the period 2009-10 through 2019-
20.
● Students with Disabilities: students on an IEP at any time during high school (grade 9-12), as
submitted in Special Education Child Count and Exit Collections.
● Migrant: students submitted to the Oregon Migrant Student Information System (OMSIS)
collection in any of the four most recent collections.
● Homeless: students submitted to the McKinney-Vento Homeless collection in any of the four most
recent collections.
18
● Talented and Gifted: students with ‘Y’ in any of the seven TAG fields in Spring Membership for
2015-16 through 2019-20.
● Female/Male/Non-Binary: as reported on the record with the student’s highest ranked outcome.
● For details, refer to the Cohort Graduation Rate Technical Manual.
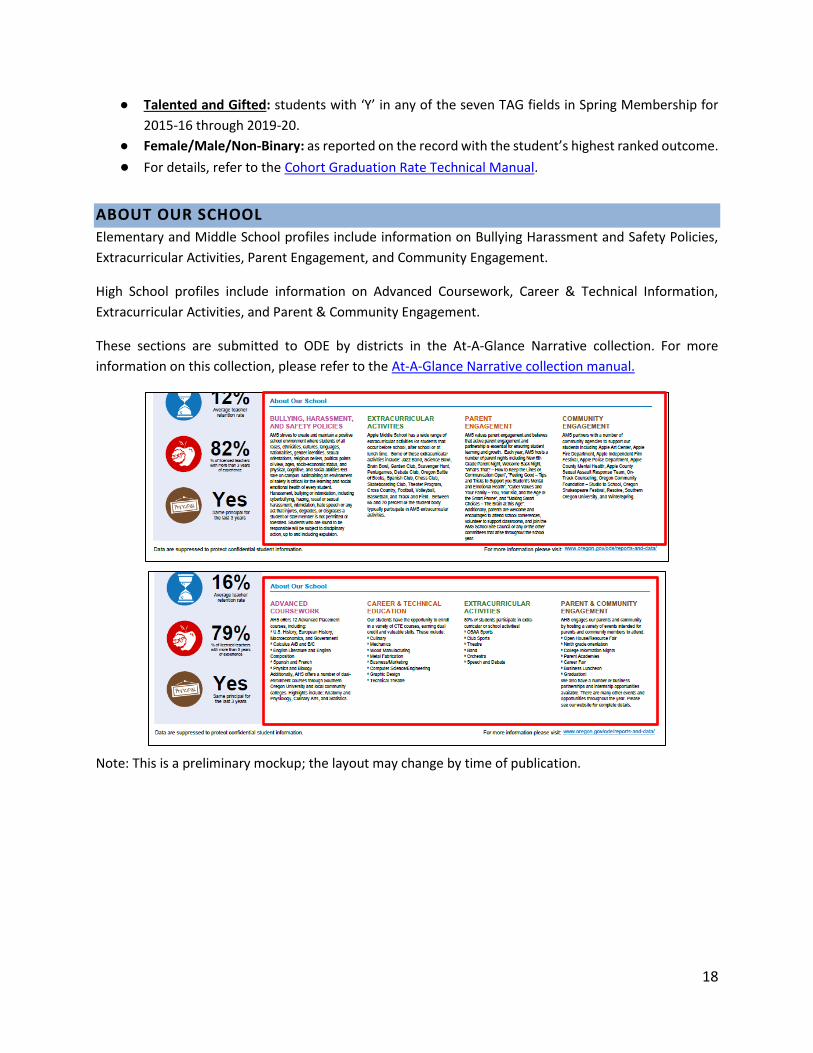
ABOUT OUR SCHOOL
Elementary and Middle School profiles include information on Bullying Harassment and Safety Policies,
Extracurricular Activities, Parent Engagement, and Community Engagement.
High School profiles include information on Advanced Coursework, Career & Technical Information,
Extracurricular Activities, and Parent & Community Engagement.
These sections are submitted to ODE by districts in the At-A-Glance Narrative collection. For more
information on this collection, please refer to the At-A-Glance Narrative collection manual.
Note: This is a preliminary mockup; the layout may change by time of publication.
19
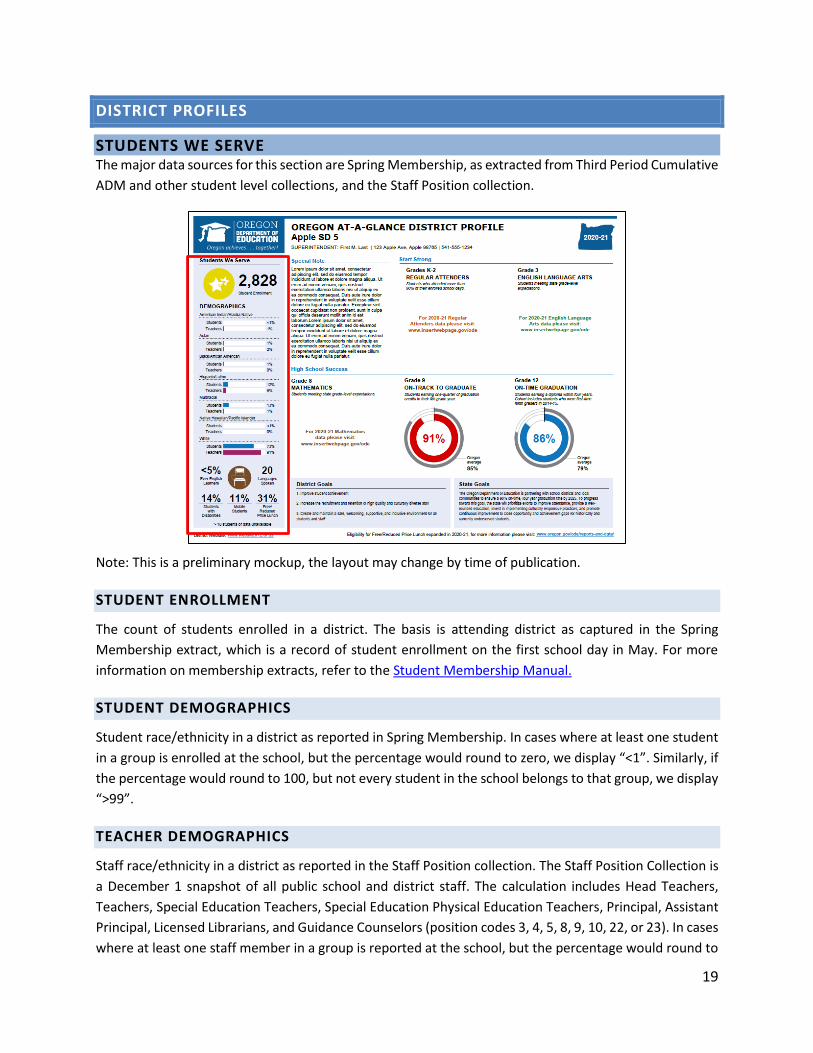
DISTRICT PROFILES
STUDENTS WE SERVE The major data sources for this section are Spring Membership, as extracted from Third Period Cumulative
ADM and other student level collections, and the Staff Position collection.
Note: This is a preliminary mockup, the layout may change by time of publication.
STUDENT ENROLLMENT
The count of students enrolled in a district. The basis is attending district as captured in the Spring
Membership extract, which is a record of student enrollment on the first school day in May. For more
information on membership extracts, refer to the Student Membership Manual.
STUDENT DEMOGRAPHICS
Student race/ethnicity in a district as reported in Spring Membership. In cases where at least one student
in a group is enrolled at the school, but the percentage would round to zero, we display “<1”. Similarly, if
the percentage would round to 100, but not every student in the school belongs to that group, we display
“>99”.
TEACHER DEMOGRAPHICS
Staff race/ethnicity in a district as reported in the Staff Position collection. The Staff Position Collection is
a December 1 snapshot of all public school and district staff. The calculation includes Head Teachers,
Teachers, Special Education Teachers, Special Education Physical Education Teachers, Principal, Assistant
Principal, Licensed Librarians, and Guidance Counselors (position codes 3, 4, 5, 8, 9, 10, 22, or 23). In cases
where at least one staff member in a group is reported at the school, but the percentage would round to
20
zero, we display “<1”. Similarly, if the percentage would round to 100, but not every staff member in the
school belongs to that group, we display “>99”. For more information, refer to the Staff Position Manual.
EVER ENGLISH LEARNERS
The percentage of students in Spring Membership who are current or former English learners. The data
source is the Title III English Learners Spring Collection, matched to Spring Membership records. Students
are considered English Learners if they appear in the current year unduplicated Title III English Learner
collection with a record type other than ‘3H’, ‘2J’, ‘SE’, or ‘EI’. The data are suppressed when the number
of students in the denominator is less than ten then this indicator is suppressed with an ‘*’; when the
percentage is less than 5 or greater than 95, we display “<5” and “>95”, respectively.
LANGUAGES SPOKEN
The number of distinct languages in district as reported in the “Language of Origin” field in Spring
Membership.
STUDENTS WITH DISABILITIES
The percentage of students on an Individualized Education Plan (IEP) at any time in the school year, as
reported in Spring Membership. The data are suppressed when the number of students in the
denominator is less than ten then this indicator is suppressed with an ‘*’; when the percentage is less than
5 or greater than 95, we display “<5” and “>95”, respectively.
MOBILE STUDENTS
The percentage of mobile students in a district as reported in Third Period Cumulative ADM. Students are
considered mobile if they meet one or more of the following criteria:
First reported enrollment was after October 1, 2020
Last reported enrollment was before the first school day in May 2021. Unless the last event was the
award of a credential (ADM End Date Codes 4A, 4C, 4D, or 4E), the student aged out (ADM End Date
Code 3B), or the student is deceased (ADM End Date Code 6A), or the student previously earned a
credential (ADM End Date Code 6B).
Enrolled in more than one school or program, including Juvenile Detention Education Program (JDEP)
or Long Term Care and Treatment (LTCT) placements.
Had a gap of 10 or more consecutive weekdays between enrollments within the same school.
The denominator is the number of attending students enrolled in the district at any point during the school
year. The numerator is the total number of students who meet one or more of the above criteria. For
more information, refer to the Student Mobility Methodology and Calculation Guide.
The data are suppressed when the number of students in the denominator is less than ten then this
indicator is suppressed with an ‘*’; when the percentage is less than 5 or greater than 95, we display “<5”
and “>95”, respectively.
21
FREE/REDUCED PRICE LUNCH
The percentage of students in Spring Membership that were eligible for free or reduced price school meals
at any time in the school year, as reported in Third Period Cumulative ADM. The data are suppressed when
the number of students in the denominator is less than ten then this indicator is suppressed with an ‘*’;
when the percentage is less than 5 or greater than 95, we display “<5” and “>95”, respectively.
Note: Schools that offered Free or Reduced Price Lunch to all students regardless of their individual
eligibility appear as “>95”. District level rates are not overridden with “>95”.
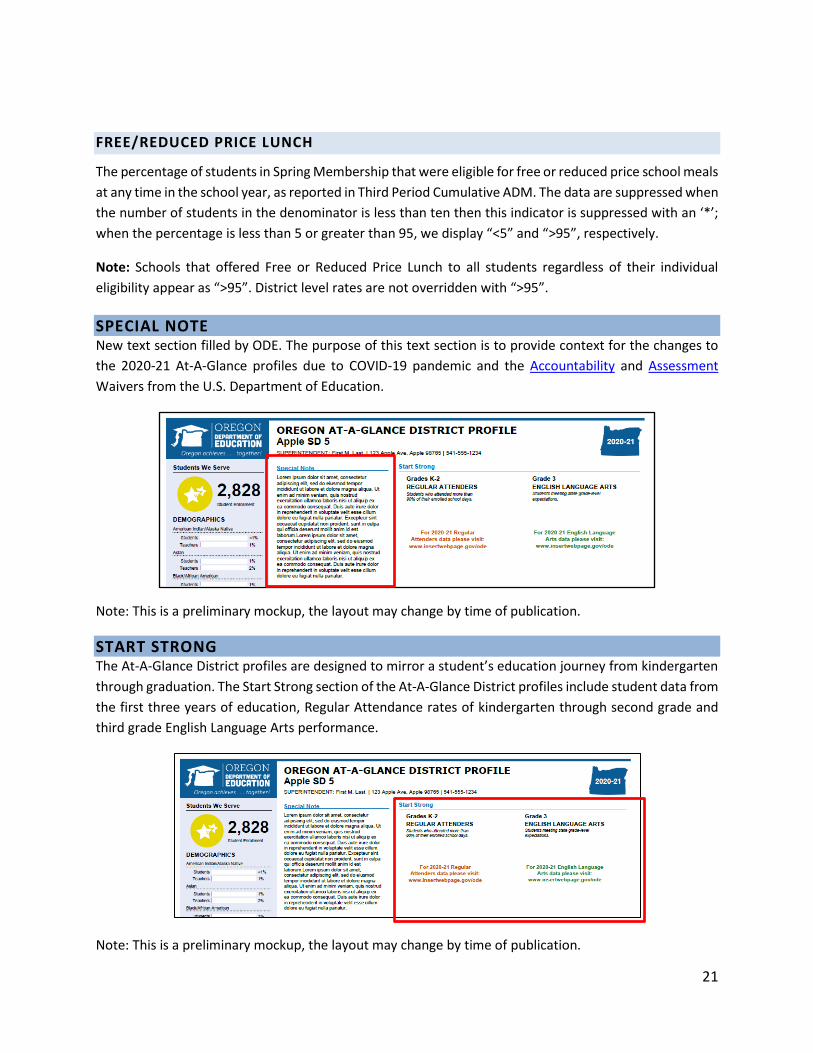
SPECIAL NOTE New text section filled by ODE. The purpose of this text section is to provide context for the changes to
the 2020-21 At-A-Glance profiles due to COVID-19 pandemic and the Accountability and Assessment
Waivers from the U.S. Department of Education.
Note: This is a preliminary mockup, the layout may change by time of publication.
START STRONG The At-A-Glance District profiles are designed to mirror a student’s education journey from kindergarten
through graduation. The Start Strong section of the At-A-Glance District profiles include student data from
the first three years of education, Regular Attendance rates of kindergarten through second grade and
third grade English Language Arts performance.
Note: This is a preliminary mockup, the layout may change by time of publication.

22
GRADES K-2 REGULAR ATTENDERS
Regular Attenders data are not included on the 2020-21 At-A-Glance School and District profiles. Due to
updates to reporting attendance and the suspension of the 10-Day drop rule in the Cumulative ADM
collection there is not enough room on the At-A-Glance School and District Profiles to provide adequate
context and caution for interpreting 2020-21 Regular Attendance data. Data will instead be published on
a separate webpage.
GRADE 3 ENGLISH LANGUAGE ARTS (ELA)
Assessment data are not included on the 2020-21 At-A-Glance profiles. The Assessment Waiver
allowed ODE to shorten test blueprints and reduced the number of required assessments by
grade and test subject. Due to the Assessment Waiver and the anticipated impact to
assessment participation there is not enough room on the At-A-Glance profiles to provide
adequate context and caution for interpreting 2020-21 data.
HIGH SCHOOL SUCCESS The district At-A-Glance profiles are designed to mirror a student’s education journey from kindergarten
through graduation. The High School Success section of the At-A-Glance profiles includes eighth grade
performance on the Mathematics statewide assessment, ninth graders On-Track to Graduate, and the
four-year cohort On-Time Graduation rate.
Note: This is a preliminary mockup; the layout may change by time of publication.
GRADE 8 MATHEMATICS
Assessment data are not included on the 2020-21 At-A-Glance profiles. The Assessment Waiver allowed
ODE to shorten test blueprints and reduced the number of required assessments by grade and test
subject. Due to the Assessment Waiver and the anticipated impacts to assessment participation there is
23
not enough room on the At-A-Glance profiles to provide adequate context and caution for interpreting
2020-21 data.
GRADE 9 ON-TRACK TO GRADUATE
The percentage of students that have earned at least one quarter of their required credits for graduation
in their first year in high school. The denominator is the number of resident students in Spring
Membership that are full academic year at the district and have a high school entry year of 2020-2021.
The numerator is the number of students earning at least one quarter of required credits by August 31,
2021 following their first year in high school.
Students are full academic year if the total ADM for their May 3, 2021 spring membership record is greater
than 0.5 ADM across all of their Third Period Cumulative ADM records. The denominator excludes
students who enrolled on the first week day in May but who transfer out of the district prior to the end
of the school year. For more information, refer to the Ninth Grade On-Track collection manual.
The data are suppressed when the number of students in the denominator is less than ten then this
indicator is suppressed with an ‘*’; when the percentage is less than 5 or greater than 95, we display “<5”
and “>95”, respectively.
GRADE 12 ON-TIME GRADUATION
The percentage of students earning a regular or modified diploma within four years of entering high
school. Data are shown for the cohort of students entering high school for the first time in the 2016-2017
school year. This was the expected class of 2019-2020 school year. Rates are based on an adjusted cohort.
Each school’s cohort begins with the incoming 9th grade class each fall. Students are then added to the
cohort when they transfer into the school and are removed from the school’s cohort if they transfer to
another diploma-granting high school (in state or out-of-state) or are deceased.
The denominator is the four-year adjusted cohort for the school. The numerator is students in the
denominator who earned a regular or modified diploma by August 31, 2020. For more information, refer
to the Cohort Graduation Rate Policy and Technical Manual.
No suppression is applied to the total district level rate.
24
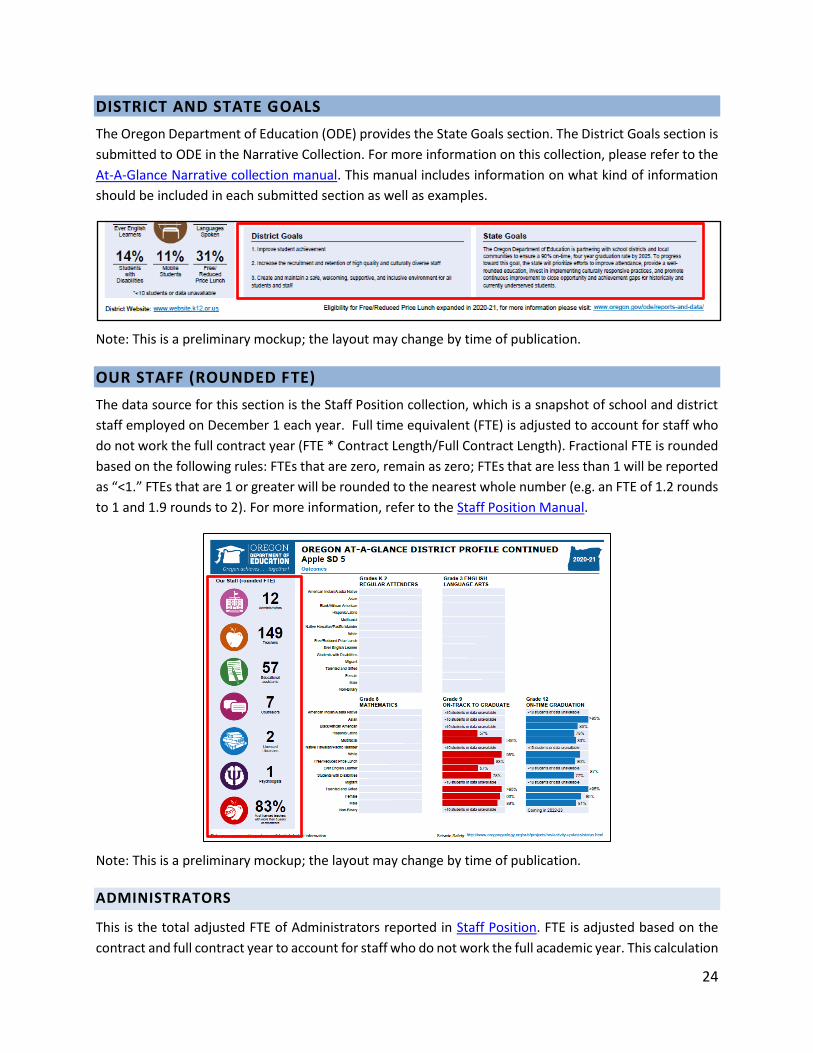
DISTRICT AND STATE GOALS
The Oregon Department of Education (ODE) provides the State Goals section. The District Goals section is
submitted to ODE in the Narrative Collection. For more information on this collection, please refer to the
At-A-Glance Narrative collection manual. This manual includes information on what kind of information
should be included in each submitted section as well as examples.
Note: This is a preliminary mockup; the layout may change by time of publication.
OUR STAFF (ROUNDED FTE)
The data source for this section is the Staff Position collection, which is a snapshot of school and district
staff employed on December 1 each year. Full time equivalent (FTE) is adjusted to account for staff who
do not work the full contract year (FTE * Contract Length/Full Contract Length). Fractional FTE is rounded
based on the following rules: FTEs that are zero, remain as zero; FTEs that are less than 1 will be reported
as “<1.” FTEs that are 1 or greater will be rounded to the nearest whole number (e.g. an FTE of 1.2 rounds
to 1 and 1.9 rounds to 2). For more information, refer to the Staff Position Manual.
Note: This is a preliminary mockup; the layout may change by time of publication.
ADMINISTRATORS
This is the total adjusted FTE of Administrators reported in Staff Position. FTE is adjusted based on the
contract and full contract year to account for staff who do not work the full academic year. This calculation
25
includes Superintendents, Assistant Superintendents, Principals, Assistant Principals, and Special
Education Administrators (staff reported using position codes 1, 2, 3, 4, 37, or 38). Any fractional FTE
greater than 1 is rounded to the nearest whole number. For more information, refer to the Staff FTE and
Staff Ethnicity Validation guidance document.
TEACHERS
This is the total adjusted FTE of teachers as reported in Staff Position. FTE is adjusted based on the contract
and full contract year to account for staff who do not work the full academic year. This calculation includes
Head Teachers, Teachers, Special Education Teachers, and Special Education Physical Education Teachers
(staff reported using position codes 5, 8, 22, or 23). Any fractional FTE greater than 1 is rounded to the
nearest whole number. For more information, refer to the Staff FTE and Staff Ethnicity Validation guidance
document.
EDUCATIONAL ASSISTANTS
The total adjusted FTE of educational assistants, as reported in Staff Position. FTE is adjusted based on the
contract and full contract year to account for staff who do not work the full academic year. This calculation
includes Paraprofessionals and Special Education Paraprofessionals (staff reported with position codes 16
or 35). Any fractional FTE greater than 1 is rounded to the nearest whole number. For more information,
refer to the Staff FTE and Staff Ethnicity Validation guidance document.
COUNSELORS
The total adjusted FTE of counselors at the district, as reported in Staff Position. FTE is adjusted based on
the contract and full contract year to account for staff who do not work the full academic year. This
calculation includes Guidance Counselors and Special Education Counselors and Rehabilitation Counselors
(staff reported with position codes 10 or 33). Any fractional FTE greater than 1 is rounded to the nearest
whole number. For more information, refer to the Staff FTE and Staff Ethnicity Validation guidance
document.
LICENSED LIBRARIANS
The total adjusted FTE of licensed librarians in the district, as reported in Staff Position. FTE is adjusted
based on the contract and full contract year to account for staff who do not work the full academic year.
This calculation includes Library/Media Specialists (staff reported with position code 9). Any fractional FTE
greater than 1 is rounded to the nearest whole number. For more information, refer to the Staff FTE and
Staff Ethnicity Validation guidance document.
PSYCHOLOGISTS
The total adjusted FTE of psychologists at the district, as reported in Staff Position. FTE is adjusted based
on the contract and full contract year to account for staff who do not work the full academic year. This
calculation includes Psychologists and Special Education Psychologists (staff reported with position codes
26
7 and 27). Any fractional FTE greater than 1 is rounded to the nearest whole number. For more
information, refer to the Staff FTE and Staff Ethnicity Validation guidance document.
TEACHER EXPERIENCE
The Teacher Experience percentage is calculated by dividing the number of Experienced Teachers who are
licensed by the total number of Teachers who are licensed at a given institution. Data come from the
2020-21 Staff Position Collection. A teacher is defined as a teacher, head teacher, special education
teacher, or special education physical education teacher (position codes 5, 8, 22, or 23). They are
considered an Experienced Teacher if they are reported as licensed and the sum of the years of experience
in Oregon and outside of Oregon is greater than 3 years.
Teachers who are not included in this calculation include the following:
Teachers who are reported as unlicensed in the Staff Position Collection or
Teachers who are on TSPC’s charter school registry but not otherwise licensed.
For more information, refer to the Staff Retention and Experience Validation Guidance document.
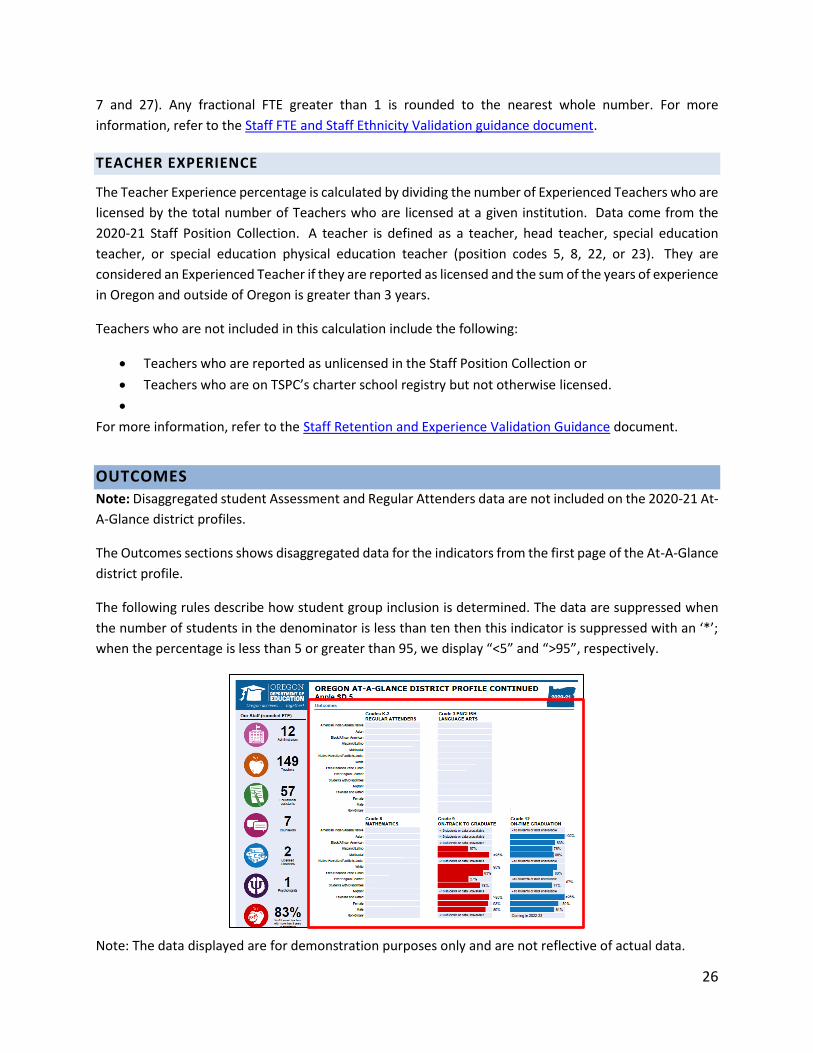
OUTCOMES
Note: Disaggregated student Assessment and Regular Attenders data are not included on the 2020-21 At-
A-Glance district profiles.
The Outcomes sections shows disaggregated data for the indicators from the first page of the At-A-Glance
district profile.
The following rules describe how student group inclusion is determined. The data are suppressed when
the number of students in the denominator is less than ten then this indicator is suppressed with an ‘*’;
when the percentage is less than 5 or greater than 95, we display “<5” and “>95”, respectively.
Note: The data displayed are for demonstration purposes only and are not reflective of actual data.
27
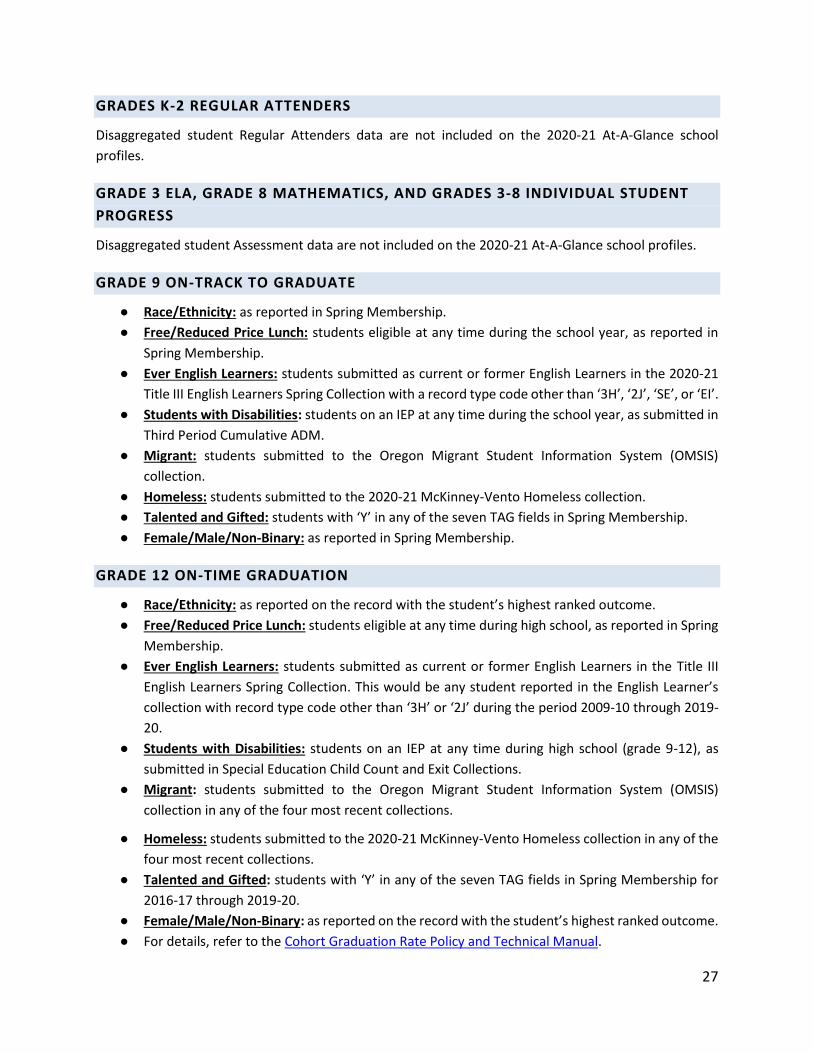
GRADES K-2 REGULAR ATTENDERS
Disaggregated student Regular Attenders data are not included on the 2020-21 At-A-Glance school
profiles.
GRADE 3 ELA, GRADE 8 MATHEMATICS, AND GRADES 3-8 INDIVIDUAL STUDENT
PROGRESS
Disaggregated student Assessment data are not included on the 2020-21 At-A-Glance school profiles.
GRADE 9 ON-TRACK TO GRADUATE
● Race/Ethnicity: as reported in Spring Membership.
● Free/Reduced Price Lunch: students eligible at any time during the school year, as reported in
Spring Membership.
● Ever English Learners: students submitted as current or former English Learners in the 2020-21
Title III English Learners Spring Collection with a record type code other than ‘3H’, ‘2J’, ‘SE’, or ‘EI’.
● Students with Disabilities: students on an IEP at any time during the school year, as submitted in
Third Period Cumulative ADM.
● Migrant: students submitted to the Oregon Migrant Student Information System (OMSIS)
collection.
● Homeless: students submitted to the 2020-21 McKinney-Vento Homeless collection.
● Talented and Gifted: students with ‘Y’ in any of the seven TAG fields in Spring Membership.
● Female/Male/Non-Binary: as reported in Spring Membership.
GRADE 12 ON-TIME GRADUATION
● Race/Ethnicity: as reported on the record with the student’s highest ranked outcome.
● Free/Reduced Price Lunch: students eligible at any time during high school, as reported in Spring
Membership.
● Ever English Learners: students submitted as current or former English Learners in the Title III
English Learners Spring Collection. This would be any student reported in the English Learner’s
collection with record type code other than ‘3H’ or ‘2J’ during the period 2009-10 through 2019-
20.
● Students with Disabilities: students on an IEP at any time during high school (grade 9-12), as
submitted in Special Education Child Count and Exit Collections.
● Migrant: students submitted to the Oregon Migrant Student Information System (OMSIS)
collection in any of the four most recent collections.
● Homeless: students submitted to the 2020-21 McKinney-Vento Homeless collection in any of the
four most recent collections.
● Talented and Gifted: students with ‘Y’ in any of the seven TAG fields in Spring Membership for
2016-17 through 2019-20.
● Female/Male/Non-Binary: as reported on the record with the student’s highest ranked outcome.
● For details, refer to the Cohort Graduation Rate Policy and Technical Manual.
28
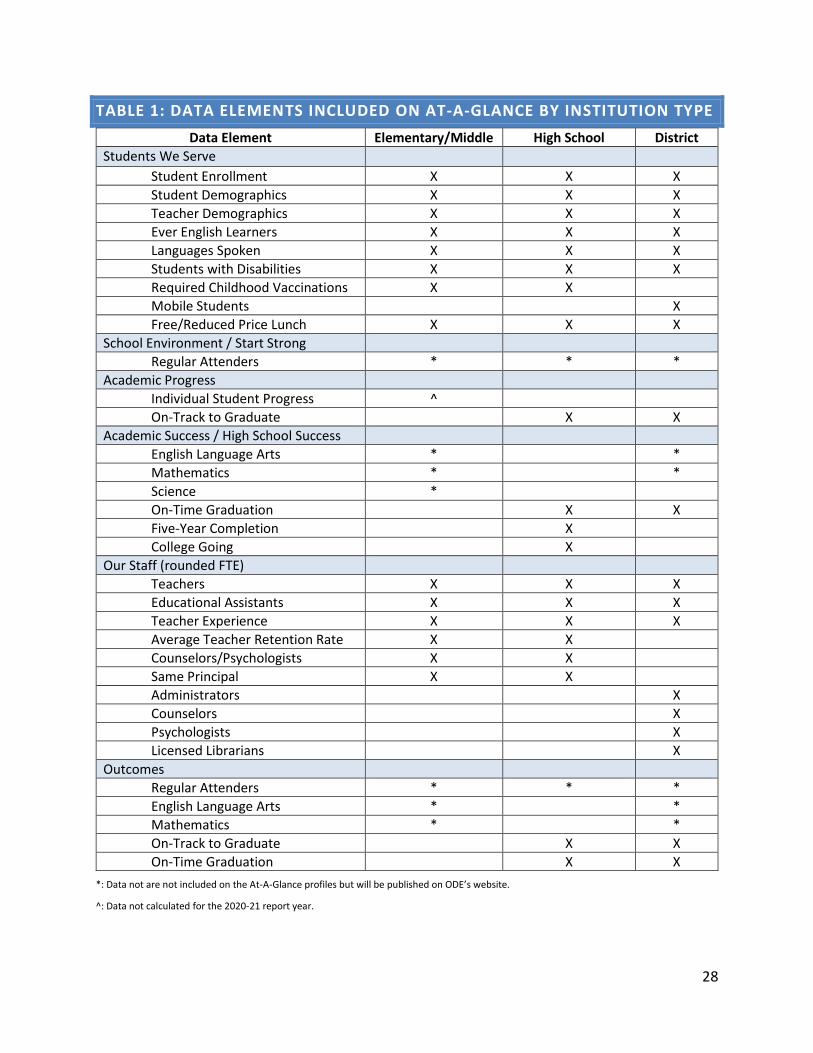
TABLE 1: DATA ELEMENTS INCLUDED ON AT-A-GLANCE BY INSTITUTION TYPE
Data Element Elementary/Middle High School District
Students We Serve Student Enrollment X X X Student Demographics X X X Teacher Demographics X X X Ever English Learners X X X Languages Spoken X X X Students with Disabilities X X X
Required Childhood Vaccinations X X
Mobile Students X
Free/Reduced Price Lunch X X X
School Environment / Start Strong
Regular Attenders * * *
Academic Progress
Individual Student Progress ^
On-Track to Graduate X X
Academic Success / High School Success
English Language Arts * *
Mathematics * *
Science *
On-Time Graduation X X
Five-Year Completion X
College Going X
Our Staff (rounded FTE)
Teachers X X X
Educational Assistants X X X
Teacher Experience X X X
Average Teacher Retention Rate X X
Counselors/Psychologists X X
Same Principal X X
Administrators X
Counselors X
Psychologists X
Licensed Librarians X
Outcomes
Regular Attenders * * *
English Language Arts * *
Mathematics * *
On-Track to Graduate X X
On-Time Graduation X X
*: Data not are not included on the At-A-Glance profiles but will be published on ODE’s website.
^: Data not calculated for the 2020-21 report year.