maryland poverty profiles - family league...
TRANSCRIPT

2016Maryland Poverty Profiles

MEMBER AGENCIESAdvocates for Children and YouthBaltimore Jewish CouncilCASA of Maryland Inc.Catholic CharitiesEpiscopal Community Services Family League of BaltimoreFuel Fund of MarylandHealthCare Access MarylandHealth Care for the HomelessHomeless Persons Representation ProjectInterfaith WorksJewish Community Relations Council of Greater WashingtonJob Opportunities Task ForceLeague of Women Voters of MarylandMaryland CASH CampaignMaryland Catholic ConferenceMaryland Center on Economic PolicyMaryland Community Action PartnershipMaryland Consumer Rights CoalitionMaryland Family NetworkMaryland Hunger SolutionsMaryland Interfaith Legislative CommitteeNational Council on Alcoholism & Drug Dependence — Maryland ChapterPublic Justice CenterSt. Vincent de Paul of BaltimoreWelfare Advocates
MARYLAND ALLIANCE FOR THE POORCamilla Roberson, Co-ChairP: 410/625-9409 x224C: 510-333-7036E: [email protected]
Lisa Klingenmaier, Co-ChairP: 410/261-6783C: 443/931-8920E: [email protected]
T: @MAPAdvocacyW: www.mapadvocacy.org
MAP would like to thank the Baltimore Jewish Council and Staiman Design for designing the 2016 Poverty Profiles

Maryland Poverty Profiles 1
Maryland at a GlanceMaryland’s status as the wealthiest state in the country disguises that fact that at least one in every 10 of our neighbors are struggling to make ends meet. Almost 575,000 Marylanders live below the federal poverty line, which amounts to less than $23,850 per year for a family of four. Nearly half of Marylanders in poverty are trying to get by on far less, under $5,835 per year for an individual, which the federal government classifies as “deep poverty”.
Although we have recently seen some positive signs in the state’s economy, the benefits have not been widely shared. There are still just as many Marylanders who aren’t earning enough to meet their basic needs as there were in 2011, while the people who already had the most money have seen their share of the pie grow. It is clear that we need to do more to ensure that everyone in our state has the opportunity to build a secure future for themselves and their families.
Maryland Poverty Profiles is a compilation of key indicators that reflect the daily challenges of these thousands of families in Maryland and each of its 24 local jurisdictions. The Maryland Alliance for the Poor (MAP) hopes that this data will launch a conversation about how we can take collective action to ensure that everyone in our state is able to have a roof over their heads, sufficient food on the table and the opportunity to thrive.
While there is still much work to be done, the Maryland Poverty Profiles also show how state programs and policies – like cash assistance, housing assistance, nutrition assistance and child care vouchers – are essential tools that help people meet their basic needs.
The chart below depicts various income levels across Maryland. As you can see, even with Maryland’s higher minimum wage that took effect in July, a family of three with one person working full time
at the minimum wage will still be living below the Federal Poverty Line unless they receive additional supports, like nutrition assistance payments.
In order to afford the typical market rate rent for a two-bedroom apartment in Maryland, a household would have to earn far more than that, just over $50,000 per year. Unfortunately, many of the programs that help hard-working families afford adequate housing have long waiting lists. Cash assistance programs (TCA and TDAP) do help some of the lowest-income families get by, but the amount of assistance available remains far below the poverty line, and even farther below the Maryland Minimum Living Level.
MAP believes our state can do better, and strongly supports efforts to address the state’s many unmet needs. With rising incomes and a growing economy, now is the time to invest in the success of all Marylanders.
Income Levels$80,000
$60,000
$40,000
$20,000
Median Income Income
Needed to Afford a
2- Bedroom Apartment
Maryland Minimum
Living Level (Family of 3)
Federal Poverty Line (Family of 3)
Minimum Wage Annual
Salary (Full Time)
Maximum Annual TCA
Benefits (Family of 3)
Maximum Annual TDAP
Benefit
$ 0

2
Income
0.0% 5.0% 10.0% 15.0% 20.0% 25.0% 30.0% 35.0% 40.0% 45.0% 50.0%
Overall Poverty Seniors
Children Hispanic or La?no
Black or African American Female Headed Households
0.0% 5.0% 10.0% 15.0% 20.0% 25.0% 30.0%
Overall Poverty Seniors
Children Hispanic or La>no
Black or African American Female Headed Households
INDIVIDUALS LIVING IN DEEP POVERTY48.3% of people in Maryland State who live in poverty have incomes below 50% of the poverty line - $5,835 for an individual – in 2014. Census Bureau, American Community Survey 5-Year Estimates 2010-2014
INDIVIDUALS LIVING BELOW 200% OF THE FEDERAL POVERTY LINE23.2% of people in Maryland State live below 200% of the poverty line - $47,000 for a family of four in 2014.Census Bureau, American Community Survey 5-Year Estimates 2010-2014
POVERTY RATE AMONG FEMALE-HEADED HOUSEHOLDS26.1% of Female-Headed Households in Maryland State live below the poverty line - $23,850 for a family of four – in 2014. Census Bureau, American Community Survey 5-Year Estimates 2010-2014
POVERTY RATE AMONG HISPANIC OR LATINO MARYLANDERS 14.1% of Hispanic or Latino Marylanders in Maryland State live below the poverty line - $11,670 for an individual – in 2014. Census Bureau, American Community Survey 5-Year Estimates 2010-2014
POVERTY RATE AMONG BLACK OR AFRICAN AMERICAN MARYLANDERS15.2% of Black or African American Marylanders in Maryland State live below the poverty line - $11,670 for an individual – in 2014. Census Bureau, American Community Survey 5-Year Estimates 2010-2014
SENIOR POVERTY RATE7.6% of seniors in Maryland State live below the poverty line - $11,670 for an individual – in 2014.Census Bureau, American Community Survey 5-Year Estimates 2010-2014
CHILD POVERTY RATE13.2% of children in Maryland State live below the poverty line - $23,850 for a family of four – in 2014.Census Bureau, American Community Survey 5-Year Estimates 2010-2014
POVERTY RATE10.0% of people in Maryland State live below the poverty line - $23,850 for a family of four – in 2014.Census Bureau, American Community Survey 5-Year Estimates 2010-2014
MEDIAN INCOMEThe median income for households in Maryland State is $ $74,149.Census Bureau, American Community Survey 5-Year Estimates 2010-2014
POPULATION OF MARYLAND STATE:
5,887,776NUMBER OF PEOPLE IN MARYLAND STATE LIVING IN POVERTY IN 2014:
573,383
Maryland StatePOVERTY RATES IN MARYLAND STATE
Maryland Poverty Profiles 3
Income Supports
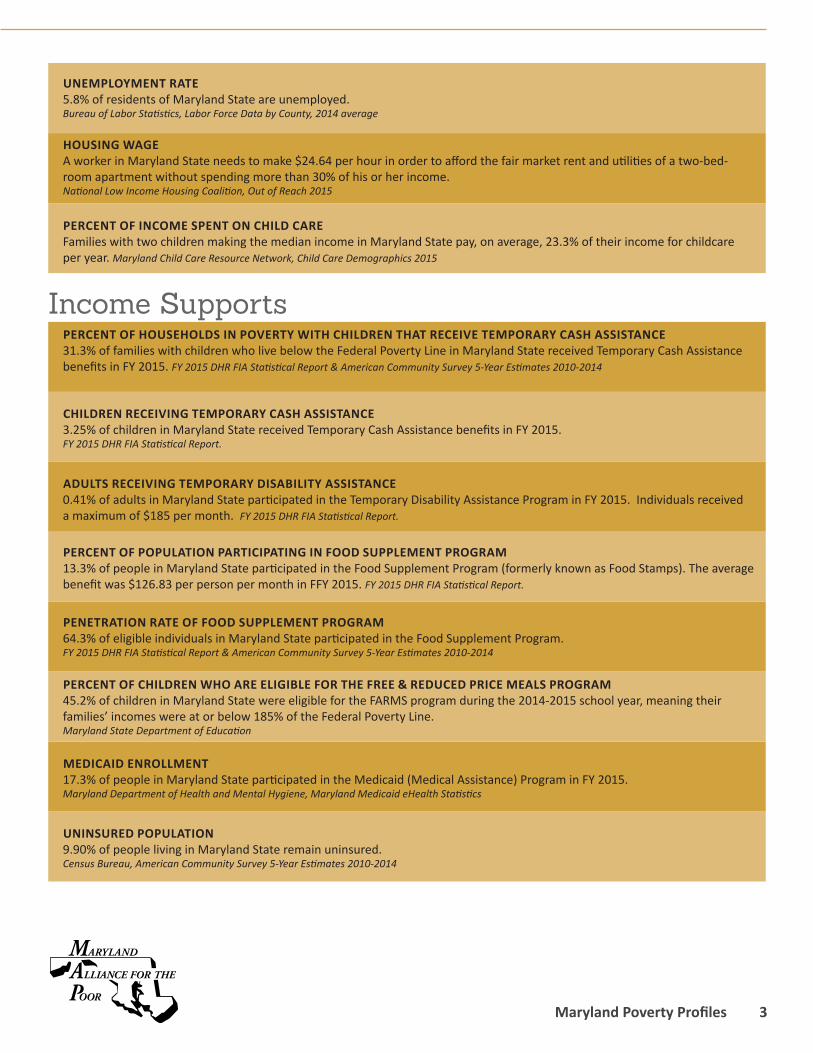
UNINSURED POPULATION9.90% of people living in Maryland State remain uninsured. Census Bureau, American Community Survey 5-Year Estimates 2010-2014
MEDICAID ENROLLMENT17.3% of people in Maryland State participated in the Medicaid (Medical Assistance) Program in FY 2015.Maryland Department of Health and Mental Hygiene, Maryland Medicaid eHealth Statistics
PERCENT OF CHILDREN WHO ARE ELIGIBLE FOR THE FREE & REDUCED PRICE MEALS PROGRAM45.2% of children in Maryland State were eligible for the FARMS program during the 2014-2015 school year, meaning their families’ incomes were at or below 185% of the Federal Poverty Line. Maryland State Department of Education
PENETRATION RATE OF FOOD SUPPLEMENT PROGRAM64.3% of eligible individuals in Maryland State participated in the Food Supplement Program.FY 2015 DHR FIA Statistical Report & American Community Survey 5-Year Estimates 2010-2014
PERCENT OF POPULATION PARTICIPATING IN FOOD SUPPLEMENT PROGRAM13.3% of people in Maryland State participated in the Food Supplement Program (formerly known as Food Stamps). The average benefit was $126.83 per person per month in FFY 2015. FY 2015 DHR FIA Statistical Report.
ADULTS RECEIVING TEMPORARY DISABILITY ASSISTANCE0.41% of adults in Maryland State participated in the Temporary Disability Assistance Program in FY 2015. Individuals received a maximum of $185 per month. FY 2015 DHR FIA Statistical Report.
CHILDREN RECEIVING TEMPORARY CASH ASSISTANCE3.25% of children in Maryland State received Temporary Cash Assistance benefits in FY 2015. FY 2015 DHR FIA Statistical Report.
PERCENT OF HOUSEHOLDS IN POVERTY WITH CHILDREN THAT RECEIVE TEMPORARY CASH ASSISTANCE31.3% of families with children who live below the Federal Poverty Line in Maryland State received Temporary Cash Assistance benefits in FY 2015. FY 2015 DHR FIA Statistical Report & American Community Survey 5-Year Estimates 2010-2014
PERCENT OF INCOME SPENT ON CHILD CARE Families with two children making the median income in Maryland State pay, on average, 23.3% of their income for childcare per year. Maryland Child Care Resource Network, Child Care Demographics 2015
HOUSING WAGEA worker in Maryland State needs to make $24.64 per hour in order to afford the fair market rent and utilities of a two-bed-room apartment without spending more than 30% of his or her income. National Low Income Housing Coalition, Out of Reach 2015
UNEMPLOYMENT RATE5.8% of residents of Maryland State are unemployed.Bureau of Labor Statistics, Labor Force Data by County, 2014 average

4
IncomeRanking*
0.0% 5.0% 10.0% 15.0% 20.0% 25.0% 30.0% 35.0% 40.0% 45.0% 50.0%
Overall Poverty Seniors
Children Hispanic or La?no
Black or African American Female Headed Households
0.0% 5.0% 10.0% 15.0% 20.0% 25.0% 30.0% 35.0% 40.0% 45.0% 50.0%
Overall Poverty Seniors
Children Hispanic or La?no
Black or African American Female Headed Households
16356246
23
INDIVIDUALS LIVING IN DEEP POVERTY46.5% of people in Allegany County who live in poverty have incomes below 50% of the poverty line - $5,835 for an individual – in 2014. Census Bureau, American Community Survey 5-Year Estimates 2010-2014
INDIVIDUALS LIVING BELOW 200% OF THE FEDERAL POVERTY LINE39.5% of people in Allegany County live below 200% of the poverty line - $47,000 for a family of four in 2014.Census Bureau, American Community Survey 5-Year Estimates 2010-2014
POVERTY RATE AMONG FEMALE-HEADED HOUSEHOLDS43.3% of Female-Headed Households in Allegany County live below the poverty line - $23,850 for a family of four – in 2014. Census Bureau, American Community Survey 5-Year Estimates 2010-2014
POVERTY RATE AMONG HISPANIC OR LATINO MARYLANDERS 28.2% of Hispanic or Latino Marylanders in Allegany County live below the poverty line - $11,670 for an individ-ual – in 2014. Census Bureau, American Community Survey 5-Year Estimates 2010-2014
POVERTY RATE AMONG BLACK OR AFRICAN AMERICAN MARYLANDERS38.2% of Black or African American Marylanders in Allegany County live below the poverty line - $11,670 for an individual – in 2014. Census Bureau, American Community Survey 5-Year Estimates 2010-2014
SENIOR POVERTY RATE9.0% of seniors in Allegany County live below the poverty line - $11,670 for an individual – in 2014.Census Bureau, American Community Survey 5-Year Estimates 2010-2014
CHILD POVERTY RATE22.6% of children in Allegany County live below the poverty line - $23,850 for a family of four – in 2014.Census Bureau, American Community Survey 5-Year Estimates 2010-2014
POVERTY RATE17.3% of people in Allegany County live below the poverty line - $23,850 for a family of four – in 2014.Census Bureau, American Community Survey 5-Year Estimates 2010-2014
MEDIAN INCOMEThe median income for households in Allegany County is $39,794.Census Bureau, American Community Survey 5-Year Estimates 2010-2014
POPULATION OF ALLEGANY COUNTY:
73,976NUMBER OF PEOPLE IN ALLEGANY COUNTY LIVING IN POVERTY IN 2014:
11,489
Allegany County
4
POVERTY RATES IN ALLEGANY COUNTY

Maryland Poverty Profiles 5
Income Supports
Ranking*
* Ranking - a ranking of 1 indicates the jurisdiction has the highest figure in the state in that category, and a ranking of 24 means the lowest figure in the state in that category. Therefore, being ranked 1 does not necessarily mean success in a given category.
1567135257
3246
UNINSURED POPULATION8.20% of people living in Allegany County remain uninsured. Census Bureau, American Community Survey 5-Year Estimates 2010-2014
MEDICAID ENROLLMENT21% of people in Allegany County participated in the Medicaid (Medical Assistance) Program in FY 2015.Maryland Department of Health and Mental Hygiene, Maryland Medicaid eHealth Statistics
PERCENT OF CHILDREN WHO ARE ELIGIBLE FOR THE FREE & REDUCED PRICE MEALS PROGRAM56.3% of children in Allegany County were eligible for the FARMS program during the 2014-2015 school year, meaning their families’ incomes were at or below 185% of the Federal Poverty Line. Maryland State Department of Education
PENETRATION RATE OF FOOD SUPPLEMENT PROGRAM64.1% of eligible individuals in Allegany County participated in the Food Supplement Program.FY 2015 DHR FIA Statistical Report & American Community Survey 5-Year Estimates 2010-2014
PERCENT OF POPULATION PARTICIPATING IN FOOD SUPPLEMENT PROGRAM20.8% of people in Allegany County participated in the Food Supplement Program (formerly known as Food Stamps). The average benefit was $126.83 per person per month in FFY 2015. FY 2015 DHR FIA Statistical Report.
ADULTS RECEIVING TEMPORARY DISABILITY ASSISTANCE.62% of adults in Allegany County participated in the Temporary Disability Assistance Program in FY 2015. Individuals received a maximum of $185 per month. FY 2015 DHR FIA Statistical Report.
CHILDREN RECEIVING TEMPORARY CASH ASSISTANCE5.63% of children in Allegany County received Temporary Cash Assistance benefits in FY 2015. FY 2015 DHR FIA Statistical Report.
PERCENT OF HOUSEHOLDS IN POVERTY WITH CHILDREN THAT RECEIVE TEMPORARY CASH ASSISTANCE31.5% of families with children who live below the Federal Poverty Line in Allegany County received Temporary Cash Assistance benefits in FY 2015. FY 2015 DHR FIA Statistical Report & American Community Survey 5-Year Estimates 2010-2014
PERCENT OF INCOME SPENT ON CHILD CARE Families with two children making the median income in Allegany County pay, on average, 22.1% of their income for childcare per year. Maryland Child Care Resource Network, Child Care Demographics 2015
HOUSING WAGEA worker in Allegany County needs to make $12.37 per hour in order to afford the fair market rent and utilities of a two-bedroom apartment without spending more than 30% of his or her income. National Low Income Housing Coalition, Out of Reach 2015
UNEMPLOYMENT RATE7.3% of residents of Allegany County are unemployed.Bureau of Labor Statistics, Labor Force Data by County, 2014 average

6
IncomeRanking*
0.0% 5.0% 10.0% 15.0% 20.0% 25.0% 30.0% 35.0% 40.0% 45.0% 50.0%
Overall Poverty Seniors
Children Hispanic or La?no
Black or African American Female Headed Households
1021242421202121
5
POVERTY RATES IN ANNE ARUNDEL COUNTYPOPULATION OF ANNE ARUNDEL COUNTY:
550,269NUMBER OF PEOPLE IN ANNE ARUNDEL COUNTY LIVING IN POVERTY IN 2014:
31,573
INDIVIDUALS LIVING IN DEEP POVERTY48.7% of people in Anne Arundel County who live in poverty have incomes below 50% of the poverty line - $5,835 for an individual – in 2014. Census Bureau, American Community Survey 5-Year Estimates 2010-2014
INDIVIDUALS LIVING BELOW 200% OF THE FEDERAL POVERTY LINE15.9% of people in Anne Arundel County live below 200% of the poverty line - $47,000 for a family of four in 2014. Census Bureau, American Community Survey 5-Year Estimates 2010-2014
POVERTY RATE AMONG FEMALE-HEADED HOUSEHOLDS17.8% of Female-Headed Households in Anne Arundel County live below the poverty line - $23,850 for a family of four – in 2014. Census Bureau, American Community Survey 5-Year Estimates 2010-2014
POVERTY RATE AMONG HISPANIC OR LATINO MARYLANDERS 8.9% of Hispanic or Latino Marylanders in Anne Arundel County live below the poverty line - $11,670 for an individual – in 2014. Census Bureau, American Community Survey 5-Year Estimates 2010-2014
POVERTY RATE AMONG BLACK OR AFRICAN AMERICAN MARYLANDERS10.5% of Black or African American Marylanders in Anne Arundel County live below the poverty line - $11,670 for an individual – in 2014. Census Bureau, American Community Survey 5-Year Estimates 2010-2014
SENIOR POVERTY RATE5.2% of seniors in Anne Arundel County live below the poverty line - $11,670 for an individual – in 2014.Census Bureau, American Community Survey 5-Year Estimates 2010-2014
CHILD POVERTY RATE7.1% of children in Anne Arundel County live below the poverty line - $23,850 for a family of four – in 2014.Census Bureau, American Community Survey 5-Year Estimates 2010-2014
POVERTY RATE5.9% of people in Anne Arundel County live below the poverty line - $23,850 for a family of four – in 2014.Census Bureau, American Community Survey 5-Year Estimates 2010-2014
MEDIAN INCOMEThe median income for households in Anne Arundel County is $89,031.Census Bureau, American Community Survey 5-Year Estimates 2010-2014
Anne Arundel County
0.0% 2.0% 4.0% 6.0% 8.0% 10.0% 12.0% 14.0% 16.0% 18.0% 20.0%
Overall Poverty Seniors
Children Hispanic or La?no
Black or African American Female Headed Households

Maryland Poverty Profiles 7
Income Supports
Ranking*
* Ranking - a ranking of 1 indicates the jurisdiction has the highest figure in the state in that category, and a ranking of 24 means the lowest figure in the state in that category. Therefore, being ranked 1 does not necessarily mean success in a given category.
182117172121145
10719 UNEMPLOYMENT RATE
5.2% of residents of Anne Arundel County are unemployed.Bureau of Labor Statistics, Labor Force Data by County, 2014 average
HOUSING WAGEA worker in Anne Arundel County needs to make $23.69 per hour in order to afford the fair market rent and utilities of a two-bedroom apartment without spending more than 30% of his or her income. National Low Income Housing Coalition, Out of Reach 2015
PERCENT OF INCOME SPENT ON CHILD CARE Families with two children making the median income in Anne Arundel County pay, on average, 20.3% of their income for childcare per year. Maryland Child Care Resource Network, Child Care Demographics 2015
PERCENT OF HOUSEHOLDS IN POVERTY WITH CHILDREN THAT RECEIVE TEMPORARY CASH ASSISTANCE36.4% of families with children who live below the Federal Poverty Line in Anne Arundel County received Temporary Cash Assistance benefits in FY 2015. FY 2015 DHR FIA Statistical Report & American Community Survey 5-Year Estimates 2010-2014
CHILDREN RECEIVING TEMPORARY CASH ASSISTANCE1.99% of children in Anne Arundel County received Temporary Cash Assistance benefits in FY 2015. FY 2015 DHR FIA Statistical Report.
ADULTS RECEIVING TEMPORARY DISABILITY ASSISTANCE.13% of adults in Anne Arundel County participated in the Temporary Disability Assistance Program in FY 2015.Individuals received a maximum of $185 per month. FY 2015 DHR FIA Statistical Report.
PERCENT OF POPULATION PARTICIPATING IN FOOD SUPPLEMENT PROGRAM8.2% of people in Anne Arundel County participated in the Food Supplement Program (formerly known as Food Stamps). The average benefit was $126.83 per person per month in FFY 2015. FY 2015 DHR FIA Statistical Report.
PENETRATION RATE OF FOOD SUPPLEMENT PROGRAM59.1% of eligible individuals in Anne Arundel County participated in the Food Supplement Program.FY 2015 DHR FIA Statistical Report & American Community Survey 5-Year Estimates 2010-2014
PERCENT OF CHILDREN WHO ARE ELIGIBLE FOR THE FREE & REDUCED PRICE MEALS PROGRAM33.4% of children in Anne Arundel County were eligible for the FARMS program during the 2014-2015 school year, meaning their families’ incomes were at or below 185% of the Federal Poverty Line. Maryland State Depart-ment of Education
MEDICAID ENROLLMENT12.2% of people in Anne Arundel County participated in the Medicaid (Medical Assistance) Program in FY 2015.Maryland Department of Health and Mental Hygiene, Maryland Medicaid eHealth Statistics
UNINSURED POPULATION7.00% of people living in Anne Arundel County remain uninsured. Census Bureau, American Community Survey 5-Year Estimates 2010-2014

8
IncomeRanking*
0.0% 5.0% 10.0% 15.0% 20.0% 25.0% 30.0% 35.0% 40.0% 45.0% 50.0%
Overall Poverty Seniors
Children Hispanic or La?no
Black or African American Female Headed Households
61696111
22
INDIVIDUALS LIVING IN DEEP POVERTY49.7% of people in Baltimore City who live in poverty have incomes below 50% of the poverty line - $5,835 for an individual – in 2014. Census Bureau, American Community Survey 5-Year Estimates 2010-2014
INDIVIDUALS LIVING BELOW 200% OF THE FEDERAL POVERTY LINE45.3% of people in Baltimore City live below 200% of the poverty line - $47,000 for a family of four in 2014.Census Bureau, American Community Survey 5-Year Estimates 2010-2014
POVERTY RATE AMONG FEMALE-HEADED HOUSEHOLDS41.0% of Female-Headed Households in Baltimore City live below the poverty line - $23,850 for a family of four – in 2014. Census Bureau, American Community Survey 5-Year Estimates 2010-2014
POVERTY RATE AMONG HISPANIC OR LATINO MARYLANDERS 25.5% of Hispanic or Latino Marylanders in Baltimore City live below the poverty line - $11,670 for an individual – in 2014. Census Bureau, American Community Survey 5-Year Estimates 2010-2014
POVERTY RATE AMONG BLACK OR AFRICAN AMERICAN MARYLANDERS28.3% of Black or African American Marylanders in Baltimore City live below the poverty line - $11,670 for an individual – in 2014. Census Bureau, American Community Survey 5-Year Estimates 2010-2014
SENIOR POVERTY RATE17.4% of seniors in Baltimore City live below the poverty line - $11,670 for an individual – in 2014.Census Bureau, American Community Survey 5-Year Estimates 2010-2014
CHILD POVERTY RATE34.6% of children in Baltimore City live below the poverty line - $23,850 for a family of four – in 2014.Census Bureau, American Community Survey 5-Year Estimates 2010-2014
POVERTY RATE24.2% of people in Baltimore City live below the poverty line - $23,850 for a family of four – in 2014.Census Bureau, American Community Survey 5-Year Estimates 2010-2014
MEDIAN INCOMEThe median income for households in Baltimore City is $41,819.Census Bureau, American Community Survey 5-Year Estimates 2010-2014
POVERTY RATES IN BALTIMORE CITYPOPULATION OF BALTIMORE CITY:
622,271NUMBER OF PEOPLE IN BALTIMORE CITY LIVING IN POVERTY IN 2014:
144,849
Baltimore City
0.0% 5.0% 10.0% 15.0% 20.0% 25.0% 30.0% 35.0% 40.0% 45.0%
Overall Poverty Seniors
Children Hispanic or La?no
Black or African American Female Headed Households

Maryland Poverty Profiles 9
Income Supports
Ranking*
* Ranking - a ranking of 1 indicates the jurisdiction has the highest figure in the state in that category, and a ranking of 24 means the lowest figure in the state in that category. Therefore, being ranked 1 does not necessarily mean success in a given category.
51231111
173
UNINSURED POPULATION11.60% of people living in Baltimore City remain uninsured. Census Bureau, American Community Survey 5-Year Estimates 2010-2014
MEDICAID ENROLLMENT32.6% of people in Baltimore City participated in the Medicaid (Medical Assistance) Program in FY 2015.Maryland Department of Health and Mental Hygiene, Maryland Medicaid eHealth Statistics
PERCENT OF CHILDREN WHO ARE ELIGIBLE FOR THE FREE & REDUCED PRICE MEALS PROGRAM84.2% of children in Baltimore City were eligible for the FARMS program during the 2014-2015 school year, meaning their families’ incomes were at or below 185% of the Federal Poverty Line. Maryland State Department of Education
PENETRATION RATE OF FOOD SUPPLEMENT PROGRAM80.7% of eligible individuals in Baltimore City participated in the Food Supplement Program.FY 2015 DHR FIA Statistical Report & American Community Survey 5-Year Estimates 2010-2014
PERCENT OF POPULATION PARTICIPATING IN FOOD SUPPLEMENT PROGRAM33.1% of people in Baltimore City participated in the Food Supplement Program (formerly known as Food Stamps). The average benefit was $126.83 per person per month in FFY 2015. FY 2015 DHR FIA Statistical Report.
ADULTS RECEIVING TEMPORARY DISABILITY ASSISTANCE2.35% of adults in Baltimore City participated in the Temporary Disability Assistance Program in FY 2015. Indi-viduals received a maximum of $185 per month. FY 2015 DHR FIA Statistical Report.
CHILDREN RECEIVING TEMPORARY CASH ASSISTANCE13.77% of children in Baltimore City received Temporary Cash Assistance benefits in FY 2015. FY 2015 DHR FIA Statistical Report.
PERCENT OF HOUSEHOLDS IN POVERTY WITH CHILDREN THAT RECEIVE TEMPORARY CASH ASSISTANCE53.3% of families with children who live below the Federal Poverty Line in Baltimore City received Temporary Cash Assistance benefits in FY 2015. FY 2015 DHR FIA Statistical Report & American Community Survey 5-Year Estimates 2010-2014
PERCENT OF INCOME SPENT ON CHILD CARE Families with two children making the median income in Baltimore City pay, on average, 29.0% of their income for childcare per year. Maryland Child Care Resource Network, Child Care Demographics 2015
HOUSING WAGEA worker in Baltimore City needs to make $23.69 per hour in order to afford the fair market rent and utilities of a two-bedroom apartment without spending more than 30% of his or her income. National Low Income Housing Coalition, Out of Reach 2015
UNEMPLOYMENT RATE8.7% of residents of Baltimore City are unemployed.Bureau of Labor Statistics, Labor Force Data by County, 2014 average

10
IncomeRanking*
0.0% 5.0% 10.0% 15.0% 20.0% 25.0% 30.0% 35.0% 40.0% 45.0% 50.0%
Overall Poverty Seniors
Children Hispanic or La?no
Black or African American Female Headed Households
714181617101514
12
INDIVIDUALS LIVING IN DEEP POVERTY49.6% of people in Baltimore County who live in poverty have incomes below 50% of the poverty line - $5,835 for an individual – in 2014. Census Bureau, American Community Survey 5-Year Estimates 2010-2014
INDIVIDUALS LIVING BELOW 200% OF THE FEDERAL POVERTY LINE22.7% of people in Baltimore County live below 200% of the poverty line - $47,000 for a family of four in 2014.Census Bureau, American Community Survey 5-Year Estimates 2010-2014
POVERTY RATE AMONG FEMALE-HEADED HOUSEHOLDS21.3% of Female-Headed Households in Baltimore County live below the poverty line - $23,850 for a family of four – in 2014. Census Bureau, American Community Survey 5-Year Estimates 2010-2014
POVERTY RATE AMONG HISPANIC OR LATINO MARYLANDERS 14.6% of Hispanic or Latino Marylanders in Baltimore County live below the poverty line - $11,670 for an individ-ual – in 2014. Census Bureau, American Community Survey 5-Year Estimates 2010-2014
POVERTY RATE AMONG BLACK OR AFRICAN AMERICAN MARYLANDERS12.3% of Black or African American Marylanders in Baltimore County live below the poverty line - $11,670 for an individual – in 2014. Census Bureau, American Community Survey 5-Year Estimates 2010-2014
SENIOR POVERTY RATE7.0% of seniors in Baltimore County live below the poverty line - $11,670 for an individual – in 2014.Census Bureau, American Community Survey 5-Year Estimates 2010-2014
CHILD POVERTY RATE11.7% of children in Baltimore County live below the poverty line - $23,850 for a family of four – in 2014.Census Bureau, American Community Survey 5-Year Estimates 2010-2014
POVERTY RATE9.1% of people in Baltimore County live below the poverty line - $23,850 for a family of four – in 2014.Census Bureau, American Community Survey 5-Year Estimates 2010-2014
MEDIAN INCOMEThe median income for households in Baltimore County is $66,940.Census Bureau, American Community Survey 5-Year Estimates 2010-2014
POVERTY RATES IN BALTIMORE COUNTYPOPULATION OF BALTIMORE COUNTY:
817,720NUMBER OF PEOPLE IN BALTIMORE COUNTY LIVING IN POVERTY IN 2014:
72,175
Baltimore County
0.0% 5.0% 10.0% 15.0% 20.0% 25.0%
Overall Poverty Seniors
Children Hispanic or La=no
Black or African American Female Headed Households

Maryland Poverty Profiles 11
Income Supports
Ranking*
* Ranking - a ranking of 1 indicates the jurisdiction has the highest figure in the state in that category, and a ranking of 24 means the lowest figure in the state in that category. Therefore, being ranked 1 does not necessarily mean success in a given category.
121311101312118
5712
PERCENT OF INCOME SPENT ON CHILD CARE Families with two children making the median income in Baltimore County pay, on average, 21.8% of their income for childcare per year. Maryland Child Care Resource Network, Child Care Demographics 2015
HOUSING WAGEA worker in Baltimore County needs to make $23.69 per hour in order to afford the fair market rent and utilities of a two-bedroom apartment without spending more than 30% of his or her income. National Low Income Housing Coalition, Out of Reach 2015
UNEMPLOYMENT RATE6.2% of residents of Baltimore County are unemployed.Bureau of Labor Statistics, Labor Force Data by County, 2014 average
PERCENT OF HOUSEHOLDS IN POVERTY WITH CHILDREN THAT RECEIVE TEMPORARY CASH ASSISTANCE31.0% of families with children who live below the Federal Poverty Line in Baltimore County received Temporary Cash Assistance benefits in FY 2015. FY 2015 DHR FIA Statistical Report & American Community Survey 5-Year Estimates 2010-2014
CHILDREN RECEIVING TEMPORARY CASH ASSISTANCE2.95% of children in Baltimore County received Temporary Cash Assistance benefits in FY 2015. FY 2015 DHR FIA Statistical Report.
ADULTS RECEIVING TEMPORARY DISABILITY ASSISTANCE.26% of adults in Baltimore County participated in the Temporary Disability Assistance Program in FY 2015. Individuals received a maximum of $185 per month. FY 2015 DHR FIA Statistical Report.
PERCENT OF POPULATION PARTICIPATING IN FOOD SUPPLEMENT PROGRAM13.3% of people in Baltimore County participated in the Food Supplement Program (formerly known as Food Stamps). The average benefit was $126.83 per person per month in FFY 2015. FY 2015 DHR FIA Statistical Report.
PENETRATION RATE OF FOOD SUPPLEMENT PROGRAM6.66% of eligible individuals in Baltimore County participated in the Food Supplement Program.FY 2015 DHR FIA Statistical Report & American Community Survey 5-Year Estimates 2010-2014
PERCENT OF CHILDREN WHO ARE ELIGIBLE FOR THE FREE & REDUCED PRICE MEALS PROGRAM47.4% of children in Baltimore County were eligible for the FARMS program during the 2014-2015 school year, meaning their families’ incomes were at or below 185% of the Federal Poverty Line. Maryland State Department of Education
MEDICAID ENROLLMENT17.0% of people in Baltimore County participated in the Medicaid (Medical Assistance) Program in FY 2015.Maryland Department of Health and Mental Hygiene, Maryland Medicaid eHealth Statistics
UNINSURED POPULATION9.00% of people living in Baltimore County remain uninsured. Census Bureau, American Community Survey 5-Year Estimates 2010-2014

12
IncomeRanking*
0.0% 5.0% 10.0% 15.0% 20.0% 25.0% 30.0% 35.0% 40.0% 45.0% 50.0%
Overall Poverty Seniors
Children Hispanic or La?no
Black or African American Female Headed Households
222231818102322
3
INDIVIDUALS LIVING IN DEEP POVERTY58.9% of people in Calvert County who live in poverty have incomes below 50% of the poverty line - $5,835 for an individual – in 2014. Census Bureau, American Community Survey 5-Year Estimates 2010-2014
INDIVIDUALS LIVING BELOW 200% OF THE FEDERAL POVERTY LINE14.3% of people in Calvert County live below 200% of the poverty line - $47,000 for a family of four in 2014.Census Bureau, American Community Survey 5-Year Estimates 2010-2014
POVERTY RATE AMONG FEMALE-HEADED HOUSEHOLDS18.1% of Female-Headed Households in Calvert County live below the poverty line - $23,850 for a family of four – in 2014. Census Bureau, American Community Survey 5-Year Estimates 2010-2014
POVERTY RATE AMONG HISPANIC OR LATINO MARYLANDERS 12.3% of Hispanic or Latino Marylanders in Calvert County live below the poverty line - $11,670 for an individual – in 2014. Census Bureau, American Community Survey 5-Year Estimates 2010-2014
POVERTY RATE AMONG BLACK OR AFRICAN AMERICAN MARYLANDERS11.8% of Black or African American Marylanders in Calvert County live below the poverty line - $11,670 for an individual – in 2014. Census Bureau, American Community Survey 5-Year Estimates 2010-2014
SENIOR POVERTY RATE7.0% of seniors in Calvert County live below the poverty line - $11,670 for an individual – in 2014.Census Bureau, American Community Survey 5-Year Estimates 2010-2014
CHILD POVERTY RATE6.3% of children in Calvert County live below the poverty line - $23,850 for a family of four – in 2014.Census Bureau, American Community Survey 5-Year Estimates 2010-2014
POVERTY RATE5.8% of people in Calvert County live below the poverty line - $23,850 for a family of four – in 2014.Census Bureau, American Community Survey 5-Year Estimates 2010-2014
MEDIAN INCOMEThe median income for households in Calvert County is $95,425.Census Bureau, American Community Survey 5-Year Estimates 2010-2014
POVERTY RATES IN CALVERT COUNTYPOPULATION OF CALVERT COUNTY:
89,793NUMBER OF PEOPLE IN CALVERT COUNTY LIVING IN POVERTY IN 2014:
5,170
Calvert County
0.0% 2.0% 4.0% 6.0% 8.0% 10.0% 12.0% 14.0% 16.0% 18.0% 20.0%
Overall Poverty Seniors
Children Hispanic or La?no
Black or African American Female Headed Households

Maryland Poverty Profiles 13
Income Supports
Ranking*
* Ranking - a ranking of 1 indicates the jurisdiction has the highest figure in the state in that category, and a ranking of 24 means the lowest figure in the state in that category. Therefore, being ranked 1 does not necessarily mean success in a given category.
202022417162218
24118
UNINSURED POPULATION6.40% of people living in Calvert County remain uninsured. Census Bureau, American Community Survey 5-Year Estimates 2010-2014
MEDICAID ENROLLMENT12.4% of people in Calvert County participated in the Medicaid (Medical Assistance) Program in FY 2015.Maryland Department of Health and Mental Hygiene, Maryland Medicaid eHealth Statistics
PERCENT OF CHILDREN WHO ARE ELIGIBLE FOR THE FREE & REDUCED PRICE MEALS PROGRAM23.7% of children in Calvert County were eligible for the FARMS program during the 2014-2015 school year, meaning their families’ incomes were at or below 185% of the Federal Poverty Line. Maryland State Department of Education
PENETRATION RATE OF FOOD SUPPLEMENT PROGRAM79.0% of eligible individuals in Calvert County participated in the Food Supplement Program.FY 2015 DHR FIA Statistical Report & American Community Survey 5-Year Estimates 2010-2014
PERCENT OF POPULATION PARTICIPATING IN FOOD SUPPLEMENT PROGRAM10.1% of people in Calvert County participated in the Food Supplement Program (formerly known as Food Stamps). The average benefit was $126.83 per person per month in FFY 2015. FY 2015 DHR FIA Statistical Report.
ADULTS RECEIVING TEMPORARY DISABILITY ASSISTANCE.17% of adults in Calvert County participated in the Temporary Disability Assistance Program in FY 2015. Individ-uals received a maximum of $185 per month.wFY 2015 DHR FIA Statistical Report.
CHILDREN RECEIVING TEMPORARY CASH ASSISTANCE1.01% of children in Calvert County received Temporary Cash Assistance benefits in FY 2015. FY 2015 DHR FIA Statistical Report.
PERCENT OF HOUSEHOLDS IN POVERTY WITH CHILDREN THAT RECEIVE TEMPORARY CASH ASSISTANCE19.1% of families with children who live below the Federal Poverty Line in Calvert County received Temporary Cash Assistance benefits in FY 2015. FY 2015 DHR FIA Statistical Report & American Community Survey 5-Year Estimates 2010-2014
PERCENT OF INCOME SPENT ON CHILD CARE Families with two children making the median income in Calvert County pay, on average, 16.5% of their income for childcare per year. Maryland Child Care Resource Network, Child Care Demographics 2015
HOUSING WAGEA worker in Calvert County needs to make $28.04 per hour in order to afford the fair market rent and utilities of a two-bedroom apartment without spending more than 30% of his or her income. National Low Income Housing Coalition, Out of Reach 2015
UNEMPLOYMENT RATE5.3% of residents of Calvert County are unemployed.Bureau of Labor Statistics, Labor Force Data by County, 2014 average

14
IncomeRanking*
0.0% 5.0% 10.0% 15.0% 20.0% 25.0% 30.0% 35.0% 40.0% 45.0% 50.0%
Overall Poverty Seniors
Children Hispanic or La?no
Black or African American Female Headed Households
87427376
18
INDIVIDUALS LIVING IN DEEP POVERTY49.2% of people in Caroline County who live in poverty have incomes below 50% of the poverty line - $5,835 for an individual – in 2014. Census Bureau, American Community Survey 5-Year Estimates 2010-2014
INDIVIDUALS LIVING BELOW 200% OF THE FEDERAL POVERTY LINE32.5% of people in Caroline County live below 200% of the poverty line - $47,000 for a family of four in 2014.Census Bureau, American Community Survey 5-Year Estimates 2010-2014
POVERTY RATE AMONG FEMALE-HEADED HOUSEHOLDS44.1% of Female-Headed Households in Caroline County live below the poverty line - $23,850 for a family of four – in 2014. Census Bureau, American Community Survey 5-Year Estimates 2010-2014
POVERTY RATE AMONG HISPANIC OR LATINO MARYLANDERS 35.3% of Hispanic or Latino Marylanders in Caroline County live below the poverty line - $11,670 for an individ-ual – in 2014. Census Bureau, American Community Survey 5-Year Estimates 2010-2014
POVERTY RATE AMONG BLACK OR AFRICAN AMERICAN MARYLANDERS26.6% of Black or African American Marylanders in Caroline County live below the poverty line - $11,670 for an individual – in 2014. Census Bureau, American Community Survey 5-Year Estimates 2010-2014
SENIOR POVERTY RATE9.2% of seniors in Caroline County live below the poverty line - $11,670 for an individual – in 2014.Census Bureau, American Community Survey 5-Year Estimates 2010-2014
CHILD POVERTY RATE22.1% of children in Caroline County live below the poverty line - $23,850 for a family of four – in 2014.Census Bureau, American Community Survey 5-Year Estimates 2010-2014
POVERTY RATE15.3% of people in Caroline County live below the poverty line - $23,850 for a family of four – in 2014.Census Bureau, American Community Survey 5-Year Estimates 2010-2014
MEDIAN INCOMEThe median income for households in Caroline County is $55,605.Census Bureau, American Community Survey 5-Year Estimates 2010-2014
POVERTY RATES IN CAROLINE COUNTYPOPULATION OF CAROLINE COUNTY:
32,759NUMBER OF PEOPLE IN CAROLINE COUNTY LIVING IN POVERTY IN 2014:
4,928
Caroline County
0.0% 5.0% 10.0% 15.0% 20.0% 25.0% 30.0% 35.0% 40.0% 45.0% 50.0%
Overall Poverty Seniors
Children Hispanic or La?no
Black or African American Female Headed Households

Maryland Poverty Profiles 15
Income Supports
Ranking*
* Ranking - a ranking of 1 indicates the jurisdiction has the highest figure in the state in that category, and a ranking of 24 means the lowest figure in the state in that category. Therefore, being ranked 1 does not necessarily mean success in a given category.
236757813
202011
UNINSURED POPULATION12.80% of people living in Caroline County remain uninsured. Census Bureau, American Community Survey 5-Year Estimates 2010-2014
MEDICAID ENROLLMENT26.1% of people in Caroline County participated in the Medicaid (Medical Assistance) Program in FY 2015.Maryland Department of Health and Mental Hygiene, Maryland Medicaid eHealth Statistics
PERCENT OF CHILDREN WHO ARE ELIGIBLE FOR THE FREE & REDUCED PRICE MEALS PROGRAM57.3% of children in Caroline County were eligible for the FARMS program during the 2014-2015 school year, meaning their families’ incomes were at or below 185% of the Federal Poverty Line. Maryland State Department of Education
PENETRATION RATE OF FOOD SUPPLEMENT PROGRAM69.6% of eligible individuals in Caroline County participated in the Food Supplement Program.FY 2015 DHR FIA Statistical Report & American Community Survey 5-Year Estimates 2010-2014
PERCENT OF POPULATION PARTICIPATING IN FOOD SUPPLEMENT PROGRAM20.8% of people in Caroline County participated in the Food Supplement Program (formerly known as Food Stamps). The average benefit was $126.83 per person per month in FFY 2015. FY 2015 DHR FIA Statistical Report.
ADULTS RECEIVING TEMPORARY DISABILITY ASSISTANCE.37% of adults in Caroline County participated in the Temporary Disability Assistance Program in FY 2015. Individuals received a maximum of $185 per month. FY 2015 DHR FIA Statistical Report.
CHILDREN RECEIVING TEMPORARY CASH ASSISTANCE3.88% of children in Caroline County received Temporary Cash Assistance benefits in FY 2015. FY 2015 DHR FIA Statistical Report.
PERCENT OF HOUSEHOLDS IN POVERTY WITH CHILDREN THAT RECEIVE TEMPORARY CASH ASSISTANCE22.1% of families with children who live below the Federal Poverty Line in Caroline County received Temporary Cash Assistance benefits in FY 2015. FY 2015 DHR FIA Statistical Report & American Community Survey 5-Year Estimates 2010-2014
PERCENT OF INCOME SPENT ON CHILD CARE Families with two children making the median income in Caroline County pay, on average, 18.0% of their income for childcare per year. Maryland Child Care Resource Network, Child Care Demographics 2015
HOUSING WAGEA worker in Caroline County needs to make $16.17 per hour in order to afford the fair market rent and utilities of a two-bedroom apartment without spending more than 30% of his or her income. National Low Income Housing Coalition, Out of Reach 2015
UNEMPLOYMENT RATE6.3% of residents of Caroline County are unemployed.Bureau of Labor Statistics, Labor Force Data by County, 2014 average

16
IncomeRanking*
0.0% 5.0% 10.0% 15.0% 20.0% 25.0% 30.0% 35.0% 40.0% 45.0% 50.0%
Overall Poverty Seniors
Children Hispanic or La?no
Black or African American Female Headed Households
1223161316202123
8
INDIVIDUALS LIVING IN DEEP POVERTY47.9% of people in Carroll County who live in poverty have incomes below 50% of the poverty line - $5,835 for an individual – in 2014. Census Bureau, American Community Survey 5-Year Estimates 2010-2014
INDIVIDUALS LIVING BELOW 200% OF THE FEDERAL POVERTY LINE14.2% of people in Carroll County live below 200% of the poverty line - $47,000 for a family of four in 2014.Census Bureau, American Community Survey 5-Year Estimates 2010-2014
POVERTY RATE AMONG FEMALE-HEADED HOUSEHOLDS23.8% of Female-Headed Households in Carroll County live below the poverty line - $23,850 for a family of four – in 2014. Census Bureau, American Community Survey 5-Year Estimates 2010-2014
POVERTY RATE AMONG HISPANIC OR LATINO MARYLANDERS 18.5% of Hispanic or Latino Marylanders in Carroll County live below the poverty line - $11,670 for an individual – in 2014. Census Bureau, American Community Survey 5-Year Estimates 2010-2014
POVERTY RATE AMONG BLACK OR AFRICAN AMERICAN MARYLANDERS14.1% of Black or African American Marylanders in Carroll County live below the poverty line - $11,670 for an individual – in 2014. Census Bureau, American Community Survey 5-Year Estimates 2010-2014
SENIOR POVERTY RATE5.2% of seniors in Carroll County live below the poverty line - $11,670 for an individual – in 2014.Census Bureau, American Community Survey 5-Year Estimates 2010-2014
CHILD POVERTY RATE7.1% of children in Carroll County live below the poverty line - $23,850 for a family of four – in 2014.Census Bureau, American Community Survey 5-Year Estimates 2010-2014
POVERTY RATE5.5% of people in Carroll County live below the poverty line - $23,850 for a family of four – in 2014.Census Bureau, American Community Survey 5-Year Estimates 2010-2014
MEDIAN INCOMEThe median income for households in Carroll County is $85,532.Census Bureau, American Community Survey 5-Year Estimates 2010-2014
POVERTY RATES IN CARROLL COUNTYPOPULATION OF CARROLL COUNTY:
167,399NUMBER OF PEOPLE IN CARROLL COUNTY LIVING IN POVERTY IN 2014:
9,050
Carroll County
0.0% 5.0% 10.0% 15.0% 20.0% 25.0%
Overall Poverty Seniors
Children Hispanic or La=no
Black or African American Female Headed Households

Maryland Poverty Profiles 17
Income Supports
Ranking*
* Ranking - a ranking of 1 indicates the jurisdiction has the highest figure in the state in that category, and a ranking of 24 means the lowest figure in the state in that category. Therefore, being ranked 1 does not necessarily mean success in a given category.
2324241522162317
15722 UNEMPLOYMENT RATE
4.9% of residents of Carroll County are unemployed.Bureau of Labor Statistics, Labor Force Data by County, 2014 average
HOUSING WAGEA worker in Carroll County needs to make $23.69 per hour in order to afford the fair market rent and utilities of a two-bedroom apartment without spending more than 30% of his or her income. National Low Income Housing Coalition, Out of Reach 2015
PERCENT OF INCOME SPENT ON CHILD CARE Families with two children making the median income in Carroll County pay, on average, 19.2% of their income for childcare per year. Maryland Child Care Resource Network, Child Care Demographics 2015
PERCENT OF HOUSEHOLDS IN POVERTY WITH CHILDREN THAT RECEIVE TEMPORARY CASH ASSISTANCE19.2% of families with children who live below the Federal Poverty Line in Carroll County received Temporary Cash Assistance benefits in FY 2015. FY 2015 DHR FIA Statistical Report & American Community Survey 5-Year Estimates 2010-2014
CHILDREN RECEIVING TEMPORARY CASH ASSISTANCE.99% of children in Carroll County received Temporary Cash Assistance benefits in FY 2015. FY 2015 DHR FIA Statistical Report.
ADULTS RECEIVING TEMPORARY DISABILITY ASSISTANCE.17% of adults in Carroll County participated in the Temporary Disability Assistance Program in FY 2015. Individ-uals received a maximum of $185 per month. FY 2015 DHR FIA Statistical Report.
PERCENT OF POPULATION PARTICIPATING IN FOOD SUPPLEMENT PROGRAM7.6% of people in Carroll County participated in the Food Supplement Program (formerly known as Food Stamps). The average benefit was $126.83 per person per month in FFY 2015. FY 2015 DHR FIA Statistical Report.
PENETRATION RATE OF FOOD SUPPLEMENT PROGRAM61.2% of eligible individuals in Carroll County participated in the Food Supplement Program.FY 2015 DHR FIA Statistical Report & American Community Survey 5-Year Estimates 2010-2014
PERCENT OF CHILDREN WHO ARE ELIGIBLE FOR THE FREE & REDUCED PRICE MEALS PROGRAM20.0% of children in Carroll County were eligible for the FARMS program during the 2014-2015 school year, meaning their families’ incomes were at or below 185% of the Federal Poverty Line. Maryland State Department of Education
MEDICAID ENROLLMENT9.9% of people in Carroll County participated in the Medicaid (Medical Assistance) Program in FY 2015.Maryland Department of Health and Mental Hygiene, Maryland Medicaid eHealth Statistics
UNINSURED POPULATION5.30% of people living in Carroll County remain uninsured. Census Bureau, American Community Survey 5-Year Estimates 2010-2014

18
IncomeRanking*
0.0% 5.0% 10.0% 15.0% 20.0% 25.0% 30.0% 35.0% 40.0% 45.0% 50.0%
Overall Poverty Seniors
Children Hispanic or La?no
Black or African American Female Headed Households
2012175
20101211
13
INDIVIDUALS LIVING IN DEEP POVERTY43.8% of people in Cecil County who live in poverty have incomes below 50% of the poverty line - $5,835 for an individual – in 2014. Census Bureau, American Community Survey 5-Year Estimates 2010-2014
INDIVIDUALS LIVING BELOW 200% OF THE FEDERAL POVERTY LINE25.4% of people in Cecil County live below 200% of the poverty line - $47,000 for a family of four in 2014.Census Bureau, American Community Survey 5-Year Estimates 2010-2014
POVERTY RATE AMONG FEMALE-HEADED HOUSEHOLDS23.7% of Female-Headed Households in Cecil County live below the poverty line - $23,850 for a family of four – in 2014. Census Bureau, American Community Survey 5-Year Estimates 2010-2014
POVERTY RATE AMONG HISPANIC OR LATINO MARYLANDERS 28.6% of Hispanic or Latino Marylanders in Cecil County live below the poverty line - $11,670 for an individual – in 2014. Census Bureau, American Community Survey 5-Year Estimates 2010-2014
POVERTY RATE AMONG BLACK OR AFRICAN AMERICAN MARYLANDERS11.3% of Black or African American Marylanders in Cecil County live below the poverty line - $11,670 for an individual – in 2014. Census Bureau, American Community Survey 5-Year Estimates 2010-2014
SENIOR POVERTY RATE7.0% of seniors in Cecil County live below the poverty line - $11,670 for an individual – in 2014.Census Bureau, American Community Survey 5-Year Estimates 2010-2014
CHILD POVERTY RATE14.3% of children in Cecil County live below the poverty line - $23,850 for a family of four – in 2014.Census Bureau, American Community Survey 5-Year Estimates 2010-2014
POVERTY RATE10.6% of people in Cecil County live below the poverty line - $23,850 for a family of four – in 2014.Census Bureau, American Community Survey 5-Year Estimates 2010-2014
MEDIAN INCOMEThe median income for households in Cecil County is $65,124.Census Bureau, American Community Survey 5-Year Estimates 2010-2014
POVERTY RATES IN CECIL COUNTYPOPULATION OF CECIL COUNTY:
101,803NUMBER OF PEOPLE IN CECIL COUNTY LIVING IN POVERTY IN 2014:
10,612
Cecil County
0.0% 5.0% 10.0% 15.0% 20.0% 25.0% 30.0% 35.0%
Overall Poverty Seniors
Children Hispanic or La>no
Black or African American Female Headed Households

Maryland Poverty Profiles 19
Income Supports
Ranking*
* Ranking - a ranking of 1 indicates the jurisdiction has the highest figure in the state in that category, and a ranking of 24 means the lowest figure in the state in that category. Therefore, being ranked 1 does not necessarily mean success in a given category.
1491299494
16148 UNEMPLOYMENT RATE
6.6% of residents of Cecil County are unemployed.Bureau of Labor Statistics, Labor Force Data by County, 2014 average
HOUSING WAGEA worker in Cecil County needs to make $22.23 per hour in order to afford the fair market rent and utilities of a two-bedroom apartment without spending more than 30% of his or her income. National Low Income Housing Coalition, Out of Reach 2015
PERCENT OF INCOME SPENT ON CHILD CARE Families with two children making the median income in Cecil County pay, on average, 19.1% of their income for childcare per year. Maryland Child Care Resource Network, Child Care Demographics 2015
PERCENT OF HOUSEHOLDS IN POVERTY WITH CHILDREN THAT RECEIVE TEMPORARY CASH ASSISTANCE37.1% of families with children who live below the Federal Poverty Line in Cecil County received Temporary Cash Assistance benefits in FY 2015. FY 2015 DHR FIA Statistical Report & American Community Survey 5-Year Estimates 2010-2014
CHILDREN RECEIVING TEMPORARY CASH ASSISTANCE3.79% of children in Cecil County received Temporary Cash Assistance benefits in FY 2015. FY 2015 DHR FIA Statistical Report.
ADULTS RECEIVING TEMPORARY DISABILITY ASSISTANCE.48% of adults in Cecil County participated in the Temporary Disability Assistance Program in FY 2015. Individu-als received a maximum of $185 per month. FY 2015 DHR FIA Statistical Report.
PERCENT OF POPULATION PARTICIPATING IN FOOD SUPPLEMENT PROGRAM15.4% of people in Cecil County participated in the Food Supplement Program (formerly known as Food Stamps). The average benefit was $126.83 per person per month in FFY 2015. FY 2015 DHR FIA Statistical Report.
PENETRATION RATE OF FOOD SUPPLEMENT PROGRAM66.9% of eligible individuals in Cecil County participated in the Food Supplement Program.FY 2015 DHR FIA Statistical Report & American Community Survey 5-Year Estimates 2010-2014
PERCENT OF CHILDREN WHO ARE ELIGIBLE FOR THE FREE & REDUCED PRICE MEALS PROGRAM44.5% of children in Cecil County were eligible for the FARMS program during the 2014-2015 school year, meaning their families’ incomes were at or below 185% of the Federal Poverty Line. Maryland State Department of Education
MEDICAID ENROLLMENT19.7% of people in Cecil County participated in the Medicaid (Medical Assistance) Program in FY 2015.Maryland Department of Health and Mental Hygiene, Maryland Medicaid eHealth Statistics
UNINSURED POPULATION8.60% of people living in Cecil County remain uninsured. Census Bureau, American Community Survey 5-Year Estimates 2010-2014

20
IncomeRanking*
0.0% 5.0% 10.0% 15.0% 20.0% 25.0% 30.0% 35.0% 40.0% 45.0% 50.0%
Overall Poverty Seniors
Children Hispanic or La?no
Black or African American Female Headed Households
0.0% 5.0% 10.0% 15.0% 20.0% 25.0%
Overall Poverty Seniors
Children Hispanic or La=no
Black or African American Female Headed Households
151920232381716
4
INDIVIDUALS LIVING IN DEEP POVERTY46.7% of people in Charles County who live in poverty have incomes below 50% of the poverty line - $5,835 for an individual – in 2014. Census Bureau, American Community Survey 5-Year Estimates 2010-2014
INDIVIDUALS LIVING BELOW 200% OF THE FEDERAL POVERTY LINE17.3% of people in Charles County live below 200% of the poverty line - $47,000 for a family of four in 2014.Census Bureau, American Community Survey 5-Year Estimates 2010-2014
POVERTY RATE AMONG FEMALE-HEADED HOUSEHOLDS20.3% of Female-Headed Households in Charles County live below the poverty line - $23,850 for a family of four – in 2014. Census Bureau, American Community Survey 5-Year Estimates 2010-2014
POVERTY RATE AMONG HISPANIC OR LATINO MARYLANDERS 10.4% of Hispanic or Latino Marylanders in Charles County live below the poverty line - $11,670 for an individual – in 2014. Census Bureau, American Community Survey 5-Year Estimates 2010-2014
POVERTY RATE AMONG BLACK OR AFRICAN AMERICAN MARYLANDERS9.2% of Black or African American Marylanders in Charles County live below the poverty line - $11,670 for an individual – in 2014. Census Bureau, American Community Survey 5-Year Estimates 2010-2014
SENIOR POVERTY RATE7.6% of seniors in Charles County live below the poverty line - $11,670 for an individual – in 2014.Census Bureau, American Community Survey 5-Year Estimates 2010-2014
CHILD POVERTY RATE10.5% of children in Charles County live below the poverty line - $23,850 for a family of four – in 2014.Census Bureau, American Community Survey 5-Year Estimates 2010-2014
POVERTY RATE7.6% of people in Charles County live below the poverty line - $23,850 for a family of four – in 2014.Census Bureau, American Community Survey 5-Year Estimates 2010-2014
MEDIAN INCOMEThe median income for households in Charles County is $91,910.Census Bureau, American Community Survey 5-Year Estimates 2010-2014
POVERTY RATES IN CHARLES COUNTYPOPULATION OF CHARLES COUNTY:
150,960NUMBER OF PEOPLE IN CHARLES COUNTY LIVING IN POVERTY IN 2014:
11,279
Charles County

Maryland Poverty Profiles 21
Income Supports
Ranking*
* Ranking - a ranking of 1 indicates the jurisdiction has the highest figure in the state in that category, and a ranking of 24 means the lowest figure in the state in that category. Therefore, being ranked 1 does not necessarily mean success in a given category.
211615514191512
20115
PERCENT OF INCOME SPENT ON CHILD CARE Families with two children making the median income in Charles County pay, on average, 18.0% of their income for childcare per year. Maryland Child Care Resource Network, Child Care Demographics 2015
HOUSING WAGEA worker in Charles County needs to make $28.04 per hour in order to afford the fair market rent and utilities of a two-bedroom apartment without spending more than 30% of his or her income. National Low Income Housing Coalition, Out of Reach 2015
UNEMPLOYMENT RATE5.6% of residents of Charles County are unemployed.Bureau of Labor Statistics, Labor Force Data by County, 2014 average
PERCENT OF HOUSEHOLDS IN POVERTY WITH CHILDREN THAT RECEIVE TEMPORARY CASH ASSISTANCE23.2% of families with children who live below the Federal Poverty Line in Charles County received Temporary Cash Assistance benefits in FY 2015. FY 2015 DHR FIA Statistical Report & American Community Survey 5-Year Estimates 2010-2014
CHILDREN RECEIVING TEMPORARY CASH ASSISTANCE1.93% of children in Charles County received Temporary Cash Assistance benefits in FY 2015. FY 2015 DHR FIA Statistical Report.
ADULTS RECEIVING TEMPORARY DISABILITY ASSISTANCE.16% of adults in Charles County participated in the Temporary Disability Assistance Program in FY 2015. Individuals received a maximum of $185 per month. FY 2015 DHR FIA Statistical Report.
PERCENT OF POPULATION PARTICIPATING IN FOOD SUPPLEMENT PROGRAM12.1% of people in Charles County participated in the Food Supplement Program (formerly known as Food Stamps). The average benefit was $126.83 per person per month in FFY 2015. FY 2015 DHR FIA Statistical Report.
PENETRATION RATE OF FOOD SUPPLEMENT PROGRAM78.0% of eligible individuals in Charles County participated in the Food Supplement Program.FY 2015 DHR FIA Statistical Report & American Community Survey 5-Year Estimates 2010-2014
PERCENT OF CHILDREN WHO ARE ELIGIBLE FOR THE FREE & REDUCED PRICE MEALS PROGRAM35.2% of children in Charles County were eligible for the FARMS program during the 2014-2015 school year, meaning their families’ incomes were at or below 185% of the Federal Poverty Line. Maryland State Department of Education
MEDICAID ENROLLMENT14.9% of people in Charles County participated in the Medicaid (Medical Assistance) Program in FY 2015.Maryland Department of Health and Mental Hygiene, Maryland Medicaid eHealth Statistics
UNINSURED POPULATION6.30% of people living in Charles County remain uninsured. Census Bureau, American Community Survey 5-Year Estimates 2010-2014

22
IncomeRanking*
0.0% 5.0% 10.0% 15.0% 20.0% 25.0% 30.0% 35.0% 40.0% 45.0% 50.0%
Overall Poverty Seniors
Children Hispanic or La?no
Black or African American Female Headed Households
0.0% 5.0% 10.0% 15.0% 20.0% 25.0% 30.0% 35.0% 40.0% 45.0% 50.0%
Overall Poverty Seniors
Children Hispanic or La?no
Black or African American Female Headed Households
184383535
21
INDIVIDUALS LIVING IN DEEP POVERTY45.0% of people in Dorchester County who live in poverty have incomes below 50% of the poverty line - $5,835 for an individual – in 2014. Census Bureau, American Community Survey 5-Year Estimates 2010-2014
INDIVIDUALS LIVING BELOW 200% OF THE FEDERAL POVERTY LINE38.5% of people in Dorchester County live below 200% of the poverty line - $47,000 for a family of four in 2014. Census Bureau, American Community Survey 5-Year Estimates 2010-2014
POVERTY RATE AMONG FEMALE-HEADED HOUSEHOLDS44.7% of Female-Headed Households in Dorchester County live below the poverty line - $23,850 for a family of four – in 2014. Census Bureau, American Community Survey 5-Year Estimates 2010-2014
POVERTY RATE AMONG HISPANIC OR LATINO MARYLANDERS 26.1% of Hispanic or Latino Marylanders in Dorchester County live below the poverty line - $11,670 for an individual – in 2014. Census Bureau, American Community Survey 5-Year Estimates 2010-2014
POVERTY RATE AMONG BLACK OR AFRICAN AMERICAN MARYLANDERS33.9% of Black or African American Marylanders in Dorchester County live below the poverty line - $11,670 for an individual – in 2014. Census Bureau, American Community Survey 5-Year Estimates 2010-2014
SENIOR POVERTY RATE8.4% of seniors in Dorchester County live below the poverty line - $11,670 for an individual – in 2014.Census Bureau, American Community Survey 5-Year Estimates 2010-2014
CHILD POVERTY RATE28.0% of children in Dorchester County live below the poverty line - $23,850 for a family of four – in 2014.Census Bureau, American Community Survey 5-Year Estimates 2010-2014
POVERTY RATE16.9% of people in Dorchester County live below the poverty line - $23,850 for a family of four – in 2014.Census Bureau, American Community Survey 5-Year Estimates 2010-2014
MEDIAN INCOMEThe median income for households in Dorchester County is $45,628.Census Bureau, American Community Survey 5-Year Estimates 2010-2014
POVERTY RATES IN DORCHESTER COUNTYPOPULATION OF DORCHESTER COUNTY:
32,614NUMBER OF PEOPLE IN DORCHESTER COUNTY LIVING IN POVERTY IN 2014:
5,417
Dorchester County

Maryland Poverty Profiles 23
Income Supports
Ranking*
* Ranking - a ranking of 1 indicates the jurisdiction has the highest figure in the state in that category, and a ranking of 24 means the lowest figure in the state in that category. Therefore, being ranked 1 does not necessarily mean success in a given category.
102322336
13214
PERCENT OF INCOME SPENT ON CHILD CARE Families with two children making the median income in Dorchester County pay, on average, 19.7% of their income for childcare per year. Maryland Child Care Resource Network, Child Care Demographics 2015
HOUSING WAGEA worker in Dorchester County needs to make $16.08 per hour in order to afford the fair market rent and utilities of a two-bedroom apartment without spending more than 30% of his or her income. National Low Income Housing Coalition, Out of Reach 2015
UNEMPLOYMENT RATE8.5% of residents of Dorchester County are unemployed.Bureau of Labor Statistics, Labor Force Data by County, 2014 average
PERCENT OF HOUSEHOLDS IN POVERTY WITH CHILDREN THAT RECEIVE TEMPORARY CASH ASSISTANCE33.3% of families with children who live below the Federal Poverty Line in Dorchester County received Tempo-rary Cash Assistance benefits in FY 2015. FY 2015 DHR FIA Statistical Report & American Community Survey 5-Year Estimates 2010-2014
CHILDREN RECEIVING TEMPORARY CASH ASSISTANCE8.12% of children in Dorchester County received Temporary Cash Assistance benefits in FY 2015. FY 2015 DHR FIA Statistical Report.
ADULTS RECEIVING TEMPORARY DISABILITY ASSISTANCE.55% of adults in Dorchester County participated in the Temporary Disability Assistance Program in FY 2015. Individuals received a maximum of $185 per month. FY 2015 DHR FIA Statistical Report.
PERCENT OF POPULATION PARTICIPATING IN FOOD SUPPLEMENT PROGRAM28.8% of people in Dorchester County participated in the Food Supplement Program (formerly known as Food Stamps). The average benefit was $126.83 per person per month in FFY 2015. FY 2015 DHR FIA Statistical Report.
PENETRATION RATE OF FOOD SUPPLEMENT PROGRAM84.0% of eligible individuals in Dorchester County participated in the Food Supplement Program.FY 2015 DHR FIA Statistical Report & American Community Survey 5-Year Estimates 2010-2014
PERCENT OF CHILDREN WHO ARE ELIGIBLE FOR THE FREE & REDUCED PRICE MEALS PROGRAM66.2% of children in Dorchester County were eligible for the FARMS program during the 2014-2015 school year, meaning their families’ incomes were at or below 185% of the Federal Poverty Line. Maryland State Department of Education
MEDICAID ENROLLMENT28.5% of people in Dorchester County participated in the Medicaid (Medical Assistance) Program in FY 2015.Maryland Department of Health and Mental Hygiene, Maryland Medicaid eHealth Statistics
UNINSURED POPULATION9.40% of people living in Dorchester County remain uninsured. Census Bureau, American Community Survey 5-Year Estimates 2010-2014
24
IncomeRanking*
0.0% 5.0% 10.0% 15.0% 20.0% 25.0% 30.0% 35.0% 40.0% 45.0% 50.0%
Overall Poverty Seniors
Children Hispanic or La?no
Black or African American Female Headed Households
0.0% 5.0% 10.0% 15.0% 20.0% 25.0% 30.0%
Overall Poverty Seniors
Children Hispanic or La>no
Black or African American Female Headed Households
918152115182020
9
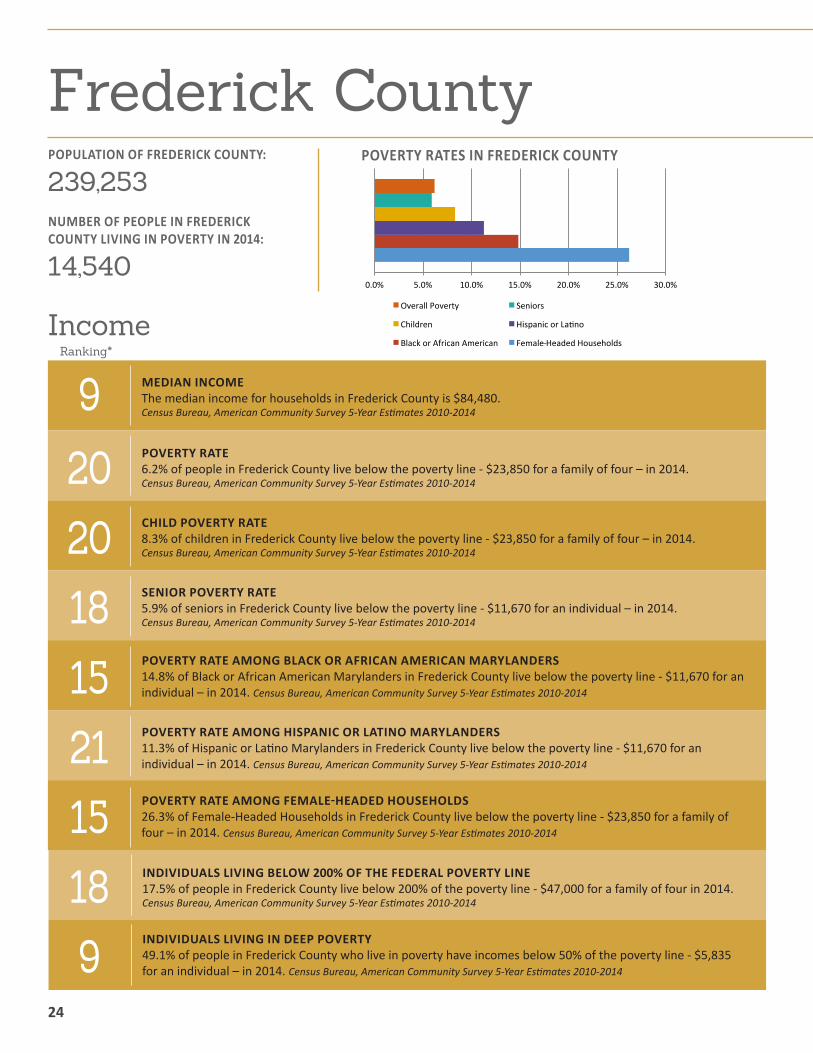
INDIVIDUALS LIVING IN DEEP POVERTY49.1% of people in Frederick County who live in poverty have incomes below 50% of the poverty line - $5,835 for an individual – in 2014. Census Bureau, American Community Survey 5-Year Estimates 2010-2014
INDIVIDUALS LIVING BELOW 200% OF THE FEDERAL POVERTY LINE17.5% of people in Frederick County live below 200% of the poverty line - $47,000 for a family of four in 2014.Census Bureau, American Community Survey 5-Year Estimates 2010-2014
POVERTY RATE AMONG FEMALE-HEADED HOUSEHOLDS26.3% of Female-Headed Households in Frederick County live below the poverty line - $23,850 for a family of four – in 2014. Census Bureau, American Community Survey 5-Year Estimates 2010-2014
POVERTY RATE AMONG HISPANIC OR LATINO MARYLANDERS 11.3% of Hispanic or Latino Marylanders in Frederick County live below the poverty line - $11,670 for an individual – in 2014. Census Bureau, American Community Survey 5-Year Estimates 2010-2014
POVERTY RATE AMONG BLACK OR AFRICAN AMERICAN MARYLANDERS14.8% of Black or African American Marylanders in Frederick County live below the poverty line - $11,670 for an individual – in 2014. Census Bureau, American Community Survey 5-Year Estimates 2010-2014
SENIOR POVERTY RATE5.9% of seniors in Frederick County live below the poverty line - $11,670 for an individual – in 2014.Census Bureau, American Community Survey 5-Year Estimates 2010-2014
CHILD POVERTY RATE8.3% of children in Frederick County live below the poverty line - $23,850 for a family of four – in 2014.Census Bureau, American Community Survey 5-Year Estimates 2010-2014
POVERTY RATE6.2% of people in Frederick County live below the poverty line - $23,850 for a family of four – in 2014.Census Bureau, American Community Survey 5-Year Estimates 2010-2014
MEDIAN INCOMEThe median income for households in Frederick County is $84,480.Census Bureau, American Community Survey 5-Year Estimates 2010-2014
POVERTY RATES IN FREDERICK COUNTYPOPULATION OF FREDERICK COUNTY:
239,253NUMBER OF PEOPLE IN FREDERICK COUNTY LIVING IN POVERTY IN 2014:
14,540
Frederick County

Maryland Poverty Profiles 25
Income Supports
Ranking*
* Ranking - a ranking of 1 indicates the jurisdiction has the highest figure in the state in that category, and a ranking of 24 means the lowest figure in the state in that category. Therefore, being ranked 1 does not necessarily mean success in a given category.
1722202020202015
111
20 UNEMPLOYMENT RATE15.1% of residents of Frederick County are unemployed.Bureau of Labor Statistics, Labor Force Data by County, 2014 average
HOUSING WAGEA worker in Frederick County needs to make $28.04 per hour in order to afford the fair market rent and utilities of a two-bedroom apartment without spending more than 30% of his or her income. National Low Income Housing Coalition, Out of Reach 2015
PERCENT OF INCOME SPENT ON CHILD CARE Families with two children making the median income in Frederick County pay, on average, 20.1% of their income for childcare per year. Maryland Child Care Resource Network, Child Care Demographics 2015
PERCENT OF HOUSEHOLDS IN POVERTY WITH CHILDREN THAT RECEIVE TEMPORARY CASH ASSISTANCE20.07% of families with children who live below the Federal Poverty Line in Frederick County received Tempo-rary Cash Assistance benefits in FY 2015. FY 2015 DHR FIA Statistical Report & American Community Survey 5-Year Estimates 2010-2014
CHILDREN RECEIVING TEMPORARY CASH ASSISTANCE1.27% of children in Frederick County received Temporary Cash Assistance benefits in FY 2015. FY 2015 DHR FIA Statistical Report.
ADULTS RECEIVING TEMPORARY DISABILITY ASSISTANCE.14% of adults in Frederick County participated in the Temporary Disability Assistance Program in FY 2015. Individuals received a maximum of $185 per month. FY 2015 DHR FIA Statistical Report.
PERCENT OF POPULATION PARTICIPATING IN FOOD SUPPLEMENT PROGRAM8.6% of people in Frederick County participated in the Food Supplement Program (formerly known as Food Stamps). The average benefit was $126.83 per person per month in FFY 2015. FY 2015 DHR FIA Statistical Report.
PENETRATION RATE OF FOOD SUPPLEMENT PROGRAM55.3% of eligible individuals in Frederick County participated in the Food Supplement Program.FY 2015 DHR FIA Statistical Report & American Community Survey 5-Year Estimates 2010-2014
PERCENT OF CHILDREN WHO ARE ELIGIBLE FOR THE FREE & REDUCED PRICE MEALS PROGRAM26.5% of children in Frederick County were eligible for the FARMS program during the 2014-2015 school year, meaning their families’ incomes were at or below 185% of the Federal Poverty Line. Maryland State Department of Education
MEDICAID ENROLLMENT12.1% of people in Frederick County participated in the Medicaid (Medical Assistance) Program in FY 2015.Maryland Department of Health and Mental Hygiene, Maryland Medicaid eHealth Statistics
UNINSURED POPULATION7.30% of people living in Frederick County remain uninsured. Census Bureau, American Community Survey 5-Year Estimates 2010-2014

26
IncomeRanking*
0.0% 5.0% 10.0% 15.0% 20.0% 25.0% 30.0% 35.0% 40.0% 45.0% 50.0%
Overall Poverty Seniors
Children Hispanic or La?no
Black or African American Female Headed Households
0.0% 10.0% 20.0% 30.0% 40.0% 50.0% 60.0% 70.0% 80.0%
Overall Poverty Seniors
Children Hispanic or LaBno
Black or African American Female Headed Households
2462101857
20
INDIVIDUALS LIVING IN DEEP POVERTY34.9% of people in Garrett County who live in poverty have incomes below 50% of the poverty line - $5,835 for an individual – in 2014. Census Bureau, American Community Survey 5-Year Estimates 2010-2014
INDIVIDUALS LIVING BELOW 200% OF THE FEDERAL POVERTY LINE35.1% of people in Garrett County live below 200% of the poverty line - $47,000 for a family of four in 2014.Census Bureau, American Community Survey 5-Year Estimates 2010-2014
POVERTY RATE AMONG FEMALE-HEADED HOUSEHOLDS52.3% of Female-Headed Households in Garrett County live below the poverty line - $23,850 for a family of four – in 2014. Census Bureau, American Community Survey 5-Year Estimates 2010-2014
POVERTY RATE AMONG HISPANIC OR LATINO MARYLANDERS 22.2% of Hispanic or Latino Marylanders in Garrett County live below the poverty line - $11,670 for an individual – in 2014. Census Bureau, American Community Survey 5-Year Estimates 2010-2014
POVERTY RATE AMONG BLACK OR AFRICAN AMERICAN MARYLANDERS72.1% of Black or African American Marylanders in Garrett County live below the poverty line - $11,670 for an individual – in 2014. Census Bureau, American Community Survey 5-Year Estimates 2010-2014
SENIOR POVERTY RATE7.6% of seniors in Garrett County live below the poverty line - $11,670 for an individual – in 2014.Census Bureau, American Community Survey 5-Year Estimates 2010-2014
CHILD POVERTY RATE23.2% of children in Garrett County live below the poverty line - $23,850 for a family of four – in 2014.Census Bureau, American Community Survey 5-Year Estimates 2010-2014
POVERTY RATE13.3% of people in Garrett County live below the poverty line - $23,850 for a family of four – in 2014.Census Bureau, American Community Survey 5-Year Estimates 2010-2014
MEDIAN INCOMEThe median income for households in Garrett County is $46,096.Census Bureau, American Community Survey 5-Year Estimates 2010-2014
POVERTY RATES IN GARRETT COUNTYPOPULATION OF GARRETT COUNTY:
29,945NUMBER OF PEOPLE IN GARRETT COUNTY LIVING IN POVERTY IN 2014:
3,897
Garrett County

Maryland Poverty Profiles 27
Income Supports
Ranking*
* Ranking - a ranking of 1 indicates the jurisdiction has the highest figure in the state in that category, and a ranking of 24 means the lowest figure in the state in that category. Therefore, being ranked 1 does not necessarily mean success in a given category.
37102310101224
23237 UNEMPLOYMENT RATE
6.9% of residents of Garrett County are unemployed.Bureau of Labor Statistics, Labor Force Data by County, 2014 average
HOUSING WAGEA worker in Garrett County needs to make $12.58 per hour in order to afford the fair market rent and utilities of a two-bedroom apartment without spending more than 30% of his or her income. National Low Income Housing Coalition, Out of Reach 2015
PERCENT OF INCOME SPENT ON CHILD CARE Families with two children making the median income in Garrett County pay, on average, 16.7% of their income for childcare per year. Maryland Child Care Resource Network, Child Care Demographics 2015
PERCENT OF HOUSEHOLDS IN POVERTY WITH CHILDREN THAT RECEIVE TEMPORARY CASH ASSISTANCE11.7% of families with children who live below the Federal Poverty Line in Garrett County received Temporary Cash Assistance benefits in FY 2015. FY 2015 DHR FIA Statistical Report & American Community Survey 5-Year Estimates 2010-2014
CHILDREN RECEIVING TEMPORARY CASH ASSISTANCE2.19% of children in Garrett County received Temporary Cash Assistance benefits in FY 2015. FY 2015 DHR FIA Statistical Report.
ADULTS RECEIVING TEMPORARY DISABILITY ASSISTANCE.29% of adults in Garrett County participated in the Temporary Disability Assistance Program in FY 2015. Individ-uals received a maximum of $185 per month. FY 2015 DHR FIA Statistical Report.
PERCENT OF POPULATION PARTICIPATING IN FOOD SUPPLEMENT PROGRAM15.2% of people in Garrett County participated in the Food Supplement Program (formerly known as Food Stamps). The average benefit was $126.83 per person per month in FFY 2015. FY 2015 DHR FIA Statistical Report.
PENETRATION RATE OF FOOD SUPPLEMENT PROGRAM49.0% of eligible individuals in Garrett County participated in the Food Supplement Program.FY 2015 DHR FIA Statistical Report & American Community Survey 5-Year Estimates 2010-2014
PERCENT OF CHILDREN WHO ARE ELIGIBLE FOR THE FREE & REDUCED PRICE MEALS PROGRAM48.9% of children in Garrett County were eligible for the FARMS program during the 2014-2015 school year, meaning their families’ incomes were at or below 185% of the Federal Poverty Line. Maryland State Department of Education
MEDICAID ENROLLMENT20.7% of people in Garrett County participated in the Medicaid (Medical Assistance) Program in FY 2015.Maryland Department of Health and Mental Hygiene, Maryland Medicaid eHealth Statistics
UNINSURED POPULATION12.50% of people living in Garrett County remain uninsured. Census Bureau, American Community Survey 5-Year Estimates 2010-2014

28
IncomeRanking*
0.0% 5.0% 10.0% 15.0% 20.0% 25.0% 30.0% 35.0% 40.0% 45.0% 50.0%
Overall Poverty Seniors
Children Hispanic or La?no
Black or African American Female Headed Households
0.0% 5.0% 10.0% 15.0% 20.0% 25.0% 30.0% 35.0%
Overall Poverty Seniors
Children Hispanic or La>no
Black or African American Female Headed Households
416111414181615
10
INDIVIDUALS LIVING IN DEEP POVERTY53.3% of people in Harford County who live in poverty have incomes below 50% of the poverty line - $5,835 for an individual – in 2014. Census Bureau, American Community Survey 5-Year Estimates 2010-2014
INDIVIDUALS LIVING BELOW 200% OF THE FEDERAL POVERTY LINE17.8% of people in Harford County live below 200% of the poverty line - $47,000 for a family of four in 2014.Census Bureau, American Community Survey 5-Year Estimates 2010-2014
POVERTY RATE AMONG FEMALE-HEADED HOUSEHOLDS28.6% of Female-Headed Households in Harford County live below the poverty line - $23,850 for a family of four – in 2014. Census Bureau, American Community Survey 5-Year Estimates 2010-2014
POVERTY RATE AMONG HISPANIC OR LATINO MARYLANDERS 15.1% of Hispanic or Latino Marylanders in Harford County live below the poverty line - $11,670 for an individual – in 2014. Census Bureau, American Community Survey 5-Year Estimates 2010-2014
POVERTY RATE AMONG BLACK OR AFRICAN AMERICAN MARYLANDERS15.1% of Black or African American Marylanders in Harford County live below the poverty line - $11,670 for an individual – in 2014. Census Bureau, American Community Survey 5-Year Estimates 2010-2014
SENIOR POVERTY RATE5.9% of seniors in Harford County live below the poverty line - $11,670 for an individual – in 2014.Census Bureau, American Community Survey 5-Year Estimates 2010-2014
CHILD POVERTY RATE11.3% of children in Harford County live below the poverty line - $23,850 for a family of four – in 2014.Census Bureau, American Community Survey 5-Year Estimates 2010-2014
POVERTY RATE7.7% of people in Harford County live below the poverty line - $23,850 for a family of four – in 2014.Census Bureau, American Community Survey 5-Year Estimates 2010-2014
MEDIAN INCOMEThe median income for households in Harford County is $81,016.Census Bureau, American Community Survey 5-Year Estimates 2010-2014
POVERTY RATES IN HARFORD COUNTYPOPULATION OF HARFORD COUNTY:
248,029NUMBER OF PEOPLE IN HARFORD COUNTY LIVING IN POVERTY IN 2014:
19,013
Harford County

Maryland Poverty Profiles 29
Income Supports
Ranking*
* Ranking - a ranking of 1 indicates the jurisdiction has the highest figure in the state in that category, and a ranking of 24 means the lowest figure in the state in that category. Therefore, being ranked 1 does not necessarily mean success in a given category.
2219191619151719
7714
UNINSURED POPULATION5.40% of people living in Harford County remain uninsured. Census Bureau, American Community Survey 5-Year Estimates 2010-2014
MEDICAID ENROLLMENT12.5% of people in Harford County participated in the Medicaid (Medical Assistance) Program in FY 2015.Maryland Department of Health and Mental Hygiene, Maryland Medicaid eHealth Statistics
PERCENT OF CHILDREN WHO ARE ELIGIBLE FOR THE FREE & REDUCED PRICE MEALS PROGRAM31.2% of children in Harford County were eligible for the FARMS program during the 2014-2015 school year, meaning their families’ incomes were at or below 185% of the Federal Poverty Line. Maryland State Department of Education
PENETRATION RATE OF FOOD SUPPLEMENT PROGRAM60.5% of eligible individuals in Harford County participated in the Food Supplement Program.FY 2015 DHR FIA Statistical Report & American Community Survey 5-Year Estimates 2010-2014
PERCENT OF POPULATION PARTICIPATING IN FOOD SUPPLEMENT PROGRAM9.4% of people in Harford County participated in the Food Supplement Program (formerly known as Food Stamps). The average benefit was $126.83 per person per month in FFY 2015. FY 2015 DHR FIA Statistical Report.
ADULTS RECEIVING TEMPORARY DISABILITY ASSISTANCE.18% of adults in Harford County participated in the Temporary Disability Assistance Program in FY 2015. Individuals received a maximum of $185 per month. FY 2015 DHR FIA Statistical Report.
CHILDREN RECEIVING TEMPORARY CASH ASSISTANCE1.66% of children in Harford County received Temporary Cash Assistance benefits in FY 2015. FY 2015 DHR FIA Statistical Report.
PERCENT OF HOUSEHOLDS IN POVERTY WITH CHILDREN THAT RECEIVE TEMPORARY CASH ASSISTANCE18.7% of families with children who live below the Federal Poverty Line in Harford County received Temporary Cash Assistance benefits in FY 2015. FY 2015 DHR FIA Statistical Report & American Community Survey 5-Year Estimates 2010-2014
PERCENT OF INCOME SPENT ON CHILD CARE Families with two children making the median income in Harford County pay, on average, 20.8% of their income for childcare per year. Maryland Child Care Resource Network, Child Care Demographics 2015
HOUSING WAGEA worker in Harford County needs to make $23.69 per hour in order to afford the fair market rent and utilities of a two-bedroom apartment without spending more than 30% of his or her income. National Low Income Housing Coalition, Out of Reach 2015
UNEMPLOYMENT RATE5.8% of residents of Harford County are unemployed.Bureau of Labor Statistics, Labor Force Data by County, 2014 average
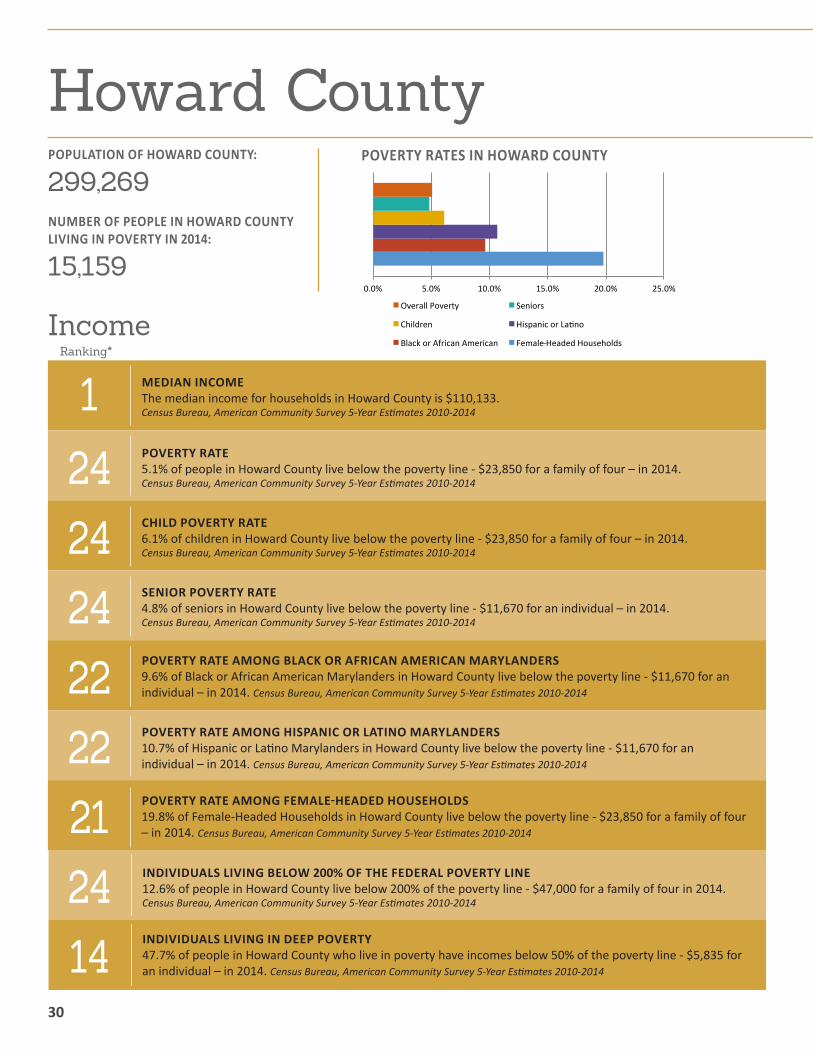
30
IncomeRanking*
0.0% 5.0% 10.0% 15.0% 20.0% 25.0% 30.0% 35.0% 40.0% 45.0% 50.0%
Overall Poverty Seniors
Children Hispanic or La?no
Black or African American Female Headed Households
0.0% 5.0% 10.0% 15.0% 20.0% 25.0%
Overall Poverty Seniors
Children Hispanic or La=no
Black or African American Female Headed Households
1424212222242424
1
INDIVIDUALS LIVING IN DEEP POVERTY47.7% of people in Howard County who live in poverty have incomes below 50% of the poverty line - $5,835 for an individual – in 2014. Census Bureau, American Community Survey 5-Year Estimates 2010-2014
INDIVIDUALS LIVING BELOW 200% OF THE FEDERAL POVERTY LINE12.6% of people in Howard County live below 200% of the poverty line - $47,000 for a family of four in 2014.Census Bureau, American Community Survey 5-Year Estimates 2010-2014
POVERTY RATE AMONG FEMALE-HEADED HOUSEHOLDS19.8% of Female-Headed Households in Howard County live below the poverty line - $23,850 for a family of four – in 2014. Census Bureau, American Community Survey 5-Year Estimates 2010-2014
POVERTY RATE AMONG HISPANIC OR LATINO MARYLANDERS 10.7% of Hispanic or Latino Marylanders in Howard County live below the poverty line - $11,670 for an individual – in 2014. Census Bureau, American Community Survey 5-Year Estimates 2010-2014
POVERTY RATE AMONG BLACK OR AFRICAN AMERICAN MARYLANDERS9.6% of Black or African American Marylanders in Howard County live below the poverty line - $11,670 for an individual – in 2014. Census Bureau, American Community Survey 5-Year Estimates 2010-2014
SENIOR POVERTY RATE4.8% of seniors in Howard County live below the poverty line - $11,670 for an individual – in 2014.Census Bureau, American Community Survey 5-Year Estimates 2010-2014
CHILD POVERTY RATE6.1% of children in Howard County live below the poverty line - $23,850 for a family of four – in 2014.Census Bureau, American Community Survey 5-Year Estimates 2010-2014
POVERTY RATE5.1% of people in Howard County live below the poverty line - $23,850 for a family of four – in 2014.Census Bureau, American Community Survey 5-Year Estimates 2010-2014
MEDIAN INCOMEThe median income for households in Howard County is $110,133.Census Bureau, American Community Survey 5-Year Estimates 2010-2014
POVERTY RATES IN HOWARD COUNTYPOPULATION OF HOWARD COUNTY:
299,269NUMBER OF PEOPLE IN HOWARD COUNTY LIVING IN POVERTY IN 2014:
15,159
Howard County

Maryland Poverty Profiles 31
Income Supports
Ranking*
* Ranking - a ranking of 1 indicates the jurisdiction has the highest figure in the state in that category, and a ranking of 24 means the lowest figure in the state in that category. Therefore, being ranked 1 does not necessarily mean success in a given category.
1923231824222116
14723 UNEMPLOYMENT RATE
4.4% of residents of Howard County are unemployed.Bureau of Labor Statistics, Labor Force Data by County, 2014 average
HOUSING WAGEA worker in Howard County needs to make $23.69 per hour in order to afford the fair market rent and utilities of a two-bedroom apartment without spending more than 30% of his or her income. National Low Income Housing Coalition, Out of Reach 2015
PERCENT OF INCOME SPENT ON CHILD CARE Families with two children making the median income in Howard County pay, on average, 19.3% of their income for childcare per year. Maryland Child Care Resource Network, Child Care Demographics 2015
PERCENT OF HOUSEHOLDS IN POVERTY WITH CHILDREN THAT RECEIVE TEMPORARY CASH ASSISTANCE19.5% of families with children who live below the Federal Poverty Line in Howard County received Temporary Cash Assistance benefits in FY 2015. FY 2015 DHR FIA Statistical Report & American Community Survey 5-Year Estimates 2010-2014
CHILDREN RECEIVING TEMPORARY CASH ASSISTANCE1.09% of children in Howard County received Temporary Cash Assistance benefits in FY 2015. FY 2015 DHR FIA Statistical Report.
ADULTS RECEIVING TEMPORARY DISABILITY ASSISTANCE.10% of adults in Howard County participated in the Temporary Disability Assistance Program in FY 2015. Indi-viduals received a maximum of $185 per month. FY 2015 DHR FIA Statistical Report.
PERCENT OF POPULATION PARTICIPATING IN FOOD SUPPLEMENT PROGRAM6.4% of people in Howard County participated in the Food Supplement Program (formerly known as Food Stamps). The average benefit was $126.83 per person per month in FFY 2015. FY 2015 DHR FIA Statistical Report.
PENETRATION RATE OF FOOD SUPPLEMENT PROGRAM57.7% of eligible individuals in Howard County participated in the Food Supplement Program.FY 2015 DHR FIA Statistical Report & American Community Survey 5-Year Estimates 2010-2014
PERCENT OF CHILDREN WHO ARE ELIGIBLE FOR THE FREE & REDUCED PRICE MEALS PROGRAM20.2% of children in Howard County were eligible for the FARMS program during the 2014-2015 school year, meaning their families’ incomes were at or below 185% of the Federal Poverty Line. Maryland State Department of Education
MEDICAID ENROLLMENT10.2% of people in Howard County participated in the Medicaid (Medical Assistance) Program in FY 2015.Maryland Department of Health and Mental Hygiene, Maryland Medicaid eHealth Statistics
UNINSURED POPULATION6.80% of people living in Howard County remain uninsured. Census Bureau, American Community Survey 5-Year Estimates 2010-2014

32
IncomeRanking*
0.0% 5.0% 10.0% 15.0% 20.0% 25.0% 30.0% 35.0% 40.0% 45.0% 50.0%
Overall Poverty Seniors
Children Hispanic or La?no
Black or African American Female Headed Households
0.0% 5.0% 10.0% 15.0% 20.0% 25.0% 30.0% 35.0%
Overall Poverty Seniors
Children Hispanic or La>no
Black or African American Female Headed Households
910197
20919
16
INDIVIDUALS LIVING IN DEEP POVERTY63.8% of people in Kent County who live in poverty have incomes below 50% of the poverty line - $5,835 for an individual – in 2014. Census Bureau, American Community Survey 5-Year Estimates 2010-2014
INDIVIDUALS LIVING BELOW 200% OF THE FEDERAL POVERTY LINE29.2% of people in Kent County live below 200% of the poverty line - $47,000 for a family of four in 2014.Census Bureau, American Community Survey 5-Year Estimates 2010-2014
POVERTY RATE AMONG FEMALE-HEADED HOUSEHOLDS32.8% of Female-Headed Households in Kent County live below the poverty line - $23,850 for a family of four – in 2014. Census Bureau, American Community Survey 5-Year Estimates 2010-2014
POVERTY RATE AMONG HISPANIC OR LATINO MARYLANDERS 12.0% of Hispanic or Latino Marylanders in Kent County live below the poverty line - $11,670 for an individual – in 2014. Census Bureau, American Community Survey 5-Year Estimates 2010-2014
POVERTY RATE AMONG BLACK OR AFRICAN AMERICAN MARYLANDERS26.6% of Black or African American Marylanders in Kent County live below the poverty line - $11,670 for an individual – in 2014. Census Bureau, American Community Survey 5-Year Estimates 2010-2014
SENIOR POVERTY RATE5.2% of seniors in Kent County live below the poverty line - $11,670 for an individual – in 2014.Census Bureau, American Community Survey 5-Year Estimates 2010-2014
CHILD POVERTY RATE17.3% of children in Kent County live below the poverty line - $23,850 for a family of four – in 2014.Census Bureau, American Community Survey 5-Year Estimates 2010-2014
POVERTY RATE11.8% of people in Kent County live below the poverty line - $23,850 for a family of four – in 2014.Census Bureau, American Community Survey 5-Year Estimates 2010-2014
MEDIAN INCOMEThe median income for households in Kent County is $58,201.Census Bureau, American Community Survey 5-Year Estimates 2010-2014
POVERTY RATES IN KENT COUNTYPOPULATION OF KENT COUNTY:
20,016NUMBER OF PEOPLE IN KENT COUNTY LIVING IN POVERTY IN 2014:
2,183
Kent County

Maryland Poverty Profiles 33
Income Supports
Ranking*
* Ranking - a ranking of 1 indicates the jurisdiction has the highest figure in the state in that category, and a ranking of 24 means the lowest figure in the state in that category. Therefore, being ranked 1 does not necessarily mean success in a given category.
111181481363
2189
PERCENT OF INCOME SPENT ON CHILD CARE Families with two children making the median income in Kent County pay, on average, 22.4% of their income for childcare per year. Maryland Child Care Resource Network, Child Care Demographics 2015
HOUSING WAGEA worker in Kent County needs to make $16.65 per hour in order to afford the fair market rent and utilities of a two-bedroom apartment without spending more than 30% of his or her income. National Low Income Housing Coalition, Out of Reach 2015
UNEMPLOYMENT RATE6.5% of residents of Kent County are unemployed.Bureau of Labor Statistics, Labor Force Data by County, 2014 average
PERCENT OF HOUSEHOLDS IN POVERTY WITH CHILDREN THAT RECEIVE TEMPORARY CASH ASSISTANCE40.0% of families with children who live below the Federal Poverty Line in Kent County received Temporary Cash Assistance benefits in FY 2015. FY 2015 DHR FIA Statistical Report & American Community Survey 5-Year Estimates 2010-2014
CHILDREN RECEIVING TEMPORARY CASH ASSISTANCE4.80% of children in Kent County received Temporary Cash Assistance benefits in FY 2015. FY 2015 DHR FIA Statistical Report.
ADULTS RECEIVING TEMPORARY DISABILITY ASSISTANCE.23% of adults in Kent County participated in the Temporary Disability Assistance Program in FY 2015. Individuals received a maximum of $185 per month. FY 2015 DHR FIA Statistical Report.
PERCENT OF POPULATION PARTICIPATING IN FOOD SUPPLEMENT PROGRAM15.9% of people in Kent County participated in the Food Supplement Program (formerly known as Food Stamps). The average benefit was $126.83 per person per month in FFY 2015. FY 2015 DHR FIA Statistical Report.
PENETRATION RATE OF FOOD SUPPLEMENT PROGRAM63.6% of eligible individuals in Kent County participated in the Food Supplement Program.FY 2015 DHR FIA Statistical Report & American Community Survey 5-Year Estimates 2010-2014
PERCENT OF CHILDREN WHO ARE ELIGIBLE FOR THE FREE & REDUCED PRICE MEALS PROGRAM52.2% of children in Kent County were eligible for the FARMS program during the 2014-2015 school year, meaning their families’ incomes were at or below 185% of the Federal Poverty Line. Maryland State Department of Education
MEDICAID ENROLLMENT19.1% of people in Kent County participated in the Medicaid (Medical Assistance) Program in FY 2015.Maryland Department of Health and Mental Hygiene, Maryland Medicaid eHealth Statistics
UNINSURED POPULATION9.30% of people living in Kent County remain uninsured. Census Bureau, American Community Survey 5-Year Estimates 2010-2014

34
IncomeRanking*
0.0% 5.0% 10.0% 15.0% 20.0% 25.0% 30.0% 35.0% 40.0% 45.0% 50.0%
Overall Poverty Seniors
Children Hispanic or La?no
Black or African American Female Headed Households
0.0% 5.0% 10.0% 15.0% 20.0% 25.0%
Overall Poverty Seniors
Children Hispanic or La=no
Black or African American Female Headed Households
1916192019141918
2
INDIVIDUALS LIVING IN DEEP POVERTY44.8% of people in Montgomery County who live in poverty have incomes below 50% of the poverty line - $5,835 for an individual – in 2014. Census Bureau, American Community Survey 5-Year Estimates 2010-2014
INDIVIDUALS LIVING BELOW 200% OF THE FEDERAL POVERTY LINE17.8% of people in Montgomery County live below 200% of the poverty line - $47,000 for a family of four in 2014. Census Bureau, American Community Survey 5-Year Estimates 2010-2014
POVERTY RATE AMONG FEMALE-HEADED HOUSEHOLDS20.9% of Female-Headed Households in Montgomery County live below the poverty line - $23,850 for a family of four – in 2014. Census Bureau, American Community Survey 5-Year Estimates 2010-2014
POVERTY RATE AMONG HISPANIC OR LATINO MARYLANDERS 11.4% of Hispanic or Latino Marylanders in Montgomery County live below the poverty line - $11,670 for an individual – in 2014. Census Bureau, American Community Survey 5-Year Estimates 2010-2014
POVERTY RATE AMONG BLACK OR AFRICAN AMERICAN MARYLANDERS11.7% of Black or African American Marylanders in Montgomery County live below the poverty line - $11,670 for an individual – in 2014. Census Bureau, American Community Survey 5-Year Estimates 2010-2014
SENIOR POVERTY RATE6.7% of seniors in Montgomery County live below the poverty line - $11,670 for an individual – in 2014.Census Bureau, American Community Survey 5-Year Estimates 2010-2014
CHILD POVERTY RATE8.4% of children in Montgomery County live below the poverty line - $23,850 for a family of four – in 2014.Census Bureau, American Community Survey 5-Year Estimates 2010-2014
POVERTY RATE6.9% of people in Montgomery County live below the poverty line - $23,850 for a family of four – in 2014.Census Bureau, American Community Survey 5-Year Estimates 2010-2014
MEDIAN INCOMEThe median income for households in Montgomery County is $98,704.Census Bureau, American Community Survey 5-Year Estimates 2010-2014
POVERTY RATES IN MONTGOMERY COUNTYPOPULATION OF MONTGOMERY COUNTY:
1,005,087NUMBER OF PEOPLE IN MONTGOMERY COUNTY LIVING IN POVERTY IN 2014:
68,558
Montgomery County

Maryland Poverty Profiles 35
Income Supports
Ranking*
* Ranking - a ranking of 1 indicates the jurisdiction has the highest figure in the state in that category, and a ranking of 24 means the lowest figure in the state in that category. Therefore, being ranked 1 does not necessarily mean success in a given category.
718162423232422
81
23
PERCENT OF INCOME SPENT ON CHILD CARE Families with two children making the median income in Montgomery County pay, on average, 20.7% of their income for childcare per year. Maryland Child Care Resource Network, Child Care Demographics 2015
HOUSING WAGEA worker in Montgomery County needs to make $28.04 per hour in order to afford the fair market rent and utilities of a two-bedroom apartment without spending more than 30% of his or her income. National Low Income Housing Coalition, Out of Reach 2015
UNEMPLOYMENT RATE4.4% of residents of Montgomery County are unemployed.Bureau of Labor Statistics, Labor Force Data by County, 2014 average
PERCENT OF HOUSEHOLDS IN POVERTY WITH CHILDREN THAT RECEIVE TEMPORARY CASH ASSISTANCE14.0% of families with children who live below the Federal Poverty Line in Montgomery County received Tempo-rary Cash Assistance benefits in FY 2015. FY 2015 DHR FIA Statistical Report & American Community Survey 5-Year Estimates 2010-2014
CHILDREN RECEIVING TEMPORARY CASH ASSISTANCE.98% of children in Montgomery County received Temporary Cash Assistance benefits in FY 2015. FY 2015 DHR FIA Statistical Report.
ADULTS RECEIVING TEMPORARY DISABILITY ASSISTANCE.07% of adults in Montgomery County participated in the Temporary Disability Assistance Program in FY 2015. Individuals received a maximum of $185 per month. FY 2015 DHR FIA Statistical Report.
PERCENT OF POPULATION PARTICIPATING IN FOOD SUPPLEMENT PROGRAM7.4% of people in Montgomery County participated in the Food Supplement Program (formerly known as Food Stamps). The average benefit was $126.83 per person per month in FFY 2015. FY 2015 DHR FIA Statistical Report.
PENETRATION RATE OF FOOD SUPPLEMENT PROGRAM46.0% of eligible individuals in Montgomery County participated in the Food Supplement Program.FY 2015 DHR FIA Statistical Report & American Community Survey 5-Year Estimates 2010-2014
PERCENT OF CHILDREN WHO ARE ELIGIBLE FOR THE FREE & REDUCED PRICE MEALS PROGRAM35.1% of children in Montgomery County were eligible for the FARMS program during the 2014-2015 school year, meaning their families’ incomes were at or below 185% of the Federal Poverty Line. Maryland State Department of Education
MEDICAID ENROLLMENT13.2% of people in Montgomery County participated in the Medicaid (Medical Assistance) Program in FY 2015.Maryland Department of Health and Mental Hygiene, Maryland Medicaid eHealth Statistics
UNINSURED POPULATION11.20% of people living in Montgomery County remain uninsured. Census Bureau, American Community Survey 5-Year Estimates 2010-2014

36
IncomeRanking*
0.0% 5.0% 10.0% 15.0% 20.0% 25.0% 30.0% 35.0% 40.0% 45.0% 50.0%
Overall Poverty Seniors
Children Hispanic or La?no
Black or African American Female Headed Households
0.0% 2.0% 4.0% 6.0% 8.0% 10.0% 12.0% 14.0% 16.0% 18.0% 20.0%
Overall Poverty Seniors
Children Hispanic or La?no
Black or African American Female Headed Households
1213221424141313
11
INDIVIDUALS LIVING IN DEEP POVERTY47.9% of people in Prince George’s County who live in poverty have incomes below 50% of the poverty line - $5,835 for an individual – in 2014. Census Bureau, American Community Survey 5-Year Estimates 2010-2014
INDIVIDUALS LIVING BELOW 200% OF THE FEDERAL POVERTY LINE24.5% of people in Prince George’s County live below 200% of the poverty line - $47,000 for a family of four in 2014. Census Bureau, American Community Survey 5-Year Estimates 2010-2014
POVERTY RATE AMONG FEMALE-HEADED HOUSEHOLDS18.7% of Female-Headed Households in Prince George’s County live below the poverty line - $23,850 for a family of four – in 2014. Census Bureau, American Community Survey 5-Year Estimates 2010-2014
POVERTY RATE AMONG HISPANIC OR LATINO MARYLANDERS 15.1% of Hispanic or Latino Marylanders in Prince George’s County live below the poverty line - $11,670 for an individual – in 2014. Census Bureau, American Community Survey 5-Year Estimates 2010-2014
POVERTY RATE AMONG BLACK OR AFRICAN AMERICAN MARYLANDERS8.5% of Black or African American Marylanders in Prince George’s County live below the poverty line - $11,670 for an individual – in 2014. Census Bureau, American Community Survey 5-Year Estimates 2010-2014
SENIOR POVERTY RATE6.7% of seniors in Prince George’s County live below the poverty line - $11,670 for an individual – in 2014.Census Bureau, American Community Survey 5-Year Estimates 2010-2014
CHILD POVERTY RATE12.9% of children in Prince George’s County live below the poverty line - $23,850 for a family of four – in 2014.Census Bureau, American Community Survey 5-Year Estimates 2010-2014
POVERTY RATE9.7% of people in Prince George’s County live below the poverty line - $23,850 for a family of four – in 2014.Census Bureau, American Community Survey 5-Year Estimates 2010-2014
MEDIAN INCOMEThe median income for households in Prince George’s County is $73,856.Census Bureau, American Community Survey 5-Year Estimates 2010-2014
POVERTY RATES IN PRINCE GEORGE’S COUNTYPOPULATION OF PRINCE GEORGE’S COUNTY:
884,764NUMBER OF PEOPLE IN PRINCE GEORGE’S COUNTY LIVING IN POVERTY IN 2014:
84,091
Prince George’s County

Maryland Poverty Profiles 37
Income Supports
Ranking*
* Ranking - a ranking of 1 indicates the jurisdiction has the highest figure in the state in that category, and a ranking of 24 means the lowest figure in the state in that category. Therefore, being ranked 1 does not necessarily mean success in a given category.
11041914231314
6113
UNINSURED POPULATION14.80% of people living in Prince George’s County remain uninsured. Census Bureau, American Community Survey 5-Year Estimates 2010-2014
MEDICAID ENROLLMENT19.3% of people in Prince George’s County participated in the Medicaid (Medical Assistance) Program in FY 2015. Maryland Department of Health and Mental Hygiene, Maryland Medicaid eHealth Statistics
PERCENT OF CHILDREN WHO ARE ELIGIBLE FOR THE FREE & REDUCED PRICE MEALS PROGRAM64.6% of children in Prince George’s County were eligible for the FARMS program during the 2014-2015 school year, meaning their families’ incomes were at or below 185% of the Federal Poverty Line. Maryland State Department of Education
PENETRATION RATE OF FOOD SUPPLEMENT PROGRAM56.6% of eligible individuals in Prince George’s County participated in the Food Supplement Program.FY 2015 DHR FIA Statistical Report & American Community Survey 5-Year Estimates 2010-2014
PERCENT OF POPULATION PARTICIPATING IN FOOD SUPPLEMENT PROGRAM12.1% of people in Prince George’s County participated in the Food Supplement Program (formerly known as Food Stamps). The average benefit was $126.83 per person per month in FFY 2015. FY 2015 DHR FIA Statistical Report.
ADULTS RECEIVING TEMPORARY DISABILITY ASSISTANCE.07% of adults in Prince George’s County participated in the Temporary Disability Assistance Program in FY 2015. Individuals received a maximum of $185 per month. FY 2015 DHR FIA Statistical Report.
CHILDREN RECEIVING TEMPORARY CASH ASSISTANCE2.09% of children in Prince George’s County received Temporary Cash Assistance benefits in FY 2015. FY 2015 DHR FIA Statistical Report.
PERCENT OF HOUSEHOLDS IN POVERTY WITH CHILDREN THAT RECEIVE TEMPORARY CASH ASSISTANCE20.8% of families with children who live below the Federal Poverty Line in Prince George’s County received Temporary Cash Assistance benefits in FY 2015. FY 2015 DHR FIA Statistical Report & American Community Survey 5-Year Estimates 2010-2014
PERCENT OF INCOME SPENT ON CHILD CARE Families with two children making the median income in Prince George’s County pay, on average, 21.0% of their income for childcare per year. Maryland Child Care Resource Network, Child Care Demographics 2015
HOUSING WAGEA worker in Prince George’s County needs to make $28.04 per hour in order to afford the fair market rent and utilities of a two-bedroom apartment without spending more than 30% of his or her income. National Low Income Housing Coalition, Out of Reach 2015
UNEMPLOYMENT RATE5.9% of residents of Prince George’s County are unemployed.Bureau of Labor Statistics, Labor Force Data by County, 2014 average

38
IncomeRanking*
0.0% 5.0% 10.0% 15.0% 20.0% 25.0% 30.0% 35.0% 40.0% 45.0% 50.0%
Overall Poverty Seniors
Children Hispanic or La?no
Black or African American Female Headed Households
0.0% 5.0% 10.0% 15.0% 20.0% 25.0% 30.0% 35.0%
Overall Poverty Seniors
Children Hispanic or La>no
Black or African American Female Headed Households
212012311161417
7
INDIVIDUALS LIVING IN DEEP POVERTY42.0% of people in Queen Anne’s County who live in poverty have incomes below 50% of the poverty line - $5,835 for an individual – in 2014. Census Bureau, American Community Survey 5-Year Estimates 2010-2014
INDIVIDUALS LIVING BELOW 200% OF THE FEDERAL POVERTY LINE16.9% of people in Queen Anne’s County live below 200% of the poverty line - $47,000 for a family of four in 2014. Census Bureau, American Community Survey 5-Year Estimates 2010-2014
POVERTY RATE AMONG FEMALE-HEADED HOUSEHOLDS27.8% of Female-Headed Households in Queen Anne’s County live below the poverty line - $23,850 for a family of four – in 2014. Census Bureau, American Community Survey 5-Year Estimates 2010-2014
POVERTY RATE AMONG HISPANIC OR LATINO MARYLANDERS 33.3% of Hispanic or Latino Marylanders in Queen Anne’s County live below the poverty line - $11,670 for an individual – in 2014. Census Bureau, American Community Survey 5-Year Estimates 2010-2014
POVERTY RATE AMONG BLACK OR AFRICAN AMERICAN MARYLANDERS22.9% of Black or African American Marylanders in Queen Anne’s County live below the poverty line - $11,670 for an individual – in 2014. Census Bureau, American Community Survey 5-Year Estimates 2010-2014
SENIOR POVERTY RATE6.3% of seniors in Queen Anne’s County live below the poverty line - $11,670 for an individual – in 2014.Census Bureau, American Community Survey 5-Year Estimates 2010-2014
CHILD POVERTY RATE11.9% of children in Queen Anne’s County live below the poverty line - $23,850 for a family of four – in 2014.Census Bureau, American Community Survey 5-Year Estimates 2010-2014
POVERTY RATE7.4% of people in Queen Anne’s County live below the poverty line - $23,850 for a family of four – in 2014.Census Bureau, American Community Survey 5-Year Estimates 2010-2014
MEDIAN INCOMEThe median income for households in Queen Anne’s County is $86,406.Census Bureau, American Community Survey 5-Year Estimates 2010-2014
POVERTY RATES IN QUEEN ANNE’S COUNTYPOPULATION OF QUEEN ANNE’S COUNTY:
48,439NUMBER OF PEOPLE IN QUEEN ANNE’S COUNTY LIVING IN POVERTY IN 2014:
3,552
Queen Anne’s County

Maryland Poverty Profiles 39
Income Supports
Ranking*
* Ranking - a ranking of 1 indicates the jurisdiction has the highest figure in the state in that category, and a ranking of 24 means the lowest figure in the state in that category. Therefore, being ranked 1 does not necessarily mean success in a given category.
2417211218161920
227
20
UNINSURED POPULATION5.10% of people living in Queen Anne’s County remain uninsured. Census Bureau, American Community Survey 5-Year Estimates 2010-2014
MEDICAID ENROLLMENT14.0% of people in Queen Anne’s County participated in the Medicaid (Medical Assistance) Program in FY 2015.Maryland Department of Health and Mental Hygiene, Maryland Medicaid eHealth Statistics
PERCENT OF CHILDREN WHO ARE ELIGIBLE FOR THE FREE & REDUCED PRICE MEALS PROGRAM26.1% of children in Queen Anne’s County were eligible for the FARMS program during the 2014-2015 school year, meaning their families’ incomes were at or below 185% of the Federal Poverty Line. Maryland State Department of Education
PENETRATION RATE OF FOOD SUPPLEMENT PROGRAM65.2% of eligible individuals in Queen Anne’s County participated in the Food Supplement Program.FY 2015 DHR FIA Statistical Report & American Community Survey 5-Year Estimates 2010-2014
PERCENT OF POPULATION PARTICIPATING IN FOOD SUPPLEMENT PROGRAM9.7% of people in Queen Anne’s County participated in the Food Supplement Program (formerly known as Food Stamps). The average benefit was $126.83 per person per month in FFY 2015. FY 2015 DHR FIA Statistical Report.
ADULTS RECEIVING TEMPORARY DISABILITY ASSISTANCE.17% of adults in Queen Anne’s County participated in the Temporary Disability Assistance Program in FY 2015. Individuals received a maximum of $185 per month. FY 2015 DHR FIA Statistical Report.
CHILDREN RECEIVING TEMPORARY CASH ASSISTANCE1.48% of children in Queen Anne’s County received Temporary Cash Assistance benefits in FY 2015. FY 2015 DHR FIA Statistical Report.
PERCENT OF HOUSEHOLDS IN POVERTY WITH CHILDREN THAT RECEIVE TEMPORARY CASH ASSISTANCE17.5% of families with children who live below the Federal Poverty Line in Queen Anne’s County received Temporary Cash Assistance benefits in FY 2015. FY 2015 DHR FIA Statistical Report & American Community Survey 5-Year Estimates 2010-2014
PERCENT OF INCOME SPENT ON CHILD CARE Families with two children making the median income in Queen Anne’s County pay, on average, 17.8% of their income for childcare per year. Maryland Child Care Resource Network, Child Care Demographics 2015
HOUSING WAGEA worker in Queen Anne’s County needs to make $23.69 per hour in order to afford the fair market rent and utilities of a two-bedroom apartment without spending more than 30% of his or her income. National Low Income Housing Coalition, Out of Reach 2015
UNEMPLOYMENT RATE5.1% of residents of Queen Anne’s County are unemployed.Bureau of Labor Statistics, Labor Force Data by County, 2014 average

40
IncomeRanking*
0.0% 5.0% 10.0% 15.0% 20.0% 25.0% 30.0% 35.0% 40.0% 45.0% 50.0%
Overall Poverty Seniors
Children Hispanic or La?no
Black or African American Female Headed Households
0.0% 5.0% 10.0% 15.0% 20.0% 25.0% 30.0% 35.0% 40.0%
Overall Poverty Seniors
Children Hispanic or La?no
Black or African American Female Headed Households
31591712231819
6
INDIVIDUALS LIVING IN DEEP POVERTY54.3% of people in St. Mary’s County who live in poverty have incomes below 50% of the poverty line - $5,835 for an individual – in 2014. Census Bureau, American Community Survey 5-Year Estimates 2010-2014
INDIVIDUALS LIVING BELOW 200% OF THE FEDERAL POVERTY LINE18.2% of people in St. Mary’s County live below 200% of the poverty line - $47,000 for a family of four in 2014.Census Bureau, American Community Survey 5-Year Estimates 2010-2014
POVERTY RATE AMONG FEMALE-HEADED HOUSEHOLDS34.3% of Female-Headed Households in St. Mary’s County live below the poverty line - $23,850 for a family of four – in 2014. Census Bureau, American Community Survey 5-Year Estimates 2010-2014
POVERTY RATE AMONG HISPANIC OR LATINO MARYLANDERS 13.8% of Hispanic or Latino Marylanders in St. Mary’s County live below the poverty line - $11,670 for an individual – in 2014. Census Bureau, American Community Survey 5-Year Estimates 2010-2014
POVERTY RATE AMONG BLACK OR AFRICAN AMERICAN MARYLANDERS20.9% of Black or African American Marylanders in St. Mary’s County live below the poverty line - $11,670 for an individual – in 2014. Census Bureau, American Community Survey 5-Year Estimates 2010-2014
SENIOR POVERTY RATE5.0% of seniors in St. Mary’s County live below the poverty line - $11,670 for an individual – in 2014.Census Bureau, American Community Survey 5-Year Estimates 2010-2014
CHILD POVERTY RATE9.0% of children in St. Mary’s County live below the poverty line - $23,850 for a family of four – in 2014.Census Bureau, American Community Survey 5-Year Estimates 2010-2014
POVERTY RATE6.8% of people in St. Mary’s County live below the poverty line - $23,850 for a family of four – in 2014.Census Bureau, American Community Survey 5-Year Estimates 2010-2014
MEDIAN INCOMEThe median income for households in St. Mary’s County is $88,190.Census Bureau, American Community Survey 5-Year Estimates 2010-2014
POVERTY RATES IN ST. MARY’S COUNTYPOPULATION OF ST. MARY’S COUNTY:
108,472NUMBER OF PEOPLE IN ST. MARY’S COUNTY LIVING IN POVERTY IN 2014:
7,193
St. Mary’s County

Maryland Poverty Profiles 41
Income Supports
Ranking*
* Ranking - a ranking of 1 indicates the jurisdiction has the highest figure in the state in that category, and a ranking of 24 means the lowest figure in the state in that category. Therefore, being ranked 1 does not necessarily mean success in a given category.
1615181129102
17617
UNINSURED POPULATION7.60% of people living in St. Mary’s County remain uninsured. Census Bureau, American Community Survey 5-Year Estimates 2010-2014
MEDICAID ENROLLMENT15.8% of people in St. Mary’s County participated in the Medicaid (Medical Assistance) Program in FY 2015.Maryland Department of Health and Mental Hygiene, Maryland Medicaid eHealth Statistics
PERCENT OF CHILDREN WHO ARE ELIGIBLE FOR THE FREE & REDUCED PRICE MEALS PROGRAM32.7% of children in St. Mary’s County were eligible for the FARMS program during the 2014-2015 school year, meaning their families’ incomes were at or below 185% of the Federal Poverty Line. Maryland State Department of Education
PENETRATION RATE OF FOOD SUPPLEMENT PROGRAM84.5% of eligible individuals in St. Mary’s County participated in the Food Supplement Program.FY 2015 DHR FIA Statistical Report & American Community Survey 5-Year Estimates 2010-2014
PERCENT OF POPULATION PARTICIPATING IN FOOD SUPPLEMENT PROGRAM13.4% of people in St. Mary’s County participated in the Food Supplement Program (formerly known as Food Stamps). The average benefit was $126.83 per person per month in FFY 2015. FY 2015 DHR FIA Statistical Report.
ADULTS RECEIVING TEMPORARY DISABILITY ASSISTANCE.30% of adults in St. Mary’s County participated in the Temporary Disability Assistance Program in FY 2015. Individuals received a maximum of $185 per month. FY 2015 DHR FIA Statistical Report.
CHILDREN RECEIVING TEMPORARY CASH ASSISTANCE3.67% of children in St. Mary’s County received Temporary Cash Assistance benefits in FY 2015. FY 2015 DHR FIA Statistical Report.
PERCENT OF HOUSEHOLDS IN POVERTY WITH CHILDREN THAT RECEIVE TEMPORARY CASH ASSISTANCE47.5% of families with children who live below the Federal Poverty Line in St. Mary’s County received Temporary Cash Assistance benefits in FY 2015. FY 2015 DHR FIA Statistical Report & American Community Survey 5-Year Estimates 2010-2014
PERCENT OF INCOME SPENT ON CHILD CARE Families with two children making the median income in St. Mary’s County pay, on average, 18.4% of their income for childcare per year. Maryland Child Care Resource Network, Child Care Demographics 2015
HOUSING WAGEA worker in St. Mary’s County needs to make $23.83 per hour in order to afford the fair market rent and utilities of a two-bedroom apartment without spending more than 30% of his or her income. National Low Income Housing Coalition, Out of Reach 2015
UNEMPLOYMENT RATE5.4% of residents of St. Mary’s County are unemployed.Bureau of Labor Statistics, Labor Force Data by County, 2014 average

42
IncomeRanking*
0.0% 5.0% 10.0% 15.0% 20.0% 25.0% 30.0% 35.0% 40.0% 45.0% 50.0%
Overall Poverty Seniors
Children Hispanic or La?no
Black or African American Female Headed Households
0.0% 10.0% 20.0% 30.0% 40.0% 50.0% 60.0%
Overall Poverty Seniors
Children Hispanic or La@no
Black or African American Female Headed Households
111114222
24
INDIVIDUALS LIVING IN DEEP POVERTY48.1% of people in Somerset County who live in poverty have incomes below 50% of the poverty line - $5,835 for an individual – in 2014. Census Bureau, American Community Survey 5-Year Estimates 2010-2014
INDIVIDUALS LIVING BELOW 200% OF THE FEDERAL POVERTY LINE45.3% of people in Somerset County live below 200% of the poverty line - $47,000 for a family of four in 2014.Census Bureau, American Community Survey 5-Year Estimates 2010-2014
POVERTY RATE AMONG FEMALE-HEADED HOUSEHOLDS57.1% of Female-Headed Households in Somerset County live below the poverty line - $23,850 for a family of four – in 2014. Census Bureau, American Community Survey 5-Year Estimates 2010-2014
POVERTY RATE AMONG HISPANIC OR LATINO MARYLANDERS 45.0% of Hispanic or Latino Marylanders in Somerset County live below the poverty line - $11,670 for an individ-ual – in 2014. Census Bureau, American Community Survey 5-Year Estimates 2010-2014
POVERTY RATE AMONG BLACK OR AFRICAN AMERICAN MARYLANDERS31.5% of Black or African American Marylanders in Somerset County live below the poverty line - $11,670 for an individual – in 2014. Census Bureau, American Community Survey 5-Year Estimates 2010-2014
SENIOR POVERTY RATE9.3% of seniors in Somerset County live below the poverty line - $11,670 for an individual – in 2014.Census Bureau, American Community Survey 5-Year Estimates 2010-2014
CHILD POVERTY RATE34.2% of children in Somerset County live below the poverty line - $23,850 for a family of four – in 2014.Census Bureau, American Community Survey 5-Year Estimates 2010-2014
POVERTY RATE23.7% of people in Somerset County live below the poverty line - $23,850 for a family of four – in 2014.Census Bureau, American Community Survey 5-Year Estimates 2010-2014
MEDIAN INCOMEThe median income for households in Somerset County is $36,716.Census Bureau, American Community Survey 5-Year Estimates 2010-2014
POVERTY RATES IN SOMERSET COUNTYPOPULATION OF SOMERSET COUNTY:
26,197NUMBER OF PEOPLE IN SOMERSET COUNTY LIVING IN POVERTY IN 2014:
4,555
Somerset County

Maryland Poverty Profiles 43
Income Supports
Ranking*
* Ranking - a ranking of 1 indicates the jurisdiction has the highest figure in the state in that category, and a ranking of 24 means the lowest figure in the state in that category. Therefore, being ranked 1 does not necessarily mean success in a given category.
45163529
3222
PERCENT OF INCOME SPENT ON CHILD CARE Families with two children making the median income in Somerset County pay, on average, 22.1% of their income for childcare per year. Maryland Child Care Resource Network, Child Care Demographics 2015
HOUSING WAGEA worker in Somerset County needs to make $13.42 per hour in order to afford the fair market rent and utilities of a two-bedroom apartment without spending more than 30% of his or her income. National Low Income Housing Coalition, Out of Reach 2015
UNEMPLOYMENT RATE9.5% of residents of Somerset County are unemployed.Bureau of Labor Statistics, Labor Force Data by County, 2014 average
PERCENT OF HOUSEHOLDS IN POVERTY WITH CHILDREN THAT RECEIVE TEMPORARY CASH ASSISTANCE30.7% of families with children who live below the Federal Poverty Line in Somerset County received Temporary Cash Assistance benefits in FY 2015. FY 2015 DHR FIA Statistical Report & American Community Survey 5-Year Estimates 2010-2014
CHILDREN RECEIVING TEMPORARY CASH ASSISTANCE8.67% of children in Somerset County received Temporary Cash Assistance benefits in FY 2015. FY 2015 DHR FIA Statistical Report.
ADULTS RECEIVING TEMPORARY DISABILITY ASSISTANCE.44% of adults in Somerset County participated in the Temporary Disability Assistance Program in FY 2015. Individuals received a maximum of $185 per month. FY 2015 DHR FIA Statistical Report.
PERCENT OF POPULATION PARTICIPATING IN FOOD SUPPLEMENT PROGRAM22.9% of people in Somerset County participated in the Food Supplement Program (formerly known as Food Stamps). The average benefit was $126.83 per person per month in FFY 2015. FY 2015 DHR FIA Statistical Report.
PENETRATION RATE OF FOOD SUPPLEMENT PROGRAM73.3% of eligible individuals in Somerset County participated in the Food Supplement Program.FY 2015 DHR FIA Statistical Report & American Community Survey 5-Year Estimates 2010-2014
PERCENT OF CHILDREN WHO ARE ELIGIBLE FOR THE FREE & REDUCED PRICE MEALS PROGRAM89.1% of children in Somerset County were eligible for the FARMS program during the 2014-2015 school year, meaning their families’ incomes were at or below 185% of the Federal Poverty Line. Maryland State Department of Education
MEDICAID ENROLLMENT24.1% of people in Somerset County participated in the Medicaid (Medical Assistance) Program in FY 2015.Maryland Department of Health and Mental Hygiene, Maryland Medicaid eHealth Statistics
UNINSURED POPULATION12.30% of people living in Somerset County remain uninsured. Census Bureau, American Community Survey 5-Year Estimates 2010-2014

44
IncomeRanking*
0.0% 5.0% 10.0% 15.0% 20.0% 25.0% 30.0% 35.0% 40.0% 45.0% 50.0%
Overall Poverty Seniors
Children Hispanic or La?no
Black or African American Female Headed Households
0.0% 5.0% 10.0% 15.0% 20.0% 25.0% 30.0%
Overall Poverty Seniors
Children Hispanic or La>no
Black or African American Female Headed Households
2211141213131012
15
INDIVIDUALS LIVING IN DEEP POVERTY38.1% of people in Talbot County who live in poverty have incomes below 50% of the poverty line - $5,835 for an individual – in 2014. Census Bureau, American Community Survey 5-Year Estimates 2010-2014
INDIVIDUALS LIVING BELOW 200% OF THE FEDERAL POVERTY LINE26.1% of people in Talbot County live below 200% of the poverty line - $47,000 for a family of four in 2014.Census Bureau, American Community Survey 5-Year Estimates 2010-2014
POVERTY RATE AMONG FEMALE-HEADED HOUSEHOLDS26.8% of Female-Headed Households in Talbot County live below the poverty line - $23,850 for a family of four – in 2014. Census Bureau, American Community Survey 5-Year Estimates 2010-2014
POVERTY RATE AMONG HISPANIC OR LATINO MARYLANDERS 21.9% of Hispanic or Latino Marylanders in Talbot County live below the poverty line - $11,670 for an individual – in 2014. Census Bureau, American Community Survey 5-Year Estimates 2010-2014
POVERTY RATE AMONG BLACK OR AFRICAN AMERICAN MARYLANDERS20.4% of Black or African American Marylanders in Talbot County live below the poverty line - $11,670 for an individual – in 2014. Census Bureau, American Community Survey 5-Year Estimates 2010-2014
SENIOR POVERTY RATE6.8% of seniors in Talbot County live below the poverty line - $11,670 for an individual – in 2014.Census Bureau, American Community Survey 5-Year Estimates 2010-2014
CHILD POVERTY RATE15.7% of children in Talbot County live below the poverty line - $23,850 for a family of four – in 2014.Census Bureau, American Community Survey 5-Year Estimates 2010-2014
POVERTY RATE10.4% of people in Talbot County live below the poverty line - $23,850 for a family of four – in 2014.Census Bureau, American Community Survey 5-Year Estimates 2010-2014
MEDIAN INCOMEThe median income for households in Talbot County is $58,495.Census Bureau, American Community Survey 5-Year Estimates 2010-2014
POVERTY RATES IN TALBOT COUNTYPOPULATION OF TALBOT COUNTY:
37,894NUMBER OF PEOPLE IN TALBOT COUNTY LIVING IN POVERTY IN 2014:
3,913
Talbot County

Maryland Poverty Profiles 45
Income Supports
Ranking*
* Ranking - a ranking of 1 indicates the jurisdiction has the highest figure in the state in that category, and a ranking of 24 means the lowest figure in the state in that category. Therefore, being ranked 1 does not necessarily mean success in a given category.
814142216141823
181515 UNEMPLOYMENT RATE
5.6% of residents of Talbot County are unemployed.Bureau of Labor Statistics, Labor Force Data by County, 2014 average
HOUSING WAGEA worker in Talbot County needs to make $20.06 per hour in order to afford the fair market rent and utilities of a two-bedroom apartment without spending more than 30% of his or her income. National Low Income Housing Coalition, Out of Reach 2015
PERCENT OF INCOME SPENT ON CHILD CARE Families with two children making the median income in Talbot County pay, on average, 18.3% of their income for childcare per year. Maryland Child Care Resource Network, Child Care Demographics 2015
PERCENT OF HOUSEHOLDS IN POVERTY WITH CHILDREN THAT RECEIVE TEMPORARY CASH ASSISTANCE12.5% of families with children who live below the Federal Poverty Line in Talbot County received Temporary Cash Assistance benefits in FY 2015. FY 2015 DHR FIA Statistical Report & American Community Survey 5-Year Estimates 2010-2014
CHILDREN RECEIVING TEMPORARY CASH ASSISTANCE1.53% of children in Talbot County received Temporary Cash Assistance benefits in FY 2015. FY 2015 DHR FIA Statistical Report.
ADULTS RECEIVING TEMPORARY DISABILITY ASSISTANCE.20% of adults in Talbot County participated in the Temporary Disability Assistance Program in FY 2015. Individuals received a maximum of $185 per month. FY 2015 DHR FIA Statistical Report.
PERCENT OF POPULATION PARTICIPATING IN FOOD SUPPLEMENT PROGRAM11.9% of people in Talbot County participated in the Food Supplement Program (formerly known as Food Stamps). The average benefit was $126.83 per person per month in FFY 2015. FY 2015 DHR FIA Statistical Report.
PENETRATION RATE OF FOOD SUPPLEMENT PROGRAM50.4% of eligible individuals in Talbot County participated in the Food Supplement Program.FY 2015 DHR FIA Statistical Report & American Community Survey 5-Year Estimates 2010-2014
PERCENT OF CHILDREN WHO ARE ELIGIBLE FOR THE FREE & REDUCED PRICE MEALS PROGRAM42.1% of children in Talbot County were eligible for the FARMS program during the 2014-2015 school year, meaning their families’ incomes were at or below 185% of the Federal Poverty Line. Maryland State Department of Education
MEDICAID ENROLLMENT16.1% of people in Talbot County participated in the Medicaid (Medical Assistance) Program in FY 2015.Maryland Department of Health and Mental Hygiene, Maryland Medicaid eHealth Statistics
UNINSURED POPULATION10.60% of people living in Talbot County remain uninsured. Census Bureau, American Community Survey 5-Year Estimates 2010-2014

46
IncomeRanking*
0.0% 5.0% 10.0% 15.0% 20.0% 25.0% 30.0% 35.0% 40.0% 45.0% 50.0%
Overall Poverty Seniors
Children Hispanic or La?no
Black or African American Female Headed Households
0.0% 5.0% 10.0% 15.0% 20.0% 25.0% 30.0% 35.0% 40.0%
Overall Poverty Seniors
Children Hispanic or La?no
Black or African American Female Headed Households
1787105788
17
INDIVIDUALS LIVING IN DEEP POVERTY45.4% of people in Washington County who live in poverty have incomes below 50% of the poverty line - $5,835 for an individual – in 2014. Census Bureau, American Community Survey 5-Year Estimates 2010-2014
INDIVIDUALS LIVING BELOW 200% OF THE FEDERAL POVERTY LINE29.3% of people in Washington County live below 200% of the poverty line - $47,000 for a family of four in 2014. Census Bureau, American Community Survey 5-Year Estimates 2010-2014
POVERTY RATE AMONG FEMALE-HEADED HOUSEHOLDS36.7% of Female-Headed Households in Washington County live below the poverty line - $23,850 for a family of four – in 2014. Census Bureau, American Community Survey 5-Year Estimates 2010-2014
POVERTY RATE AMONG HISPANIC OR LATINO MARYLANDERS 22.2% of Hispanic or Latino Marylanders in Washington County live below the poverty line - $11,670 for an individual – in 2014. Census Bureau, American Community Survey 5-Year Estimates 2010-2014
POVERTY RATE AMONG BLACK OR AFRICAN AMERICAN MARYLANDERS30.7% of Black or African American Marylanders in Washington County live below the poverty line - $11,670 for an individual – in 2014. Census Bureau, American Community Survey 5-Year Estimates 2010-2014
SENIOR POVERTY RATE7.8% of seniors in Washington County live below the poverty line - $11,670 for an individual – in 2014.Census Bureau, American Community Survey 5-Year Estimates 2010-2014
CHILD POVERTY RATE19.7% of children in Washington County live below the poverty line - $23,850 for a family of four – in 2014.Census Bureau, American Community Survey 5-Year Estimates 2010-2014
POVERTY RATE12.7% of people in Washington County live below the poverty line - $23,850 for a family of four – in 2014.Census Bureau, American Community Survey 5-Year Estimates 2010-2014
MEDIAN INCOMEThe median income for households in Washington County is $56,477.Census Bureau, American Community Survey 5-Year Estimates 2010-2014
POVERTY RATES IN WASHINGTON COUNTYPOPULATION OF WASHINGTON COUNTY:
148,913NUMBER OF PEOPLE IN WASHINGTON COUNTY LIVING IN POVERTY IN 2014:
17,761
Washington County

Maryland Poverty Profiles 47
Income Supports
Ranking*
* Ranking - a ranking of 1 indicates the jurisdiction has the highest figure in the state in that category, and a ranking of 24 means the lowest figure in the state in that category. Therefore, being ranked 1 does not necessarily mean success in a given category.
1289878711
12199
PERCENT OF INCOME SPENT ON CHILD CARE Families with two children making the median income in Washington County pay, on average, 19.9% of their income for childcare per year. Maryland Child Care Resource Network, Child Care Demographics 2015
HOUSING WAGEA worker in Washington County needs to make $16.48 per hour in order to afford the fair market rent and utilities of a two-bedroom apartment without spending more than 30% of his or her income. National Low Income Housing Coalition, Out of Reach 2015
UNEMPLOYMENT RATE6.5% of residents of Washington County are unemployed.Bureau of Labor Statistics, Labor Force Data by County, 2014 average
CHILDREN RECEIVING TEMPORARY CASH ASSISTANCE4.34% of children in Washington County received Temporary Cash Assistance benefits in FY 2015. FY 2015 DHR FIA Statistical Report.
PERCENT OF HOUSEHOLDS IN POVERTY WITH CHILDREN THAT RECEIVE TEMPORARY CASH ASSISTANCE26.7% of families with children who live below the Federal Poverty Line in Washington County received Tempo-rary Cash Assistance benefits in FY 2015. FY 2015 DHR FIA Statistical Report & American Community Survey 5-Year Estimates 2010-2014
ADULTS RECEIVING TEMPORARY DISABILITY ASSISTANCE.34% of adults in Washington County participated in the Temporary Disability Assistance Program in FY 2015. Individuals received a maximum of $185 per month. FY 2015 DHR FIA Statistical Report.
PERCENT OF POPULATION PARTICIPATING IN FOOD SUPPLEMENT PROGRAM17.0% of people in Washington County participated in the Food Supplement Program (formerly known as Food Stamps). The average benefit was $126.83 per person per month in FFY 2015. FY 2015 DHR FIA Statistical Report.
PENETRATION RATE OF FOOD SUPPLEMENT PROGRAM67.0% of eligible individuals in Washington County participated in the Food Supplement Program.FY 2015 DHR FIA Statistical Report & American Community Survey 5-Year Estimates 2010-2014
PERCENT OF CHILDREN WHO ARE ELIGIBLE FOR THE FREE & REDUCED PRICE MEALS PROGRAM50.1% of children in Washington County were eligible for the FARMS program during the 2014-2015 school year, meaning their families’ incomes were at or below 185% of the Federal Poverty Line. Maryland State Department of Education
MEDICAID ENROLLMENT20.3% of people in Washington County participated in the Medicaid (Medical Assistance) Program in FY 2015.Maryland Department of Health and Mental Hygiene, Maryland Medicaid eHealth Statistics
UNINSURED POPULATION9.00% of people living in Washington County remain uninsured. Census Bureau, American Community Survey 5-Year Estimates 2010-2014

48
IncomeRanking*
0.0% 5.0% 10.0% 15.0% 20.0% 25.0% 30.0% 35.0% 40.0% 45.0% 50.0%
Overall Poverty Seniors
Children Hispanic or La?no
Black or African American Female Headed Households
0.0% 5.0% 10.0% 15.0% 20.0% 25.0% 30.0% 35.0% 40.0%
Overall Poverty Seniors
Children Hispanic or La?no
Black or African American Female Headed Households
55849643
19
INDIVIDUALS LIVING IN DEEP POVERTY51.7% of people in Wicomico County who live in poverty have incomes below 50% of the poverty line - $5,835 for an individual – in 2014. Census Bureau, American Community Survey 5-Year Estimates 2010-2014
INDIVIDUALS LIVING BELOW 200% OF THE FEDERAL POVERTY LINE36.7% of people in Wicomico County live below 200% of the poverty line - $47,000 for a family of four in 2014.Census Bureau, American Community Survey 5-Year Estimates 2010-2014
POVERTY RATE AMONG FEMALE-HEADED HOUSEHOLDS36.0% of Female-Headed Households in Wicomico County live below the poverty line - $23,850 for a family of four – in 2014. Census Bureau, American Community Survey 5-Year Estimates 2010-2014
POVERTY RATE AMONG HISPANIC OR LATINO MARYLANDERS 29.5% of Hispanic or Latino Marylanders in Wicomico County live below the poverty line - $11,670 for an individual – in 2014. Census Bureau, American Community Survey 5-Year Estimates 2010-2014
POVERTY RATE AMONG BLACK OR AFRICAN AMERICAN MARYLANDERS24.6% of Black or African American Marylanders in Wicomico County live below the poverty line - $11,670 for an individual – in 2014. Census Bureau, American Community Survey 5-Year Estimates 2010-2014
SENIOR POVERTY RATE8.2% of seniors in Wicomico County live below the poverty line - $11,670 for an individual – in 2014.Census Bureau, American Community Survey 5-Year Estimates 2010-2014
CHILD POVERTY RATE23.3% of children in Wicomico County live below the poverty line - $23,850 for a family of four – in 2014.Census Bureau, American Community Survey 5-Year Estimates 2010-2014
POVERTY RATE17.4% of people in Wicomico County live below the poverty line - $23,850 for a family of four – in 2014.Census Bureau, American Community Survey 5-Year Estimates 2010-2014
MEDIAN INCOMEThe median income for households in Wicomico County is $52,301.Census Bureau, American Community Survey 5-Year Estimates 2010-2014
POVERTY RATES IN WICOMICO COUNTYPOPULATION OF WICOMICO COUNTY:
100,376NUMBER OF PEOPLE IN WICOMICO COUNTY LIVING IN POVERTY IN 2014:
16,764
Wicomico County

Maryland Poverty Profiles 49
Income Supports
Ranking*
* Ranking - a ranking of 1 indicates the jurisdiction has the highest figure in the state in that category, and a ranking of 24 means the lowest figure in the state in that category. Therefore, being ranked 1 does not necessarily mean success in a given category.
6451145410
9165 UNEMPLOYMENT RATE
7.6% of residents of Wicomico County are unemployed.Bureau of Labor Statistics, Labor Force Data by County, 2014 average
HOUSING WAGEA worker in Wicomico County needs to make $17.73 per hour in order to afford the fair market rent and utilities of a two-bedroom apartment without spending more than 30% of his or her income. National Low Income Housing Coalition, Out of Reach 2015
PERCENT OF INCOME SPENT ON CHILD CARE Families with two children making the median income in Wicomico County pay, on average, 20.6% of their income for childcare per year. Maryland Child Care Resource Network, Child Care Demographics 2015
PERCENT OF HOUSEHOLDS IN POVERTY WITH CHILDREN THAT RECEIVE TEMPORARY CASH ASSISTANCE30.6% of families with children who live below the Federal Poverty Line in Wicomico County received Temporary Cash Assistance benefits in FY 2015. FY 2015 DHR FIA Statistical Report & American Community Survey 5-Year Estimates 2010-2014
CHILDREN RECEIVING TEMPORARY CASH ASSISTANCE6.09% of children in Wicomico County received Temporary Cash Assistance benefits in FY 2015. FY 2015 DHR FIA Statistical Report.
ADULTS RECEIVING TEMPORARY DISABILITY ASSISTANCE.44% of adults in Wicomico County participated in the Temporary Disability Assistance Program in FY 2015. Individuals received a maximum of $185 per month. FY 2015 DHR FIA Statistical Report.
PERCENT OF POPULATION PARTICIPATING IN FOOD SUPPLEMENT PROGRAM21.3% of people in Wicomico County participated in the Food Supplement Program (formerly known as Food Stamps). The average benefit was $126.83 per person per month in FFY 2015. FY 2015 DHR FIA Statistical Report.
PENETRATION RATE OF FOOD SUPPLEMENT PROGRAM66.3% of eligible individuals in Wicomico County participated in the Food Supplement Program.FY 2015 DHR FIA Statistical Report & American Community Survey 5-Year Estimates 2010-2014
PERCENT OF CHILDREN WHO ARE ELIGIBLE FOR THE FREE & REDUCED PRICE MEALS PROGRAM59.6% of children in Wicomico County were eligible for the FARMS program during the 2014-2015 school year, meaning their families’ incomes were at or below 185% of the Federal Poverty Line. Maryland State Department of Education
MEDICAID ENROLLMENT24.5% of people in Wicomico County participated in the Medicaid (Medical Assistance) Program in FY 2015.Maryland Department of Health and Mental Hygiene, Maryland Medicaid eHealth Statistics
UNINSURED POPULATION11.50% of people living in Wicomico County remain uninsured. Census Bureau, American Community Survey 5-Year Estimates 2010-2014

50
IncomeRanking*
0.0% 5.0% 10.0% 15.0% 20.0% 25.0% 30.0% 35.0% 40.0% 45.0% 50.0%
Overall Poverty Seniors
Children Hispanic or La?no
Black or African American Female Headed Households
0.0% 5.0% 10.0% 15.0% 20.0% 25.0% 30.0%
Overall Poverty Seniors
Children Hispanic or La>no
Black or African American Female Headed Households
231012710161110
14
INDIVIDUALS LIVING IN DEEP POVERTY36.5% of people in Worcester County who live in poverty have incomes below 50% of the poverty line - $5,835 for an individual – in 2014. Census Bureau, American Community Survey 5-Year Estimates 2010-2014
INDIVIDUALS LIVING BELOW 200% OF THE FEDERAL POVERTY LINE28.9% of people in Worcester County live below 200% of the poverty line - $47,000 for a family of four in 2014.Census Bureau, American Community Survey 5-Year Estimates 2010-2014
POVERTY RATE AMONG FEMALE-HEADED HOUSEHOLDS27.8% of Female-Headed Households in Worcester County live below the poverty line - $23,850 for a family of four – in 2014. Census Bureau, American Community Survey 5-Year Estimates 2010-2014
POVERTY RATE AMONG HISPANIC OR LATINO MARYLANDERS 26.6% of Hispanic or Latino Marylanders in Worcester County live below the poverty line - $11,670 for an individual – in 2014. Census Bureau, American Community Survey 5-Year Estimates 2010-2014
POVERTY RATE AMONG BLACK OR AFRICAN AMERICAN MARYLANDERS23.5% of Black or African American Marylanders in Worcester County live below the poverty line - $11,670 for an individual – in 2014. Census Bureau, American Community Survey 5-Year Estimates 2010-2014
SENIOR POVERTY RATE6.3% of seniors in Worcester County live below the poverty line - $11,670 for an individual – in 2014.Census Bureau, American Community Survey 5-Year Estimates 2010-2014
CHILD POVERTY RATE15.3% of children in Worcester County live below the poverty line - $23,850 for a family of four – in 2014.Census Bureau, American Community Survey 5-Year Estimates 2010-2014
POVERTY RATE11.1% of people in Worcester County live below the poverty line - $23,850 for a family of four – in 2014.Census Bureau, American Community Survey 5-Year Estimates 2010-2014
MEDIAN INCOMEThe median income for households in Worcester County is $58,820.Census Bureau, American Community Survey 5-Year Estimates 2010-2014
POVERTY RATES IN WORCESTER COUNTYPOPULATION OF WORCESTER COUNTY:
51,558NUMBER OF PEOPLE IN WORCESTER COUNTY LIVING IN POVERTY IN 2014:
5,662
Worcester County

Maryland Poverty Profiles 51
Income Supports
Ranking*
* Ranking - a ranking of 1 indicates the jurisdiction has the highest figure in the state in that category, and a ranking of 24 means the lowest figure in the state in that category. Therefore, being ranked 1 does not necessarily mean success in a given category.
912132111111621
18171
UNINSURED POPULATION10.50% of people living in Worcester County remain uninsured. Census Bureau, American Community Survey 5-Year Estimates 2010-2014
MEDICAID ENROLLMENT18.9% of people in Worcester County participated in the Medicaid (Medical Assistance) Program in FY 2015.Maryland Department of Health and Mental Hygiene, Maryland Medicaid eHealth Statistics
PERCENT OF CHILDREN WHO ARE ELIGIBLE FOR THE FREE & REDUCED PRICE MEALS PROGRAM43.5% of children in Worcester County were eligible for the FARMS program during the 2014-2015 school year, meaning their families’ incomes were at or below 185% of the Federal Poverty Line. Maryland State Department of Education
PENETRATION RATE OF FOOD SUPPLEMENT PROGRAM55.2% of eligible individuals in Worcester County participated in the Food Supplement Program.FY 2015 DHR FIA Statistical Report & American Community Survey 5-Year Estimates 2010-2014
PERCENT OF POPULATION PARTICIPATING IN FOOD SUPPLEMENT PROGRAM14.1% of people in Worcester County participated in the Food Supplement Program (formerly known as Food Stamps). The average benefit was $126.83 per person per month in FFY 2015. FY 2015 DHR FIA Statistical Report.
ADULTS RECEIVING TEMPORARY DISABILITY ASSISTANCE.28% of adults in Worcester County participated in the Temporary Disability Assistance Program in FY 2015. Individuals received a maximum of $185 per month. FY 2015 DHR FIA Statistical Report.
CHILDREN RECEIVING TEMPORARY CASH ASSISTANCE1.69% of children in Worcester County received Temporary Cash Assistance benefits in FY 2015. FY 2015 DHR FIA Statistical Report.
PERCENT OF HOUSEHOLDS IN POVERTY WITH CHILDREN THAT RECEIVE TEMPORARY CASH ASSISTANCE17.0% of families with children who live below the Federal Poverty Line in Worcester County received Temporary Cash Assistance benefits in FY 2015. FY 2015 DHR FIA Statistical Report & American Community Survey 5-Year Estimates 2010-2014
PERCENT OF INCOME SPENT ON CHILD CARE Families with two children making the median income in Worcester County pay, on average, 18.3% of their income for childcare per year. Maryland Child Care Resource Network, Child Care Demographics 2015
HOUSING WAGEA worker in Worcester County needs to make $16.94 per hour in order to afford the fair market rent and utilities of a two-bedroom apartment without spending more than 30% of his or her income. National Low Income Housing Coalition, Out of Reach 2015
UNEMPLOYMENT RATE11.3% of residents of Worcester County are unemployed.Bureau of Labor Statistics, Labor Force Data by County, 2014 average

52
#
Appendix:
THE FOLLOWING IS A RANKED LIST OF COUNTIES, SUCH THAT THE JURISDICTION WITH THE HIGHEST FIGURE IS FIRST, AND THE COUNTY WITH THE LOWEST FIGURE IN THE STATE IS RANKED 24.
Percent of people in poverty who are living in Deep Poverty
1 Kent2 Calvert3 St. Mary's4 Harford5 Wicomico6 Baltimore City7 Baltimore Co.8 Caroline9 Frederick10 Anne Arundel11 Somerset12 Prince George's12 Carroll14 Howard15 Charles16 Allegany17 Washington18 Dorchester19 Montgomery20 Cecil21 Queen Anne's22 Talbot23 Worcester24 Garrett
Percent of population living below the Federal Poverty Line
1 Baltimore City2 Somerset3 Wicomico4 Allegany5 Dorchester6 Caroline7 Garrett8 Washington9 Kent10 Worcester11 Cecil12 Talbot13 Prince George's14 Baltimore Co.15 Harford16 Charles17 Queen Anne's18 Montgomery19 St. Mary's20 Frederick21 Anne Arundel22 Calvert23 Carroll24 Howard
Median Income
1 Howard2 Montgomery3 Calvert4 Charles5 Anne Arundel6 St. Mary's7 Queen Anne's8 Carroll9 Frederick10 Harford11 Prince George's12 Baltimore Co.13 Cecil14 Worcester15 Talbot16 Kent17 Washington18 Caroline19 Wicomico20 Garrett21 Dorchester22 Baltimore City23 Allegany24 Somerset

Maryland Poverty Profiles 53
Percent of Black or African-American Marylanders living below the Federal Poverty Line
1 Garrett2 Allegany3 Dorchester4 Somerset5 Washington6 Baltimore City7 Caroline7 Kent9 Wicomico10 Worcester11 Queen Anne's12 St. Mary's13 Talbot14 Harford15 Frederick16 Carroll17 Baltimore Co.18 Calvert19 Montgomery20 Cecil21 Anne Arundel22 Howard23 Charles24 Prince George's
Percent of seniors living below the Federal Poverty Line
1 Baltimore City2 Somerset3 Caroline4 Allegany5 Dorchester6 Wicomico7 Washington8 Garrett8 Charles10 Cecil10 Baltimore Co.10 Calvert13 Talbot14 Prince George's14 Montgomery16 Worcester16 Queen Anne's18 Harford18 Frederick20 Kent20 Anne Arundel20 Carroll23 St. Mary's24 Howard
Percent of children living below the Federal Poverty Line
1 Baltimore City2 Somerset3 Dorchester4 Wicomico5 Garrett6 Allegany7 Caroline8 Washington9 Kent10 Talbot11 Worcester12 Cecil13 Prince George's14 Queen Anne's15 Baltimore Co.16 Harford17 Charles18 St. Mary's19 Montgomery20 Frederick21 Anne Arundel21 Carroll23 Calvert24 Howard

54
#
Appendix:
THE FOLLOWING IS A RANKED LIST OF COUNTIES, SUCH THAT THE JURISDICTION WITH THE HIGHEST FIGURE IS FIRST, AND THE COUNTY WITH THE LOWEST FIGURE IN THE STATE IS RANKED 24.
Percent of population living below 200% of the Federal Poverty Line
1 Baltimore City1 Somerset3 Allegany4 Dorchester5 Wicomico6 Garrett7 Caroline8 Washington9 Kent10 Worcester11 Talbot12 Cecil13 Prince George's14 Baltimore Co.15 St. Mary's16 Montgomery16 Harford18 Frederick19 Charles20 Queen Anne's21 Anne Arundel22 Calvert23 Carroll24 Howard
Percent of female-headed households living below the Federal Poverty Line
1 Somerset2 Garrett3 Dorchester4 Caroline5 Allegany6 Baltimore City7 Washington8 Wicomico9 St. Mary's10 Kent11 Harford12 Queen Anne's12 Worcester14 Talbot15 Frederick16 Carroll17 Cecil18 Baltimore Co.19 Montgomery20 Charles21 Howard22 Prince George's23 Calvert24 Anne Arundel
Percent of Hispanic or Latino Marylanders living below the Federal Poverty Line
1 Somerset2 Caroline3 Queen Anne's4 Wicomico5 Cecil6 Allegany7 Worcester8 Dorchester9 Baltimore City10 Garrett10 Washington12 Talbot13 Carroll14 Harford14 Prince George's16 Baltimore Co.17 St. Mary's18 Calvert19 Kent20 Montgomery21 Frederick22 Howard23 Charles24 Anne Arundel

Maryland Poverty Profiles 55
Percent of median income spent on child care
1 Baltimore City2 Kent3 Allegany3 Somerset5 Baltimore Co.6 Prince George's7 Harford8 Montgomery9 Wicomico10 Anne Arundel11 Frederick12 Washington13 Dorchester14 Howard15 Carroll16 Cecil17 St. Mary's18 Talbot18 Worcester20 Caroline20 Charles22 Queen Anne's23 Garrett24 Calvert
Housing Wage for a 2-bedroom apartment
1 Prince George's1 Charles1 Calvert1 Frederick1 Montgomery6 St. Mary's7 Baltimore City7 Baltimore Co.7 Harford7 Anne Arundel7 Queen Anne's7 Carroll7 Howard14 Cecil15 Talbot16 Wicomico17 Worcester18 Kent19 Washington20 Caroline21 Dorchester22 Somerset23 Garrett24 Allegany
Unemployment Rate
1 Worcester2 Somerset3 Baltimore City4 Dorchester5 Wicomico6 Allegany7 Garrett8 Cecil9 Washington9 Kent11 Caroline12 Baltimore Co.13 Prince George's14 Harford15 Talbot15 Charles17 St. Mary's18 Calvert19 Anne Arundel20 Queen Anne's20 Frederick22 Carroll23 Montgomery23 Howard

56
#
Appendix:
THE FOLLOWING IS A RANKED LIST OF COUNTIES, SUCH THAT THE JURISDICTION WITH THE HIGHEST FIGURE IS FIRST, AND THE COUNTY WITH THE LOWEST FIGURE IN THE STATE IS RANKED 24.
Number of people receiving Temporary Disability Assistance (TDAP)
1 Baltimore City2 Allegany3 Dorchester4 Cecil5 Somerset5 Wicomico7 Caroline8 Washington9 St. Mary's10 Garrett11 Worcester12 Baltimore Co.13 Kent14 Talbot15 Harford16 Queen Anne's16 Calvert16 Carroll19 Charles20 Frederick21 Anne Arundel22 Howard23 Prince George's23 Montgomery
Number of children receiving Temporary Cash Assistance (TCA)
1 Baltimore City2 Somerset3 Dorchester4 Wicomico5 Allegany6 Kent7 Washington8 Caroline9 Cecil10 St. Mary's11 Baltimore Co.12 Garrett13 Prince George's14 Anne Arundel15 Charles16 Worcester17 Harford18 Talbot19 Queen Anne's20 Frederick21 Howard22 Calvert23 Carroll24 Montgomery
Percent of households with children in poverty receiving Temporary Cash Assistance (TCA)
1 Baltimore City2 St. Mary's3 Kent4 Cecil5 Anne Arundel6 Dorchester7 Allegany8 Baltimore Co.9 Somerset10 Wicomico11 Washington12 Charles13 Caroline14 Prince George's15 Frederick16 Howard17 Carroll18 Calvert19 Harford20 Queen Anne's21 Worcester22 Montgomery23 Talbot24 Garrett

Maryland Poverty Profiles 57
Percent of children eligible for Free and Reduced-Price Meals (FARMS)
1 Somerset2 Baltimore City3 Dorchester4 Prince George's5 Wicomico6 Caroline7 Allegany8 Kent9 Washington10 Garrett11 Baltimore Co.12 Cecil13 Worcester14 Talbot15 Charles16 Montgomery17 Anne Arundel18 St. Mary's19 Harford20 Frederick21 Queen Anne's22 Calvert23 Howard24 Carroll
Food Supplement Program penetration rate
1 St. Mary's2 Dorchester3 Baltimore City4 Calvert5 Charles6 Somerset7 Caroline8 Washington9 Cecil10 Baltimore Co.11 Wicomico12 Queen Anne's13 Allegany14 Kent15 Carroll16 Harford17 Anne Arundel18 Howard19 Prince George's20 Frederick21 Worcester22 Talbot23 Garrett24 Montgomery
Percent of population receiving the Food Supplement Program
1 Baltimore City2 Dorchester3 Somerset4 Wicomico5 Allegany5 Caroline7 Washington8 Kent9 Cecil10 Garrett11 Worcester12 St. Mary's13 Baltimore Co.14 Charles14 Prince George's16 Talbot17 Calvert18 Queen Anne's19 Harford20 Frederick21 Anne Arundel22 Carroll23 Montgomery24 Howard

58
#
Appendix:
THE FOLLOWING IS A RANKED LIST OF COUNTIES, SUCH THAT THE JURISDICTION WITH THE HIGHEST FIGURE IS FIRST, AND THE COUNTY WITH THE LOWEST FIGURE IN THE STATE IS RANKED 24.
Percent of population that remains uninsured
1 Prince George's2 Caroline3 Garrett4 Somerset5 Baltimore City6 Wicomico7 Montgomery8 Talbot9 Worcester10 Dorchester11 Kent12 Baltimore Co.12 Washington14 Cecil15 Allegany16 St. Mary's17 Frederick18 Anne Arundel19 Howard20 Calvert21 Charles22 Harford23 Carroll24 Queen Anne's
Percent of population enrolled in Medicaid
1 Baltimore City2 Dorchester3 Caroline4 Wicomico5 Somerset6 Allegany7 Garrett8 Washington9 Cecil10 Prince George's11 Kent12 Worcester13 Baltimore Co.14 Talbot15 St. Mary's16 Charles17 Queen Anne's18 Montgomery19 Harford20 Calvert21 Anne Arundel22 Frederick23 Howard24 Carroll