assessment of sar ocean features using optical and marine ... · assessment of sar ocean features...
TRANSCRIPT

ASSESSMENT OF SAR OCEAN FEATURES USING OPTICAL AND MARINE SURVEY DATA
Medhavy Thankappan, Nadege Rollet, Craig J. H. Smith, Andrew Jones, Graham Logan
and John Kennard
Geoscience Australia, GPO Box 378, Canberra ACT 2601, AUSTRALIA Email: [email protected]
ABSTRACT Previous studies over the Australian North West Shelf (NWS) have reported ocean features on Synthetic Aperture Radar (SAR) images including slicks from natural hydrocarbon seeps. The aim of this study was to characterise SAR ocean features to enable their differentiation from natural hydrocarbon seepage slicks. The assessment of SAR ocean features in two NWS study areas is reported in this paper. In the northern NWS, repeat occurrence of ocean features observed on SAR images acquired on three different dates were compared with similar features on a Landsat Thematic Mapper (TM) image acquired 28 minutes before one of the SAR images. Analysis of the images in conjunction with ancillary data confirmed that the ocean features were bathymetric signatures. The same patterns were imaged by TM primarily through specular reflection from sun glint. Correspondence of bathymetric features on the SAR and TM images indicates the potential for extracting bottom topography information from optical images with sun glint. In the central NWS, recurring mesoscale ocean features observed on SAR images were assessed using data collected during a marine survey. Evaluation of the SAR features in conjunction with the regional bathymetry and Acoustic Doppler Current Profiler (ADCP) data showed good correlation between the SAR features and zones with strong current flows. Wave-current interaction resulting from modulation of currents by variable bathymetry is the predominant mechanism that generates these SAR features. Recurring local SAR current shear signatures overlying a pelagic ridge also correlated well with field observation and in-situ current measurements. The presence and orientation of the pelagic ridge suggests a strong causal link to current shear signatures observed on SAR. 1. INTRODUCTION
Satellite based Synthetic Aperture Radar (SAR) sensors have been used to observe various ocean related phenomena. Internal waves, currents, eddies, fronts and bathymetric features have been identified on SAR images in previous studies [1-5, 7, 10-11]. The potential
of temporally coincident SAR and optical images for studying ocean dynamics has been demonstrated [2]. Two study areas in the north and central regions of the Australian North West Shelf (NWS) were selected for this study. Ocean features observed on near-coincident SAR and optical images over the northern study area were compared, and the potential for deriving bottom topography information from sun glint patterns in optical images is highlighted. Mesoscale and local SAR ocean features observed regularly over the central NWS study area were assessed in conjunction with marine survey data and found to correlate well with in-situ current measurements and the local bathymetry. The aim of this work was to understand the mechanisms that generate low-backscatter signatures on SAR and increase the confidence of natural hydrocarbon seep identification. 2. METHODS
2.1. Study Area
The northern NWS study area is located within 10.5˚ S 129˚ E and 11.5˚ S 130˚ E. This area of the Timor Sea has a shallow, variable bathymetry and large tidal amplitudes that generate strong currents. Variable bathymetry can interact with tidal currents to produce ocean SAR features that could be misinterpreted as natural hydrocarbon seeps. The central NWS study area covers approximately 165,000 km2 and overlies the Rowley sub-basin situated on the outer continental shelf. The Mermaid, Clerke and Imperieuse reefs form the Rowley Shoals which also lie within the study area. Previous remote sensing studies have suggested that liquid petroleum migration and seepage is active in the central NWS [8]. Reef systems in this area have the potential to produce false positives resembling seepage slicks through air-sea interactions or coral spawning [5]. The warm Leeuwin current which flows southward is also a key feature of the NWS. Internal waves have also been identified on SAR images over the area quite frequently.
_____________________________________________________
Proc. ‘Envisat Symposium 2007’, Montreux, Switzerland 23–27 April 2007 (ESA SP-636, July 2007)
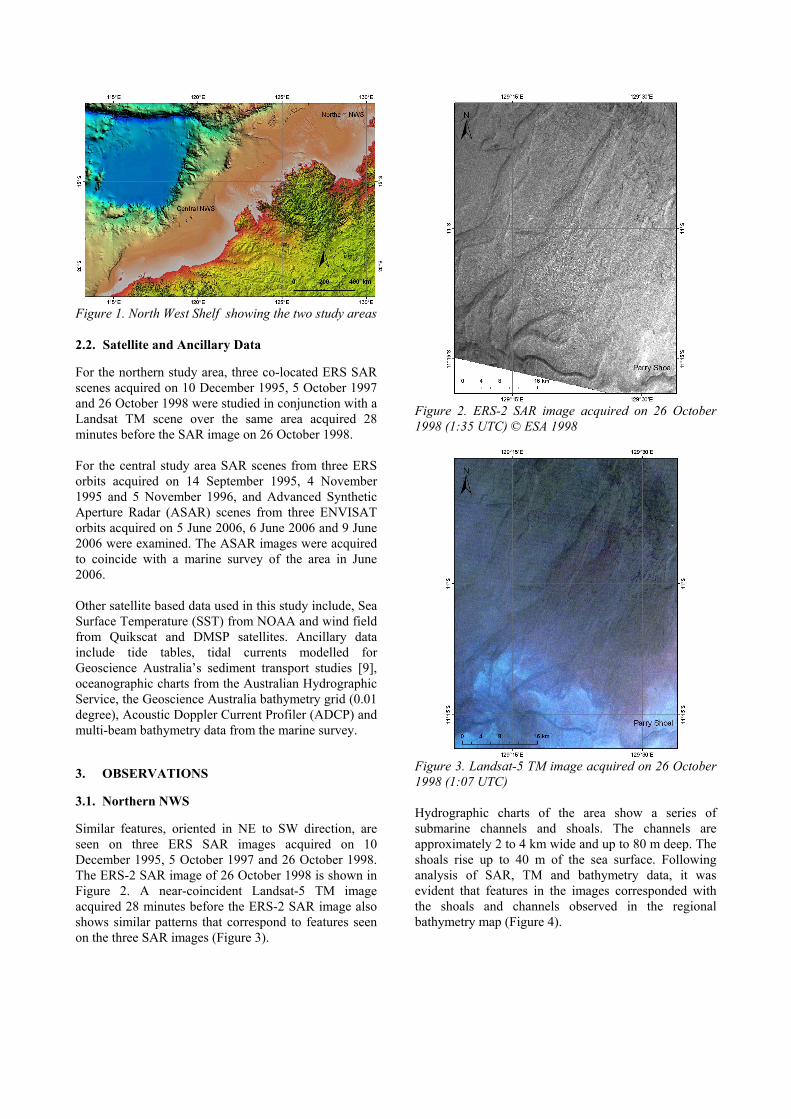
Figure 1. North West Shelf showing the two study areas 2.2. Satellite and Ancillary Data
For the northern study area, three co-located ERS SAR scenes acquired on 10 December 1995, 5 October 1997 and 26 October 1998 were studied in conjunction with a Landsat TM scene over the same area acquired 28 minutes before the SAR image on 26 October 1998. For the central study area SAR scenes from three ERS orbits acquired on 14 September 1995, 4 November 1995 and 5 November 1996, and Advanced Synthetic Aperture Radar (ASAR) scenes from three ENVISAT orbits acquired on 5 June 2006, 6 June 2006 and 9 June 2006 were examined. The ASAR images were acquired to coincide with a marine survey of the area in June 2006. Other satellite based data used in this study include, Sea Surface Temperature (SST) from NOAA and wind field from Quikscat and DMSP satellites. Ancillary data include tide tables, tidal currents modelled for Geoscience Australia’s sediment transport studies [9], oceanographic charts from the Australian Hydrographic Service, the Geoscience Australia bathymetry grid (0.01 degree), Acoustic Doppler Current Profiler (ADCP) and multi-beam bathymetry data from the marine survey.
3. OBSERVATIONS
3.1. Northern NWS
Similar features, oriented in NE to SW direction, are seen on three ERS SAR images acquired on 10 December 1995, 5 October 1997 and 26 October 1998. The ERS-2 SAR image of 26 October 1998 is shown in Figure 2. A near-coincident Landsat-5 TM image acquired 28 minutes before the ERS-2 SAR image also shows similar patterns that correspond to features seen on the three SAR images (Figure 3).
Figure 2. ERS-2 SAR image acquired on 26 October 1998 (1:35 UTC) © ESA 1998
Figure 3. Landsat-5 TM image acquired on 26 October 1998 (1:07 UTC) Hydrographic charts of the area show a series of submarine channels and shoals. The channels are approximately 2 to 4 km wide and up to 80 m deep. The shoals rise up to 40 m of the sea surface. Following analysis of SAR, TM and bathymetry data, it was evident that features in the images corresponded with the shoals and channels observed in the regional bathymetry map (Figure 4).
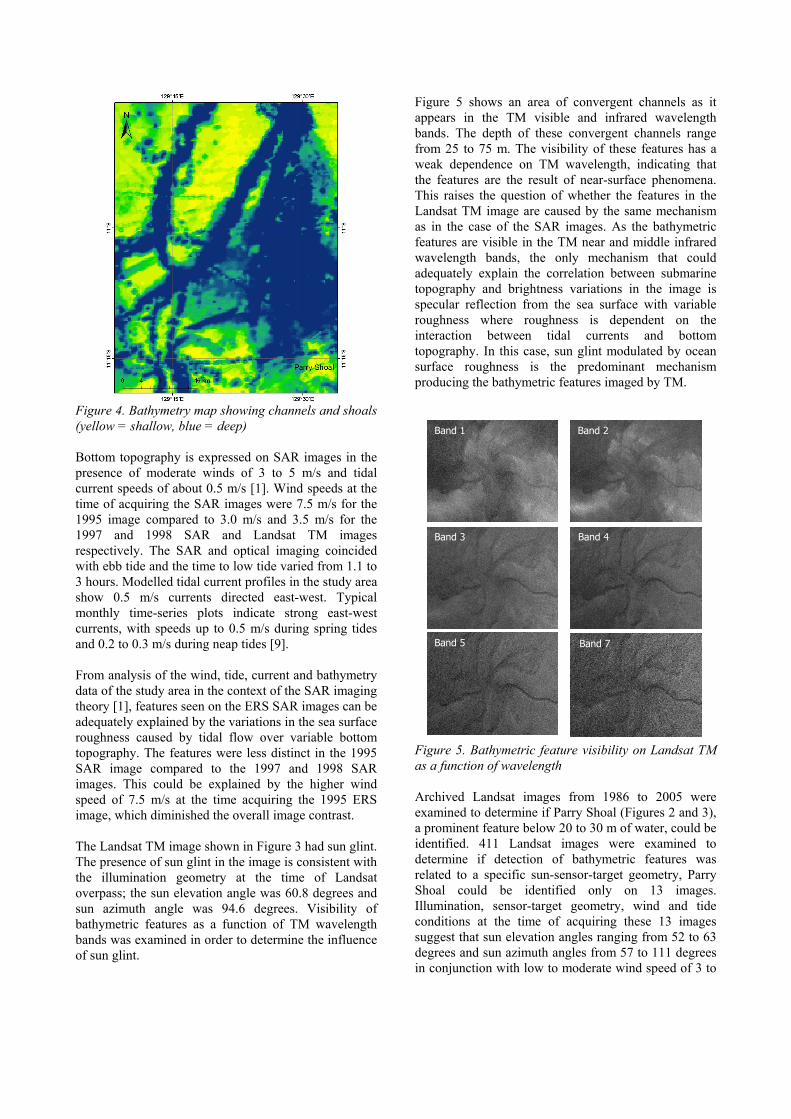
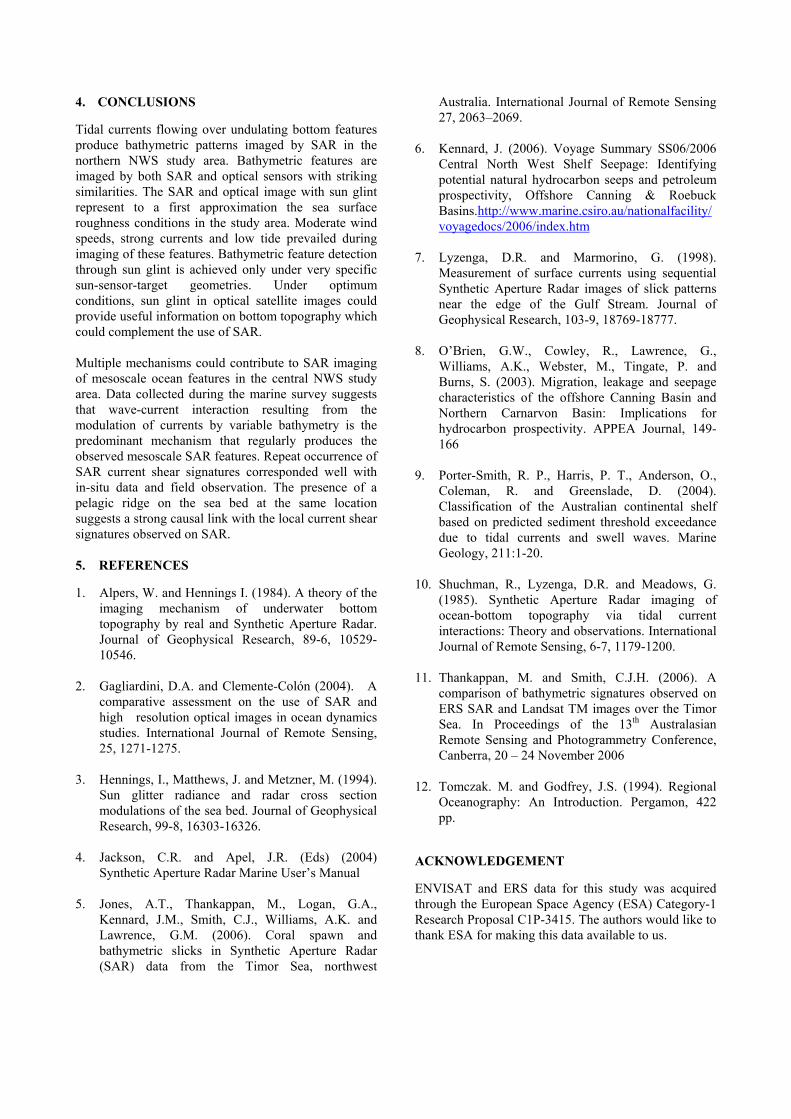
Figure 4. Bathymetry map showing channels and shoals (yellow = shallow, blue = deep) Bottom topography is expressed on SAR images in the presence of moderate winds of 3 to 5 m/s and tidal current speeds of about 0.5 m/s [1]. Wind speeds at the time of acquiring the SAR images were 7.5 m/s for the 1995 image compared to 3.0 m/s and 3.5 m/s for the 1997 and 1998 SAR and Landsat TM images respectively. The SAR and optical imaging coincided with ebb tide and the time to low tide varied from 1.1 to 3 hours. Modelled tidal current profiles in the study area show 0.5 m/s currents directed east-west. Typical monthly time-series plots indicate strong east-west currents, with speeds up to 0.5 m/s during spring tides and 0.2 to 0.3 m/s during neap tides [9]. From analysis of the wind, tide, current and bathymetry data of the study area in the context of the SAR imaging theory [1], features seen on the ERS SAR images can be adequately explained by the variations in the sea surface roughness caused by tidal flow over variable bottom topography. The features were less distinct in the 1995 SAR image compared to the 1997 and 1998 SAR images. This could be explained by the higher wind speed of 7.5 m/s at the time acquiring the 1995 ERS image, which diminished the overall image contrast. The Landsat TM image shown in Figure 3 had sun glint. The presence of sun glint in the image is consistent with the illumination geometry at the time of Landsat overpass; the sun elevation angle was 60.8 degrees and sun azimuth angle was 94.6 degrees. Visibility of bathymetric features as a function of TM wavelength bands was examined in order to determine the influence of sun glint.
Figure 5 shows an area of convergent channels as it appears in the TM visible and infrared wavelength bands. The depth of these convergent channels range from 25 to 75 m. The visibility of these features has a weak dependence on TM wavelength, indicating that the features are the result of near-surface phenomena. This raises the question of whether the features in the Landsat TM image are caused by the same mechanism as in the case of the SAR images. As the bathymetric features are visible in the TM near and middle infrared wavelength bands, the only mechanism that could adequately explain the correlation between submarine topography and brightness variations in the image is specular reflection from the sea surface with variable roughness where roughness is dependent on the interaction between tidal currents and bottom topography. In this case, sun glint modulated by ocean surface roughness is the predominant mechanism producing the bathymetric features imaged by TM.
Figure 5. Bathymetric feature visibility on Landsat TM as a function of wavelength Archived Landsat images from 1986 to 2005 were examined to determine if Parry Shoal (Figures 2 and 3), a prominent feature below 20 to 30 m of water, could be identified. 411 Landsat images were examined to determine if detection of bathymetric features was related to a specific sun-sensor-target geometry, Parry Shoal could be identified only on 13 images. Illumination, sensor-target geometry, wind and tide conditions at the time of acquiring these 13 images suggest that sun elevation angles ranging from 52 to 63 degrees and sun azimuth angles from 57 to 111 degrees
Band 1
in conjunction with low to moderate wind speed of 3 to
Band 3
Band 5
Band 2
Band 4
Band 7

7 m/s at ebb tide favoured the generation of bathymetric signatures. The prevalence of ebb tide in all instances of optical and
.2. Central NWS
the central NWS study area, several mesoscale and
hydrocarbon seepage survey of the central NWS was
nalysis of the ERS SAR images in conjunction with
SAR imaging where the bathymetric features could be identified, is a significant observation. Increased tidal velocity at ebb tide could have enabled better surface expression of bathymetry on the images. In addition, the average tide height at high tide for all observations was 3.8 m compared to an average tide height of 1.2 m at the time of imaging. A shallower water column over the submarine features during ebb tide is also likely to result in stronger surface expression of bathymetry enabling imaging of the features by SAR and optical sensors. 3 Inlocal ocean features have been identified repeatedly on SAR images. Bright and dark mesoscale ocean features trending NE-SW are observed regularly on SAR images acquired at different times. SAR images from three ERS orbits of 14 September 1995, 4 November 1995 and 5 November 1996 that typify the most frequently occurring mesoscale ocean features, overlaid with 200, 400 and 800 m isobaths, are shown in Figure 6. Wind speeds at the time of acquisition of the SAR images ranged from 5 to 7 m/s. The tide phase was ebb for the November images and flood for the September image. Aundertaken in June 2006. During the survey multi-beam swath bathymetry, echo-sounder, side-scan sonar, sub-bottom profile, ADCP and fluorometric data were acquired across 18 potential hydrocarbon seepage sites. Figure 7 shows the location of some of these marine survey sites. Details of the marine survey are reported in [6]. ASAR scenes from three ENVISAT orbits were also acquired over this site during the marine survey. High wind speeds ranging from 10-17 m/s at the time of acquiring the ASAR images, limited their use in this study. Abathymetry and ADCP data showed good correlation of the mesoscale features with zones of strong currents. The SAR ocean features are also aligned parallel to the regional bathymetric contours. ADCP transects acquired during ebb tide showed that the current in the upper water mass, measured to 60 m depth, was flowing parallel to the SAR features towards SW. The Leeuwin current has a major influence on the circulation in this area and previous studies have identified the Leeuwin current on satellite derived Sea Surface Temperature (SST) images [12]. Temperature gradients could
influence the formation of bright and dark mesoscale features similar to those shown in Figure 6. However, examination of SST data acquired by the NOAA satellite close to the time of SAR image acquisition did not reveal strong correlation between SST and the observed SAR features. Therefore, it is difficult to say if the warm Leeuwin current had a role in the generation of these SAR features.
Figure 6. ERS SAR images over the central NWS
aging of the mesoscale SAR ocean features could be
uring the marine survey, a sea surface slick with an
showing mesoscale ocean features © ESA 1995, 1996 Imenabled through temperature or salinity gradients, wave-current interactions, current flow over variable bathymetry or the presence of biogenic films. It is most likely that multiple mechanisms are involved in the imaging of the mesoscale features by SAR. While it is difficult to isolate the influence of individual mechanisms in the formation of these features, evidence from the marine survey data and the regular occurrence of these SAR features suggest that wave-current interaction resulting from modulation of currents by the variable bathymetry is the predominant mechanism. The scale and characteristics of these SAR features confirm that they are not related to internal waves, which are often observed in SAR images over this area. DENE-WSW trend, located close to tidal rips marked on the oceanographic chart was observed (Figure 8). The slick was approximately 50 m wide and more than 500 m long. ADCP data was recorded at different phases of the tidal cycle, across the observed slick and tidal rip zones marked on the oceanographic chart. A characteristic SAR feature observed at the same location and aligned along the 200 m isobath, has good correspondence with the tidal rip marked on the oceanographic chart. This SAR feature appears either dark or bright on SAR images acquired at different times. Figure 9 shows bright ocean features in the ERS
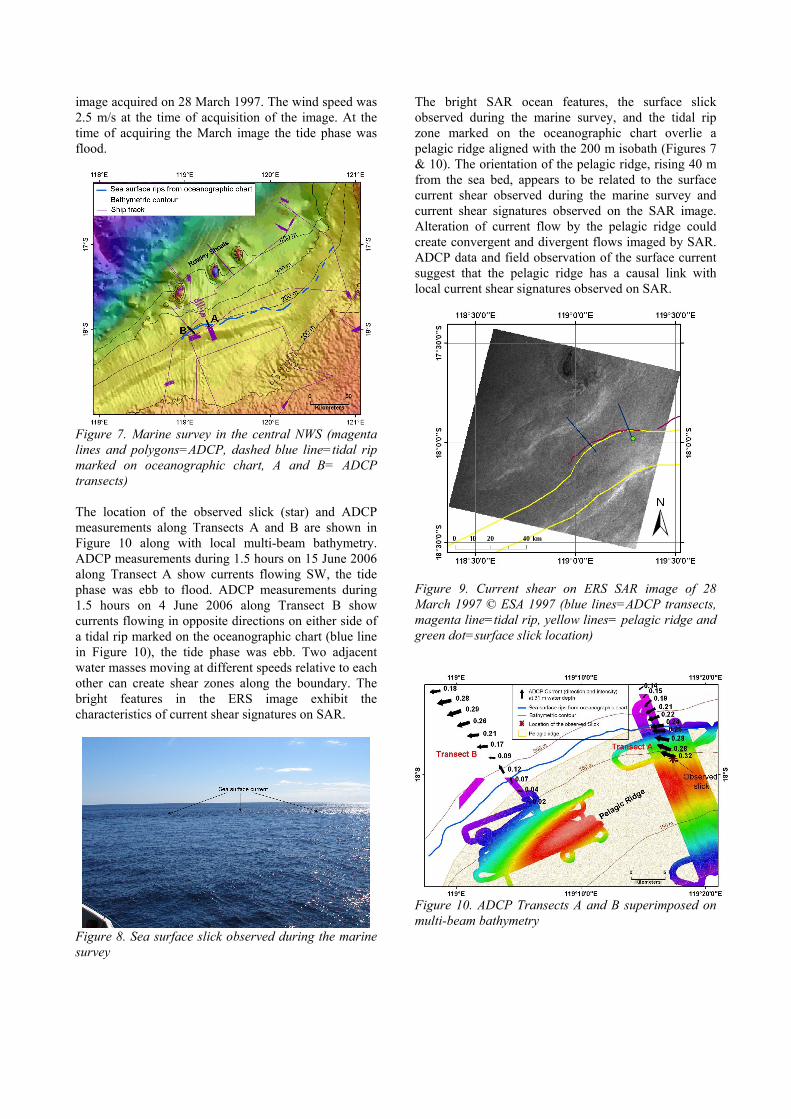
image acquired on 28 March 1997. The wind speed was 2.5 m/s at the time of acquisition of the image. At the time of acquiring the March image the tide phase was flood.
Figure 7. Marine survey in the central NWS (magenta
he location of the observed slick (star) and ADCP
lines and polygons=ADCP, dashed blue line=tidal rip marked on oceanographic chart, A and B= ADCP transects) Tmeasurements along Transects A and B are shown in Figure 10 along with local multi-beam bathymetry. ADCP measurements during 1.5 hours on 15 June 2006 along Transect A show currents flowing SW, the tide phase was ebb to flood. ADCP measurements during 1.5 hours on 4 June 2006 along Transect B show currents flowing in opposite directions on either side of a tidal rip marked on the oceanographic chart (blue line in Figure 10), the tide phase was ebb. Two adjacent water masses moving at different speeds relative to each other can create shear zones along the boundary. The bright features in the ERS image exhibit the characteristics of current shear signatures on SAR.
Figure 8. Sea surface slick observed during the marine survey
The bright SAR ocean features, the surface slick observed during the marine survey, and the tidal rip zone marked on the oceanographic chart overlie a pelagic ridge aligned with the 200 m isobath (Figures 7 & 10). The orientation of the pelagic ridge, rising 40 m from the sea bed, appears to be related to the surface current shear observed during the marine survey and current shear signatures observed on the SAR image. Alteration of current flow by the pelagic ridge could create convergent and divergent flows imaged by SAR. ADCP data and field observation of the surface current suggest that the pelagic ridge has a causal link with local current shear signatures observed on SAR.
Figure 9. Current shear on ERS SAR image of 28 March 1997 © ESA 1997 (blue lines=ADCP transects, magenta line=tidal rip, yellow lines= pelagic ridge and green dot=surface slick location)
Figure 10. ADCP Transects A and B superimposed on multi-beam bathymetry
4. CONCLUSIONS
Tidal currents flowing over undulating bottom features produce bathymetric patterns imaged by SAR in the northern NWS study area. Bathymetric features are imaged by both SAR and optical sensors with striking similarities. The SAR and optical image with sun glint represent to a first approximation the sea surface roughness conditions in the study area. Moderate wind speeds, strong currents and low tide prevailed during imaging of these features. Bathymetric feature detection through sun glint is achieved only under very specific sun-sensor-target geometries. Under optimum conditions, sun glint in optical satellite images could provide useful information on bottom topography which could complement the use of SAR. Multiple mechanisms could contribute to SAR imaging of mesoscale ocean features in the central NWS study area. Data collected during the marine survey suggests that wave-current interaction resulting from the modulation of currents by variable bathymetry is the predominant mechanism that regularly produces the observed mesoscale SAR features. Repeat occurrence of SAR current shear signatures corresponded well with in-situ data and field observation. The presence of a pelagic ridge on the sea bed at the same location suggests a strong causal link with the local current shear signatures observed on SAR. 5. REFERENCES
1. Alpers, W. and Hennings I. (1984). A theory of the imaging mechanism of underwater bottom topography by real and Synthetic Aperture Radar. Journal of Geophysical Research, 89-6, 10529-10546.
2. Gagliardini, D.A. and Clemente-Colón (2004). A
comparative assessment on the use of SAR and high resolution optical images in ocean dynamics studies. International Journal of Remote Sensing, 25, 1271-1275.
3. Hennings, I., Matthews, J. and Metzner, M. (1994).
Sun glitter radiance and radar cross section modulations of the sea bed. Journal of Geophysical Research, 99-8, 16303-16326.
4. Jackson, C.R. and Apel, J.R. (Eds) (2004)
Synthetic Aperture Radar Marine User’s Manual 5. Jones, A.T., Thankappan, M., Logan, G.A.,
Kennard, J.M., Smith, C.J., Williams, A.K. and Lawrence, G.M. (2006). Coral spawn and bathymetric slicks in Synthetic Aperture Radar (SAR) data from the Timor Sea, northwest
Australia. International Journal of Remote Sensing 27, 2063–2069.
6. Kennard, J. (2006). Voyage Summary SS06/2006
Central North West Shelf Seepage: Identifying potential natural hydrocarbon seeps and petroleum prospectivity, Offshore Canning & Roebuck Basins.http://www.marine.csiro.au/nationalfacility/voyagedocs/2006/index.htm
7. Lyzenga, D.R. and Marmorino, G. (1998).
Measurement of surface currents using sequential Synthetic Aperture Radar images of slick patterns near the edge of the Gulf Stream. Journal of Geophysical Research, 103-9, 18769-18777.
8. O’Brien, G.W., Cowley, R., Lawrence, G.,
Williams, A.K., Webster, M., Tingate, P. and Burns, S. (2003). Migration, leakage and seepage characteristics of the offshore Canning Basin and Northern Carnarvon Basin: Implications for hydrocarbon prospectivity. APPEA Journal, 149-166
9. Porter-Smith, R. P., Harris, P. T., Anderson, O.,
Coleman, R. and Greenslade, D. (2004). Classification of the Australian continental shelf based on predicted sediment threshold exceedance due to tidal currents and swell waves. Marine Geology, 211:1-20.
10. Shuchman, R., Lyzenga, D.R. and Meadows, G.
(1985). Synthetic Aperture Radar imaging of ocean-bottom topography via tidal current interactions: Theory and observations. International Journal of Remote Sensing, 6-7, 1179-1200.
11. Thankappan, M. and Smith, C.J.H. (2006). A
comparison of bathymetric signatures observed on ERS SAR and Landsat TM images over the Timor Sea. In Proceedings of the 13th Australasian Remote Sensing and Photogrammetry Conference, Canberra, 20 – 24 November 2006
12. Tomczak. M. and Godfrey, J.S. (1994). Regional
Oceanography: An Introduction. Pergamon, 422 pp.
ACKNOWLEDGEMENT
ENVISAT and ERS data for this study was acquired through the European Space Agency (ESA) Category-1 Research Proposal C1P-3415. The authors would like to thank ESA for making this data available to us.