sar ocean studies
TRANSCRIPT

SAR Ocean Studies
Benjamin Holt Oceans-Ice Group
Jet Propulsion Laboratory, Pasadena CA [email protected]
ISRO SAC, November 2014
Talk Outline
1)Small-scale Eddies and Fronts Importance, NASA –SWOT Mission
2) Coastal Pollution
3) Oil Spill Detection - UAVSAR

http://www.sarusersmanual.com/
2004

Southern California Bight Background Coastal Currents and Primary Watersheds
Ref: DiGiacomo et al 2004
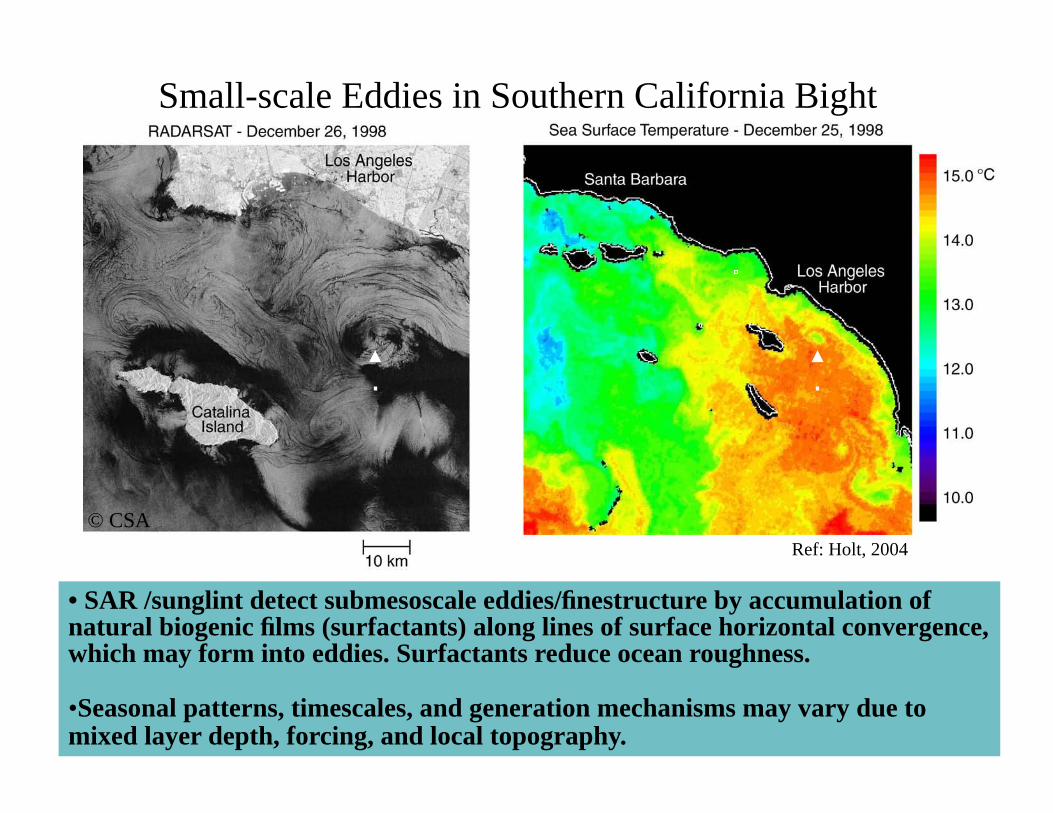
Small-scale Eddies in Southern California Bight
• SAR /sunglint detect submesoscale eddies/finestructure by accumulation of natural biogenic films (surfactants) along lines of surface horizontal convergence, which may form into eddies. Surfactants reduce ocean roughness. •Seasonal patterns, timescales, and generation mechanisms may vary due to mixed layer depth, forcing, and local topography.
© CSA Ref: Holt, 2004

Santa Barbara Channel, 14Z, Jan. 8, 2003, Radarsat
Ref: McWilliams et al 2009

Eddies observed via ERS-1/2 SAR Imagery in the SCB • Eddies were predominantly under 20 km in diameter, and mostly cyclonic in rotation
• Appeared to result from inertial instability, as well as topographic and wind forcing
• Seasonal distribution in eddy field observed
• Reference: P.M. DiGiacomo & B. Holt, 2001, JGR Oceans **Many properties of these eddies largely unknown including depth, velocity, generation, longevity
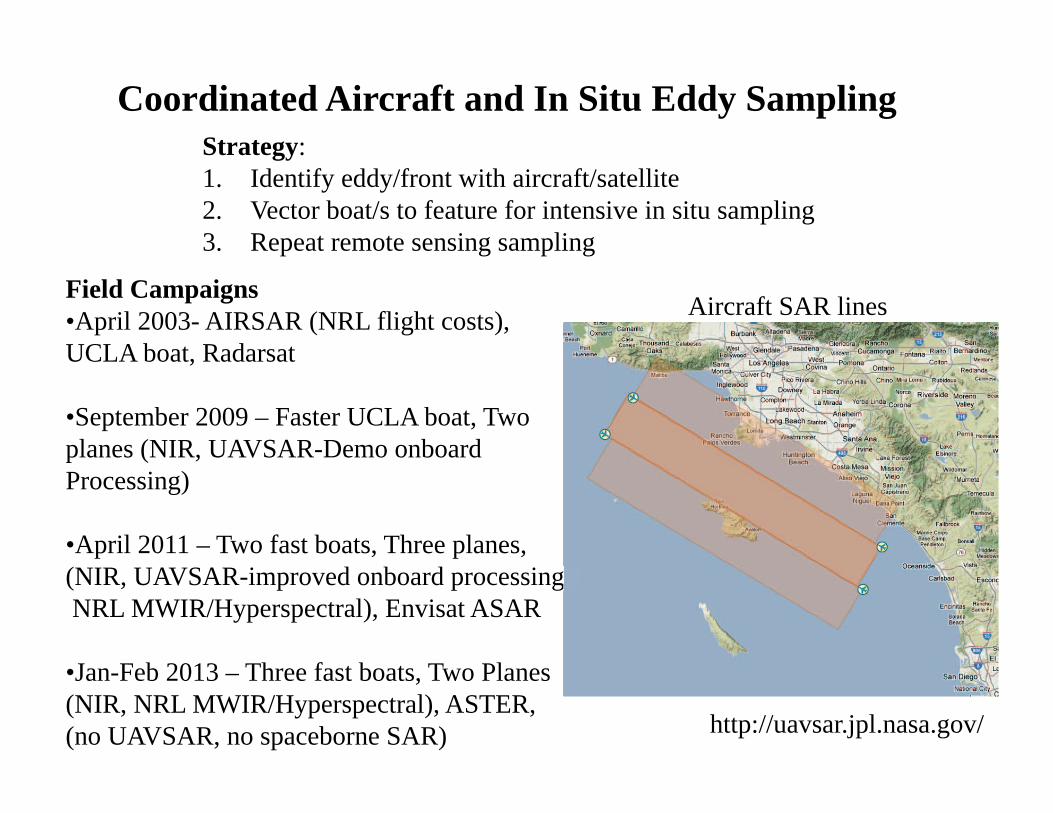
Coordinated Aircraft and In Situ Eddy Sampling
Field Campaigns •April 2003- AIRSAR (NRL flight costs), UCLA boat, Radarsat •September 2009 – Faster UCLA boat, Two planes (NIR, UAVSAR-Demo onboard Processing) •April 2011 – Two fast boats, Three planes, (NIR, UAVSAR-improved onboard processing), NRL MWIR/Hyperspectral), Envisat ASAR •Jan-Feb 2013 – Three fast boats, Two Planes (NIR, NRL MWIR/Hyperspectral), ASTER, (no UAVSAR, no spaceborne SAR)
(NIR, UAVSAR-improved onboard processing),
Strategy: 1. Identify eddy/front with aircraft/satellite 2. Vector boat/s to feature for intensive in situ sampling 3. Repeat remote sensing sampling
Aircraft SAR lines
http://uavsar.jpl.nasa.gov/

Airborne-Shipborne Campaign, April 16, 2003 Near Catalina Island (Ref: Marmorino, Holt et al., J. Geophysical Res. Oceans, May 2010)
Left top – NASA AIRSAR obtained repeat imagery, 5 hour interval Right Top – Leg EF (1d). Averaged current vectors (3-25 m depth range ). Temperature and salinity at 0.6m depth, indicates cold core near eddy center. Left - AVHRR SST from April 16 showing cold eddy center ( + ) and front (red line) derived from radar bright line seen in 1c.
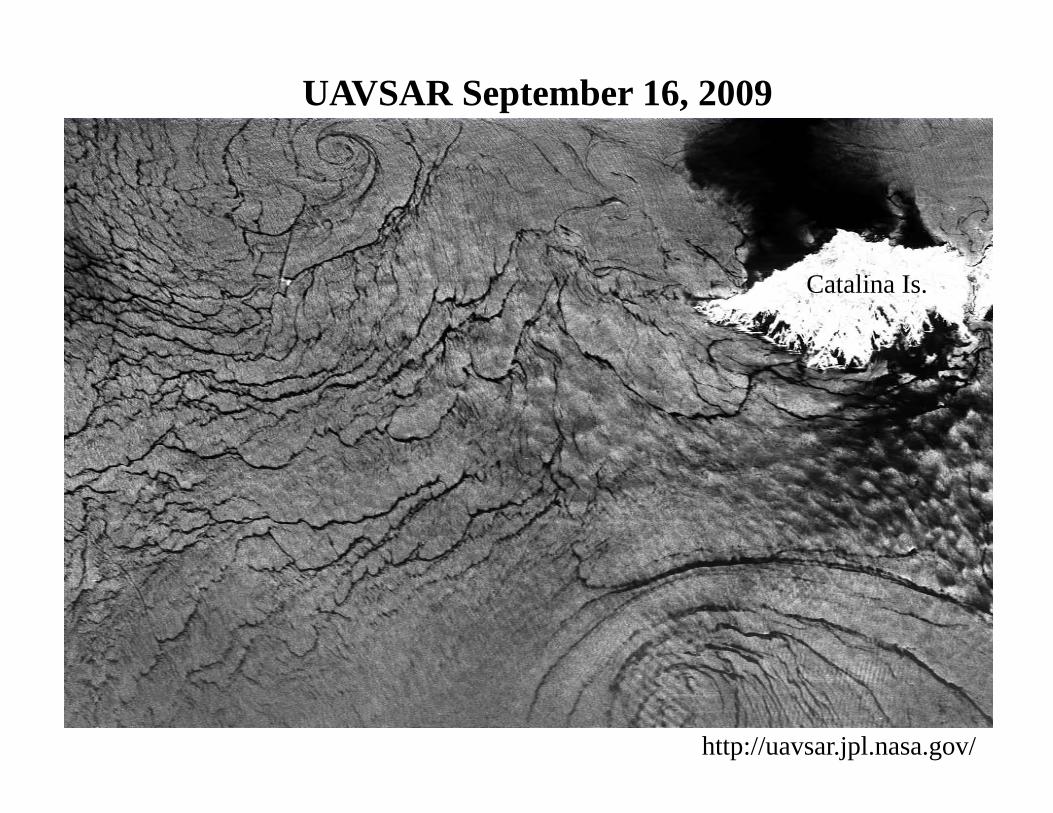
UAVSAR September 16, 2009
Catalina Is.
http://uavsar.jpl.nasa.gov/

Landsat 8– June 30, 2013, 1830 UTC Sunglint in True Color Imagery – 15 m Thermal IR – 90 m
eddy •High resolution optical/sunglint (and SAR) and thermal IR show fine structure and temperate gradients within submesoscale eddy flow field, not well detected in Modis 1-km SST. •Need for increased and repeating observations for quantitative derivations.
eddy
eddy Los Angeles
Ref: B. Holt- JPL

b
A
05 August 1992, 0358UTC 05 August 1992, 0943UTC AVHRR SST ERS-1 SAR
Lake Superior – Small-Scale Eddies Associated with Coastal Current
•Anticyclonic eddy (a) shedding off Keweenaw Peninsula (KP), diameter 19 km, and smaller cyclonic eddy (b), diameter 17 km, both associated with sharp thermal gradient that forms in Lake Superior during the summer months. •Eddies are indicative of enhanced coastal current variability.
Ref: P. McKinney1, B. Holt2, K. Matsumoto1, Small eddies observed in Lake Superior using SAR and sea surface temperature data, Journal of Great Lakes Research, 2012, U. Minnesota1, Jet Propulsion Laboratory2

A Stormwater Discharge
•SAR detects materials on surface that reduce backscatter (oils) •Determine direction and extent of plume discharge Ref: DiGiacomo et al., 2004
© ESA
MDR
LAX
3 km SGR
© ESA
LAR 5 km
LA
LB
BW
Los Angeles, San Gabriel Rivers Los Angeles – Long Beach Harbors
ERS-1 SAR – 28 Decembe 1992
Ballona Creek Santa Monica Bay
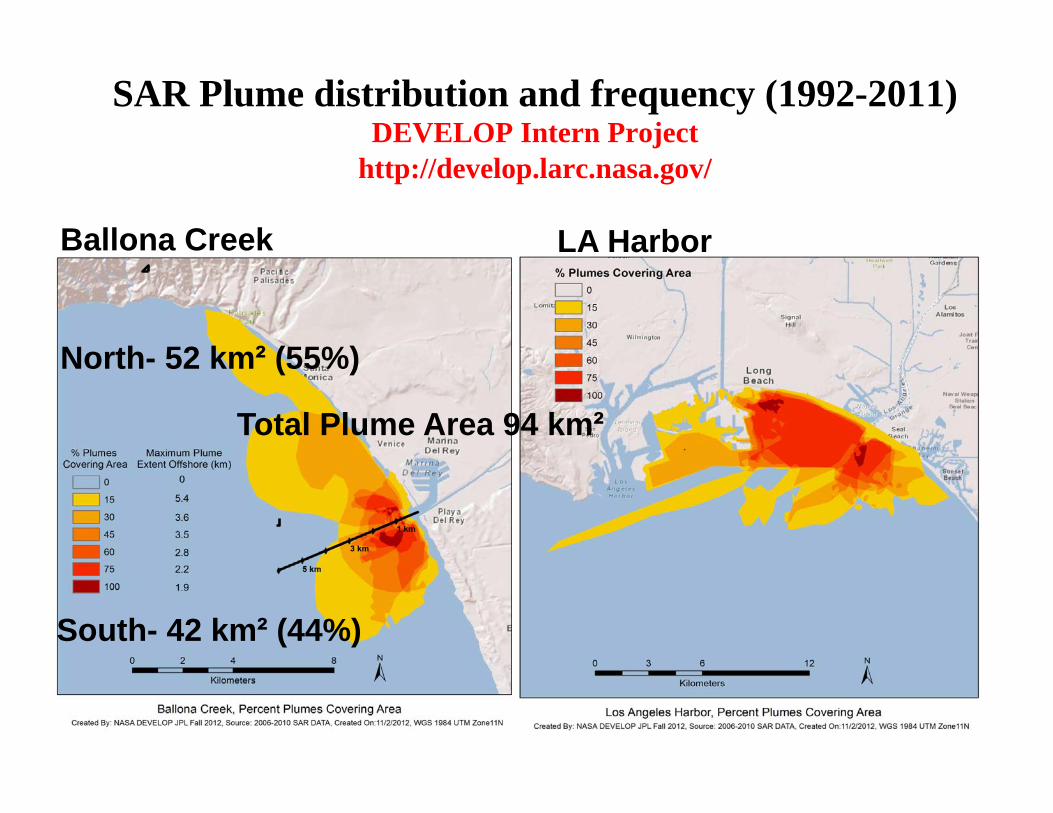
SAR Plume distribution and frequency (1992-2011) DEVELOP Intern Project
http://develop.larc.nasa.gov/
Ballona Creek LA Harbor
South- 42 km² (44%)
North- 52 km² (55%)
Total Plume Area 94 km²

© CSA
(A) MDR
LAX
RB 4 km
-118.8 -118.7 -118.6 -118.5 -118.4
33.75
33.8
33.85
33.9
33.95
34
34.05
33.24 33.32 33.4 33.48 33.56
MDR
RB
Z2
C5
C9
D2
B7
Surfacing Wastewater Plume – Hyperion Plant, Santa Monica Bay RADARSAT
24 December, 1997 at 0140 GMT Ocean salinity, 20-21 December 1989
-Treated wastewater discharged through diffuser at 60m depth, well offshore -Material usually trapped and mixed at depth -Oils in plume reduce radar backscatter
-Evidence of surfacing plume (fresh) -Winter has weak ocean stratification, plume can rise to surface, subject to winds, surface currents.
Ref: DiGiacomo et al., 2004

Sea surface roughness – Wastewater Plume R1 SAR – HTP: Dec. 1, 2006 ASAR – HTP: Dec. 10, 2006
Remnant wastewater plume
Surfaced wastewater plume from 5-mile pipe
Ballona Creek discharge
Dark area of reduced backscattering, signature of wastewater plume, at the base of Marina Del Rey, north of the 1-mile outfall pipe.
Dark slick at the mouth of the marina is attributed to creek discharge. A second dark slick observed at the terminus of the 5-mile pipe is attributed to surfacing of wastewater during low density stratification within the water column. Ref: Gierach, Holt et al., 2014

Sea surface temperature- Wastewater Plume
MODIS – OCSD: Sep. 22, 2012 ASTER – OCSD: Sep. 23, 2012
A low SST signature (20.5ºC), indicative of the plume, is seen in the vicinity of the 1-mile outfall pipe during the diversion and is surrounded by warmer adjacent waters (21.5 – 22ºC). � �
The low SST signature (20.5ºC) remained in the vicinity of the 1-mile outfall pipe, but was significantly smaller in extent (~2km) than the previous day (~4km). This is attributed to the coarser 250m MODIS-Aqua versus finer 90m ASTER-Terra spatial resolutions. �
Ref: Gierach, Holt et al., 2014

NASA UAVSAR GULF OIL SPILL CAMPAIGN 22-23 JUNE 2010 DEPLOYMENT
Frequency L-Band 1217.5 to 1297.5 MHz
(23.8 cm wavelength)
Intrinsic Resolution 1.7 m Slant Range, 0.8 m Azimuth
Polarization HH, HV, VH, VV
Repeat Track Accuracy ± 5 meters
Transmit Power > 3.1 kW
Radiometric Calibration
1.2 dB absolute, 0.5 dB relative channel-to-channel
Noise Floor -47 dB average
o 2 days, 21 flight hours o ~5500 km of flight lines with 22 km swath width o imaged an area of 120,000 km2
Main DWH oil slick, imaged 23 June 2010
'Crazy idea'
Ref: Jones et al., 2011
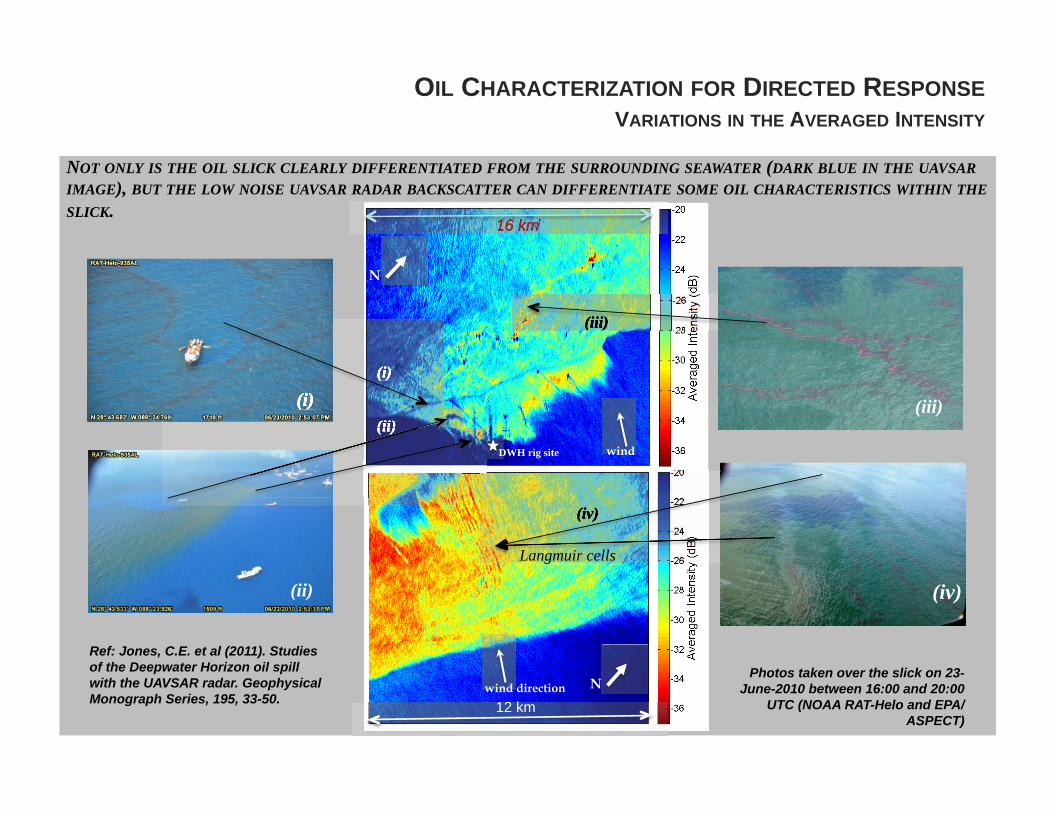
OIL CHARACTERIZATION FOR DIRECTED RESPONSE VARIATIONS IN THE AVERAGED INTENSITY
NOT ONLY IS THE OIL SLICK CLEARLY DIFFERENTIATED FROM THE SURROUNDING SEAWATER (DARK BLUE IN THE UAVSAR IMAGE), BUT THE LOW NOISE UAVSAR RADAR BACKSCATTER CAN DIFFERENTIATE SOME OIL CHARACTERISTICS WITHIN THE SLICK.
(iv)
(iii) (i)
(ii)
N N wind direction
(iv)
DWH rig site
N
wind
(i)
(i) (i)
(iii) (iii)
(ii) (i)
(ii) (ii) (ii)
16 km 16 km
(iv)
Photos taken over the slick on 23-June-2010 between 16:00 and 20:00
UTC (NOAA RAT-Helo and EPA/ASPECT)
Langmuir cells
12 km
Ref: Jones, C.E. et al (2011). Studies of the Deepwater Horizon oil spill with the UAVSAR radar. Geophysical Monograph Series, 195, 33-50.

Dielectric Constant of Ocean and Oil Emulsion Forms New Dieletric Layer
Ocean Surface (no oil)
Ocean Surface +Thin Sheen
Sheen
Emulsion
Complex Permittivity ε = ε' – iε''
εSW = 80 –i70
-Reduced roughness -Sheen too thin to change εsw
Crude oil εO = 2.3 –i0.02 -Low conductivity surface
Sea water εsw = 80 –i70 -High conductivity surface
-New dielectric layer with ε mixture –Alters scattering
εSW+Sheen ~~ 80 –i70
Emulsion = Mixture of Oil + Sea water εMixture = εSW + εO
-Frequency, temperature dependent
Ocean Surface (no oil) εεSW = 80 –i70= 80 –i70
-Frequency, temperature dependent
Ocean Surface +Thin Sheen
Sheen Sheen -Reduced roughness -Sheen too thin to change εswεSW+Sheen ~~ 80 –i70
Emulsion -New dielectric layerwith ε mixture–Alters scattering
Emulsion = Mixture of Oil Mixture of Oil + Sea water εεMixture = εεSW + + εεO
•UAVSAR polarimetric signatures respond to volumetric fraction of emulsified oil as mixture of oil and seawater
Ref: Minchew, Jones, Holt, 2012
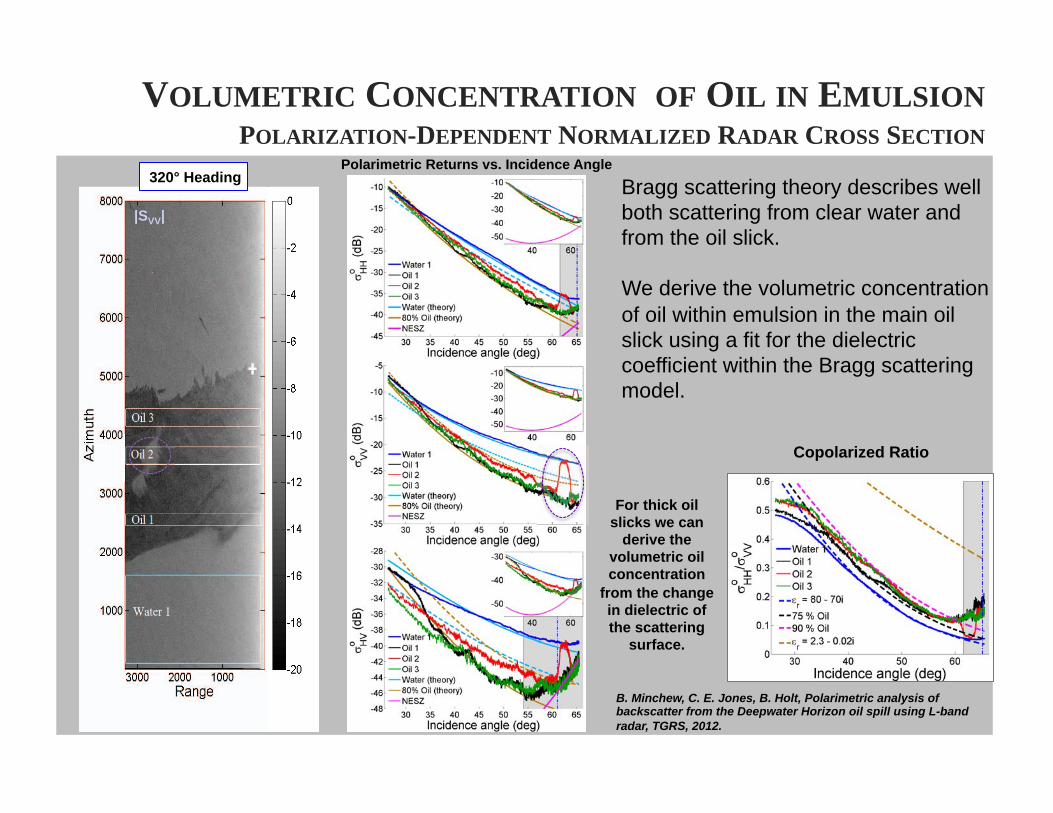
VOLUMETRIC CONCENTRATION OF OIL IN EMULSION POLARIZATION-DEPENDENT NORMALIZED RADAR CROSS SECTION
Polarimetric Returns vs. Incidence Angle
|SVV|
320° Heading
Copolarized Ratio
For thick oil slicks we can
derive the volumetric oil concentration
from the change in dielectric of the scattering
surface.
B. Minchew, C. E. Jones, B. Holt, Polarimetric analysis of backscatter from the Deepwater Horizon oil spill using L-band radar, TGRS, 2012.
Bragg scattering theory describes well both scattering from clear water and from the oil slick. We derive the volumetric concentration of oil within emulsion in the main oil slick using a fit for the dielectric coefficient within the Bragg scattering model.

UAVSAR INSTRUMENT NOISE FLOOR
noise equivalent σ0 (dB)
UAVSAR NOISE FLOOR Comparison with other RADAR instruments
The low noise floor of the UAVSAR instrument makes it possible to measure the radar cross section from water with an L-band radar, even with oil damping the surface waves. We find that the instrument noise floor is reached only at the far edge of the swath for the HV returns from oil.
C. Jones, B. Holt, S. Hensley (JPL/Caltech), B. Minchew (Caltech), Studies of the Deepwater Horizon Oil Spill with the UAVSAR Radar, AGU Monograph Series, 2011.

• NASA/UAVSAR was invited to participate in the Norwegian oil spill exercises in June 2015.
• Exercise simulates a large spill (10s of kl) in North Sea • UAVSAR participation requested to develop SAR-based oil
characterization capability • UAVSAR's exceptionally low noise make it a unique
instrument for studying oil spills. • Concurrent sea truth and optical, IR, and satellite SAR
imagery all obtained at no cost to NASA. • Participation will enable development and validation of oil
characterization models with L-band SAR in time to inform the design of the NASA L-band NISAR Mission.
• Norwegians will tailor their spills to test emulsion characterization with UAVSAR
• Invitation presents a unique opportunity to validate and extend radar remote sensing to prepare for future spill response in this country.
• Norwegian collaboration could lead to oil-in-ice spill response capability – important for Arctic oil exploration
References: 1. Minchew, B., C. E. Jones, B. Holt, (2012). Polarimetric analysis of backscatter from the
Deepwater Horizon oil spill using L-band synthetic aperture radar, IEEE Trans. Geosci. Remote Sens., 50(10), 3812-3830.
2. Brekke, C., Holt, B., Jones, C., & Skrunes, S. (2014). Discrimination of oil spills from newly formed sea ice by synthetic aperture radar. Remote Sensing of Environment, 145, 1-14.
FY15&16: UAVSAR Norwegian oil-on-water exercise campaign June 2015 for advanced SAR-based oil characterization Investigators: Cathleen Jones, Ben Holt (JPL), Camilla Brekke (U. Tromso, Norway)
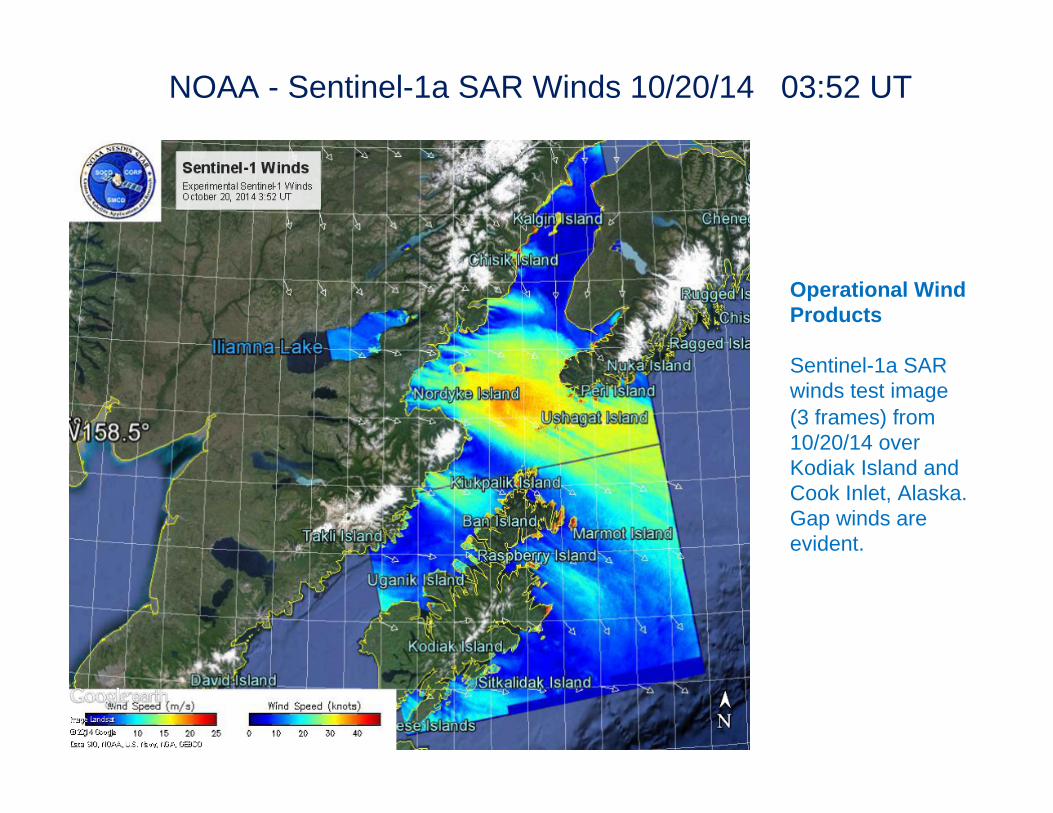
NOAA - Sentinel-1a SAR Winds 10/20/14 03:52 UT
Operational Wind Products Sentinel-1a SAR winds test image (3 frames) from 10/20/14 over Kodiak Island and Cook Inlet, Alaska. Gap winds are evident.
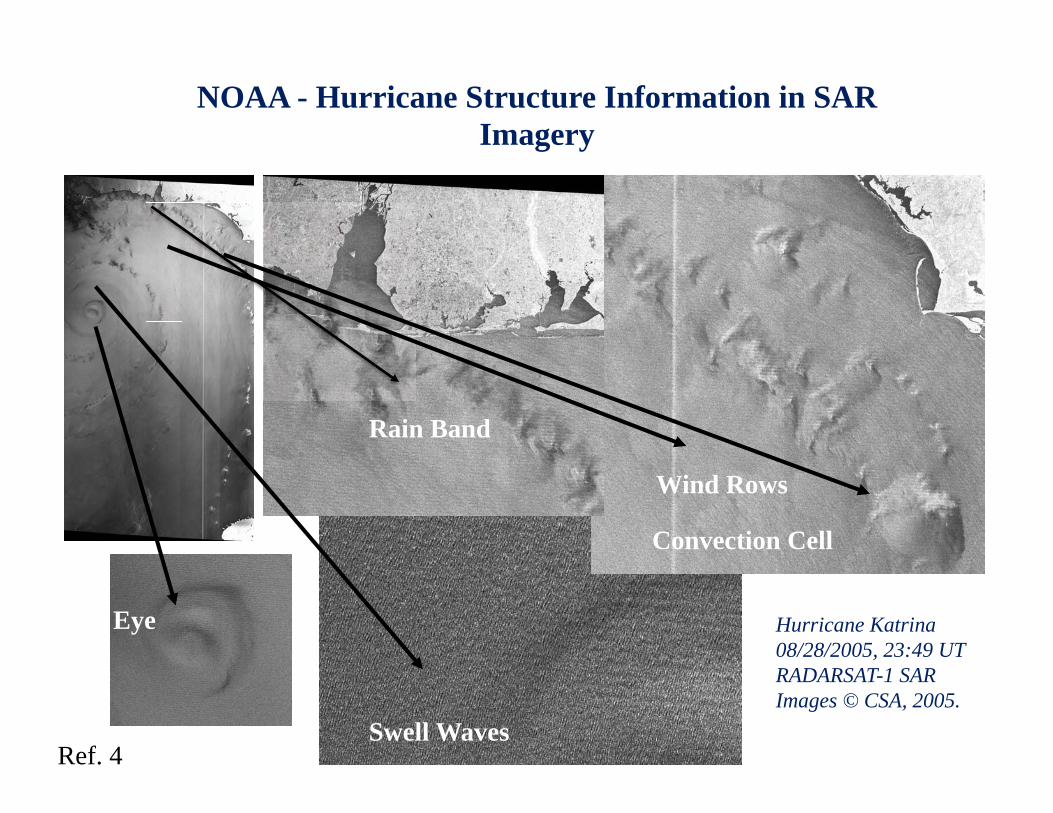
Eye
Swell Waves
Wind Rows
Convection Cell
Hurricane Katrina 08/28/2005, 23:49 UT RADARSAT-1 SAR Images © CSA, 2005.
NOAA - Hurricane Structure Information in SAR Imagery
Rain Band
Ref. 4
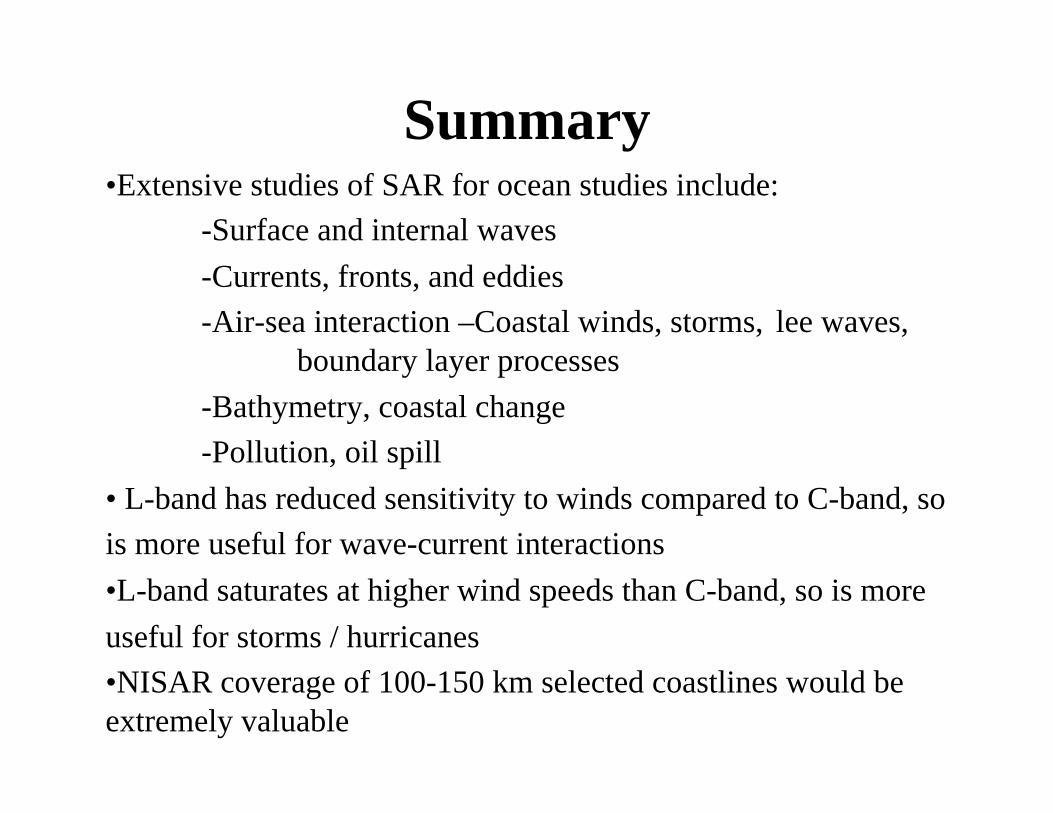
Summary •Extensive studies of SAR for ocean studies include:
-Surface and internal waves -Currents, fronts, and eddies -Air-sea interaction –Coastal winds, storms, lee waves, boundary layer processes -Bathymetry, coastal change -Pollution, oil spill
• L-band has reduced sensitivity to winds compared to C-band, so is more useful for wave-current interactions •L-band saturates at higher wind speeds than C-band, so is more useful for storms / hurricanes •NISAR coverage of 100-150 km selected coastlines would be extremely valuable

SAR Eddy & Pollution References • DiGiacomo, P. M., and B. Holt, Satellite observations of small coastal ocean eddies
in the Southern California Bight, J. Geophys. Res., 106(C10), 22,521-22,544, 2001. • DiGiacomo, P. M., L. Washburn, B. Holt, and B. H. Jones, Coastal pollution
hazards in Southern California observed by SAR imagery: Stormwater plumes, wastewater plumes, and natural hydrocarbon seeps, Marine Pollution Bulletin, 49, 1013-1024, 2004.
• Holt, B., SAR imaging of the ocean surface, in C. R. Jackson and J. R. Apel (eds) Synthetic Aperture Radar (SAR) Marine User's Manual, NOAA NESDIS Office of Research and Applications, Washington DC, pp. 25-79, 2004.
• Marmorino, G. O., B. Holt, M. J. Molemaker, P. M. DiGiacomo, M. A. Sletten, Airborne synthetic aperture radar observations of 'spiral eddy' slick patterns in the Southern California Bight, J. Geophysical Research Oceans, 115, C05010, doi:10.1029/2009JC005863, 2010.
• McKinney, P., B. Holt, and K. Matsumoto, Small eddies observed in Lake Superior using SAR and sea surface temperature imagery, Journal of Great Lakes Research 38, 786-797, 2012.
• Gierach, M., B. Holt, R. Trinh, B. Pan, C. Rains, Satellite detection of wastewater plumes in Southern California, Estuarine, Coastal, Shelf Science, submitted 2014.

1. Minchew, Brent, Cathleen E. Jones Benjamin Holt (2012), Polarimetric analysis of backscatter from the Deepwater Horizon oil spill using L-band radar, DOI:10.1109/TGRS.2012.2185804, to be published in TGRS.
2. Jones, Cathleen E., Brent Minchew, Benjamin Holt, and Scott Hensley (2011), Studies of the Deepwater Horizon oi
SAR Oil Spill Papers 1. Minchew, Brent, Cathleen E. Jones Benjamin Holt (2012), Polarimetric analysis of
backscatter from the Deepwater Horizon oil spill using L-band radar, DOI:10.1109/TGRS.2012.2185804, IEEE Trans. Geosci. Remote Sensing Oct 2012.
2. Jones, Cathleen E., Brent Minchew, Benjamin Holt, and Scott Hensley (2011), Studies of the Deepwater Horizon oil spill with the UAVSAR radar, in Monitoring and Modeling of the Deepwater Horizon Oil Spill: A Record-Breaking Enterprise, Geophys. Monogr. Ser., vol. 195, edited by Y. Liu et al., pp. 33–50, AGU, Washington, D. C.
3. Leifer, I., B. Lehr, D. Simecek-Beatty, E. Bradley, R. Clark, P. Dennison, Y. Hu, S. Matheson, C. Jones, B. Holt, M. Reif, D. Roberts, J. Svejkovsky, G. Swayze, J. Wozencraft, State of the art satellite and airborne marine oil spill remote sensing: Application to the BP Deepwater Horizon oil spill, Remote Sensing of the Environment, 124, 185-209, 2012.
4. Ramsey, Elijah, A. Rangoonwala, Y. Suzuoki, and C.E. Jones (2011), Oil detection in a coastal marsh with polarimetric synthetic aperture radar (SAR), Remote Sensing, 3(12), 2630-2662
5. Brekke Camilla, Benjamin Holt, Cathleen Jones, Stine Skrunes (2014), Discrimination of Oil Spills from Newly Formed Sea Ice by Synthetic Aperture Radar, Remote Sensing of the Environment.
Day of Year (1998)
308 310 312 314 316 318 320V
olu
me d
ischarg
e (m
3 s
-1)
0
20
40
60
80
100
120
140
160
Cu
mu
lative
Disch
arg
e (m
3)
0.0
5.0e+5
1.0e+6
1.5e+6
2.0e+6
2.5e+6
Cu
mu
lative
Pre
cipita
tion
(cm)
0.0
0.2
0.4
0.6
0.8
1.0
1.2
1.4
1.6
1.8
Volume DischargeCumulative DischargeCumulative Precipitation
A
(A) (A)
© CSA
LAX
MDR
B
3km
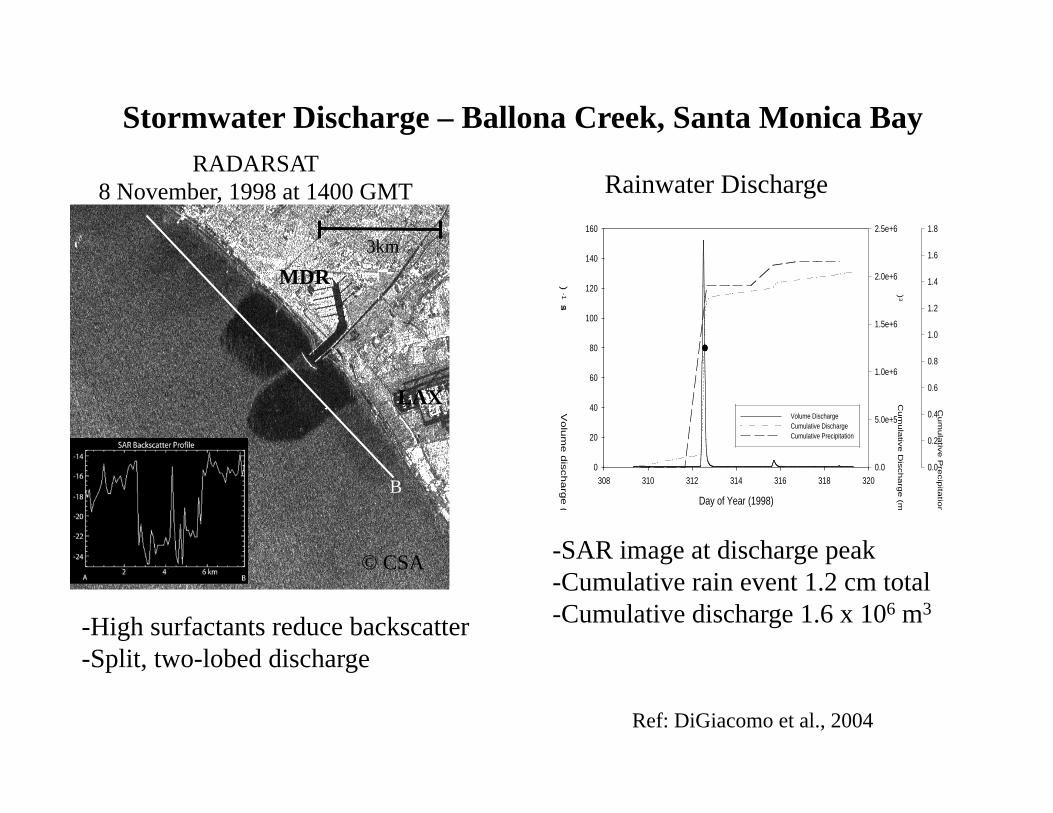
Stormwater Discharge – Ballona Creek, Santa Monica Bay RADARSAT
8 November, 1998 at 1400 GMT Rainwater Discharge
-High surfactants reduce backscatter -Split, two-lobed discharge
-SAR image at discharge peak -Cumulative rain event 1.2 cm total -Cumulative discharge 1.6 x 10⁶ m3
Ref: DiGiacomo et al., 2004
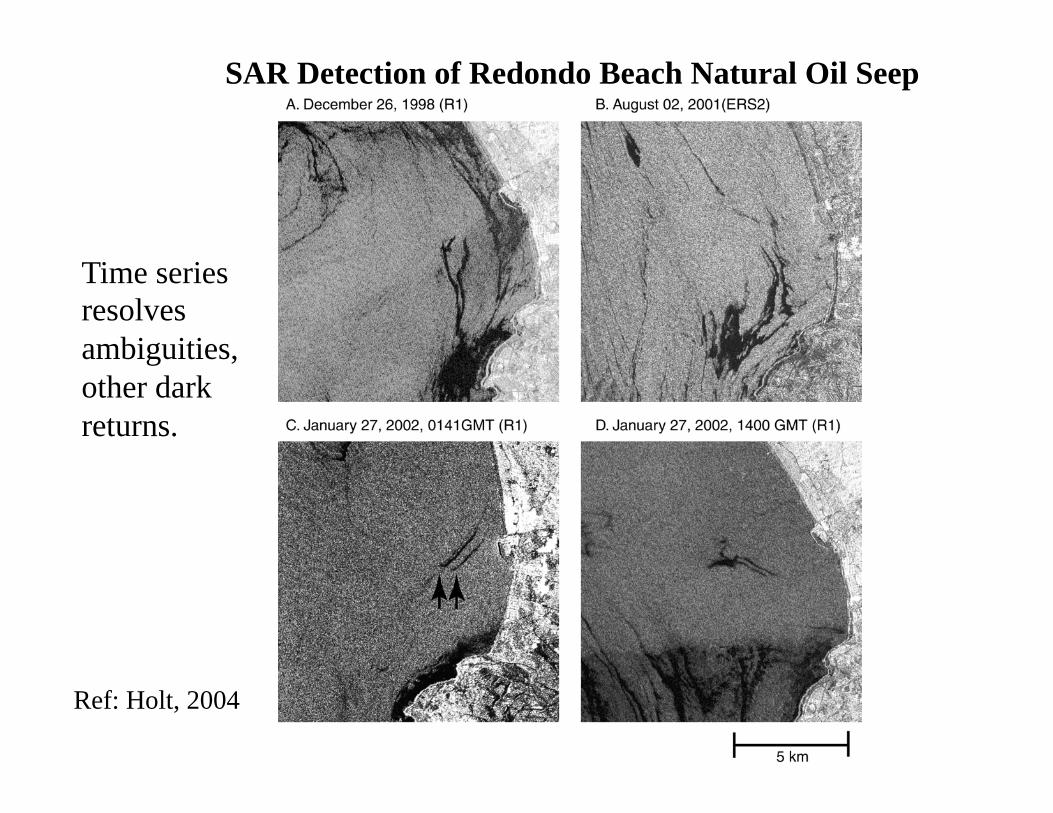
SAR Detection of Redondo Beach Natural Oil Seep
Time series resolves ambiguities,other dark returns.
Ref: Holt, 2004
(C)
COP COP
COP COP
(C)
COP
5 km
5 km
COP
5 km
5 km
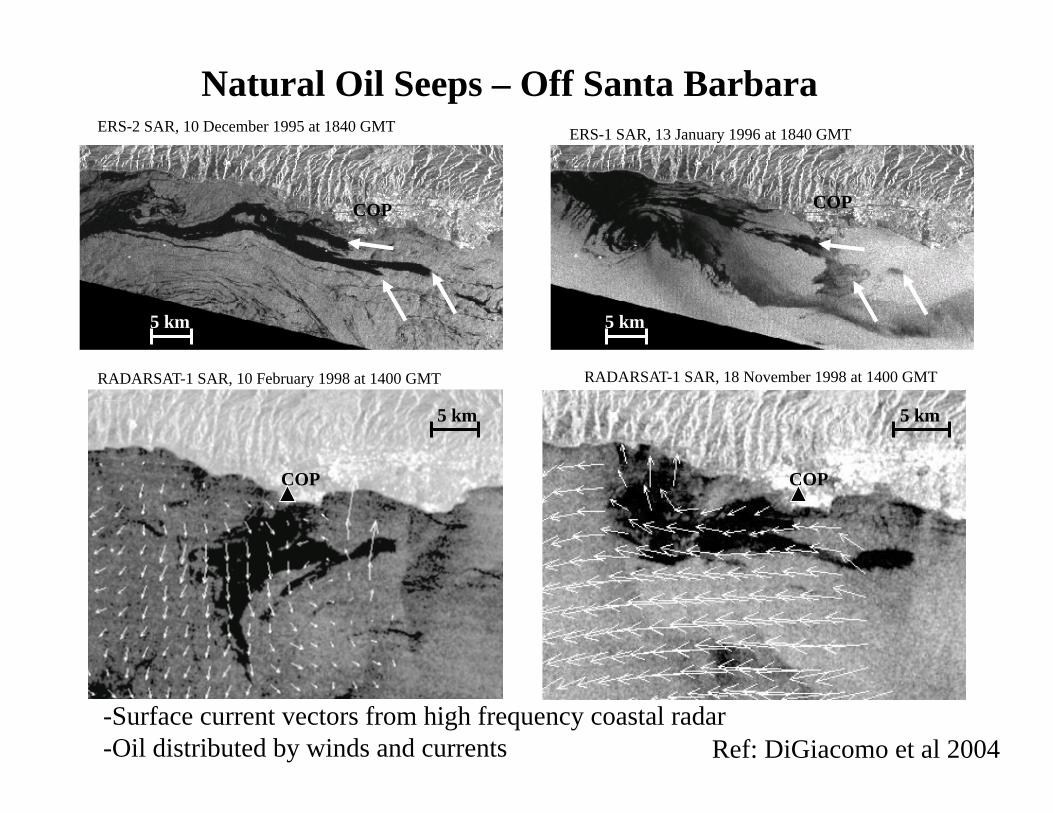
Natural Oil Seeps – Off Santa Barbara ERS-2 SAR, 10 December 1995 at 1840 GMT ERS-1 SAR, 13 January 1996 at 1840 GMT
RADARSAT-1 SAR, 10 February 1998 at 1400 GMT RADARSAT-1 SAR, 18 November 1998 at 1400 GMT
-Surface current vectors from high frequency coastal radar -Oil distributed by winds and currents Ref: DiGiacomo et al 2004