assessment of managed aquifer recharge at sand hollow ... · cover photograph: view of drilling...
TRANSCRIPT

U.S. Department of the Interior U.S. Geological Survey
Open-File Report 2018–1140
Prepared in cooperation with the Washington County Water Conservancy District
Assessment of Managed Aquifer Recharge at Sand Hollow Reservoir, Washington County, Utah, Updated to Conditions Through 2016

Cover photograph: View of drilling operations at well WD 22 near Sand Hollow Reservoir, Utah, looking west. Photograph by Tom M. Marston, U.S. Geological Survey, August 2015.
Assessment of Managed Aquifer Recharge at Sand Hollow Reservoir, Washington County, Utah, Updated to Conditions Through 2016
By Thomas M. Marston and Nora C. Nelson
Prepared in cooperation with the Washington County Water Conservancy District
Open-File Report 2018–1140
U.S. Department of the InteriorU.S. Geological Survey

U.S. Department of the Interior RYAN K. ZINKE, Secretary
U.S. Geological Survey James F. Reilly II, Director
U.S. Geological Survey, Reston, Virginia: 2018
For more information on the USGS—the Federal source for science about the Earth, its natural and living resources, natural hazards, and the environment—visit https://www.usgs.gov or call 1–888–ASK–USGS.
For an overview of USGS information products, including maps, imagery, and publications, visit https://store.usgs.gov.
Any use of trade, firm, or product names is for descriptive purposes only and does not imply endorsement by the U.S. Government.
Although this information product, for the most part, is in the public domain, it also may contain copyrighted materials as noted in the text. Permission to reproduce copyrighted items must be secured from the copyright owner.
Suggested citation:Marston, T.M., and Nelson, N.C., 2018, Assessment of managed aquifer recharge at Sand Hollow Reservoir, Washington County, Utah, updated to conditions through 2016: U.S. Geological Survey Open-File Report 2018–1140, 38 p., https://doi.org/10.3133/ofr20181140.
ISSN 2331-1140 (online)

iii
ContentsAbstract ..........................................................................................................................................................1Introduction ....................................................................................................................................................1Assessment of Managed Aquifer Recharge at Sand Hollow Reservoir .............................................3
Data Collection Methods and Results ..............................................................................................3Production-Well Withdrawals ..................................................................................................3Drain Discharge ..........................................................................................................................6Groundwater-Level Data and Reservoir Altitude ..................................................................7Surface-Water Inflow To and Outflow From Sand Hollow Reservoir ................................8Meteorological Data .................................................................................................................19
Estimates of Managed Aquifer Recharge From Sand Hollow Reservoir ..................................20Changes in Reservoir Storage .................................................................................................20Reservoir Evaporation ..............................................................................................................21Estimates of Total Volume of Managed Aquifer Recharge From
Sand Hollow Reservoir ...............................................................................................21Groundwater and Surface-Water Quality in Sand Hollow ...................................................................24
Water-Quality Results .......................................................................................................................24Summary .......................................................................................................................................................37References Cited .........................................................................................................................................37
Figures
1. Map showing location of the Sand Hollow Reservoir study area, Washington County, Utah ...........................................................................................................2
2. Map showing location of monitoring and production wells, weather stations, drains, and surface-water sampling sites in and near Sand Hollow Reservoir, Washington County, Utah ...........................................................................................................4
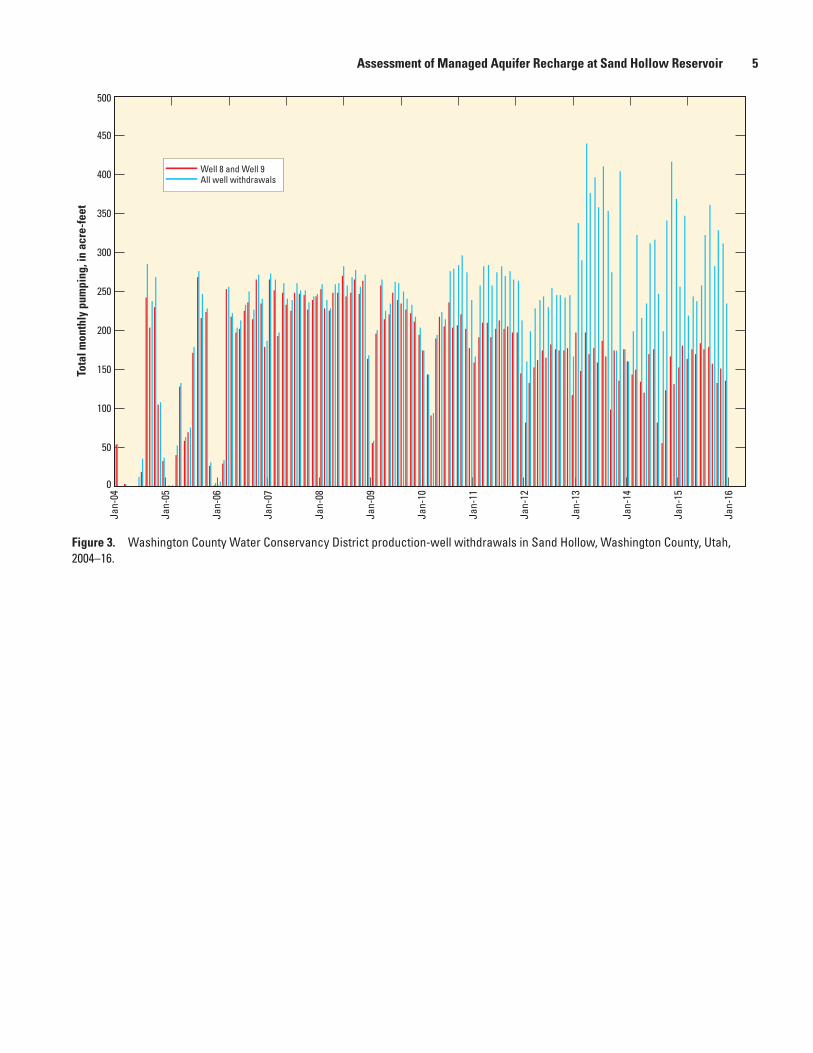
3. Graph showing ashington County Water Conservancy District production-well withdrawals in Sand Hollow, Washington County, Utah, 2004–16 .......................................5
4. Graph showing monthly reported discharge from the North and West Dam drains, and the West Dam Spring drain in relation to reservoir altitude at Sand Hollow Reservoir, Washington County, Utah, 2003–16 ........................................................................6
5. Graph showing water-level altitude in monitoring wells in relation to Sand Hollow Reservoir altitude, Sand Hollow, Washington County, Utah, 1995–2016 ............................7
6. Map showing potentiometric surface of the Navajo aquifer in December 2016, at Sand Hollow Reservoir, Washington County, Utah ................................................................9
7. Graph showing monthly precipitation at Sand Hollow Reservoir, Washington County, Utah, 1998–2016 ...........................................................................................................19
8. Graph showing monthly estimated evaporation and groundwater recharge in relation to reservoir altitude at Sand Hollow Reservoir, Washington County, Utah, 2002–16 ........................................................................................................................................21
9. Graph showing monthly calculated groundwater recharge rates beneath Sand Hollow Reservoir, Washington County, Utah, 2002–16 .......................................................22
10. Graph showing estimated annual net inflow, evaporation, and groundwater recharge at Sand Hollow Reservoir, Washington County, Utah, 2002–16 ........................23

iv
Tables
1. Reservoir data, evaporation, precipitation, and calculated recharge beneath Sand Hollow Reservoir, Washington County, Utah, 2002–16 .........................................................10
2. Field measurements, total dissolved-gas pressure, and concentrations of dissolved organic carbon, tritium, chlorofluorocarbons, and sulfur hexafluoride in groundwater and surface water from Sand Hollow, Washington County, Utah..........25
3. Field measurements and concentrations of major ions, selected trace elements, and nutrients in groundwater and surface water from selected sites in Sand Hollow, Washington County, Utah ............................................................................................31

v
Conversion Factors, Datums, and Abbreviated Water-Quality Units
U.S. customary units to International System of Units
Multiply By To obtain
Length
inch (in.) 2.54 centimeter (cm)foot (ft) 0.3048 meter (m)mile (mi) 1.609 kilometer (km)
Volume
acre foot (acre-ft) 1,233.48 cubic meter (m)Hydraulic conductivity
foot per day (ft/d) 0.3048 meter per day (m/d)
Temperature in degrees Celsius (°C) can be converted to degrees Fahrenheit (°F) as follows:
°F=(1.8×°C)+32
Temperature in degrees Fahrenheit (°F) can be converted to degrees Celsius (°C) as follows:
°C=(°F–32)/1.8
Horizontal coordinate information is referenced to the North American Datum of 1983 (NAD 83).
Vertical coordinate information is referenced to the North American Vertical Datum of 1988 (NAVD 88).
Altitude, as used in this report, refers to distance above the vertical datum.
Specific conductance is given in microsiemens per centimeter at 25 degrees Celsius (µS/cm at 25 °C).
Total dissolved-gas pressure is reported in millimeters of mercury (mm Hg), where 760 mm Hg equals one atmosphere.
Concentrations of chemical constituents in water are given either in milligrams per liter (mg/L) or micrograms per liter (µg/L).
Tritium units (TU) are used to report tritium concentration, where 1 TU equals tritium concentration in picoCuries per liter divided by 3.22.
Chlorofluorocarbon (CFC) concentrations are reported as picomoles per kilogram (pmol/kg).
Sulfur hexafluoride (SF6) concentrations are reported as femtomoles per kilogram (fmol/kg).
vi
Abbreviations CFCs chlorofluorocarbons
Cl/Br chloride to bromide ratio
DO dissolved oxygen
DOC dissolved organic carbon
MAR managed aquifer recharge
NRCS Natural Resources Conservation Service
SCAN Soil Climate Analysis Network
TDG total dissolved gas
USGS U.S. Geological Survey
WCWCD Washington County Water Conservancy District
WD water district
Assessment of Managed Aquifer Recharge at Sand Hollow Reservoir, Washington County, Utah, Updated to Conditions Through 2016
By Thomas M. Marston and Nora C. Nelson
Introduction Sand Hollow Reservoir (fig. 1) in Washington County,
Utah, was completed in March 2002 and is operated primarily for managed aquifer recharge (MAR) by the Washington County Water Conservancy District (WCWCD). The reservoir is an off-channel facility that receives water diverted from the Virgin River near the town of Virgin, Utah. Sand Hollow has been the subject of interdisciplinary, cooperative investigations of groundwater hydrology and geochemistry since 1999. Previous Sand Hollow reports document pre-reservoir vadose-zone and groundwater conditions prior to March 2002 (Heilweil and Solomon, 2004; Heilweil and others, 2006; Heilweil and others, 2007; Heilweil and McKinney, 2007; Heilweil, Solomon, and Ortiz, 2009b), pond and trench infiltration studies adjacent to the reservoir (Heilweil and others, 2004; Heilweil and Watt, 2011), and post-reservoir groundwater conditions, water budgets, and estimates of groundwater recharge from the reservoir from March 2002 through December 2014 (Heilweil and others, 2005; Heilweil and Susong, 2007; Heilweil, Ortiz, and Susong, 2009; Heilweil and Marston, 2011; Marston and Heilweil, 2013; Marston and Heilweil, 2016). These reports also contain monitoring-well and production-well completion information, as well as historical water-quality and precipitation data.
The objectives of this report are to present and interpret (1) groundwater levels, reservoir altitude, well withdrawals, drain discharge, meteorological data, reservoir water temperature, and inflows/outflows from March 2002 through December 2016 for estimating monthly amounts of MAR from Sand Hollow Reservoir to the Navajo Sandstone, and (2) groundwater and surface-water chemical data collected prior to the construction of the reservoir through April 2016 for evaluating groundwater flow paths and travel times of this MAR. This study is a cooperative effort by the WCWCD and the U.S. Geological Survey (USGS). Funding for this work was provided by both the USGS and the WCWCD.
Abstract Sand Hollow Reservoir in Washington County, Utah,
was completed in March 2002 and is operated primarily for managed aquifer recharge by the Washington County Water Conservancy District. From 2002 through 2016, surface-water diversions of about 256,000 acre-feet (acre-ft) to Sand Hollow Reservoir have allowed the reservoir to remain nearly full since 2006. Groundwater levels in monitoring wells near the reservoir rose through 2006 but have fluctuated more recently because of variations in reservoir stage and nearby pumping from production wells. Between 2004 and 2016, about 37,000 acre-ft of groundwater was withdrawn by these wells for municipal supply. In addition, about 37,000 acre-ft of shallow seepage was captured by French drains adjacent to the North and West Dams and used for municipal supply, irrigation, or returned to the reservoir. From 2002 through 2016, about 141,000 acre-ft of water seeped beneath the reservoir to recharge the underlying Navajo Sandstone aquifer, which includes about 14,200 acre-ft of recharge during the 2015–16 time period since the last report published in 2016.
Water quality continued to be monitored at various wells in Sand Hollow during 2015–16 to evaluate the timing and location of reservoir recharge as it moved through the aquifer. Changing geochemical conditions at monitoring wells WD 4 and WD 12 indicate rising groundwater levels and mobilization of vadose-zone salts, which could be a precursor to the arrival of reservoir recharge.

2 Assessment of Managed Aquifer Recharge at Sand Hollow Reservoir, Washington County, Utah
Hurricane Fault
Bar and ball on downthrow
n side
Virgin River
Virgin RiverSand
HollowReservoir
QuailCreek
Reservoir
15
9
15
Base from U.S. Geological Survey digital data, 1:100,000, 1980Universal Transverse Mercator projection, Zone 12
R. 14 W.
0 2 4 MILES
4 KILOMETERS20
R. 13 W.
T. 42 S.
T. 43 S.
Sand Hollow
Boundaryof study area
Hurricane
Treatment Plant
T. 41 S.
Virgin Riverdiversion toSand HollowReservoirapproximately3 miles east
La Verkin
113°15'113°22' 30''
37°07'30"
37°15'
St Georgeapproximately10 milessouthwest
SandHollowResort
Salt LakeCitySalt LakeCity
Utah
Location ofmap area
Figure 1. Location of the Sand Hollow Reservoir study area, Washington County, Utah.

Assessment of Managed Aquifer Recharge at Sand Hollow Reservoir 3
Assessment of Managed Aquifer Recharge at Sand Hollow Reservoir
Many different types of data have been collected to investigate recharge processes, quantify recharge from Sand Hollow Reservoir, and to evaluate hydraulic and geochemical changes in the underlying Navajo Sandstone aquifer (Navajo aquifer). These data include production-well withdrawals near the reservoir, amounts of pumpage from drains capturing shallow groundwater discharge adjacent to the reservoir, reservoir and monitoring-well water levels, inflows and outflows through the pipeline connecting Sand Hollow Reservoir with the Virgin River and Quail Creek Reservoir and treatment plant, meteorological parameters, and reservoir water temperatures (fig. 1). Water chemistry of groundwater and Sand Hollow Reservoir water was evaluated through field water-quality parameters (water temperature, specific conductance, pH, dissolved oxygen (DO), and total dissolved-gas (TDG) pressure), and analysis of dissolved constituents including major ions and trace elements, dissolved organic carbon (DOC), tritium (3H), and industrial dissolved gases.
Data Collection Methods and Results
Data collection methods are described in detail in Heilweil and others (2005) and briefly summarized in the following sections.
Production-Well Withdrawals The WCWCD has 13 production wells completed in the
Navajo Sandstone that are available to capture both pre-existing groundwater (natural recharge) in Sand Hollow and recharge from Sand Hollow Reservoir (fig. 2). The WCWCD and other water users have withdrawn groundwater from natural recharge in Sand Hollow for many years. The WCWCD groundwater withdrawals are recorded monthly from inline magnetic flow meters installed at each well. Since August 2004, monthly withdrawals by the WCWCD have generally exceeded 150 acre-feet (acre-ft), except for several months during the winters of 2004–05, 2005–06, 2008–09, and 2010 (fig. 3). The majority of this pumping was from wells 8 and 9 through late 2012, both located adjacent to the North Dam. Starting in early 2013, some of the pumping has been shifted to wells 19, 21, and 23. From 2004 through 2006, there were minimal withdrawals from these wells during the winter. Since 2006, withdrawals have been more constant year-round. Monthly withdrawals from production wells averaged about 260 acre-ft from March 2006 through December 2016. Smaller amounts have been sporadically withdrawn from wells 1, 2, and 17. Approximately 37,000 acre-ft were pumped from the WCWCD production wells from January 2004 through December 2016. Through 2016, withdrawals by the WCWCD at Sand Hollow have been permitted by the Utah Division of Water Rights as natural recharge in Sand Hollow. These withdrawals are governed by different water rights than water recharged from Sand Hollow Reservoir; withdrawal rights for this artificial recharge have not yet been exercised.

4 Assessment of Managed Aquifer Recharge at Sand Hollow Reservoir, Washington County, Utah
0 0.5 1 1.5 MILES
0 0.5 1 1.5 KILOMETERS
Base from NAIP 1-meter aerial photography, 2016Universal Transverse Mercator projection, Zone 12North American Datum of 1983
113°21'15"113°22'30"113°23'45"
37°8'45"
37°7'30"
37°6'15"
WCWCD pumpstation
Inflow/outflow pipeline
SandMountain
North Dam drain
North Dam 3A
WD 17WD 18
WD 19WD 20WD RJ
WD 1
WD 2
WD 4
WD 5
WD 9
WD 12
WD 13
WD 14
WD 15
WD 3
WD 6
WD 7
WD 8
WD 10
WD 11
WD 16
Well 2
Well 1
Well 3Well 4
WCWCDweather
station
NRCSSCANstation
Well 8Well 9
Well 17
Well 19
Well 21
Well 22
Well 23
SH1-18SH1-18
Boat Ramp
North Dam
West Dam
Haul Road
SandHollow
Reservoir
Washington County Water Conservancy District (WCWCD)Natural Resources Conservation Service (NRCS)Soil Climate Analysis Network (SCAN)
Well 20
Well 18
WD 21
WD 22
Wes
t Dam
Spr
ing
drai
n
Wes
t Dam
dra
in
WD 7EXPLANATION
Well 17SH1-18SH1-18
Monitoring well—White dot indicates nested wells. Number indicates well identifier
Production well—Number indicates well identifierSurface-water site—Number indicates site identifier
Weather stationDrains (approximate location)
North Dam drainWest Dam drainWest Dam Spring drain
Figure 2. Location of monitoring and production wells, weather stations, drains, and surface-water sampling sites in and near Sand Hollow Reservoir, Washington County, Utah.
Assessment of Managed Aquifer Recharge at Sand Hollow Reservoir 5
Jan-
04
Jan-
05
Jan-
06
Jan-
07
Jan-
08
Jan-
09
Jan-
10
Jan-
11
Jan-
13
Jan-
14
Jan-
15
Jan-
16
Jan-
12
Well 8 and Well 9All well withdrawals
0
50
100
150
200
250
300
350
400
450
500To
tal m
onth
ly p
umpi
ng, i
n ac
re-f
eet
Figure 3. Washington County Water Conservancy District production-well withdrawals in Sand Hollow, Washington County, Utah, 2004–16.

6 Assessment of Managed Aquifer Recharge at Sand Hollow Reservoir, Washington County, Utah
Drain Discharge Because of the steep hydraulic gradients associated
with the hydraulic connection between the reservoir and the underlying Navajo aquifer, some land-surface areas downgradient of the North and West Dams became saturated following construction of the reservoir. In response, three French drains (North Dam drain, West Dam drain, and West Dam Spring drain) were constructed for capturing this shallow groundwater (fig. 2). Timing of excavation and spatial dimensions for the three drains are described in Heilweil and Marston (2011).
The water pumped from drains is measured with a Tigermag totalizing flow meter (Sparling Instruments, El Monte, California). Discharge from the North Dam drain has been pumped at a relatively consistent rate (about 50 acre-ft per month) since January 2008 (fig. 4); about 9,000 acre-ft
were pumped from the North Dam drain between 2003 and 2016. Initially, all of this water was returned to the reservoir, but since 2007, the majority of the water has been used by Sand Hollow Resort (fig. 1) to meet irrigation demands. About 2,300 acre-ft of water were pumped from the West Dam drain back into the reservoir from 2005 through 2016. Beginning in October 2006, pumping of discharge from the West Dam Spring drain was initiated and has largely replaced the need for pumping of the West Dam drain (fig. 1). From 2006 through 2016, about 26,000 acre-ft were pumped from the West Dam Spring drain for municipal use or returned back to Sand Hollow Reservoir. Although groundwater discharge to the West Dam Spring drain likely does not vary greatly, pumping from this drain has been intermittent. This intermittent pumping schedule results in high variability in the monthly reported discharge from the West Dam Spring drain (fig. 4).
0
100
200
300
400
500
600
2,990
3,010
3,000
3,020
3,040
3,030
3,050
3,060
3,070
Rese
rvoi
r alti
tude
, in
feet
Dra
in p
umpi
ng, i
n ac
re-f
eet
Reservoir altitudeWest Dam Spring drainNorth Dam drainWest Dam drain
Aug-
03
Feb-
04
Aug-
04
Feb-
05
Aug-
05
Feb-
06
Aug-
06
Feb-
07
Aug-
07
Feb-
08
Aug-
08
Feb-
09
Aug-
09
Feb-
10
Aug-
10
Feb-
11
Aug-
11
Feb-
12
Aug-
12
Feb-
13
Aug-
13
Feb-
14
Aug-
14
Aug-
15
Feb-
15
Aug-
16
Feb-
17
Feb-
16
Figure 4. Monthly reported discharge from the North and West Dam drains, and the West Dam Spring drain in relation to reservoir altitude at Sand Hollow Reservoir, Washington County, Utah, 2003–16.

Assessment of Managed Aquifer Recharge at Sand Hollow Reservoir 7
Groundwater-Level Data and Reservoir Altitude Groundwater levels measured in an extensive monitoring-
well network surrounding Sand Hollow Reservoir were used to document changes in the potentiometric surface associated with recharge from Sand Hollow Reservoir. The WCWCD measures water levels monthly in 21 monitoring wells completed in the Navajo Sandstone (fig. 2; the WD RJ monitoring well was removed in 2013). These wells were constructed with either 1- or 2-inch-diameter PVC casing, with perforations along the bottom 5- to 20-foot (ft) length of the casing (Heilweil and others, 2005). Three locations have nested pairs of water district (WD) monitoring wells: WD 15 and WD 16, WD 17 and WD 18, and WD 19 and WD 20. The vertical distances between well screens for the nested-pair wells are 243 ft, 79 ft, and 227 ft, respectively. Water levels were measured by the WCWCD using electric-tape water-level indicators. Annual independent check measurements were done by USGS personnel for quality assurance to ensure accuracy (repeatability) of the instruments.
Daily reservoir water-level altitude (stage) was recorded from August 2003 through December 2016 by using a pressure transducer installed by the WCWCD in the reservoir along the North Dam. Because of periods of transducer malfunction from 2005 through 2007, and from August 2011 to December 2011, daily reservoir stage was interpolated on the basis of monthly measurements recorded at the boat ramp by WCWCD and Sand Hollow State Park personnel, and then correlated with trends from the transducer data.
Recently measured (January 2014 through December 2016) and previously reported (Heilweil and others, 2005; Heilweil and Susong, 2007; Heilweil, Ortiz, and Susong, 2009; Heilweil and Marston, 2011; Marston and Heilweil, 2013; Marston and Heilweil, 2016) groundwater levels and reservoir water-level altitudes are shown on figure 5. The reservoir stage rose from about 2,980 ft at the beginning of March 2002 to a maximum of about 3,060 ft in May 2006, when the reservoir was first filled to capacity. The reservoir altitude receded to about 3,040 ft in December 2007 as a result of reduced inflows and evaporative losses, and then fluctuated
Jan-
95
Jan-
96
Jan-
97
Jan-
98
Jan-
99
Jan-
00
Jan-
01
Jan-
02
Jan-
03
Jan-
04
Jan-
05
Jan-
06
Jan-
07
Jan-
08
Jan-
09
Jan-
12
Jan-
11
Jan-
10
Jan-
15
Jan-
14
Jan-
17
Jan-
16
Jan-
13
2,940
2,960
2,980
3,000
3,020
3,040
3,060
3,080
2,880
2,860
2,900
2,920
Wat
er-l
evel
alti
tude
, in
feet
abo
ve s
ea le
vel
WD 1WD 3WD 5WD 6WD 8WD 10WD 12WD 14WD 16WD 18WD 20
WD 2WD 4WD RJWD 7WD 9WD 11WD 13WD 15WD 17WD 19Reservoir altitude
Figure 5. Water-level altitude in monitoring wells in relation to Sand Hollow Reservoir altitude, Sand Hollow, Washington County, Utah, 1995–2016.
8 Assessment of Managed Aquifer Recharge at Sand Hollow Reservoir, Washington County, Utah
between about 3,040 and 3,060 ft from 2008 through 2011. From 2012 through 2014, the reservoir altitude dropped to a fluctuating level between about 3,030 and 3,050 ft. From 2014 to 2016, the reservoir altitude rose again to a fluctuating level between about 3,040 and 3,055 ft.
On the basis of water-level measurements in the 20 monitoring wells, altitude of the water table (or potentiometric surface) near Sand Hollow Reservoir during December 2016 ranged from 2,868 to 3,044 ft (fig. 6). The reservoir altitude during this same period was about 3,050 ft. The lines on figure 6 represent estimated potentiometric contours in the aquifer, which indicate lines of equal groundwater-level altitude, and the arrows indicate generalized directions of horizontal groundwater movement away from the reservoir. Horizontal hydraulic gradients, calculated by dividing the difference in water-level altitude between two points by the distance separating these locations, indicate the potential horizontal direction of groundwater movement. The steepest horizontal hydraulic gradients are beneath the North and West Dams and generally decline with increasing distance from the reservoir. The steep hydraulic gradients beneath the dams are the combined result of low-conductivity materials at the core of the dams and pumping in wells and drains at the base of both dams. For example, the horizontal hydraulic gradient between Sand Hollow Reservoir (reservoir altitude of 3,050 ft) and WD 1 (groundwater altitude of 2,972 ft) in 2016 was 0.136 foot per foot (ft/ft), whereas the gradient between WD 6 (groundwater altitude of 2,960 ft) and WD 19 (2,898 ft) was 0.015 ft/ft. In 2016, due to MAR, the resulting regional hydraulic gradient between WD 9 (groundwater altitude of 3,042 ft) and WD 17 (2,920 ft) was 0.019 ft/ft.
Pumping rates increased at wells 19 and 23 starting in early 2013. Increased withdrawals have induced a drawdown cone around these production wells north of the reservoir; the drawdowns are apparent in nearby monitoring wells WD 4, WD 19, and WD 20 (fig. 5). Well WD 19 went dry in March 2016 as a result of the local water table falling below the depth of the screened interval.
Surface-Water Inflow To and Outflow From Sand Hollow Reservoir
Surface water is pumped into and flows out of Sand Hollow Reservoir through a 60-inch-diameter pipeline that enters through an inlet structure at the North Dam (fig. 2). This pipeline is part of a network of pipelines that connect the Virgin River, Sand Hollow Reservoir, Quail Creek Reservoir, and the Quail Creek Reservoir Water Treatment Facility. The WCWCD has the capability to move water within this
network of pipelines by using gravity-induced flow and inline pumping. Sand Hollow Reservoir is currently managed to maximize groundwater recharge, and little water has been removed from the reservoir. Monthly surface-water inflow to and outflow from Sand Hollow Reservoir is shown in table 1. The “Monthly pump station inflow or outflow” column in this table is the amount of Sand Hollow Reservoir water coming in from the Virgin River or going out to Quail Creek Reservoir, the Quail Creek Water Treatment Plant, or other facilities (fig. 1). These data were collected at the WCWCD pump station about 1 mile north of the North Dam. Five pumps, each with Sparling Tigermag totalizing flow meters, are linked to a computer system that combines and records total daily discharge in gallons. The flow meters have electronic modules on which calibration diagnostics are done monthly by the WCWCD. Each module is removed annually for factory recalibration.
The “Monthly drain and spring return flow to reservoir” column in table 1 is the portion of discharge to the three drains that is pumped back into Sand Hollow Reservoir. The “Monthly outflow to Sand Hollow Resort” column is the amount of water required by the resort that cannot be met by discharge to the North Dam drain and is fulfilled by outflow of stored water from Sand Hollow Reservoir. Therefore, the “Monthly total inflow or outflow to/from reservoir” column is a sum of the pump station inflow/outflow, the drain and spring return flow, and the outflow to Sand Hollow Resort (table 1).
The “Monthly pump station inflow or outflow” column is unchanged from Heilweil and Marston (2011) and is comparable to the “Total surface-water inflow or outflow” column in table 7 of Heilweil and others (2005) from March 2002 to August 2004; the “Monthly surface-water inflow or outflow” column in table 2 of Heilweil and Susong (2007) from September 2004 to August 2006; and the “Monthly net surface-water inflow/outflow” column in table 2 of Heilweil, Ortiz, and Susong (2009) from September 2006 to December 2007.
As in Heilweil and Marston (2011), both “Monthly drain and spring return flow to reservoir” and “Monthly outflow to Sand Hollow Resort” are included in calculations of total inflow to and outflow from the reservoir. These amounts are added to the “Monthly pump station inflow or outflow” column and summed in the “Monthly total inflow or outflow to/from reservoir” column. Monthly total inflow/outflow amounts from March 2002 through December 2016 ranged from about –5,200 acre-ft to 6,600 acre-ft. Approximately 256,000 acre-ft of total net inflow were pumped into Sand Hollow Reservoir from the Virgin River from 2002 through 2016.

Assessment of Managed Aquifer Recharge at Sand Hollow Reservoir 9
2900
2870
2880 28
90
2910
29202930
2940
29502960
2970
2920
2980
3010
2990 3030
3000
3010 30
20
3040
30303040
3020
2919291929202920
2868.12868.1
29972997
28992899
2959295929612961
29722972
29982998
30223022
30423042
30443044
30313031
29882988
3007300730033003
30343034
30423042
30253025
1 MILE
1 KILOMETER
0 0.5
0.50
Base from NAIP 1-meter aerial photography, 2016Universal Transverse Mercator projection, Zone 12North American Datum of 1983
113°22'113°24'
37°08'
37°06'
SandHollow
ReservoirReservoir altitude 3,050
EXPLANATIONMonitoring well—Shows calculated
water-level altitude, in feet, December 2016. White dot indicates nested wells
Potentiometric contour—Shows altitude at which water level would have stood in tightly cased wells, December 2016. Contour interval 10 feet
Arrow shows direction of groundwater movement
2870
2998
Figure 6. Potentiometric surface of the Navajo aquifer in December 2016, at Sand Hollow Reservoir, Washington County, Utah.
10 Assessment of Managed Aquifer Recharge at Sand Hollow Reservoir, Washington County, Utah
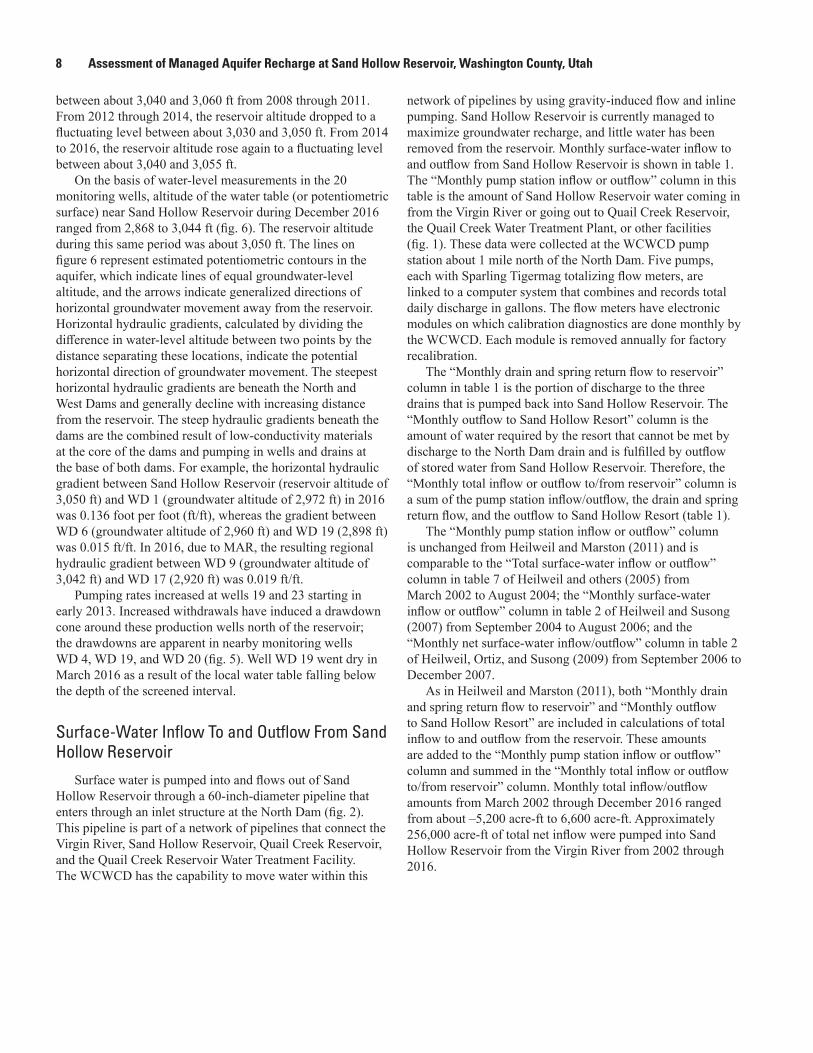
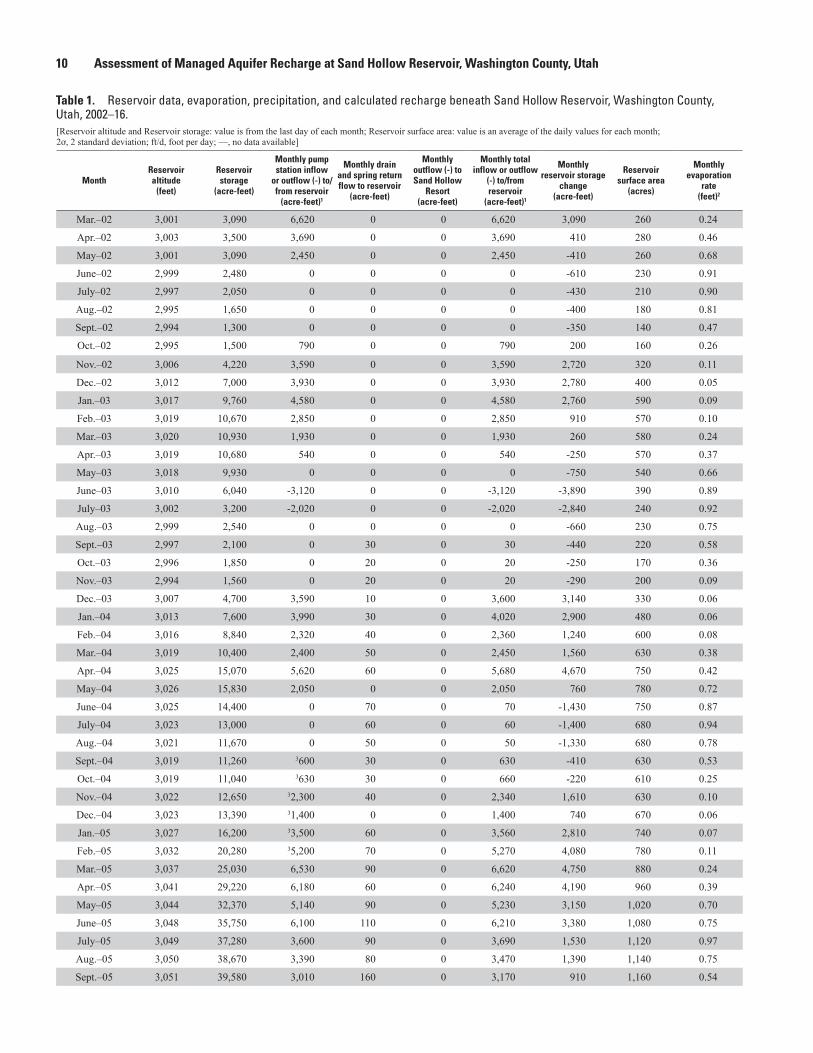
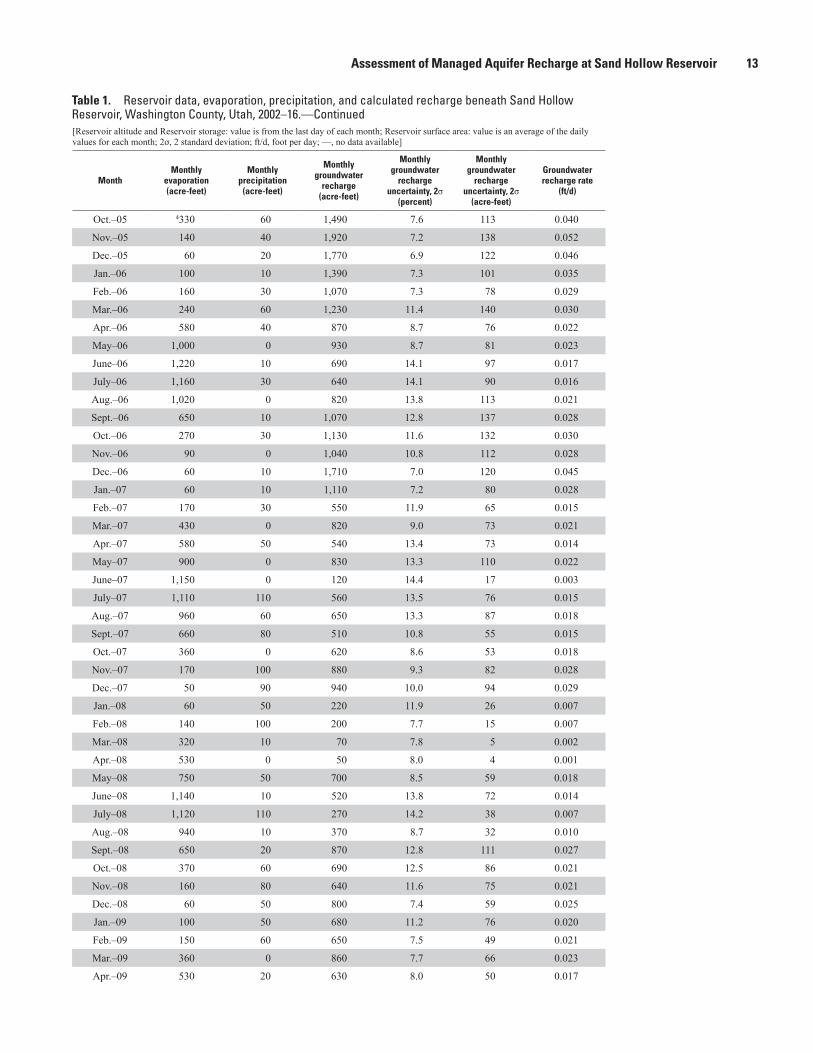
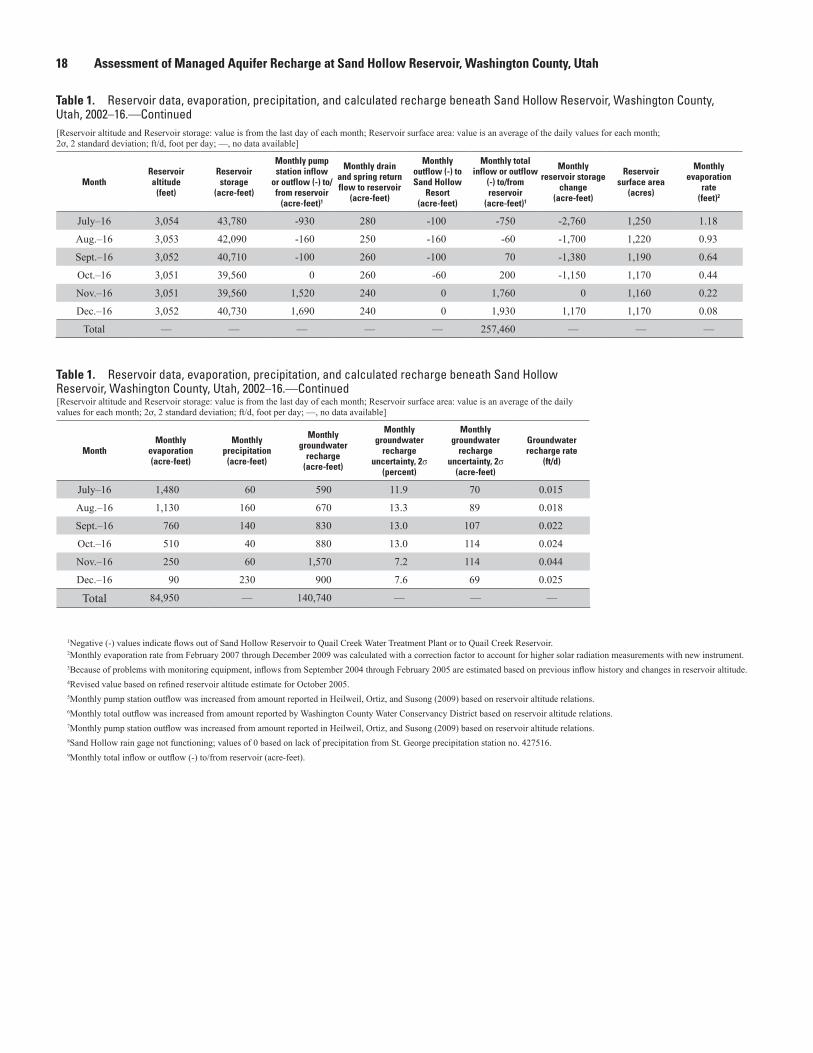
Table 1. Reservoir data, evaporation, precipitation, and calculated recharge beneath Sand Hollow Reservoir, Washington County, Utah, 2002–16.[Reservoir altitude and Reservoir storage: value is from the last day of each month; Reservoir surface area: value is an average of the daily values for each month; 2ơ, 2 standard deviation; ft/d, foot per day; —, no data available]
MonthReservoir altitude
(feet)
Reservoir storage
(acre-feet)
Monthly pump station inflow
or outflow (-) to/from reservoir
(acre-feet)1
Monthly drain and spring return flow to reservoir
(acre-feet)
Monthly outflow (-) to Sand Hollow
Resort (acre-feet)
Monthly total inflow or outflow
(-) to/from reservoir
(acre-feet)1
Monthly reservoir storage
change (acre-feet)
Reservoir surface area
(acres)
Monthly evaporation
rate (feet)2
Mar.–02 3,001 3,090 6,620 0 0 6,620 3,090 260 0.24
Apr.–02 3,003 3,500 3,690 0 0 3,690 410 280 0.46
May–02 3,001 3,090 2,450 0 0 2,450 -410 260 0.68
June–02 2,999 2,480 0 0 0 0 -610 230 0.91
July–02 2,997 2,050 0 0 0 0 -430 210 0.90
Aug.–02 2,995 1,650 0 0 0 0 -400 180 0.81
Sept.–02 2,994 1,300 0 0 0 0 -350 140 0.47
Oct.–02 2,995 1,500 790 0 0 790 200 160 0.26
Nov.–02 3,006 4,220 3,590 0 0 3,590 2,720 320 0.11
Dec.–02 3,012 7,000 3,930 0 0 3,930 2,780 400 0.05
Jan.–03 3,017 9,760 4,580 0 0 4,580 2,760 590 0.09
Feb.–03 3,019 10,670 2,850 0 0 2,850 910 570 0.10
Mar.–03 3,020 10,930 1,930 0 0 1,930 260 580 0.24
Apr.–03 3,019 10,680 540 0 0 540 -250 570 0.37
May–03 3,018 9,930 0 0 0 0 -750 540 0.66
June–03 3,010 6,040 -3,120 0 0 -3,120 -3,890 390 0.89
July–03 3,002 3,200 -2,020 0 0 -2,020 -2,840 240 0.92
Aug.–03 2,999 2,540 0 0 0 0 -660 230 0.75
Sept.–03 2,997 2,100 0 30 0 30 -440 220 0.58
Oct.–03 2,996 1,850 0 20 0 20 -250 170 0.36
Nov.–03 2,994 1,560 0 20 0 20 -290 200 0.09
Dec.–03 3,007 4,700 3,590 10 0 3,600 3,140 330 0.06
Jan.–04 3,013 7,600 3,990 30 0 4,020 2,900 480 0.06
Feb.–04 3,016 8,840 2,320 40 0 2,360 1,240 600 0.08
Mar.–04 3,019 10,400 2,400 50 0 2,450 1,560 630 0.38
Apr.–04 3,025 15,070 5,620 60 0 5,680 4,670 750 0.42
May–04 3,026 15,830 2,050 0 0 2,050 760 780 0.72
June–04 3,025 14,400 0 70 0 70 -1,430 750 0.87
July–04 3,023 13,000 0 60 0 60 -1,400 680 0.94
Aug.–04 3,021 11,670 0 50 0 50 -1,330 680 0.78
Sept.–04 3,019 11,260 3600 30 0 630 -410 630 0.53
Oct.–04 3,019 11,040 3630 30 0 660 -220 610 0.25
Nov.–04 3,022 12,650 32,300 40 0 2,340 1,610 630 0.10
Dec.–04 3,023 13,390 31,400 0 0 1,400 740 670 0.06
Jan.–05 3,027 16,200 33,500 60 0 3,560 2,810 740 0.07
Feb.–05 3,032 20,280 35,200 70 0 5,270 4,080 780 0.11
Mar.–05 3,037 25,030 6,530 90 0 6,620 4,750 880 0.24
Apr.–05 3,041 29,220 6,180 60 0 6,240 4,190 960 0.39
May–05 3,044 32,370 5,140 90 0 5,230 3,150 1,020 0.70
June–05 3,048 35,750 6,100 110 0 6,210 3,380 1,080 0.75
July–05 3,049 37,280 3,600 90 0 3,690 1,530 1,120 0.97
Aug.–05 3,050 38,670 3,390 80 0 3,470 1,390 1,140 0.75
Sept.–05 3,051 39,580 3,010 160 0 3,170 910 1,160 0.54

Assessment of Managed Aquifer Recharge at Sand Hollow Reservoir 11
Table 1. Reservoir data, evaporation, precipitation, and calculated recharge beneath Sand Hollow Reservoir, Washington County, Utah, 2002–16.—Continued [Reservoir altitude and Reservoir storage: value is from the last day of each month; Reservoir surface area: value is an average of the daily values for each month; 2ơ, 2 standard deviation; ft/d, foot per day; —, no data available]
MonthMonthly
evaporation (acre-feet)
Monthly precipitation
(acre-feet)
Monthly groundwater
recharge(acre-feet)
Monthly groundwater
recharge uncertainty, 2σ
(percent)
Monthly groundwater
recharge uncertainty, 2σ
(acre-feet)
Groundwater recharge rate
(ft/d)
Mar.–02 60 — 3,470 6.7 232 0.430
Apr.–02 130 — 3,150 5.9 187 0.383
May–02 180 — 2,680 6.6 176 0.330
June–02 210 — 400 12.6 50 0.058
July–02 190 — 240 13.1 31 0.040
Aug.–02 150 — 250 12.7 32 0.044
Sept.–02 70 — 280 11.7 33 0.070
Oct.–02 40 — 550 6.6 36 0.110
Nov.–02 30 — 840 7.2 61 0.090
Dec.–02 20 — 1,130 7.1 80 0.090
Jan.–03 50 — 1,770 7.0 123 0.097
Feb.–03 60 — 1,880 6.4 121 0.118
Mar.–03 140 — 1,530 6.5 99 0.085
Apr.–03 210 — 580 9.4 55 0.034
May–03 360 — 390 13.2 52 0.023
June–03 350 — 420 8.4 35 0.036
July–03 220 — 600 8.4 51 0.081
Aug.–03 170 — 490 12.0 59 0.069
Sept.–03 130 — 340 12.3 42 0.052
Oct.–03 60 — 210 11.9 25 0.040
Nov.–03 20 — 290 10.6 31 0.048
Dec.–03 20 — 440 7.4 32 0.043
Jan.–04 30 — 1,090 7.2 78 0.073
Feb.–04 40 — 1,080 6.9 74 0.064
Mar.–04 240 — 650 7.7 50 0.033
Apr.–04 310 — 700 7.6 53 0.031
May–04 560 — 730 8.6 63 0.030
June–04 650 — 850 13.1 112 0.038
July–04 640 — 820 13.1 108 0.039
Aug.–04 530 — 850 12.8 109 0.040
Sept.–04 330 — 710 10.2 73 0.038
Oct.–04 150 — 730 8.4 61 0.039
Nov.–04 70 — 660 7.3 48 0.035
Dec.–04 40 — 620 7.0 43 0.030
Jan.–05 50 — 700 7.3 51 0.031
Feb.–05 80 130 1,240 7.3 91 0.057
Mar.–05 210 100 1,760 7.4 130 0.065
Apr.–05 370 130 1,810 7.5 136 0.063
May–05 710 40 1,410 7.9 112 0.045
June–05 810 20 2,040 7.8 160 0.063
July–05 1,080 10 1,090 8.8 96 0.031
Aug.–05 850 40 1,270 8.5 108 0.036
Sept.–05 630 20 1,650 8.1 133 0.047

12 Assessment of Managed Aquifer Recharge at Sand Hollow Reservoir, Washington County, Utah
Table 1. Reservoir data, evaporation, precipitation, and calculated recharge beneath Sand Hollow Reservoir, Washington County, Utah, 2002–16.—Continued [Reservoir altitude and Reservoir storage: value is from the last day of each month; Reservoir surface area: value is an average of the daily values for each month; 2ơ, 2 standard deviation; ft/d, foot per day; —, no data available]
MonthReservoir altitude
(feet)
Reservoir storage
(acre-feet)
Monthly pump station inflow
or outflow (-) to/from reservoir
(acre-feet)1
Monthly drain and spring return flow to reservoir
(acre-feet)
Monthly outflow (-) to Sand Hollow
Resort (acre-feet)
Monthly total inflow or outflow
(-) to/from reservoir
(acre-feet)1
Monthly reservoir storage
change (acre-feet)
Reservoir surface area
(acres)
Monthly evaporation
rate (feet)2
Oct.–05 43,052 440,960 2,960 180 0 3,140 41,380 41,190 0.28
Nov.–05 3,055 44,310 5,160 210 0 5,370 43,350 1,230 0.11
Dec.–05 3,056 46,120 3,380 240 0 3,620 1,810 1,250 0.05
Jan.–06 3,059 49,590 4,660 290 0 4,950 3,470 1,290 0.08
Feb.–06 3,059 49,840 1,200 250 0 1,450 250 1,320 0.12
Mar.–06 3,058 48,700 60 210 0 270 -1,140 1,310 0.18
Apr.–06 3,059 49,450 2,060 100 0 2,160 750 1,300 0.45
May–06 3,060 51,280 3,650 110 0 3,760 1,830 1,320 0.76
June–06 3,059 49,520 10 130 0 140 -1,760 1,330 0.92
July–06 3,058 47,920 30 140 0 170 -1,600 1,310 0.88
Aug.–06 3,056 46,220 0 140 0 140 -1,700 1,280 0.80
Sept.–06 3,055 44,610 10 90 0 100 -1,610 1,260 0.52
Oct.–06 3,054 43,390 30 120 0 150 -1,220 1,230 0.22
Nov.–06 3,053 42,360 0 100 0 100 -1,030 1,220 0.07
Dec.–06 3,055 45,100 4,430 70 0 4,500 2,740 1,230 0.04
Jan.–07 3,058 48,230 4,190 100 0 4,290 3,130 1,270 0.05
Feb.–07 3,057 47,630 30 60 0 90 -600 1,290 0.13
Mar.–07 3,057 47,660 1,210 70 0 1,280 30 1,290 0.33
Apr.–07 3,057 46,720 50 80 0 130 -940 1,280 0.45
May–07 3,055 44,880 0 0 -110 -110 -1,840 1,220 0.74
June–07 3,054 43,390 0 0 -220 -220 -1,490 1,240 0.93
July–07 3,053 41,740 120 0 -200 -80 -1,650 1,210 0.92
Aug.–07 3,051 40,040 60 0 -210 -150 -1,700 1,180 0.81
Sept.–07 3,050 38,040 5-750 0 -210 6-910 -2,000 1,160 0.57
Oct.–07 3,046 34,280 5-2,660 0 -120 6-2,780 -3,760 1,120 0.32
Nov.–07 3,045 32,480 5-750 0 -100 6-850 -1,800 1,060 0.16
Dec.–07 3,044 31,680 90 10 0 100 -800 1,040 0.05
Jan.–08 3,044 31,470 0 20 0 20 -210 1,030 0.06
Feb.–08 3,046 34,490 3,240 20 0 3,260 3,020 1,050 0.13
Mar.–08 3,050 38,460 4,420 0 -70 4,350 3,970 1,110 0.29
Apr.–08 3,053 42,670 4,950 0 -160 4,790 4,210 1,180 0.45
May–08 3,055 44,410 3,260 0 -120 3,140 1,740 1,230 0.61
June–08 3,053 42,540 0 0 -220 -220 -1,870 1,230 0.93
July–08 3,052 41,080 0 0 -180 -180 -1,460 1,180 0.95
Aug.–08 3,047 34,600 7-5,000 0 -180 -5,180 -6,480 1,140 0.82
Sept.–08 3,045 32,960 0 0 -140 -140 -1,640 1,070 0.61
Oct.–08 3,044 31,890 0 0 -70 -70 -1,070 1,050 0.36
Nov.–08 3,043 31,160 0 0 -10 -10 -730 1,040 0.16
Dec.–08 3,046 34,490 4,100 40 0 4,140 3,330 1,050 0.06
Jan.–09 3,046 33,830 0 70 0 70 -660 1,080 0.09
Feb.–09 3,049 37,770 4,630 50 0 4,680 3,940 1,110 0.14
Mar.–09 3,052 41,320 4,800 0 -30 4,770 3,550 1,190 0.30
Apr.–09 3,055 44,030 3,920 0 -70 3,850 2,710 1,220 0.44
Assessment of Managed Aquifer Recharge at Sand Hollow Reservoir 13
Table 1. Reservoir data, evaporation, precipitation, and calculated recharge beneath Sand Hollow Reservoir, Washington County, Utah, 2002–16.—Continued [Reservoir altitude and Reservoir storage: value is from the last day of each month; Reservoir surface area: value is an average of the daily values for each month; 2ơ, 2 standard deviation; ft/d, foot per day; —, no data available]
MonthMonthly
evaporation (acre-feet)
Monthly precipitation
(acre-feet)
Monthly groundwater
recharge(acre-feet)
Monthly groundwater
recharge uncertainty, 2σ
(percent)
Monthly groundwater
recharge uncertainty, 2σ
(acre-feet)
Groundwater recharge rate
(ft/d)
Oct.–05 4330 60 1,490 7.6 113 0.040
Nov.–05 140 40 1,920 7.2 138 0.052
Dec.–05 60 20 1,770 6.9 122 0.046
Jan.–06 100 10 1,390 7.3 101 0.035
Feb.–06 160 30 1,070 7.3 78 0.029
Mar.–06 240 60 1,230 11.4 140 0.030
Apr.–06 580 40 870 8.7 76 0.022
May–06 1,000 0 930 8.7 81 0.023
June–06 1,220 10 690 14.1 97 0.017
July–06 1,160 30 640 14.1 90 0.016
Aug.–06 1,020 0 820 13.8 113 0.021
Sept.–06 650 10 1,070 12.8 137 0.028
Oct.–06 270 30 1,130 11.6 132 0.030
Nov.–06 90 0 1,040 10.8 112 0.028
Dec.–06 60 10 1,710 7.0 120 0.045
Jan.–07 60 10 1,110 7.2 80 0.028
Feb.–07 170 30 550 11.9 65 0.015
Mar.–07 430 0 820 9.0 73 0.021
Apr.–07 580 50 540 13.4 73 0.014
May–07 900 0 830 13.3 110 0.022
June–07 1,150 0 120 14.4 17 0.003
July–07 1,110 110 560 13.5 76 0.015
Aug.–07 960 60 650 13.3 87 0.018
Sept.–07 660 80 510 10.8 55 0.015
Oct.–07 360 0 620 8.6 53 0.018
Nov.–07 170 100 880 9.3 82 0.028
Dec.–07 50 90 940 10.0 94 0.029
Jan.–08 60 50 220 11.9 26 0.007
Feb.–08 140 100 200 7.7 15 0.007
Mar.–08 320 10 70 7.8 5 0.002
Apr.–08 530 0 50 8.0 4 0.001
May–08 750 50 700 8.5 59 0.018
June–08 1,140 10 520 13.8 72 0.014
July–08 1,120 110 270 14.2 38 0.007
Aug.–08 940 10 370 8.7 32 0.010
Sept.–08 650 20 870 12.8 111 0.027
Oct.–08 370 60 690 12.5 86 0.021
Nov.–08 160 80 640 11.6 75 0.021
Dec.–08 60 50 800 7.4 59 0.025
Jan.–09 100 50 680 11.2 76 0.020
Feb.–09 150 60 650 7.5 49 0.021
Mar.–09 360 0 860 7.7 66 0.023
Apr.–09 530 20 630 8.0 50 0.017

14 Assessment of Managed Aquifer Recharge at Sand Hollow Reservoir, Washington County, Utah
Table 1. Reservoir data, evaporation, precipitation, and calculated recharge beneath Sand Hollow Reservoir, Washington County, Utah, 2002–16.—Continued [Reservoir altitude and Reservoir storage: value is from the last day of each month; Reservoir surface area: value is an average of the daily values for each month; 2ơ, 2 standard deviation; ft/d, foot per day; —, no data available]
MonthReservoir altitude
(feet)
Reservoir storage
(acre-feet)
Monthly pump station inflow
or outflow (-) to/from reservoir
(acre-feet)1
Monthly drain and spring return flow to reservoir
(acre-feet)
Monthly outflow (-) to Sand Hollow
Resort (acre-feet)
Monthly total inflow or outflow
(-) to/from reservoir
(acre-feet)1
Monthly reservoir storage
change (acre-feet)
Reservoir surface area
(acres)
Monthly evaporation
rate (feet)2
May–09 3,053 42,180 180 10 -170 20 -1,850 1,220 0.78
June–09 3,052 40,600 210 0 -130 80 -1,580 1,190 0.73
July–09 3,050 38,700 220 0 -170 50 -1,900 1,170 0.96
Aug.–09 3,049 36,960 210 0 -150 60 -1,740 1,140 0.80
Sept.–09 3,047 35,380 200 0 -150 50 -1,580 1,110 0.58
Oct.–09 3,046 33,940 200 10 -80 130 -1,440 1,090 0.30
Nov.–09 3,045 32,960 180 10 -20 170 -980 1,070 0.16
Dec.–09 3,044 32,320 200 40 0 240 -640 1,050 0.05
Jan.–10 3,044 31,890 0 50 0 50 -430 1,040 0.07
Feb.–10 3,044 31,470 0 40 0 40 -420 1,040 0.10
Mar.–10 3,047 35,490 5,100 90 -50 5,140 4,020 1,070 0.23
Apr.–10 3,050 38,930 5,280 70 -110 5,240 3,440 1,130 0.36
May–10 3,053 41,810 4,650 90 -160 4,580 2,880 1,180 0.56
June–10 3,054 43,660 3,890 80 -190 3,780 1,850 1,220 0.81
July–10 3,053 42,300 570 100 -240 430 -1,360 1,220 0.91
Aug.–10 3,051 40,240 0 80 -220 -140 -2,060 1,190 0.77
Sept.–10 3,050 38,350 0 80 -210 -130 -1,890 1,160 0.60
Oct.–10 3,049 37,310 0 100 -90 10 -1,040 1,140 0.29
Nov.–10 3,048 36,620 0 90 -40 50 -690 1,120 0.13
Dec.–10 3,051 40,240 4,290 90 -10 4,370 3,620 1,150 0.06
Jan.–11 3,054 43,960 5,650 60 -10 5,700 3,720 1,200 0.09
Feb.–11 3,057 47,750 4,540 40 -30 4,550 3,790 1,260 0.11
Mar.–11 3,059 50,270 3,780 20 -30 3,770 2,520 1,310 0.26
Apr.–11 3,058 49,110 0 10 -140 -130 -1,160 1,310 0.43
May–11 3,057 47,460 0 10 -150 -140 -1,650 1,290 0.59
June–11 3,056 45,680 0 80 -190 -110 -1,780 1,270 0.89
July–11 3,054 43,710 0 10 -200 -190 -1,970 1,240 0.89
Aug.–11 3,053 41,990 0 10 -190 -180 -1,720 1,220 0.93
Sept.–11 3,052 40,600 0 20 -150 -130 -1,390 1,190 0.61
Oct.–11 3,051 39,910 0 30 -70 -40 -690 1,170 0.35
Nov.–11 3,054 43,490 3,980 30 -30 3,980 3,580 1,200 0.15
Dec.–11 3,058 48,010 4,990 20 -10 5,000 4,520 1,260 0.07
Jan.–12 3,060 50,990 3,540 120 -20 3,650 2,980 1,320 0.10
Feb.–12 3,059 50,360 340 80 -20 400 -630 1,330 0.14
Mar.–12 3,059 50,070 1,010 110 -70 1,050 -300 1,320 0.29
Apr.–12 3,060 50,710 1,700 110 -110 1,700 640 1,330 0.49
May–12 3,058 48,740 0 110 -200 -90 -1,980 1,310 0.83
June–12 3,056 46,440 -330 100 -200 -430 -2,300 1,280 0.98
July–12 3,055 44,220 -750 120 -200 -830 -2,220 1,250 0.87
Aug.–12 3,053 41,920 -800 120 -190 -870 -2,310 1,220 0.81
Sept.–12 3,051 40,170 -310 130 -140 -320 -1,750 1,190 0.58
Oct.–12 3,049 37,280 -1,560 110 -100 -1,550 -2,880 1,150 0.38
Nov.–12 3,047 35,280 -1,190 60 -50 -1,180 -2,010 1,110 0.18

Assessment of Managed Aquifer Recharge at Sand Hollow Reservoir 15
Table 1. Reservoir data, evaporation, precipitation, and calculated recharge beneath Sand Hollow Reservoir, Washington County, Utah, 2002–16.—Continued [Reservoir altitude and Reservoir storage: value is from the last day of each month; Reservoir surface area: value is an average of the daily values for each month; 2ơ, 2 standard deviation; ft/d, foot per day; —, no data available]
MonthMonthly
evaporation (acre-feet)
Monthly precipitation
(acre-feet)
Monthly groundwater
recharge(acre-feet)
Monthly groundwater
recharge uncertainty, 2σ
(percent)
Monthly groundwater
recharge uncertainty, 2σ
(acre-feet)
Groundwater recharge rate
(ft/d)
May–09 950 0 920 12.9 119 0.024
June–09 870 10 800 12.9 103 0.022
July–09 1,120 10 840 13.1 110 0.023
Aug.–09 910 0 890 12.8 114 0.025
Sept.–09 650 0 980 12.3 120 0.029
Oct.–09 320 80 1,320 11.1 147 0.039
Nov.–09 170 80 1,050 10.6 111 0.033
Dec.–09 60 100 920 9.6 88 0.028
Jan.–10 80 150 550 11.2 62 0.017
Feb.–10 110 220 570 11.5 65 0.018
Mar.–10 250 190 1,060 7.6 80 0.032
Apr.–10 400 40 1,440 7.6 109 0.041
May–10 660 10 1,050 8.0 84 0.029
June–10 990 0 940 8.6 81 0.025
July–10 1,100 0 690 12.7 88 0.018
Aug.–10 920 60 1,060 13.0 138 0.029
Sept.–10 690 0 1,070 12.7 136 0.030
Oct.–10 320 280 1,010 12.0 121 0.029
Nov.–10 150 80 670 11.6 78 0.019
Dec.–10 70 410 1,090 7.5 82 0.031
Jan.–11 100 10 1,890 7.1 135 0.051
Feb.–11 140 170 790 7.5 60 0.020
Mar.–11 340 110 1,020 7.7 79 0.025
Apr.–11 560 90 560 13.1 73 0.014
May–11 760 50 800 13.1 105 0.020
June–11 1,130 10 550 13.9 76 0.014
July–11 1,110 10 680 13.6 92 0.018
Aug.–11 1,130 20 430 13.9 60 0.011
Sept.–11 720 50 590 13.3 79 0.016
Oct.–11 420 120 350 13.4 47 0.010
Nov.–11 180 40 260 7.7 20 0.007
Dec.–11 90 50 440 7.5 33 0.011
Jan.–12 130 60 590 7.6 45 0.014
Feb.–12 180 150 1,010 10.1 102 0.024
Mar.–12 380 40 1,000 9.3 93 0.024
Apr.–12 650 60 450 9.4 42 0.011
May–12 1,090 0 800 13.6 109 0.020
June–12 1,260 40 650 12.8 83 0.016
July–12 1,090 200 500 11.7 58 0.013
Aug.–12 990 130 580 11.4 66 0.015
Sept.–12 690 110 850 11.9 101 0.023
Oct.–12 440 60 950 9.3 89 0.027
Nov.–12 200 0 630 8.8 56 0.018

16 Assessment of Managed Aquifer Recharge at Sand Hollow Reservoir, Washington County, Utah
Table 1. Reservoir data, evaporation, precipitation, and calculated recharge beneath Sand Hollow Reservoir, Washington County, Utah, 2002–16.—Continued [Reservoir altitude and Reservoir storage: value is from the last day of each month; Reservoir surface area: value is an average of the daily values for each month; 2ơ, 2 standard deviation; ft/d, foot per day; —, no data available]
MonthReservoir altitude
(feet)
Reservoir storage
(acre-feet)
Monthly pump station inflow
or outflow (-) to/from reservoir
(acre-feet)1
Monthly drain and spring return flow to reservoir
(acre-feet)
Monthly outflow (-) to Sand Hollow
Resort (acre-feet)
Monthly total inflow or outflow
(-) to/from reservoir
(acre-feet)1
Monthly reservoir storage
change (acre-feet)
Reservoir surface area
(acres)
Monthly evaporation
rate (feet)2
Dec.–12 3,046 34,370 -310 60 -20 -260 -910 1,090 0.07
Jan.–13 3,049 37,020 2,860 280 -10 3,130 2,650 1,100 0.06
Feb.–13 3,051 40,080 3,190 130 -10 3,310 3,060 1,140 0.13
Mar.–13 3,053 41,650 2,070 70 -100 2,040 1,570 1,190 0.34
Apr.–13 3,051 40,260 0 60 -150 -90 -1,390 1,190 0.49
May–13 3,050 38,820 0 60 -150 -90 -1,440 1,160 0.82
June–13 3,048 36,320 -820 60 -190 -950 -2,490 1,140 1.17
July–13 3,044 32,070 -2,940 60 -180 -3,050 -4,250 1,080 1.02
Aug.–13 3,040 27,830 -2,560 50 -150 -2,660 -4,240 1,000 0.89
Sept.–13 3,038 26,280 -540 70 -110 -580 -1,560 950 0.57
Oct.–13 3,038 26,090 1,020 50 -90 980 -190 930 0.36
Nov.–13 3,042 30,120 4,360 40 -50 4,360 4,030 980 0.17
Dec.–13 3,044 31,410 1,910 60 -10 1,970 1,290 1,030 0.06
Jan.–14 3,047 34,870 4,350 60 -20 4,390 3,460 1,070 0.12
Feb.–14 3,049 37,570 3,100 60 -20 3,130 2,700 1,120 0.17
Mar.–14 3,049 37,630 1,070 100 -90 1,090 60 1,140 0.35
Apr.–14 3,048 36,600 0 280 -110 170 -1,030 1,130 0.53
May–14 3,047 35,430 0 280 -160 120 -1,160 1,110 0.79
June–14 3,046 33,660 -400 280 -180 -300 -1,780 1,090 1.12
July–14 3,042 29,820 -2,350 270 -190 -2,270 -3,830 1,040 1.05
Aug.–14 3,039 26,650 -2,230 240 -130 -2,120 -3,170 970 0.83
Sept.–14 3,035 23,400 -2,120 280 -120 -1,960 -3,260 910 0.70
Oct.–14 3,035 22,720 0 230 -90 140 -680 880 0.46
Nov.–14 3,034 22,130 0 210 -40 170 -580 870 0.19
Dec.–14 3,038 26,090 4,290 190 -10 4,470 3,950 900 0.10
Jan.–15 3,043 30,570 4,450 180 0 4,620 4,490 990 0.11
Feb.–15 3,046 33,880 4,160 190 0 4,360 3,310 1,050 0.22
Mar.–15 3,049 37,630 4,520 200 -20 4,700 3,740 1,110 0.41
Apr.–15 3,049 37,720 1,210 220 -70 1,360 90 1,140 0.56
May–15 3,048 36,700 0 210 -50 150 -1,020 1,130 0.62
June–15 3,047 35,340 -60 230 -140 20 -1,350 1,110 1.11
July–15 3,046 33,810 -240 230 -140 -150 -1,540 1,090 1.02
Aug.–15 3,044 32,260 -270 240 -130 -160 -1,550 1,060 0.91
Sept.–15 3,043 30,930 -260 210 -100 -160 -1,330 1,040 0.73
Oct.–15 3,042 29,960 -360 210 -60 -210 -970 1,020 0.42
Nov.–15 3,042 29,880 570 210 0 780 -70 1,000 0.17
Dec.–15 3,044 32,310 2,930 200 0 3,130 2,420 1,020 0.07
Jan.–16 3,048 36,480 4,460 180 0 4,640 4,170 1,090 0.09
Feb.–16 3,052 40,360 4,300 210 0 4,510 3,870 1,150 0.22
Mar.–16 3,055 44,200 5,050 230 -20 5,260 3,840 1,210 0.35
Apr.–16 3,054 43,530 240 230 -80 380 -660 1,230 0.49
May–16 3,058 48,290 5,400 260 -80 5,580 4,750 1,260 0.72
June–16 3,056 46,540 -350 270 -160 -250 -1,750 1,280 1.14
Assessment of Managed Aquifer Recharge at Sand Hollow Reservoir 17
Table 1. Reservoir data, evaporation, precipitation, and calculated recharge beneath Sand Hollow Reservoir, Washington County, Utah, 2002–16.—Continued [Reservoir altitude and Reservoir storage: value is from the last day of each month; Reservoir surface area: value is an average of the daily values for each month; 2ơ, 2 standard deviation; ft/d, foot per day; —, no data available]
MonthMonthly
evaporation (acre-feet)
Monthly precipitation
(acre-feet)
Monthly groundwater
recharge(acre-feet)
Monthly groundwater
recharge uncertainty, 2σ
(percent)
Monthly groundwater
recharge uncertainty, 2σ
(acre-feet)
Groundwater recharge rate
(ft/d)
Dec.–12 80 100 670 9.4 64 0.020
Jan.–13 70 90 500 7.6 38 0.015
Feb.–13 150 30 130 7.7 10 0.004
Mar.–13 400 40 110 8.5 9 0.003
Apr.–13 580 30 750 12.9 97 0.021
May–13 950 10 420 14.0 58 0.012
June–13 1,330 0 210 12.0 25 0.006
July–13 1,100 150 250 9.6 24 0.007
Aug.–13 890 80 760 9.5 73 0.025
Sept.–13 540 170 600 11.0 66 0.020
Oct.–13 340 20 860 8.9 77 0.030
Nov.–13 170 110 260 7.7 20 0.009
Dec.–13 60 50 660 7.3 48 0.021
Jan.–14 130 10 810 7.4 60 0.025
Feb.–14 190 120 350 7.8 28 0.010
Mar.–14 390 50 690 9.1 63 0.019
Apr.–14 600 50 650 13.6 89 0.019
May–14 880 110 520 14.1 73 0.015
June–14 1,210 0 260 13.0 34 0.008
July–14 1,100 10 480 9.9 47 0.015
Aug.–14 810 180 420 9.5 40 0.014
Sept.–14 640 140 800 9.3 75 0.029
Oct.–14 410 0 410 13.8 56 0.015
Nov.–14 160 20 600 12.1 73 0.022
Dec.–14 90 60 490 7.5 37 0.017
Jan.–15 110 70 100 7.7 8 0.003
Feb.–15 230 30 840 7.6 64 0.026
Mar.–15 460 140 640 8.0 51 0.019
Apr.–15 640 40 660 10.2 68 0.019
May–15 700 60 530 13.9 74 0.015
June–15 1,240 10 150 14.5 22 0.004
July–15 1,100 60 340 13.4 45 0.010
Aug.–15 960 70 500 12.9 65 0.015
Sept.–15 760 60 470 12.6 60 0.015
Oct.–15 430 80 410 11.4 47 0.013
Nov.–15 170 50 730 8.7 64 0.024
Dec.–15 70 40 670 7.5 50 0.021
Jan.–16 90 130 500 7.6 38 0.015
Feb.–16 250 60 440 7.8 34 0.012
Mar.–16 420 90 1,100 7.8 85 0.029
Apr.–16 600 200 650 12.8 84 0.017
May–16 900 90 10 8.4 1 0.000
June–16 1,460 10 50 13.6 7 0.001
18 Assessment of Managed Aquifer Recharge at Sand Hollow Reservoir, Washington County, Utah
Table 1. Reservoir data, evaporation, precipitation, and calculated recharge beneath Sand Hollow Reservoir, Washington County, Utah, 2002–16.—Continued [Reservoir altitude and Reservoir storage: value is from the last day of each month; Reservoir surface area: value is an average of the daily values for each month; 2ơ, 2 standard deviation; ft/d, foot per day; —, no data available]
MonthReservoir altitude
(feet)
Reservoir storage
(acre-feet)
Monthly pump station inflow
or outflow (-) to/from reservoir
(acre-feet)1
Monthly drain and spring return flow to reservoir
(acre-feet)
Monthly outflow (-) to Sand Hollow
Resort (acre-feet)
Monthly total inflow or outflow
(-) to/from reservoir
(acre-feet)1
Monthly reservoir storage
change (acre-feet)
Reservoir surface area
(acres)
Monthly evaporation
rate (feet)2
July–16 3,054 43,780 -930 280 -100 -750 -2,760 1,250 1.18
Aug.–16 3,053 42,090 -160 250 -160 -60 -1,700 1,220 0.93
Sept.–16 3,052 40,710 -100 260 -100 70 -1,380 1,190 0.64
Oct.–16 3,051 39,560 0 260 -60 200 -1,150 1,170 0.44
Nov.–16 3,051 39,560 1,520 240 0 1,760 0 1,160 0.22
Dec.–16 3,052 40,730 1,690 240 0 1,930 1,170 1,170 0.08
Total — — — — — 257,460 — — —
Table 1. Reservoir data, evaporation, precipitation, and calculated recharge beneath Sand Hollow Reservoir, Washington County, Utah, 2002–16.—Continued [Reservoir altitude and Reservoir storage: value is from the last day of each month; Reservoir surface area: value is an average of the daily values for each month; 2ơ, 2 standard deviation; ft/d, foot per day; —, no data available]
MonthMonthly
evaporation (acre-feet)
Monthly precipitation
(acre-feet)
Monthly groundwater
recharge(acre-feet)
Monthly groundwater
recharge uncertainty, 2σ
(percent)
Monthly groundwater
recharge uncertainty, 2σ
(acre-feet)
Groundwater recharge rate
(ft/d)
July–16 1,480 60 590 11.9 70 0.015
Aug.–16 1,130 160 670 13.3 89 0.018
Sept.–16 760 140 830 13.0 107 0.022
Oct.–16 510 40 880 13.0 114 0.024
Nov.–16 250 60 1,570 7.2 114 0.044
Dec.–16 90 230 900 7.6 69 0.025
Total 84,950 — 140,740 — — —
1Negative (-) values indicate flows out of Sand Hollow Reservoir to Quail Creek Water Treatment Plant or to Quail Creek Reservoir. 2Monthly evaporation rate from February 2007 through December 2009 was calculated with a correction factor to account for higher solar radiation measurements with new instrument. 3Because of problems with monitoring equipment, inflows from September 2004 through February 2005 are estimated based on previous inflow history and changes in reservoir altitude. 4Revised value based on refined reservoir altitude estimate for October 2005. 5Monthly pump station outflow was increased from amount reported in Heilweil, Ortiz, and Susong (2009) based on reservoir altitude relations. 6Monthly total outflow was increased from amount reported by Washington County Water Conservancy District based on reservoir altitude relations. 7Monthly pump station outflow was increased from amount reported in Heilweil, Ortiz, and Susong (2009) based on reservoir altitude relations. 8Sand Hollow rain gage not functioning; values of 0 based on lack of precipitation from St. George precipitation station no. 427516. 9Monthly total inflow or outflow (-) to/from reservoir (acre-feet).
Assessment of Managed Aquifer Recharge at Sand Hollow Reservoir 19
Meteorological DataMeteorological data have been collected at the WCWCD
weather station (fig. 2) in Sand Hollow since January 1998. Beginning in 2010, a Soil Climate Analysis Network (SCAN) Sand Hollow weather station (http://www.wcc.nrcs.usda.gov/nwcc/site?sitenum=2159) operated by the Natural Resources Conservation Service (NRCS), replaced the collection of data by the WCWCD weather station. The NRCS Sand Hollow SCAN station is located south of the reservoir within Sand Hollow basin near the WCWCD station (fig. 2). Data from both weather stations have been used for evaluating evaporation and precipitation, which are required for calculating monthly recharge from Sand Hollow Reservoir. Parameters measured include air temperature, wind speed, wind direction, precipitation, relative humidity, and incoming solar radiation. Instrumentation includes a temperature and relative humidity probe, a wind direction and speed monitor, a tipping bucket rain gage, and a solar radiometer. Sensors collect data every minute, and average hourly and daily values are computed and stored on a data logger, with the exception of precipitation, which is summed rather than averaged. The solar radiation and temperature data were used for calculating evaporation by using the version of the Jenson-Haise method found in McGuinness and Bordne (1971). The other data were
collected to permit calculations of evaporation using other methods.
From January 13, 1998, to December 31, 2016, daily average air temperature ranged from -10 to 36 degrees Celsius (°C). The coldest temperatures during the year were typically in December and January, when minimum air temperatures occasionally were below -10 °C. The warmest temperatures were typically in July, when maximum air temperatures occasionally approached 45 °C. Daily average solar radiation ranged from 14 to 990 calories per square centimeter per day. The minimum daily averages are typically in December and January, and the maximum daily averages are typically in June and July.
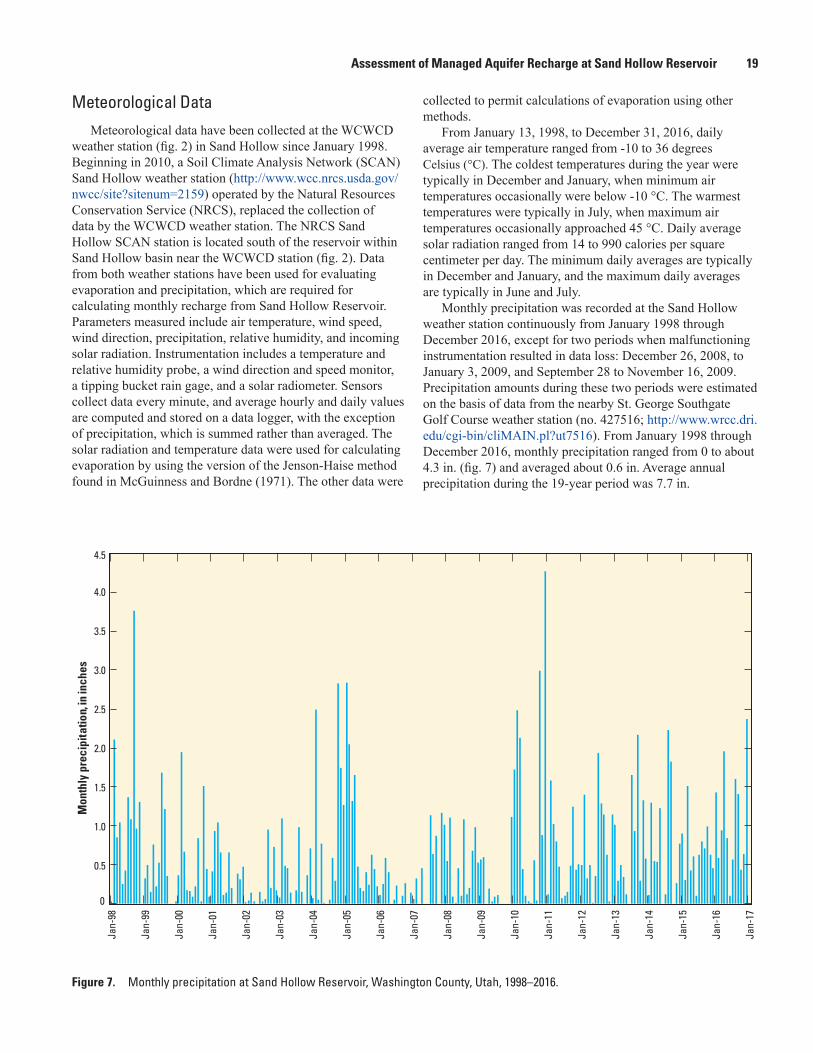
Monthly precipitation was recorded at the Sand Hollow weather station continuously from January 1998 through December 2016, except for two periods when malfunctioning instrumentation resulted in data loss: December 26, 2008, to January 3, 2009, and September 28 to November 16, 2009. Precipitation amounts during these two periods were estimated on the basis of data from the nearby St. George Southgate Golf Course weather station (no. 427516; http://www.wrcc.dri.edu/cgi-bin/cliMAIN.pl?ut7516). From January 1998 through December 2016, monthly precipitation ranged from 0 to about 4.3 in. (fig. 7) and averaged about 0.6 in. Average annual precipitation during the 19-year period was 7.7 in.
0
0.5
1.0
1.5
2.0
2.5
3.0
3.5
4.0
4.5
Mon
thly
pre
cipi
tatio
n, in
inch
es
Jan-
98
Jan-
99
Jan-
00
Jan-
01
Jan-
02
Jan-
03
Jan-
04
Jan-
05
Jan-
06
Jan-
07
Jan-
08
Jan-
09
Jan-
10
Jan-
11
Jan-
12
Jan-
13
Jan-
14
Jan-
15
Jan-
16
Jan-
17
Figure 7. Monthly precipitation at Sand Hollow Reservoir, Washington County, Utah, 1998–2016.

20 Assessment of Managed Aquifer Recharge at Sand Hollow Reservoir, Washington County, Utah
Estimates of Managed Aquifer Recharge From Sand Hollow Reservoir
Substantial amounts of surface water from Sand Hollow Reservoir infiltrate the underlying sediments to recharge the Navajo aquifer. This recharge either is captured by production wells for municipal supply, or it moves northward through the aquifer towards the Virgin River. Through 2016, withdrawals from production wells operated by the WCWCD at Sand Hollow have been permitted for the capture of natural recharge in Sand Hollow. These withdrawals are governed by different water rights than those associated with MAR from Sand Hollow Reservoir; withdrawal rights for this artificial recharge have not yet been exercised.
Recharge from Sand Hollow Reservoir is calculated as the residual with the following water-budget equation (modified from Heilweil and others, 2005):
R = Isw + Idr – Osw + P ± ΔS – E (1)
where R is recharge, Isw is surface-water inflow, Idr is drain return flow, Osw is surface-water outflow, P is the amount of precipitation falling directly
on the reservoir, ΔS is change in surface-water storage, and E is evaporation.
All the variables in equation 1 are in units of acre-feet.
The following equation was developed to evaluate the uncertainty for each monthly recharge estimate:
CU = Σ[(|Ci| / Σ|Ci|) * Ui] (2)
where CU is the composite uncertainty fraction (2
standard deviation, 2σ), |Ci| is the absolute value of each component of the
water budget (acre-feet), Σ|Ci| is the sum of absolute values of all the water-
budget components (acre-feet), and Ui is the uncertainty fraction (2σ) for each
individual water-budget component.
The smallest estimated uncertainty fraction is 0.05 (5 percent) for Isw, Idr, and Osw because these flows are recorded using calibrated inline flow meters. The estimated uncertainty fraction for P is higher, at 0.10 (10 percent), because it is an indirect measurement made on the basis of nearby meteorological station data. Similarly, the estimated uncertainty fraction is also 0.10 (10 percent) for ΔS because changes in surface-water storage are based only on approximate reservoir water-level altitude/volume relations rather than direct measurements. The largest estimated
uncertainty fraction is 0.20 (20 percent) for E, which is based on differences between alternative methods for estimating evaporation at Sand Hollow and other areas (Heilweil and others, 2007; Rosenberry and others, 2007).
The first two reports documenting monthly groundwater recharge beneath Sand Hollow Reservoir through August 2006 (Heilweil and others, 2005; Heilweil and Susong, 2007) did not include precipitation falling directly on the reservoir. Beginning with the third report (Heilweil, Ortiz, and Susong, 2009), and continuing in this report, an additional term for precipitation falling directly on the reservoir (P) was included in equation 1. The monthly amount of precipitation falling on the reservoir is calculated by multiplying the total monthly precipitation recorded by the Sand Hollow weather station by the average reservoir surface area for that month, based on reservoir water-level altitude to area relations for the reservoir (RBG Engineering, written commun., 2002; Washington County Water Conservancy District, written commun., 2006). The precipitation term in equation 1, however, does not account for precipitation runoff to the reservoir. Because of high evaporation rates and permeable surficial soils, precipitation events seldom produce runoff that reaches the lower part of Sand Hollow (L. Jessop, Washington County Water Conservancy District, oral commun., 2001), where the reservoir is situated.
Monthly water-budget values for Sand Hollow Reservoir are shown in table 1. Values are generally monthly averages or totals, except for reservoir altitude and storage, which are shown for the last day of each month. Values for “Monthly evaporation rate,” “Monthly evaporation,” and “Monthly groundwater recharge” from March 2002 through January 2005, and from January 2008 through December 2016, are monthly averages. During February 2005 through December 2007, however, the values are the sum of daily measurements. Summing of daily evaporation estimates was discontinued after 2007 because a comparison of daily and average monthly calculations during 2008 and 2009 showed little difference, and the equation used for calculating evapotranspiration is more appropriate for calculating average evaporation over longer periods (McGuinness and Bordne, 1971).
Changes in Reservoir StorageChanges in reservoir storage were calculated from daily
reservoir water-level altitudes reported by the WCWCD using altitude to volume relations (RBG Engineering, written commun., 2002). Since inception of the reservoir in 2002, surface-water storage has increased to a maximum of about 51,000 acre-ft in May 2006. From the latter half of 2006 through 2007, surface-water storage decreased to about 32,000 acre-ft, and during 2008 through 2010, surface-water storage varied between about 31,000 and 44,000 acre-ft. Following the abnormally wet winter and spring of 2010–11, surface-water storage was kept at a high level during 2011 through mid-2012, varying between about 40,000 and
Assessment of Managed Aquifer Recharge at Sand Hollow Reservoir 21
51,000 acre-ft, but then declined to as little as about 22,000 acre-ft in November 2014 as a result of less than normal precipitation in the region and decreased flows in the Virgin River (table 1). Surface-water storage increased again in 2016, reaching about 48,000 acre-ft in May, the highest level since spring 2012.
Reservoir Evaporation The McGuinness and Bordne (1971) version of the
Jensen-Haise method was selected for calculating evaporation from Sand Hollow Reservoir during this study. A detailed comparison to results using other methods for estimating evaporation is given in Heilweil and others (2005). The McGuinness and Bordne (1971) version of the Jensen-Haise method is based on the following relation:
PET = {[((0.01Ta) – 0.37)(Qs)]0.000673}2.54 (3)
where PET is potential evaporation, in centimeters per
day, Ta is air temperature, in degrees Fahrenheit, and Qs is solar radiation, in calories per square
centimeter per day.The units for PET can be converted to feet per day by multiplying by 0.0328.
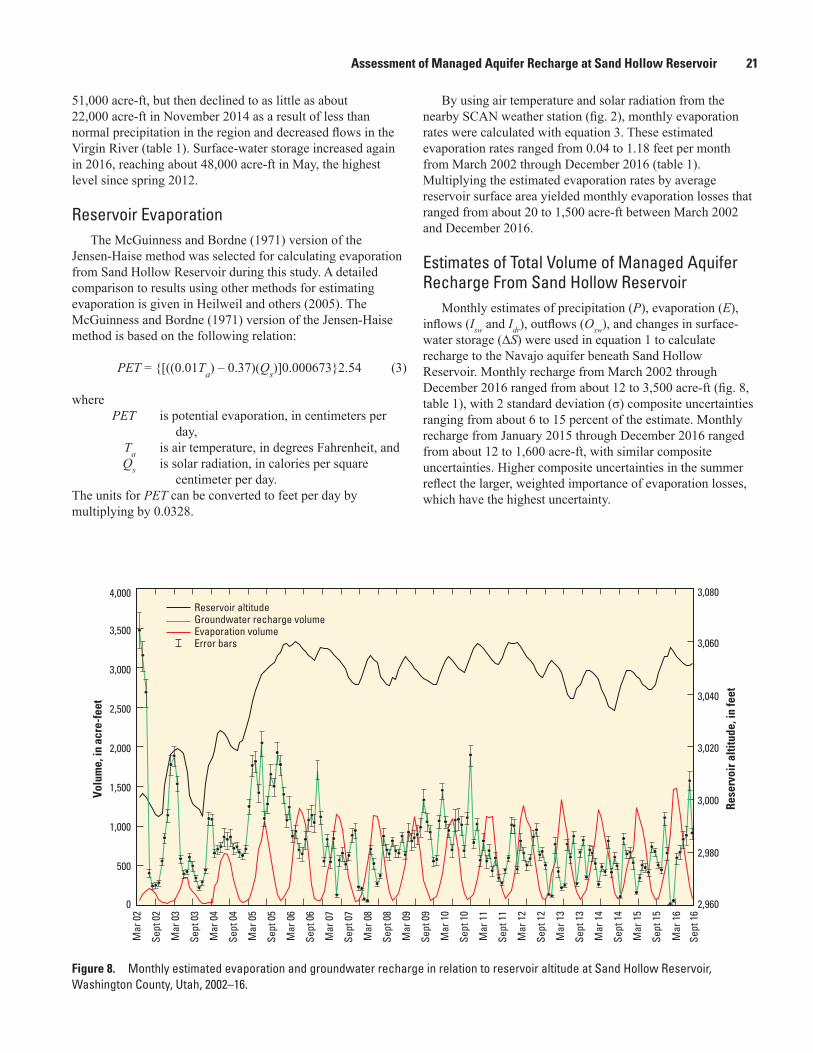
By using air temperature and solar radiation from the nearby SCAN weather station (fig. 2), monthly evaporation rates were calculated with equation 3. These estimated evaporation rates ranged from 0.04 to 1.18 feet per month from March 2002 through December 2016 (table 1). Multiplying the estimated evaporation rates by average reservoir surface area yielded monthly evaporation losses that ranged from about 20 to 1,500 acre-ft between March 2002 and December 2016.
Estimates of Total Volume of Managed Aquifer Recharge From Sand Hollow Reservoir
Monthly estimates of precipitation (P), evaporation (E), inflows (Isw and Idr), outflows (Osw), and changes in surface-water storage (ΔS) were used in equation 1 to calculate recharge to the Navajo aquifer beneath Sand Hollow Reservoir. Monthly recharge from March 2002 through December 2016 ranged from about 12 to 3,500 acre-ft (fig. 8, table 1), with 2 standard deviation (σ) composite uncertainties ranging from about 6 to 15 percent of the estimate. Monthly recharge from January 2015 through December 2016 ranged from about 12 to 1,600 acre-ft, with similar composite uncertainties. Higher composite uncertainties in the summer reflect the larger, weighted importance of evaporation losses, which have the highest uncertainty.
4,000
3,000
3,500
2,000
2,500
1,000
1,500
0
500
Volu
me,
in a
cre-
feet
3,080
3,060
3,020
3,000
2,960
2,980
3,040
Rese
rvoi
r alti
tude
, in
feet
Reservoir altitudeGroundwater recharge volumeEvaporation volumeError bars
Mar
02
Sept
02
Mar
03
Sept
03
Mar
04
Sept
04
Mar
05
Sept
05
Mar
06
Sept
06
Mar
07
Sept
07
Mar
08
Sept
08
Mar
09
Sept
09
Mar
10
Sept
10
Mar
11
Sept
11
Mar
12
Sept
12
Mar
13
Sept
13
Mar
14
Sept
14
Mar
15
Sept
15
Sept
16
Mar
16
Figure 8. Monthly estimated evaporation and groundwater recharge in relation to reservoir altitude at Sand Hollow Reservoir, Washington County, Utah, 2002–16.

22 Assessment of Managed Aquifer Recharge at Sand Hollow Reservoir, Washington County, Utah
Estimated average monthly recharge rates beneath Sand Hollow Reservoir ranged from about 0.000 to 0.430 foot per day (ft/d) between March 2002 and December 2016 (fig. 9). Although the graph shows large monthly fluctuations, recharge has generally stabilized at an average of about 0.02 ft/d during 2011 through 2016.
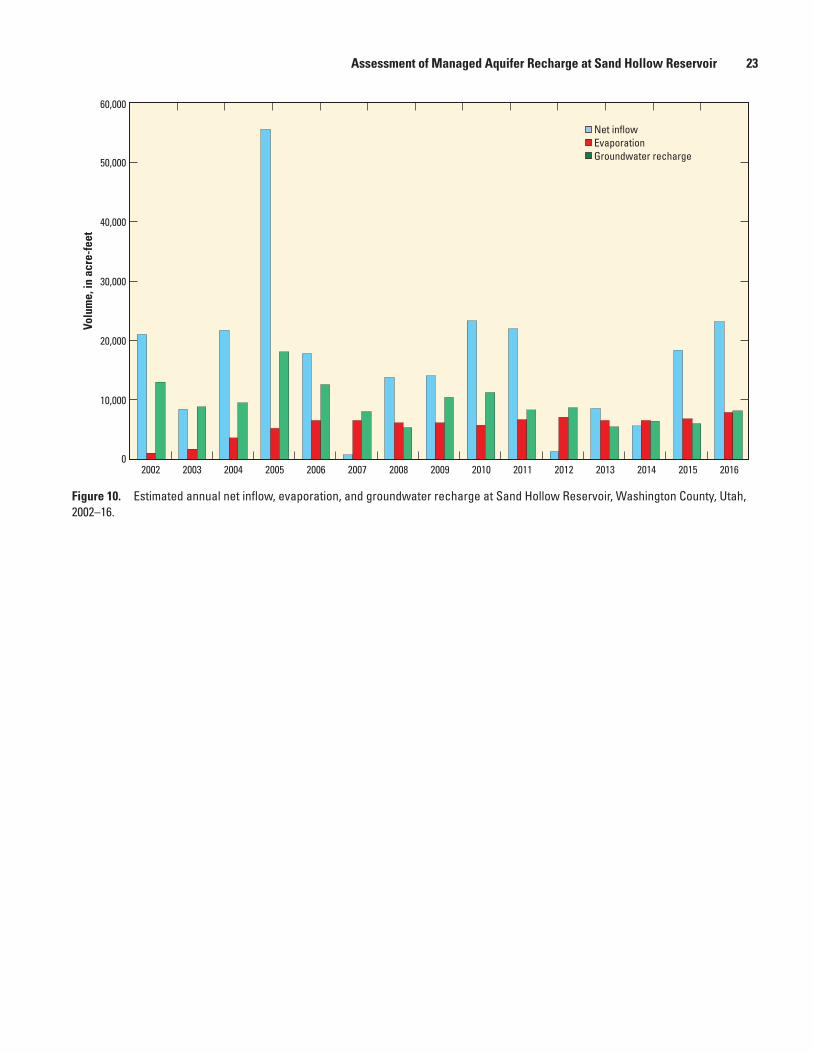
Net annual inflow, evaporation, and groundwater recharge from Sand Hollow Reservoir from 2002 through 2016 are shown on figure 10. Total net inflow during this period was about 256,000 acre-ft, with annual inflow ranging from about 800 acre-ft in 2007 to 56,000 acre-ft in 2005. The general increase in reservoir water-level altitude and area from 2002
to 2007 resulted in a steady increase in the volume of annual evaporation from about 1,100 to 6,600 acre-ft over the same period, and then remained relatively constant, ranging between 5,700 acre-ft in 2010 and 7,900 acre-ft in 2016. Total estimated evaporative losses from 2002 through 2016 were about 85,000 acre-ft. Total estimated evaporation losses from 2015 through 2016 were about 14,800 acre-ft. Annual recharge ranged from a low of about 5,400 acre-ft in 2008 to a high of about 18,000 acre-ft in 2005. Total estimated recharge from 2002 through 2016 was about 141,000 acre-ft, with a two standard deviation uncertainty of 13,300 acre-ft. Of that total, about 14,200 acre-ft of recharge occurred in 2015 and 2016.
0
0.05
0.10
0.15
0.20
0.25
0.30
0.35
0.40
0.45
0.50
Jan-02 Jan-04 Jan-06 Jan-08 Jan-10 Jan-12 Jan-14 Jan-16
Rech
arge
rate
, in
feet
per
day
Figure 9. Monthly calculated groundwater recharge rates beneath Sand Hollow Reservoir, Washington County, Utah, 2002–16.
Assessment of Managed Aquifer Recharge at Sand Hollow Reservoir 23
0
10,000
20,000
30,000
40,000
50,000
60,000
Net inflowEvaporationGroundwater recharge
2002 2003 2004 2005 2006 2007 2008 2009 2010 2011 2012 2013 2014 2015 2016
Volu
me,
in a
cre-
feet
Figure 10. Estimated annual net inflow, evaporation, and groundwater recharge at Sand Hollow Reservoir, Washington County, Utah, 2002–16.
24 Assessment of Managed Aquifer Recharge at Sand Hollow Reservoir, Washington County, Utah
Groundwater and Surface-Water Quality in Sand Hollow
As MAR from Sand Hollow Reservoir moves into the underlying Navajo aquifer, it has an initial water-quality signature similar to the reservoir water, but this evolves as water moves through the subsurface. Along its flow path, the MAR initially moves from the reservoir through the organic-rich silt layer that has accumulated beneath the reservoir, and then through the pre-reservoir vadose zone (now saturated) where vadose-zone solutes had naturally accumulated and air was trapped prior to and during filling of the reservoir. This results in water quality that is different from native groundwater. As part of the monitoring of MAR from Sand Hollow Reservoir, water-quality samples from the reservoir and surrounding monitoring wells were collected and analyzed for field water-quality parameters and laboratory chemical, isotopic, and dissolved-gas concentrations.
Field water-quality parameters include water temperature, specific conductance, pH, dissolved oxygen (DO), and total dissolved-gas (TDG) pressure. Total dissolved-gas pressure is the combination of partial pressures of all dissolved gases in the water. Field parameters were measured with a multi-parameter sonde placed within the screened interval at the bottom of each 2-inch-diameter monitoring well, and in the reservoir at depths of approximately 2 ft. The multi-parameter sonde was too large to enter the 1-inch-diameter monitoring wells (North Dam 3A, WD 4, WD 5, and WD 12). Consequently, field measurements from these wells were made onsite using a flow-through chamber connected to the discharge line from either a Waterra inertia pump or peristaltic pump; no TDG pressure measurements were made at these sites. Additional details regarding field parameter methods are given in Heilweil and others (2005) and Heilweil and Susong (2007).
Laboratory analyses of water from Sand Hollow Reservoir and groundwater from the Navajo aquifer included dissolved major ions and trace elements, dissolved organic carbon (DOC), tritium (3H), and industrial dissolved gases. The major inorganic ions included calcium, magnesium, sodium, potassium, bicarbonate, sulfate, chloride, fluoride, and nitrate. Trace elements included bromide, iron, manganese, arsenic, nitrite, ammonia, and orthophosphate. Dissolved gases included chlorofluorocarbons (CFC-11, CFC-12, CFC-113) and sulfur hexafluoride (SF6).
Water samples were collected from the 2-inch-diameter monitoring wells by using either a Grundfos or Bennett submersible pump; 1-inch-diameter wells were sampled with an inertia pump, and production wells were sampled using installed turbine pumps. Prior to sample collection from monitoring wells, the water was purged from each well until field parameters stabilized and a minimum of three casing volumes were removed. After purging each well, water was pumped into sample bottles and filtered as required. Since 2009, a set of replicate samples has been collected annually at one randomly selected site and separately analyzed for all constituents for quality assurance. Samples for major ions and
trace elements were filtered through 0.45-micron disposable filters and collected in pre-cleaned polyethylene bottles according to procedures described by Wilde and Radtke (1998); samples for analysis of cations (calcium, magnesium, sodium, and potassium) and trace elements were preserved with 7.7-normal nitric acid. Tritium samples were collected in 500-milliliter (ml) polyethylene bottles with polyseal caps and no head space. Samples for CFC and SF6 analysis were collected in 250-ml and 1-liter glass bottles, respectively, according to procedures described on the USGS Reston Groundwater Dating Laboratory website at http://water.usgs.gov/lab/.
Inorganic and organic chemical analyses (major ions, trace elements, DOC) were analyzed at the USGS National Water Quality Laboratory in Denver, Colorado. Samples collected during 2008–12 and 2015–16 for CFCs and SF6 were analyzed by the USGS Chlorofluorocarbon Laboratory in Reston, Virginia. Tritium and SF6 (2013–14) were analyzed at the University of Utah Dissolved Gas Service Center in Salt Lake City.
Water-Quality Results Detailed water-quality data and interpretations for Sand
Hollow, including trends through 2012, have been published previously (Heilweil and others, 2005; Heilweil and Susong, 2007; Heilweil, Ortiz, and Susong, 2009; Heilweil and Marston, 2011; Marston and Heilweil, 2013; Marston and Heilweil, 2016). Tables 2 and 3 provide these previous data, along with additional data collected during 2014 and 2016. The following discussion describes recent changes (2015–16) or the continuation of longer trends (2002–16) in water quality.
The most significant changes in water quality have occurred at wells WD 4 and WD 12, located 2,600 and 1,000 ft from the reservoir, respectively. Although the low chloride/bromide ratios indicate that reservoir water has not yet arrived at these sites, increases in other constituent concentrations indicate a flush of naturally accumulating vadose-zone salts ahead of reservoir recharge. At well WD 4, specific conductance and dissolved-solids concentrations increased from 2011 through 2016 to values similar to those in the reservoir water. Although concentrations of environmental tracers (tritium, CFCs, and SF6 ) have also increased, they are still lower than those in the reservoir water. At well WD 12, specific conductance and dissolved-solids concentrations increased from 2011 through 2016 to higher values than those in the reservoir, indicating mobilization of naturally accumulating vadose-zone salts; however, chloride/bromide ratios and environmental tracer concentrations (tritium, CFCs, and SF6) were still lower than those in the reservoir water.
At well WD 6, located 1,000 ft from the reservoir, the increase in the chloride/bromide ratio from 2002 through 2016 toward ratios in the reservoir water indicates the arrival of recharge from the reservoir. Specific conductance, dissolved-solids concentrations, and concentrations of some environmental tracers (tritium, CFC-12, CFC-113) are also
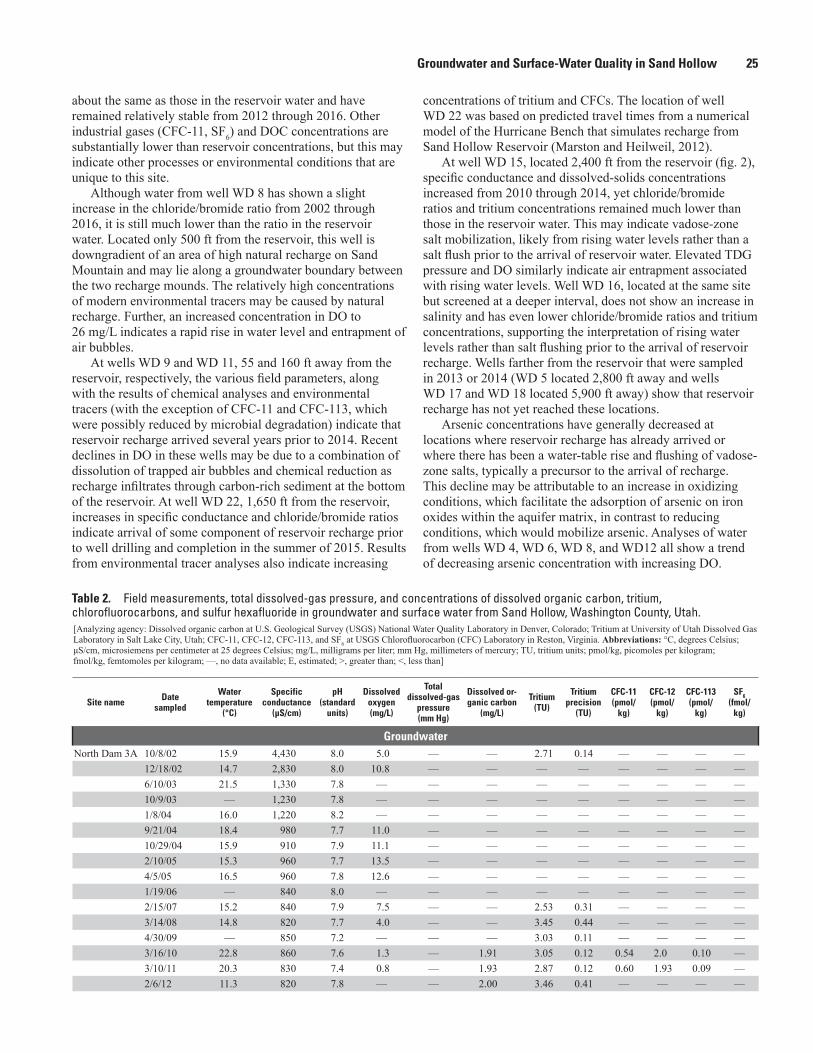
Groundwater and Surface-Water Quality in Sand Hollow 25
about the same as those in the reservoir water and have remained relatively stable from 2012 through 2016. Other industrial gases (CFC-11, SF6) and DOC concentrations are substantially lower than reservoir concentrations, but this may indicate other processes or environmental conditions that are unique to this site.
Although water from well WD 8 has shown a slight increase in the chloride/bromide ratio from 2002 through 2016, it is still much lower than the ratio in the reservoir water. Located only 500 ft from the reservoir, this well is downgradient of an area of high natural recharge on Sand Mountain and may lie along a groundwater boundary between the two recharge mounds. The relatively high concentrations of modern environmental tracers may be caused by natural recharge. Further, an increased concentration in DO to 26 mg/L indicates a rapid rise in water level and entrapment of air bubbles.
At wells WD 9 and WD 11, 55 and 160 ft away from the reservoir, respectively, the various field parameters, along with the results of chemical analyses and environmental tracers (with the exception of CFC-11 and CFC-113, which were possibly reduced by microbial degradation) indicate that reservoir recharge arrived several years prior to 2014. Recent declines in DO in these wells may be due to a combination of dissolution of trapped air bubbles and chemical reduction as recharge infiltrates through carbon-rich sediment at the bottom of the reservoir. At well WD 22, 1,650 ft from the reservoir, increases in specific conductance and chloride/bromide ratios indicate arrival of some component of reservoir recharge prior to well drilling and completion in the summer of 2015. Results from environmental tracer analyses also indicate increasing
concentrations of tritium and CFCs. The location of well WD 22 was based on predicted travel times from a numerical model of the Hurricane Bench that simulates recharge from Sand Hollow Reservoir (Marston and Heilweil, 2012).
At well WD 15, located 2,400 ft from the reservoir (fig. 2), specific conductance and dissolved-solids concentrations increased from 2010 through 2014, yet chloride/bromide ratios and tritium concentrations remained much lower than those in the reservoir water. This may indicate vadose-zone salt mobilization, likely from rising water levels rather than a salt flush prior to the arrival of reservoir water. Elevated TDG pressure and DO similarly indicate air entrapment associated with rising water levels. Well WD 16, located at the same site but screened at a deeper interval, does not show an increase in salinity and has even lower chloride/bromide ratios and tritium concentrations, supporting the interpretation of rising water levels rather than salt flushing prior to the arrival of reservoir recharge. Wells farther from the reservoir that were sampled in 2013 or 2014 (WD 5 located 2,800 ft away and wells WD 17 and WD 18 located 5,900 ft away) show that reservoir recharge has not yet reached these locations.
Arsenic concentrations have generally decreased at locations where reservoir recharge has already arrived or where there has been a water-table rise and flushing of vadose-zone salts, typically a precursor to the arrival of recharge. This decline may be attributable to an increase in oxidizing conditions, which facilitate the adsorption of arsenic on iron oxides within the aquifer matrix, in contrast to reducing conditions, which would mobilize arsenic. Analyses of water from wells WD 4, WD 6, WD 8, and WD12 all show a trend of decreasing arsenic concentration with increasing DO.
Table 2. Field measurements, total dissolved-gas pressure, and concentrations of dissolved organic carbon, tritium, chlorofluorocarbons, and sulfur hexafluoride in groundwater and surface water from Sand Hollow, Washington County, Utah.[Analyzing agency: Dissolved organic carbon at U.S. Geological Survey (USGS) National Water Quality Laboratory in Denver, Colorado; Tritium at University of Utah Dissolved Gas Laboratory in Salt Lake City, Utah; CFC-11, CFC-12, CFC-113, and SF6 at USGS Chlorofluorocarbon (CFC) Laboratory in Reston, Virginia. Abbreviations: °C, degrees Celsius; μS/cm, microsiemens per centimeter at 25 degrees Celsius; mg/L, milligrams per liter; mm Hg, millimeters of mercury; TU, tritium units; pmol/kg, picomoles per kilogram; fmol/kg, femtomoles per kilogram; —, no data available; E, estimated; >, greater than; <, less than]
Site name Datesampled
Water temperature
(°C)
Specific conductance
(μS/cm)
pH (standard
units)
Dissolved oxygen (mg/L)
Total dissolved-gas
pressure (mm Hg)
Dissolved or-ganic carbon
(mg/L)
Tritium (TU)
Tritium precision
(TU)
CFC-11 (pmol/
kg)
CFC-12 (pmol/
kg)
CFC-113 (pmol/
kg)
SF6 (fmol/
kg)
GroundwaterNorth Dam 3A 10/8/02 15.9 4,430 8.0 5.0 — — 2.71 0.14 — — — —
12/18/02 14.7 2,830 8.0 10.8 — — — — — — — —6/10/03 21.5 1,330 7.8 — — — — — — — — —10/9/03 — 1,230 7.8 — — — — — — — — —1/8/04 16.0 1,220 8.2 — — — — — — — — —9/21/04 18.4 980 7.7 11.0 — — — — — — — —10/29/04 15.9 910 7.9 11.1 — — — — — — — —2/10/05 15.3 960 7.7 13.5 — — — — — — — —4/5/05 16.5 960 7.8 12.6 — — — — — — — —1/19/06 — 840 8.0 — — — — — — — — —2/15/07 15.2 840 7.9 7.5 — — 2.53 0.31 — — — —3/14/08 14.8 820 7.7 4.0 — — 3.45 0.44 — — — —4/30/09 — 850 7.2 — — — 3.03 0.11 — — — —3/16/10 22.8 860 7.6 1.3 — 1.91 3.05 0.12 0.54 2.0 0.10 —3/10/11 20.3 830 7.4 0.8 — 1.93 2.87 0.12 0.60 1.93 0.09 —2/6/12 11.3 820 7.8 — — 2.00 3.46 0.41 — — — —
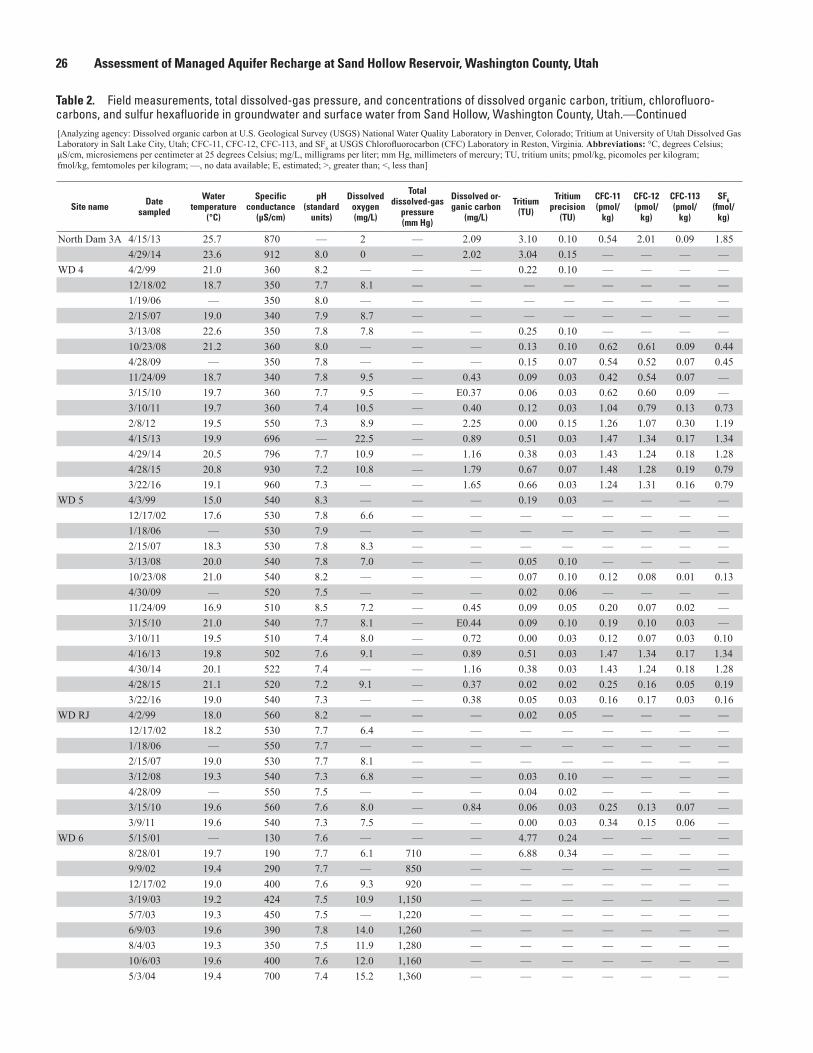
26 Assessment of Managed Aquifer Recharge at Sand Hollow Reservoir, Washington County, Utah
Table 2. Field measurements, total dissolved-gas pressure, and concentrations of dissolved organic carbon, tritium, chlorofluoro-carbons, and sulfur hexafluoride in groundwater and surface water from Sand Hollow, Washington County, Utah.—Continued
[Analyzing agency: Dissolved organic carbon at U.S. Geological Survey (USGS) National Water Quality Laboratory in Denver, Colorado; Tritium at University of Utah Dissolved Gas Laboratory in Salt Lake City, Utah; CFC-11, CFC-12, CFC-113, and SF6 at USGS Chlorofluorocarbon (CFC) Laboratory in Reston, Virginia. Abbreviations: °C, degrees Celsius; μS/cm, microsiemens per centimeter at 25 degrees Celsius; mg/L, milligrams per liter; mm Hg, millimeters of mercury; TU, tritium units; pmol/kg, picomoles per kilogram; fmol/kg, femtomoles per kilogram; —, no data available; E, estimated; >, greater than; <, less than]
Site name Datesampled
Water temperature
(°C)
Specific conductance
(μS/cm)
pH (standard
units)
Dissolved oxygen (mg/L)
Total dissolved-gas
pressure (mm Hg)
Dissolved or-ganic carbon
(mg/L)
Tritium (TU)
Tritium precision
(TU)
CFC-11 (pmol/
kg)
CFC-12 (pmol/
kg)
CFC-113 (pmol/
kg)
SF6 (fmol/
kg)
North Dam 3A 4/15/13 25.7 870 — 2 — 2.09 3.10 0.10 0.54 2.01 0.09 1.854/29/14 23.6 912 8.0 0 — 2.02 3.04 0.15 — — — —
WD 4 4/2/99 21.0 360 8.2 — — — 0.22 0.10 — — — —12/18/02 18.7 350 7.7 8.1 — — — — — — — —1/19/06 — 350 8.0 — — — — — — — — —2/15/07 19.0 340 7.9 8.7 — — — — — — — —3/13/08 22.6 350 7.8 7.8 — — 0.25 0.10 — — — —10/23/08 21.2 360 8.0 — — — 0.13 0.10 0.62 0.61 0.09 0.444/28/09 — 350 7.8 — — — 0.15 0.07 0.54 0.52 0.07 0.4511/24/09 18.7 340 7.8 9.5 — 0.43 0.09 0.03 0.42 0.54 0.07 —3/15/10 19.7 360 7.7 9.5 — E0.37 0.06 0.03 0.62 0.60 0.09 —3/10/11 19.7 360 7.4 10.5 — 0.40 0.12 0.03 1.04 0.79 0.13 0.732/8/12 19.5 550 7.3 8.9 — 2.25 0.00 0.15 1.26 1.07 0.30 1.194/15/13 19.9 696 — 22.5 — 0.89 0.51 0.03 1.47 1.34 0.17 1.344/29/14 20.5 796 7.7 10.9 — 1.16 0.38 0.03 1.43 1.24 0.18 1.284/28/15 20.8 930 7.2 10.8 — 1.79 0.67 0.07 1.48 1.28 0.19 0.793/22/16 19.1 960 7.3 — — 1.65 0.66 0.03 1.24 1.31 0.16 0.79
WD 5 4/3/99 15.0 540 8.3 — — — 0.19 0.03 — — — —12/17/02 17.6 530 7.8 6.6 — — — — — — — —1/18/06 — 530 7.9 — — — — — — — — —2/15/07 18.3 530 7.8 8.3 — — — — — — — —3/13/08 20.0 540 7.8 7.0 — — 0.05 0.10 — — — —10/23/08 21.0 540 8.2 — — — 0.07 0.10 0.12 0.08 0.01 0.134/30/09 — 520 7.5 — — — 0.02 0.06 — — — —11/24/09 16.9 510 8.5 7.2 — 0.45 0.09 0.05 0.20 0.07 0.02 —3/15/10 21.0 540 7.7 8.1 — E0.44 0.09 0.10 0.19 0.10 0.03 —3/10/11 19.5 510 7.4 8.0 — 0.72 0.00 0.03 0.12 0.07 0.03 0.104/16/13 19.8 502 7.6 9.1 — 0.89 0.51 0.03 1.47 1.34 0.17 1.344/30/14 20.1 522 7.4 — — 1.16 0.38 0.03 1.43 1.24 0.18 1.284/28/15 21.1 520 7.2 9.1 — 0.37 0.02 0.02 0.25 0.16 0.05 0.193/22/16 19.0 540 7.3 — — 0.38 0.05 0.03 0.16 0.17 0.03 0.16
WD RJ 4/2/99 18.0 560 8.2 — — — 0.02 0.05 — — — —12/17/02 18.2 530 7.7 6.4 — — — — — — — —1/18/06 — 550 7.7 — — — — — — — — —2/15/07 19.0 530 7.7 8.1 — — — — — — — —3/12/08 19.3 540 7.3 6.8 — — 0.03 0.10 — — — —4/28/09 — 550 7.5 — — — 0.04 0.02 — — — —3/15/10 19.6 560 7.6 8.0 — 0.84 0.06 0.03 0.25 0.13 0.07 —3/9/11 19.6 540 7.3 7.5 — — 0.00 0.03 0.34 0.15 0.06 —
WD 6 5/15/01 — 130 7.6 — — — 4.77 0.24 — — — —8/28/01 19.7 190 7.7 6.1 710 — 6.88 0.34 — — — —9/9/02 19.4 290 7.7 — 850 — — — — — — —12/17/02 19.0 400 7.6 9.3 920 — — — — — — —3/19/03 19.2 424 7.5 10.9 1,150 — — — — — — —5/7/03 19.3 450 7.5 — 1,220 — — — — — — —6/9/03 19.6 390 7.8 14.0 1,260 — — — — — — —8/4/03 19.3 350 7.5 11.9 1,280 — — — — — — —10/6/03 19.6 400 7.6 12.0 1,160 — — — — — — —5/3/04 19.4 700 7.4 15.2 1,360 — — — — — — —

Groundwater and Surface-Water Quality in Sand Hollow 27
Table 2. Field water-quality parameters, total dissolved-gas pressure, dissolved organic carbon, tritium, chlorofluorocarbons, and sulfur hexafluoride in groundwater and surface water from Sand Hollow, Washington County, Utah.—Continued
[Analyzing agency: Dissolved organic carbon at U.S. Geological Survey (USGS) National Water Quality Laboratory in Denver, Colorado; Tritium at University of Utah Dissolved Gas Laboratory in Salt Lake City, Utah; CFC-11, CFC-12, CFC-113, and SF6 at USGS Chlorofluorocarbon (CFC) Laboratory in Reston, Virginia. Abbreviations: °C, degrees Celsius; μS/cm, microsiemens per centimeter at 25 degrees Celsius; mg/L, milligrams per liter; mm Hg, millimeters of mercury; TU, tritium units; pmol/kg, picomoles per kilogram; fmol/kg, femtomoles per kilogram; —, no data available; E, estimated; >, greater than; <, less than]
Site name Datesampled
Water temperature
(°C)
Specific conductance
(μS/cm)
pH (standard
units)
Dissolved oxygen (mg/L)
Total dissolved-gas
pressure (mm Hg)
Dissolved or-ganic carbon
(mg/L)
Tritium (TU)
Tritium precision
(TU)
CFC-11 (pmol/
kg)
CFC-12 (pmol/
kg)
CFC-113 (pmol/
kg)
SF6 (fmol/
kg)
WD 6 9/20/04 19.6 820 7.7 15.0 1,270 — — — — — — —10/28/04 19.0 810 7.6 13.5 1,240 — — — — — — —2/9/05 19.2 450 7.9 14.6 1,460 — — — — — — —4/5/05 19.2 460 7.6 15.5 1,490 — — — — — — —1/19/06 18.9 680 7.6 17.7 11,700 — — — — — — —2/15/07 19.1 1,110 7.6 17.2 11,600 — — — — — — —3/13/08 19.2 1,300 7.5 14.4 11,590 — 2.11 0.14 — — — —4/29/08 19.3 1,290 7.7 17.1 11,590 — — — — — — —6/3/08 19.4 1,330 7.6 16.5 11,590 — — — — — — —10/24/08 19.0 1,190 — 16.3 11,540 — 2.55 0.13 2.8 1.3 0.15 0.724/30/09 19.2 1,050 7.7 22.0 11,810 — 2.66 0.14 3.2 1.5 0.16 0.7311/23/09 18.9 970 7.9 15.3 11,650 1.71 2.93 0.23 1.7 1.8 0.17 —3/15/10 19.2 920 7.5 14.4 1,200 1.68 3.15 0.15 1.7 1.6 0.19 —3/9/11 19.1 900 7.5 11.2 21,410 1.56 1.54 0.10 2.64 1.73 0.20 0.65
(replicate) 3/9/11 19.1 900 7.5 11.2 21,410 1.59 2.83 0.13 2.64 1.73 0.20 0.722/7/12 19.1 810 7.3 15.6 11,700 1.70 2.88 0.31 2.23 1.67 0.18 0.874/16/13 18.9 810 7.0 11.8 11,600 1.18 2.52 0.14 2.1 1.9 0.19 0.714/29/14 19.0 810 7.3 10.1 11,550 0.92 2.85 0.11 2.0 1.9 0.19 0.874/28/15 19.1 820 7.6 14.7 11,630 0.98 2.76 0.11 2.1 1.8 0.19 0.703/22/16 18.8 850 7.7 13.2 11,610 0.78 2.55 0.15 1.6 1.6 0.12 0.58
WD 8 5/21/01 — 300 7.7 — — — 4.13 0.38 — — — —9/12/01 18.7 305 7.7 9.6 890 — 2.98 0.15 — — — —9/9/02 18.9 305 7.9 — 840 — 3.89 0.19 — — — —3/20/03 18.7 335 7.6 7.8 910 — — — — — — —5/8/03 18.6 340 7.5 4.6 880 — — — — — — —10/16/03 — 360 7.4 — — — — — — — — —2/7/12 18.5 250 7.1 20.8 22,300 0.75 3.36 0.33 1.93 1.71 0.16 —4/16/13 18.5 350 7.1 21.1 1>2,290 0.52 3.14 0.16 2.02 1.69 0.16 0.424/30/14 18.7 380 7.8 25.9 11,620 0.64 3.07 0.15 2.00 1.80 0.18 0.214/28/15 19.1 380 7.9 25.7 1>2,170 0.51 2.80 0.13 1.97 1.73 0.18 0.363/22/16 18.7 340 7.9 25.6 1>2,170 0.39 2.89 0.35 1.19 1.57 0.10 0.13
WD 9 5/23/01 19.5 300 7.7 8.0 800 — 0.00 0.01 — — — —9/14/01 19.4 280 7.4 — 790 — 0.20 0.15 — — — —9/11/02 19.5 350 7.9 — 980 — — — — — — —5/7/03 19.7 320 7.8 — 1>2,250 — — — — — — —6/9/03 19.5 350 7.7 24.4 1>2,250 — — — — — — —8/5/03 19.7 720 7.5 19.3 11,800 — — — — — — —10/7/03 19.6 740 7.5 17.9 11,600 — — — — — — —1/6/04 19.4 630 7.7 16.7 11,700 — — — — — — —5/3/04 19.4 530 7.4 25.7 1>2,250 — — — — — — —9/20/04 18.5 750 7.8 22.6 1>2,250 — — — — — — —10/28/04 18.5 760 7.6 20.7 12,210 — — — — — — —2/9/05 18.4 880 7.7 20.2 1>2,250 — — — — — — —4/5/05 18.5 820 7.4 23.2 1>2,250 — — — — — — —1/18/06 18.0 1,230 7.9 15.0 11,900 — — — — — — —2/14/07 17.3 790 7.4 4.6 11,600 — — — — — — —3/11/08 17.0 820 7.3 1.5 1,080 — 2.61 0.22 — — — —4/27/09 16.6 830 7.4 1.8 840 — 2.99 0.12 1.2 2.2 0.19 2.15
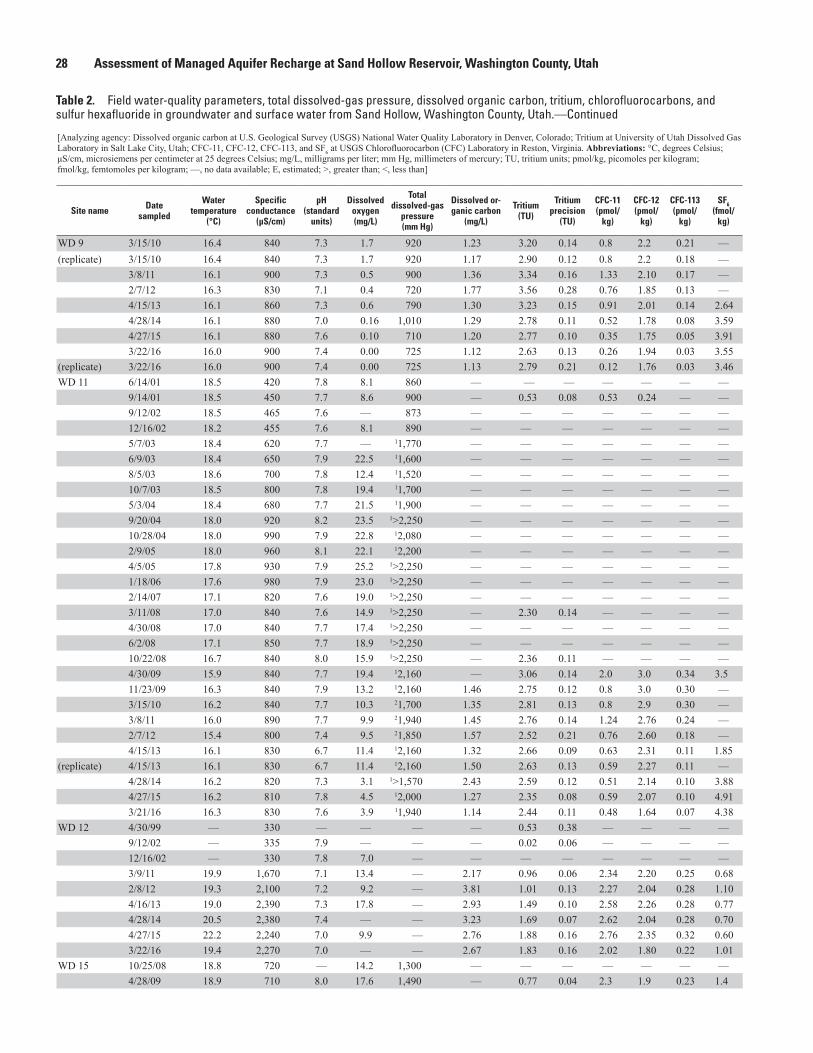
28 Assessment of Managed Aquifer Recharge at Sand Hollow Reservoir, Washington County, Utah
Table 2. Field water-quality parameters, total dissolved-gas pressure, dissolved organic carbon, tritium, chlorofluorocarbons, and sulfur hexafluoride in groundwater and surface water from Sand Hollow, Washington County, Utah.—Continued
[Analyzing agency: Dissolved organic carbon at U.S. Geological Survey (USGS) National Water Quality Laboratory in Denver, Colorado; Tritium at University of Utah Dissolved Gas Laboratory in Salt Lake City, Utah; CFC-11, CFC-12, CFC-113, and SF6 at USGS Chlorofluorocarbon (CFC) Laboratory in Reston, Virginia. Abbreviations: °C, degrees Celsius; μS/cm, microsiemens per centimeter at 25 degrees Celsius; mg/L, milligrams per liter; mm Hg, millimeters of mercury; TU, tritium units; pmol/kg, picomoles per kilogram; fmol/kg, femtomoles per kilogram; —, no data available; E, estimated; >, greater than; <, less than]
Site name Datesampled
Water temperature
(°C)
Specific conductance
(μS/cm)
pH (standard
units)
Dissolved oxygen (mg/L)
Total dissolved-gas
pressure (mm Hg)
Dissolved or-ganic carbon
(mg/L)
Tritium (TU)
Tritium precision
(TU)
CFC-11 (pmol/
kg)
CFC-12 (pmol/
kg)
CFC-113 (pmol/
kg)
SF6 (fmol/
kg)
WD 9 3/15/10 16.4 840 7.3 1.7 920 1.23 3.20 0.14 0.8 2.2 0.21 —(replicate) 3/15/10 16.4 840 7.3 1.7 920 1.17 2.90 0.12 0.8 2.2 0.18 —
3/8/11 16.1 900 7.3 0.5 900 1.36 3.34 0.16 1.33 2.10 0.17 —2/7/12 16.3 830 7.1 0.4 720 1.77 3.56 0.28 0.76 1.85 0.13 —4/15/13 16.1 860 7.3 0.6 790 1.30 3.23 0.15 0.91 2.01 0.14 2.644/28/14 16.1 880 7.0 0.16 1,010 1.29 2.78 0.11 0.52 1.78 0.08 3.594/27/15 16.1 880 7.6 0.10 710 1.20 2.77 0.10 0.35 1.75 0.05 3.913/22/16 16.0 900 7.4 0.00 725 1.12 2.63 0.13 0.26 1.94 0.03 3.55
(replicate) 3/22/16 16.0 900 7.4 0.00 725 1.13 2.79 0.21 0.12 1.76 0.03 3.46WD 11 6/14/01 18.5 420 7.8 8.1 860 — — — — — — —
9/14/01 18.5 450 7.7 8.6 900 — 0.53 0.08 0.53 0.24 — —9/12/02 18.5 465 7.6 — 873 — — — — — — —12/16/02 18.2 455 7.6 8.1 890 — — — — — — —5/7/03 18.4 620 7.7 — 11,770 — — — — — — —6/9/03 18.4 650 7.9 22.5 11,600 — — — — — — —8/5/03 18.6 700 7.8 12.4 11,520 — — — — — — —10/7/03 18.5 800 7.8 19.4 11,700 — — — — — — —5/3/04 18.4 680 7.7 21.5 11,900 — — — — — — —9/20/04 18.0 920 8.2 23.5 1>2,250 — — — — — — —10/28/04 18.0 990 7.9 22.8 12,080 — — — — — — —2/9/05 18.0 960 8.1 22.1 12,200 — — — — — — —4/5/05 17.8 930 7.9 25.2 1>2,250 — — — — — — —1/18/06 17.6 980 7.9 23.0 1>2,250 — — — — — — —2/14/07 17.1 820 7.6 19.0 1>2,250 — — — — — — —3/11/08 17.0 840 7.6 14.9 1>2,250 — 2.30 0.14 — — — —4/30/08 17.0 840 7.7 17.4 1>2,250 — — — — — — —6/2/08 17.1 850 7.7 18.9 1>2,250 — — — — — — —10/22/08 16.7 840 8.0 15.9 1>2,250 — 2.36 0.11 — — — —4/30/09 15.9 840 7.7 19.4 12,160 — 3.06 0.14 2.0 3.0 0.34 3.511/23/09 16.3 840 7.9 13.2 12,160 1.46 2.75 0.12 0.8 3.0 0.30 —3/15/10 16.2 840 7.7 10.3 21,700 1.35 2.81 0.13 0.8 2.9 0.30 —3/8/11 16.0 890 7.7 9.9 21,940 1.45 2.76 0.14 1.24 2.76 0.24 —2/7/12 15.4 800 7.4 9.5 21,850 1.57 2.52 0.21 0.76 2.60 0.18 —4/15/13 16.1 830 6.7 11.4 12,160 1.32 2.66 0.09 0.63 2.31 0.11 1.85
(replicate) 4/15/13 16.1 830 6.7 11.4 12,160 1.50 2.63 0.13 0.59 2.27 0.11 —4/28/14 16.2 820 7.3 3.1 1>1,570 2.43 2.59 0.12 0.51 2.14 0.10 3.884/27/15 16.2 810 7.8 4.5 12,000 1.27 2.35 0.08 0.59 2.07 0.10 4.913/21/16 16.3 830 7.6 3.9 11,940 1.14 2.44 0.11 0.48 1.64 0.07 4.38
WD 12 4/30/99 — 330 — — — — 0.53 0.38 — — — —9/12/02 — 335 7.9 — — — 0.02 0.06 — — — —12/16/02 — 330 7.8 7.0 — — — — — — — —3/9/11 19.9 1,670 7.1 13.4 — 2.17 0.96 0.06 2.34 2.20 0.25 0.682/8/12 19.3 2,100 7.2 9.2 — 3.81 1.01 0.13 2.27 2.04 0.28 1.104/16/13 19.0 2,390 7.3 17.8 — 2.93 1.49 0.10 2.58 2.26 0.28 0.774/28/14 20.5 2,380 7.4 — — 3.23 1.69 0.07 2.62 2.04 0.28 0.704/27/15 22.2 2,240 7.0 9.9 — 2.76 1.88 0.16 2.76 2.35 0.32 0.603/22/16 19.4 2,270 7.0 — — 2.67 1.83 0.16 2.02 1.80 0.22 1.01
WD 15 10/25/08 18.8 720 — 14.2 1,300 — — — — — — —4/28/09 18.9 710 8.0 17.6 1,490 — 0.77 0.04 2.3 1.9 0.23 1.4
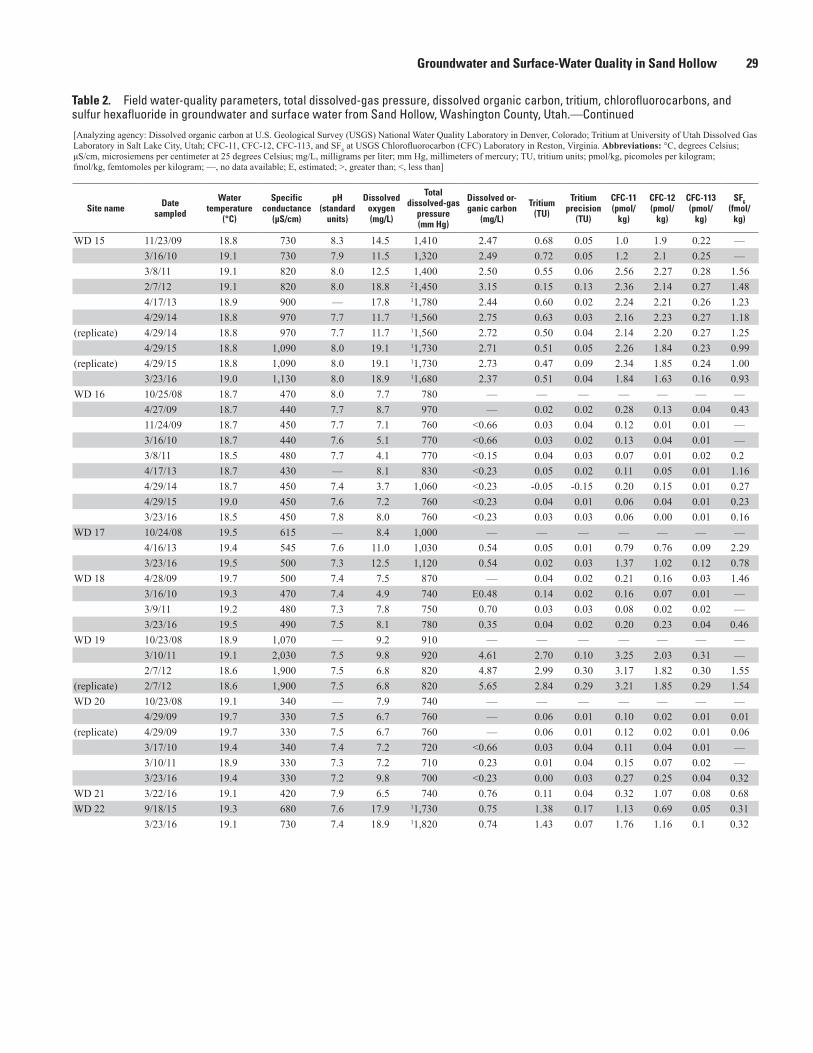
Groundwater and Surface-Water Quality in Sand Hollow 29
Table 2. Field water-quality parameters, total dissolved-gas pressure, dissolved organic carbon, tritium, chlorofluorocarbons, and sulfur hexafluoride in groundwater and surface water from Sand Hollow, Washington County, Utah.—Continued [Analyzing agency: Dissolved organic carbon at U.S. Geological Survey (USGS) National Water Quality Laboratory in Denver, Colorado; Tritium at University of Utah Dissolved Gas Laboratory in Salt Lake City, Utah; CFC-11, CFC-12, CFC-113, and SF6 at USGS Chlorofluorocarbon (CFC) Laboratory in Reston, Virginia. Abbreviations: °C, degrees Celsius; μS/cm, microsiemens per centimeter at 25 degrees Celsius; mg/L, milligrams per liter; mm Hg, millimeters of mercury; TU, tritium units; pmol/kg, picomoles per kilogram; fmol/kg, femtomoles per kilogram; —, no data available; E, estimated; >, greater than; <, less than]
Site name Datesampled
Water temperature
(°C)
Specific conductance
(μS/cm)
pH (standard
units)
Dissolved oxygen (mg/L)
Total dissolved-gas
pressure (mm Hg)
Dissolved or-ganic carbon
(mg/L)
Tritium (TU)
Tritium precision
(TU)
CFC-11 (pmol/
kg)
CFC-12 (pmol/
kg)
CFC-113 (pmol/
kg)
SF6 (fmol/
kg)
WD 15 11/23/09 18.8 730 8.3 14.5 1,410 2.47 0.68 0.05 1.0 1.9 0.22 —3/16/10 19.1 730 7.9 11.5 1,320 2.49 0.72 0.05 1.2 2.1 0.25 —3/8/11 19.1 820 8.0 12.5 1,400 2.50 0.55 0.06 2.56 2.27 0.28 1.562/7/12 19.1 820 8.0 18.8 21,450 3.15 0.15 0.13 2.36 2.14 0.27 1.484/17/13 18.9 900 — 17.8 11,780 2.44 0.60 0.02 2.24 2.21 0.26 1.234/29/14 18.8 970 7.7 11.7 11,560 2.75 0.63 0.03 2.16 2.23 0.27 1.18
(replicate) 4/29/14 18.8 970 7.7 11.7 11,560 2.72 0.50 0.04 2.14 2.20 0.27 1.254/29/15 18.8 1,090 8.0 19.1 11,730 2.71 0.51 0.05 2.26 1.84 0.23 0.99
(replicate) 4/29/15 18.8 1,090 8.0 19.1 11,730 2.73 0.47 0.09 2.34 1.85 0.24 1.003/23/16 19.0 1,130 8.0 18.9 11,680 2.37 0.51 0.04 1.84 1.63 0.16 0.93
WD 16 10/25/08 18.7 470 8.0 7.7 780 — — — — — — —4/27/09 18.7 440 7.7 8.7 970 — 0.02 0.02 0.28 0.13 0.04 0.4311/24/09 18.7 450 7.7 7.1 760 <0.66 0.03 0.04 0.12 0.01 0.01 —3/16/10 18.7 440 7.6 5.1 770 <0.66 0.03 0.02 0.13 0.04 0.01 —3/8/11 18.5 480 7.7 4.1 770 <0.15 0.04 0.03 0.07 0.01 0.02 0.24/17/13 18.7 430 — 8.1 830 <0.23 0.05 0.02 0.11 0.05 0.01 1.164/29/14 18.7 450 7.4 3.7 1,060 <0.23 -0.05 -0.15 0.20 0.15 0.01 0.274/29/15 19.0 450 7.6 7.2 760 <0.23 0.04 0.01 0.06 0.04 0.01 0.233/23/16 18.5 450 7.8 8.0 760 <0.23 0.03 0.03 0.06 0.00 0.01 0.16
WD 17 10/24/08 19.5 615 — 8.4 1,000 — — — — — — —4/16/13 19.4 545 7.6 11.0 1,030 0.54 0.05 0.01 0.79 0.76 0.09 2.293/23/16 19.5 500 7.3 12.5 1,120 0.54 0.02 0.03 1.37 1.02 0.12 0.78
WD 18 4/28/09 19.7 500 7.4 7.5 870 — 0.04 0.02 0.21 0.16 0.03 1.463/16/10 19.3 470 7.4 4.9 740 E0.48 0.14 0.02 0.16 0.07 0.01 —3/9/11 19.2 480 7.3 7.8 750 0.70 0.03 0.03 0.08 0.02 0.02 —3/23/16 19.5 490 7.5 8.1 780 0.35 0.04 0.02 0.20 0.23 0.04 0.46
WD 19 10/23/08 18.9 1,070 — 9.2 910 — — — — — — —3/10/11 19.1 2,030 7.5 9.8 920 4.61 2.70 0.10 3.25 2.03 0.31 —2/7/12 18.6 1,900 7.5 6.8 820 4.87 2.99 0.30 3.17 1.82 0.30 1.55
(replicate) 2/7/12 18.6 1,900 7.5 6.8 820 5.65 2.84 0.29 3.21 1.85 0.29 1.54WD 20 10/23/08 19.1 340 — 7.9 740 — — — — — — —
4/29/09 19.7 330 7.5 6.7 760 — 0.06 0.01 0.10 0.02 0.01 0.01(replicate) 4/29/09 19.7 330 7.5 6.7 760 — 0.06 0.01 0.12 0.02 0.01 0.06
3/17/10 19.4 340 7.4 7.2 720 <0.66 0.03 0.04 0.11 0.04 0.01 —3/10/11 18.9 330 7.3 7.2 710 0.23 0.01 0.04 0.15 0.07 0.02 —3/23/16 19.4 330 7.2 9.8 700 <0.23 0.00 0.03 0.27 0.25 0.04 0.32
WD 21 3/22/16 19.1 420 7.9 6.5 740 0.76 0.11 0.04 0.32 1.07 0.08 0.68WD 22 9/18/15 19.3 680 7.6 17.9 11,730 0.75 1.38 0.17 1.13 0.69 0.05 0.31
3/23/16 19.1 730 7.4 18.9 11,820 0.74 1.43 0.07 1.76 1.16 0.1 0.32
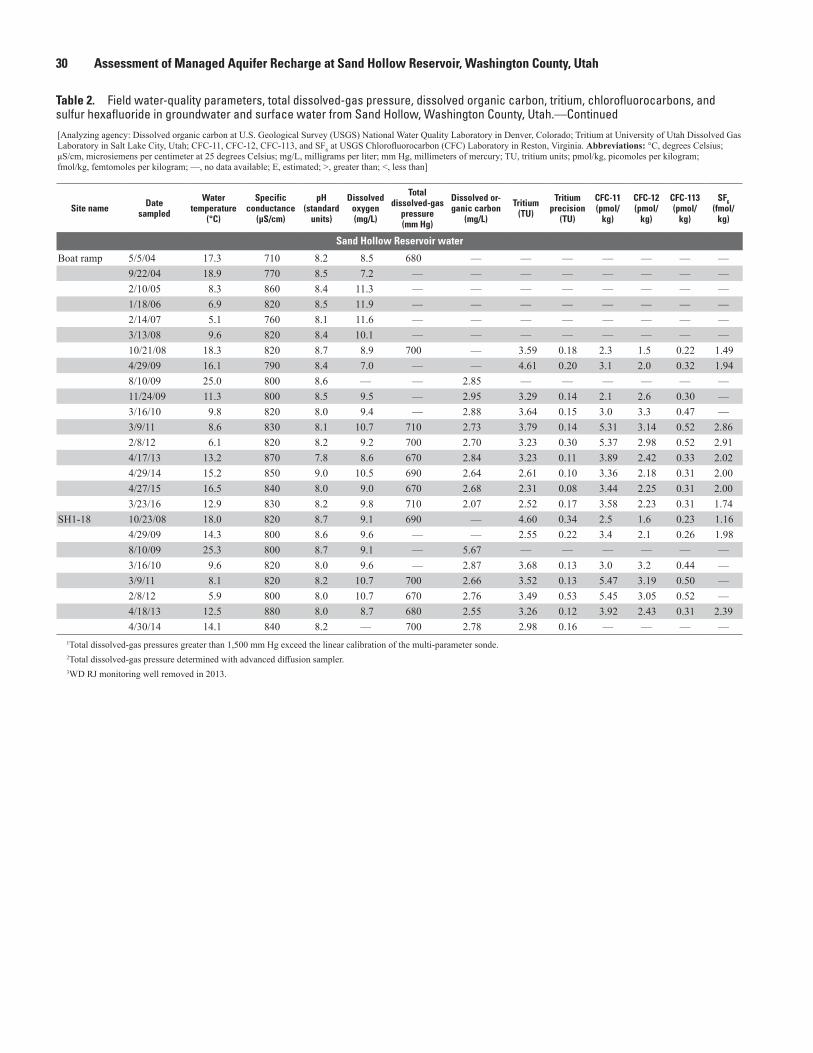
30 Assessment of Managed Aquifer Recharge at Sand Hollow Reservoir, Washington County, Utah
Table 2. Field water-quality parameters, total dissolved-gas pressure, dissolved organic carbon, tritium, chlorofluorocarbons, and sulfur hexafluoride in groundwater and surface water from Sand Hollow, Washington County, Utah.—Continued [Analyzing agency: Dissolved organic carbon at U.S. Geological Survey (USGS) National Water Quality Laboratory in Denver, Colorado; Tritium at University of Utah Dissolved Gas Laboratory in Salt Lake City, Utah; CFC-11, CFC-12, CFC-113, and SF6 at USGS Chlorofluorocarbon (CFC) Laboratory in Reston, Virginia. Abbreviations: °C, degrees Celsius; μS/cm, microsiemens per centimeter at 25 degrees Celsius; mg/L, milligrams per liter; mm Hg, millimeters of mercury; TU, tritium units; pmol/kg, picomoles per kilogram; fmol/kg, femtomoles per kilogram; —, no data available; E, estimated; >, greater than; <, less than]
Site name Datesampled
Water temperature
(°C)
Specific conductance
(μS/cm)
pH (standard
units)
Dissolved oxygen (mg/L)
Total dissolved-gas
pressure (mm Hg)
Dissolved or-ganic carbon
(mg/L)
Tritium (TU)
Tritium precision
(TU)
CFC-11 (pmol/
kg)
CFC-12 (pmol/
kg)
CFC-113 (pmol/
kg)
SF6 (fmol/
kg)
Sand Hollow Reservoir water
Boat ramp 5/5/04 17.3 710 8.2 8.5 680 — — — — — — —9/22/04 18.9 770 8.5 7.2 — — — — — — — —2/10/05 8.3 860 8.4 11.3 — — — — — — — —1/18/06 6.9 820 8.5 11.9 — — — — — — — —2/14/07 5.1 760 8.1 11.6 — — — — — — — —3/13/08 9.6 820 8.4 10.1 — — — — — — — —10/21/08 18.3 820 8.7 8.9 700 — 3.59 0.18 2.3 1.5 0.22 1.494/29/09 16.1 790 8.4 7.0 — — 4.61 0.20 3.1 2.0 0.32 1.948/10/09 25.0 800 8.6 — — 2.85 — — — — — —11/24/09 11.3 800 8.5 9.5 — 2.95 3.29 0.14 2.1 2.6 0.30 —3/16/10 9.8 820 8.0 9.4 — 2.88 3.64 0.15 3.0 3.3 0.47 —3/9/11 8.6 830 8.1 10.7 710 2.73 3.79 0.14 5.31 3.14 0.52 2.862/8/12 6.1 820 8.2 9.2 700 2.70 3.23 0.30 5.37 2.98 0.52 2.914/17/13 13.2 870 7.8 8.6 670 2.84 3.23 0.11 3.89 2.42 0.33 2.024/29/14 15.2 850 9.0 10.5 690 2.64 2.61 0.10 3.36 2.18 0.31 2.004/27/15 16.5 840 8.0 9.0 670 2.68 2.31 0.08 3.44 2.25 0.31 2.003/23/16 12.9 830 8.2 9.8 710 2.07 2.52 0.17 3.58 2.23 0.31 1.74
SH1-18 10/23/08 18.0 820 8.7 9.1 690 — 4.60 0.34 2.5 1.6 0.23 1.164/29/09 14.3 800 8.6 9.6 — — 2.55 0.22 3.4 2.1 0.26 1.988/10/09 25.3 800 8.7 9.1 — 5.67 — — — — — —3/16/10 9.6 820 8.0 9.6 — 2.87 3.68 0.13 3.0 3.2 0.44 —3/9/11 8.1 820 8.2 10.7 700 2.66 3.52 0.13 5.47 3.19 0.50 —2/8/12 5.9 800 8.0 10.7 670 2.76 3.49 0.53 5.45 3.05 0.52 —4/18/13 12.5 880 8.0 8.7 680 2.55 3.26 0.12 3.92 2.43 0.31 2.394/30/14 14.1 840 8.2 — 700 2.78 2.98 0.16 — — — —
1Total dissolved-gas pressures greater than 1,500 mm Hg exceed the linear calibration of the multi-parameter sonde.2Total dissolved-gas pressure determined with advanced diffusion sampler. 3WD RJ monitoring well removed in 2013.

Groundwater and Surface-Water Quality in Sand Hollow 31
Table 3. Field measurements and concentrations of major ions, selected trace elements, and nutrients in groundwater and surface water from selected sites in Sand Hollow, Washington County, Utah.[°C, degrees Celsius; μS/cm, microsiemens per centimeter at 25 degrees Celsius; mg/L, milligrams per liter; Cl/Br, chloride to bromide ratio; µg/L, micrograms per liter; µg/L, micrograms per liter; —, no data available; <, less than; E, estimated; ft, feet]
Site name DateTemper-
ature(ºC)
Specific conductance
(μS/cm)
pH(standard
units)
Dissolved oxygen (mg/L)
Dissolved- solids con- centration
(mg/L)
Calcium (mg/L as Ca)
Magnesium (mg/L as Mg)
Sodium (mg/L as Na)
Potassium (mg/L as K)
Alkalinity as CaCO3 (mg/L)
Sulfate(mg/L as SO4)
Groundwater North Dam 3A 10/8/02 15.9 4,430 8.0 5.0 3,020 150 160 590 2.0 148 1,020
12/18/02 14.7 2,830 8.0 10.8 1,890 110 110 340 3.6 155 5843/16/10 22.8 864 7.6 1.3 554 65.8 38.0 51.2 3.0 177 1873/10/11 20.3 834 7.4 0.82 538 68.0 36.7 59.0 3.40 170 1812/6/12 11.3 820 7.8 — 523 64.8 35.9 58.0 3.36 180 1744/15/13 25.7 870 — 1.60 571 68.6 39.4 63.7 3.67 181 2014/29/14 23.6 912 8.0 0.32 572 68.8 39.1 64.0 3.67 183 193
WD 4 12/18/02 18.7 350 7.7 8.1 205 29 17 16 2.1 125 18.111/24/09 18.7 338 7.8 9.5 197 28.7 16.6 15.1 2.1 121 20.63/15/10 19.7 362 7.7 9.5 217 27.3 16.2 13.3 2.1 129 19.73/10/11 19.7 361 7.4 10.5 208 31.2 18.3 15.2 2.2 125 21.8
(1) 2/8/12 19.5 549 7.3 8.9 325 44.8 26.6 29.5 2.6 134 68.44/15/13 19.9 696 — 22.5 421 50.8 30.8 46.5 2.91 140 1034/29/14 20.5 796 7.7 10.9 486 56.3 33.2 54.3 2.94 138 1194/28/15 20.8 930 7.2 10.8 550 65.4 37.9 74.4 3.2 145 1493/22/16 19.1 957 7.3 — 596 60.1 35.1 78.0 3.4 154 166
WD 5 12/17/02 17.6 530 7.8 6.6 311 45 22 29 1.8 138 46.811/24/09 16.9 512 8.5 7.2 298 43.1 21.4 27.2 1.8 136 46.43/15/10 21.0 543 7.7 8.1 313 43.3 22.2 24.9 2.0 136 45.83/10/11 19.5 510 7.4 8.0 298 45.7 22.1 26.9 2.0 141 43.84/16/13 19.8 502 7.6 9.1 298 43.7 22.9 27.2 1.92 139 47.64/30/14 20.1 522 7.4 — 319 44.5 22.8 29.8 1.92 136 49.74/28/15 21.2 522 7.2 9.1 311 47.6 23.2 31.4 2.0 140 53.13/22/16 19.0 540 7.3 — 317 48.6 24.2 31.5 2.0 143 55.1
WD 6 9/9/02 19.4 290 7.7 — 167 37 3.4 12 1.6 93 244/30/09 19.2 1,040 7.7 22.0 660 98.5 9.0 113 1.6 169 22011/23/09 18.9 968 7.9 15.3 629 93.6 8.7 101 1.5 161 2103/15/10 19.2 923 7.5 14.4 618 94.1 8.6 86.3 1.5 166 2113/9/11 19.1 896 7.5 11.2 577 106 11.5 73.4 1.49 157 208
(replicate) 3/9/11 19.1 896 7.5 11.2 590 106 11.5 72.5 1.47 153 2082/7/12 19.1 807 7.3 15.6 542 103 11.5 58.7 1.63 152 2004/16/13 18.9 814 7.0 11.8 513 100 12.9 56.9 1.72 144 2004/29/14 19.0 814 7.3 10.1 516 99 12.7 55.9 1.91 122 1864/28/15 21.2 522 7.2 9.1 311 47.6 23.2 31.4 2.0 140 53.13/22/16 19.0 540 7.3 — 317 48.6 24.2 31.5 2.0 143 55.1
WD RJ 12/17/02 18.2 530 7.7 6.4 309 47 22 27 2.3 137 463/15/10 19.6 560 7.6 8.0 338 46.6 22.6 25.1 2.3 139 47.93/9/11 19.6 539 7.3 7.5 324 48.9 23.1 28 2.4 143 47.3
WD 7 9/10/01 18.8 380 7.8 9.8 — 37 12 25 1.9 137 28WD 8 9/9/02 18.9 305 7.9 — 173 37 10 8.9 2.3 116 15
2/7/12 18.5 251 7.1 20.8 179 47.1 4.0 6.6 1.6 95 25.94/16/13 18.5 353 7.1 21.1 247 58.6 4.6 11.9 1.7 103 47.24/30/14 18.7 379 7.8 25.9 236 58.1 4.8 13.5 1.8 102 50.94/28/15 19.1 384 7.9 25.7 239 57.9 5.1 13.5 1.9 101 50.23/22/16 18.7 342 7.9 25.6 201 55.0 4.9 11.6 1.9 95.2 39.9

32 Assessment of Managed Aquifer Recharge at Sand Hollow Reservoir, Washington County, Utah
Table 3. Field measurements and concentrations of major ions, selected trace elements, and nutrients in groundwater and surface water from selected sites in Sand Hollow, Washington County, Utah.—Continued [°C, degrees Celsius; μS/cm, microsiemens per centimeter at 25 degrees Celsius; mg/L, milligrams per liter; Cl/Br, chloride to bromide ratio; µg/L, micrograms per liter; µg/L, micrograms per liter; —, no data available; <, less than; E, estimated; ft, feet]
Site name Chloride (mg/L as Cl)
Fluoride (mg/L as F)
Bromide (mg/L as Br) Cl/Br
Silica(mg/L as
SiO2)
Iron(μg/L as Fe)
Manganese (μg/L as
Mn)
Arsenic (μg/L as As)
Nitrogen(nitrite + nitrate)
(mg/L as N)
Nitrogen, nitrite
(mg/L as N)
Nitrogen, ammonia
(mg/L as N)
Phosphorus (orthophos-
phate)(mg/L as P)
Groundwater North Dam 3A 744 0.90 41.2 18 13.0 <30 <5 90.1 17.8 <0.008 0.03 0.030
476 0.79 2.44 195 14.0 <30 <5 63.9 14.3 <0.008 <0.04 0.03055.2 0.43 0.06 882 15.7 <6 3.19 35.2 <0.04 E0.001 E0.01 0.03558.3 0.45 0.06 936 15.5 <3.2 3.48 35.2 0.03 <0.001 0.07 0.03355.4 0.39 0.07 778 16.3 12.6 17.3 34.0 0.07 <0.001 0.21 0.03760.4 0.34 0.08 715 15.0 4.2 26.1 35.6 0.04 <0.001 0.31 0.03860 0.37 0.06 938 15.0 <4 21.2 34.5 0.04 <0.001 0.38 0.038
WD 4 18.8 0.23 0.08 235 14 <10 <2 13.2 2.35 <0.008 <0.04 0.0217.2 0.23 0.10 179 14.3 E3.8 <0.2 14.7 2.29 <0.002 <0.02 0.0317.9 0.25 0.10 184 15.7 <6 <0.2 14.4 2.29 <0.002 <0.02 0.0320.2 0.25 0.14 150 15.3 <3.2 0.19 13.7 2.25 <0.001 <0.01 0.03
(1) 54.5 0.20 0.42 128 15.7 4.5 0.37 11.9 2.21 <0.001 <0.01 0.0272.9 0.19 0.54 135 14.5 7.2 0.75 12.2 2.16 <0.001 <0.01 0.02593.6 0.21 0.63 149 14.5 <4.0 0.26 11.8 2.22 <0.001 <0.01 0.022
112.0 0.21 0.77 145 15.3 <4.0 0.22 11.6 2.12 <0.001 <0.01 0.026116.0 0.26 0.76 153 16.4 <4.0 <0.20 12.1 2.10 <0.001 0.01 0.025
WD 5 44.8 0.29 0.16 280 13 <10 E1 9.1 4.18 <0.008 <0.04 E0.0137.9 0.27 0.23 168 13.4 <6 <0.2 9.6 4.61 <0.002 <0.02 0.0239.2 0.28 0.24 164 15 <6 <0.2 9.0 4.60 <0.002 <0.02 0.0138.2 0.31 0.21 179 14.3 <3.2 0.19 9.3 4.60 <0.001 <0.01 0.0140.3 0.24 0.22 187 13.6 4.8 0.41 9.2 4.73 <0.001 <0.01 0.01242.8 0.26 0.23 189 13.7 <4.0 <0.02 9.4 4.73 <0.001 <0.01 0.01045.8 0.24 0.25 185 14.4 <4.0 <0.20 8.9 4.70 <0.001 <0.01 0.01347.3 0.29 0.26 179 14.4 <4.0 <0.20 8.9 4.82 <0.001 <0.01 0.011
WD 6 15.0 E0.08 0.16 94 13.3 <10 E2 2.0 E1.6 <0.008 <0.04 0.02092.5 0.32 0.31 295 13.2 <4 0.23 3.3 1.20 <0.002 <0.02 0.01180.3 0.30 0.28 286 12.2 <6 <0.2 3.3 1.06 <0.002 <0.02 0.01277.9 0.32 0.24 322 13.4 20.8 0.32 3.0 0.97 <0.002 <0.02 0.01363.5 0.30 0.14 457 13.5 6.3 0.40 2.8 0.71 <0.001 <0.01 0.010
(replicate) 63.3 0.32 0.14 455 13.6 6.1 0.31 2.8 0.70 0.001 <0.01 0.00954.8 0.22 0.08 684 13.9 17.6 0.75 2.3 0.47 <0.001 0.02 0.01157.2 0.18 0.07 840 12.9 20.3 0.88 2.3 0.34 <0.001 <0.01 0.00953.8 0.18 0.06 928 12.7 10.5 0.50 2.1 0.32 <0.001 <0.01 0.01253.7 0.16 0.06 895 13.5 6.1 0.46 2.2 0.243 <0.001 <0.01 0.01261.3 0.24 0.05 1,157 13.7 9.5 0.55 2.2 0.285 <0.001 <0.01 0.012
WD RJ 47.8 0.51 0.20 239 14 <10 <2 7.9 3.28 <0.008 <0.04 0.0147.2 0.51 0.27 176 15.3 <6 <0.2 8.3 3.28 <0.002 E0.01 0.0247.4 0.54 0.24 196 14.5 <3.2 0.18 8.5 3.34 <0.001 <0.01 0.01
WD 7 18.0 0.3 0.13 139 14 <10 <3 6.0 3.80 <0.008 <0.04 0.02WD 8 10.1 0.1 0.07 144 14 <10 <2 6.0 3.90 <0.008 <0.04 0.02
13.6 0.1 0.08 173 13.8 7.4 0.99 11.5 3.33 <0.001 <0.01 0.0219.4 0.07 0.12 169 13.4 11.7 2.25 10.6 3.52 <0.001 <0.01 0.01420.5 0.07 0.10 199 13.5 9.3 2.07 10.0 3.60 <0.001 <0.01 0.01520.8 0.07 0.11 193 14.2 20.0 1.19 8.7 3.52 <0.001 <0.01 0.01717.6 0.08 0.09 189 14.2 9.5 1.01 10.0 3.25 0.001 0.01 0.016
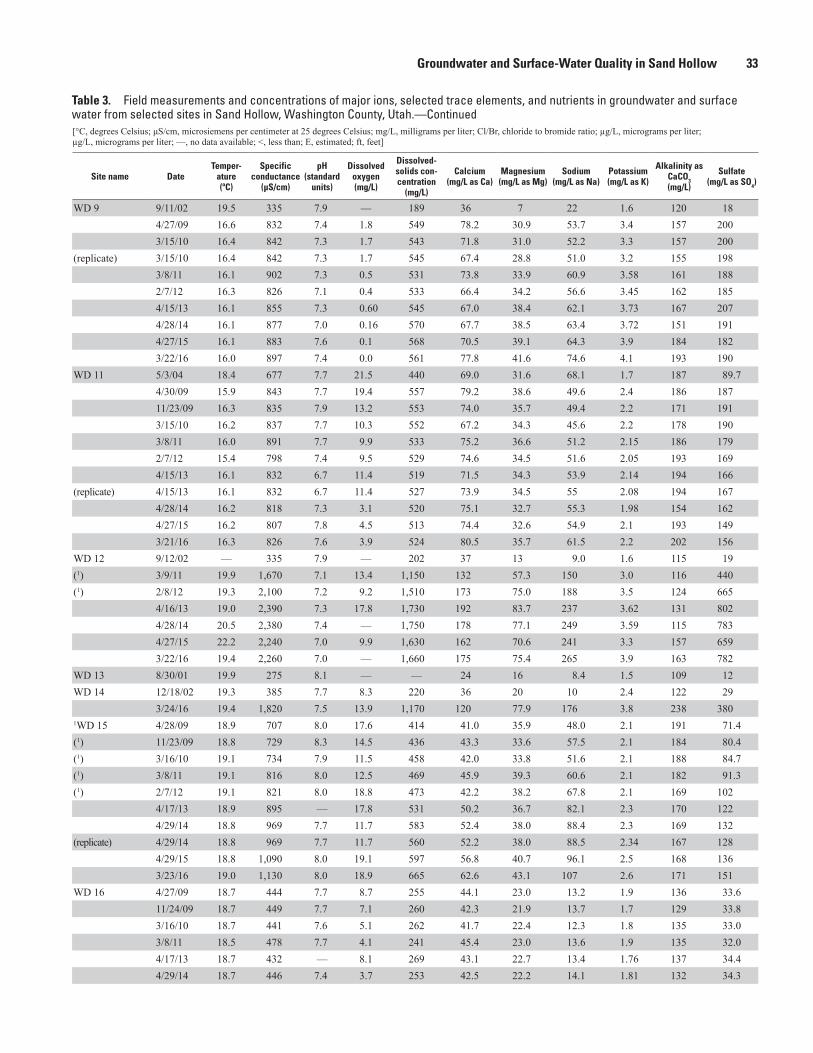
Groundwater and Surface-Water Quality in Sand Hollow 33
Table 3. Field measurements and concentrations of major ions, selected trace elements, and nutrients in groundwater and surface water from selected sites in Sand Hollow, Washington County, Utah.—Continued [°C, degrees Celsius; μS/cm, microsiemens per centimeter at 25 degrees Celsius; mg/L, milligrams per liter; Cl/Br, chloride to bromide ratio; µg/L, micrograms per liter; µg/L, micrograms per liter; —, no data available; <, less than; E, estimated; ft, feet]
Site name DateTemper-
ature(ºC)
Specific conductance
(μS/cm)
pH(standard
units)
Dissolved oxygen (mg/L)
Dissolved- solids con- centration
(mg/L)
Calcium (mg/L as Ca)
Magnesium (mg/L as Mg)
Sodium (mg/L as Na)
Potassium (mg/L as K)
Alkalinity as CaCO3 (mg/L)
Sulfate(mg/L as SO4)
WD 9 9/11/02 19.5 335 7.9 — 189 36 7 22 1.6 120 184/27/09 16.6 832 7.4 1.8 549 78.2 30.9 53.7 3.4 157 2003/15/10 16.4 842 7.3 1.7 543 71.8 31.0 52.2 3.3 157 200
(replicate) 3/15/10 16.4 842 7.3 1.7 545 67.4 28.8 51.0 3.2 155 1983/8/11 16.1 902 7.3 0.5 531 73.8 33.9 60.9 3.58 161 1882/7/12 16.3 826 7.1 0.4 533 66.4 34.2 56.6 3.45 162 1854/15/13 16.1 855 7.3 0.60 545 67.0 38.4 62.1 3.73 167 2074/28/14 16.1 877 7.0 0.16 570 67.7 38.5 63.4 3.72 151 1914/27/15 16.1 883 7.6 0.1 568 70.5 39.1 64.3 3.9 184 1823/22/16 16.0 897 7.4 0.0 561 77.8 41.6 74.6 4.1 193 190
WD 11 5/3/04 18.4 677 7.7 21.5 440 69.0 31.6 68.1 1.7 187 89.74/30/09 15.9 843 7.7 19.4 557 79.2 38.6 49.6 2.4 186 18711/23/09 16.3 835 7.9 13.2 553 74.0 35.7 49.4 2.2 171 1913/15/10 16.2 837 7.7 10.3 552 67.2 34.3 45.6 2.2 178 1903/8/11 16.0 891 7.7 9.9 533 75.2 36.6 51.2 2.15 186 1792/7/12 15.4 798 7.4 9.5 529 74.6 34.5 51.6 2.05 193 1694/15/13 16.1 832 6.7 11.4 519 71.5 34.3 53.9 2.14 194 166
(replicate) 4/15/13 16.1 832 6.7 11.4 527 73.9 34.5 55 2.08 194 1674/28/14 16.2 818 7.3 3.1 520 75.1 32.7 55.3 1.98 154 1624/27/15 16.2 807 7.8 4.5 513 74.4 32.6 54.9 2.1 193 1493/21/16 16.3 826 7.6 3.9 524 80.5 35.7 61.5 2.2 202 156
WD 12 9/12/02 — 335 7.9 — 202 37 13 9.0 1.6 115 19(1) 3/9/11 19.9 1,670 7.1 13.4 1,150 132 57.3 150 3.0 116 440(1) 2/8/12 19.3 2,100 7.2 9.2 1,510 173 75.0 188 3.5 124 665
4/16/13 19.0 2,390 7.3 17.8 1,730 192 83.7 237 3.62 131 8024/28/14 20.5 2,380 7.4 — 1,750 178 77.1 249 3.59 115 7834/27/15 22.2 2,240 7.0 9.9 1,630 162 70.6 241 3.3 157 6593/22/16 19.4 2,260 7.0 — 1,660 175 75.4 265 3.9 163 782
WD 13 8/30/01 19.9 275 8.1 — — 24 16 8.4 1.5 109 12WD 14 12/18/02 19.3 385 7.7 8.3 220 36 20 10 2.4 122 29
3/24/16 19.4 1,820 7.5 13.9 1,170 120 77.9 176 3.8 238 3801WD 15 4/28/09 18.9 707 8.0 17.6 414 41.0 35.9 48.0 2.1 191 71.4(1) 11/23/09 18.8 729 8.3 14.5 436 43.3 33.6 57.5 2.1 184 80.4(1) 3/16/10 19.1 734 7.9 11.5 458 42.0 33.8 51.6 2.1 188 84.7(1) 3/8/11 19.1 816 8.0 12.5 469 45.9 39.3 60.6 2.1 182 91.3(1) 2/7/12 19.1 821 8.0 18.8 473 42.2 38.2 67.8 2.1 169 102
4/17/13 18.9 895 — 17.8 531 50.2 36.7 82.1 2.3 170 1224/29/14 18.8 969 7.7 11.7 583 52.4 38.0 88.4 2.3 169 132
(replicate) 4/29/14 18.8 969 7.7 11.7 560 52.2 38.0 88.5 2.34 167 1284/29/15 18.8 1,090 8.0 19.1 597 56.8 40.7 96.1 2.5 168 1363/23/16 19.0 1,130 8.0 18.9 665 62.6 43.1 107 2.6 171 151
WD 16 4/27/09 18.7 444 7.7 8.7 255 44.1 23.0 13.2 1.9 136 33.611/24/09 18.7 449 7.7 7.1 260 42.3 21.9 13.7 1.7 129 33.83/16/10 18.7 441 7.6 5.1 262 41.7 22.4 12.3 1.8 135 33.03/8/11 18.5 478 7.7 4.1 241 45.4 23.0 13.6 1.9 135 32.04/17/13 18.7 432 — 8.1 269 43.1 22.7 13.4 1.76 137 34.44/29/14 18.7 446 7.4 3.7 253 42.5 22.2 14.1 1.81 132 34.3

34 Assessment of Managed Aquifer Recharge at Sand Hollow Reservoir, Washington County, Utah
Table 3. Field measurements and concentrations of major ions, selected trace elements, and nutrients in groundwater and surface water from selected sites in Sand Hollow, Washington County, Utah.—Continued [°C, degrees Celsius; μS/cm, microsiemens per centimeter at 25 degrees Celsius; mg/L, milligrams per liter; Cl/Br, chloride to bromide ratio; µg/L, micrograms per liter; µg/L, micrograms per liter; —, no data available; <, less than; E, estimated; ft, feet]
Site name Chloride (mg/L as Cl)
Fluoride (mg/L as F)
Bromide (mg/L as Br) Cl/Br
Silica(mg/L as
SiO2)
Iron(μg/L as Fe)
Manganese (μg/L as
Mn)
Arsenic (μg/L as As)
Nitrogen(nitrite + nitrate)
(mg/L as N)
Nitrogen, nitrite
(mg/L as N)
Nitrogen, ammonia
(mg/L as N)
Phosphorus (orthophos-
phate)(mg/L as P)
WD 9 21.4 0.5 0.06 357 15 9 15 12.0 0.48 <0.008 <0.04 0.0153.4 0.27 0.06 900 12.2 5 3.72 5.8 0.09 <0.002 <0.02 0.01356.6 0.24 0.05 1,040 12.1 13.6 0.68 6.1 0.09 <0.002 <0.02 0.014
(replicate) 56.3 0.27 0.05 1,083 11.9 13.5 0.57 6.1 0.09 <0.002 <0.02 0.01358.7 0.28 0.04 1,310 11.6 6.7 0.47 6.1 0.05 0.002 <0.01 0.01155.6 0.27 0.06 927 11.3 26.3 2.53 5.9 0.06 <0.001 0.01 0.01062.1 0.24 0.08 764 10.6 22.4 2.06 5.9 0.04 <0.001 0.01 0.01160.7 0.25 0.06 1,029 10.7 16.6 2.64 5.9 <0.04 0.001 0.02 0.01361.0 0.21 0.07 898 11.5 9.1 1.95 5.8 <0.04 <0.001 0.02 0.01469.2 0.26 0.06 1,116 12.3 14.5 2.97 5.6 <0.04 <0.001 0.03 0.014
WD 11 49.8 0.40 0.25 199 14.5 <6 <0.8 15.3 3.06 <0.008 <0.04 0.02049.6 0.35 0.07 687 14.0 <4 <0.2 9.6 0.99 <0.002 <0.02 0.01449.8 0.31 0.07 711 13.1 <6 <0.2 10.3 0.67 <0.002 <0.02 0.01351.8 0.32 0.07 781 14.3 18.6 0.26 10.0 0.70 <0.002 <0.02 0.01653.6 0.31 0.07 811 14.7 4.4 0.26 9.6 0.48 0.001 <0.01 0.01253.3 0.26 0.07 733 15.3 11.4 0.34 9.2 0.48 <0.001 <0.01 0.01258.1 0.19 0.08 720 14.9 14.5 0.27 8.9 0.51 <0.001 <0.01 0.012
(replicate) 58.2 0.19 0.09 658 16.2 17.9 0.86 8.8 0.52 <0.001 <0.01 0.01157.8 0.23 0.07 838 15.2 6.11 0.34 9.0 0.56 <0.001 <0.01 0.01454.1 0.19 0.08 712 16.2 5.8 <0.20 8.4 0.58 <0.001 <0.01 0.01658.4 0.22 0.08 779 17.5 5.2 <0.20 8.3 0.66 0.001 <0.01 0.015
WD 12 20.0 0.2 0.08 250 15 <10 1 10.0 2.10 <0.008 <0.04 0.02(1) 196 0.10 1.16 169 17.0 <3.2 0.35 8.2 1.89 <0.001 <0.01 0.009(1) 264 0.12 1.54 171 17.1 14.5 <0.32 7.3 1.92 <0.001 0.01 0.008
290 0.09 1.69 172 16.8 <8 <0.32 6.9 1.66 <0.001 <0.01 0.008265 0.14 1.46 182 16.9 <8 <0.4 7.2 1.43 <0.001 <0.01 0.007210 0.17 1.30 162 18.1 <4.0 <0.20 7.0 1.26 <0.001 <0.01 0.011223 0.23 1.14 196 18.7 <4.0 <0.20 7.1 1.13 <0.001 <0.01 0.009
WD 13 12.1 E0.1 0.05 258 12 <10 2 6.3 2.00 <0.006 <0.04 0.02WD 14 28.3 0.25 0.11 257 13 <10 <2 15.6 2.18 <0.008 <0.04 0.02
214.0 0.18 0.82 260 16.0 8.1 <0.20 7.5 5.46 <0.001 <0.01 0.0111WD 15 57.0 0.41 0.33 174 15 <4 0.7 28.3 3.32 E0.001 <0.02 0.02(1) 63.5 0.41 0.36 178 14 <6 0.1 28.9 3.46 <0.002 <0.02 0.02(1) 68.8 0.42 0.36 189 15 <6 <0.2 27.5 3.54 <0.002 <0.02 0.02(1) 77.0 0.40 0.43 180 14.5 <3.2 <0.16 27.6 3.78 <0.001 <0.01 0.02(1) 88.2 0.37 0.50 176 14.1 <3.2 2.08 26.7 4.32 <0.001 0.02 0.02
108 0.31 0.56 193 14.0 6.6 0.65 24.7 3.85 <0.001 <0.01 0.025117 0.34 0.58 203 13.7 <4 0.23 24.9 3.80 <0.001 <0.01 0.021
(replicate) 114 0.34 0.58 196 13.7 <4 <0.2 25.0 3.82 <0.001 <0.01 0.020127 0.32 0.67 189 14.6 <4.0 <0.20 24.4 3.72 <0.001 <0.01 0.022141 0.35 0.69 204 15.6 215 5.2 23.2 3.65 0.004 <0.01 0.023
WD 16 29.1 0.25 0.17 170 14 <4 <0.2 6.2 4.48 E0.001 <0.02 0.0128.7 0.21 0.18 158 13 <6 <0.2 6.1 4.50 <0.002 <0.02 0.0129.9 0.22 0.18 169 13.8 <6 0.79 5.9 4.44 <0.002 <0.02 0.0129.4 0.28 0.18 166 13.6 <3.2 <0.16 6.0 4.43 <0.001 <0.01 0.0130.8 0.19 0.19 164 12.9 <4 0.39 6.0 4.60 <0.001 <0.01 0.00631 0.21 0.19 165 12.7 <4 <0.2 6.1 4.57 <0.001 <0.01 0.005

Groundwater and Surface-Water Quality in Sand Hollow 35
Table 3. Field measurements and concentrations of major ions, selected trace elements, and nutrients in groundwater and surface water from selected sites in Sand Hollow, Washington County, Utah.—Continued [°C, degrees Celsius; μS/cm, microsiemens per centimeter at 25 degrees Celsius; mg/L, milligrams per liter; Cl/Br, chloride to bromide ratio; µg/L, micrograms per liter; µg/L, micrograms per liter; —, no data available; <, less than; E, estimated; ft, feet]
Site name DateTemper-
ature(ºC)
Specific conductance
(μS/cm)
pH(standard
units)
Dissolved oxygen (mg/L)
Dissolved- solids con- centration
(mg/L)
Calcium (mg/L as Ca)
Magnesium (mg/L as Mg)
Sodium (mg/L as Na)
Potassium (mg/L as K)
Alkalinity as CaCO3 (mg/L)
Sulfate(mg/L as SO4)
WD 16 4/29/15 19.0 448 7.6 7.2 253 43.8 22.6 14.1 1.8 134 35.23/23/16 18.5 452 7.8 8.0 253 47.4 24.0 14.8 1.9 137 35.4
WD 17 4/16/13 19.4 545 7.6 11.0 332 51.3 20.5 34.0 2.0 141 56.13/23/16 19.5 503 7.3 12.5 314 54.2 20.5 32.6 2.1 139 52.2
WD 18 4/28/09 19.7 500 7.4 7.5 280 45.2 19.5 24.5 1.9 143 40.43/16/10 19.3 467 7.4 4.9 296 43.7 19.2 21.3 1.8 155 37.93/9/11 19.2 476 7.3 7.8 293 46.0 19.2 23.8 1.7 138 38.03/23/16 19.5 491 7.5 8.1 269 48.7 20.2 0.81 1.8 144 42.4
1WD 19 3/10/11 19.1 2,030 7.5 9.8 1,120 120 41.6 216 2.8 210 282(1,2) 2/7/12 18.6 1,900 7.5 6.8 1,150 123 43.1 181 2.9 246 349WD 20 4/29/09 19.7 331 7.5 6.7 188 30.2 17.4 11.7 2.1 120 20.8
3/17/10 19.4 344 7.4 7.2 214 28.0 16.1 10.5 1.9 120 19.63/10/11 18.9 332 7.3 7.2 181 31.5 17.7 12.1 2.0 116 18.93/23/16 19.4 327 7.2 9.8 184 31.6 17.9 12.3 2.1 120 18.6
WD 21 3/22/16 19.1 422 7.9 6.5 252 38.1 15.6 1.1 2.1 124 35.6WD 22 9/18/15 19.3 676 7.6 17.9 419 63.8 25.3 38.2 2.0 142 133
3/23/16 19.1 726 7.4 18.9 455 75.8 28.6 42.9 2.1 157 144Well 1 at 890 ft 5/6/03 — 350 7.8 — 216 31 21 7.4 2.9 130 19Well 2 at 400 ft 10/10/02 — 365 8.0 — 208 30 21 9.0 2.1 129 20Well 2 at 615 ft 10/10/02 — 365 8.1 — 190 30 21 6.5 2.5 131 16Well 2 at 750 ft 10/10/02 — 370 8.1 — 196 30 22 6.8 2.7 134 18Well 4 8/29/01 20.1 480 8.0 — — 36 19 38 2.0 128 58
9/11/02 19.1 495 8.1 — 297 36 19 35 2.0 124 56Well 8 at 245 ft 10/8/02 19.0 550 7.5 — 323 49 20 35 2.1 141 70Well 9 8/30/01 20.7 285 7.9 — 179 27 16 7.0 1.9 115 13
9/11/02 19.5 740 8.2 — 458 53 28 52 2.3 124 1263/10/11 15.3 777 7.6 3.8 535 60.2 36.1 54.2 3.3 151 175
Sand Hollow Reservoir water
Haul road 9/10/02 24.2 1,000 8.8 — 669 63 43 71 5.3 92 300Boat ramp 5/5/04 17.3 710 8.2 8.5 442 63 26 45 3.3 161 122
4/29/09 16.1 790 8.4 7.0 503 54.3 37.4 53.7 4.0 147 18911/24/09 11.3 797 8.5 9.5 502 40.9 39.8 62.9 4.3 108 2123/16/10 9.8 817 8.0 9.4 534 43.5 38.4 57.6 4.6 120 2113/9/11 8.6 827 8.1 10.7 534 60.2 39.2 62.2 4.5 142 2122/6/12 6.1 821 8.2 9.2 534 53.6 39.8 61.3 4.3 138 2134/17/13 13.2 874 7.8 8.6 562 56.5 42.7 66.0 4.89 149 2234/29/14 15.2 846 9.0 10.5 535 52.0 40.8 66.2 4.66 134 2074/27/15 16.5 844 8.1 9.8 557 59.2 39.7 67.3 4.8 150 1993/23/16 12.9 828 8.2 9.9 514 56.6 40.8 69.3 4.7 146 192
SH 1-18 4/29/09 14.3 800 8.6 9.6 502 56.1 37.2 53.6 4.2 146 1908/10/09 25.3 800 8.7 9.1 501 42.6 38.3 60.5 4.3 110 —3/16/10 9.6 819 8.0 9.6 525 45.9 40.8 58.6 4.7 124 2113/9/11 8.1 820 8.2 10.7 528 60.1 39.6 61.2 4.43 140 2102/8/12 5.9 801 8.0 10.7 526 54.2 39.5 59.6 4.28 140 2144/18/13 12.5 883 8.0 8.7 553 58.1 43.1 67.1 4.73 148 2234/30/14 14.1 835 8.2 — 531 51.7 40.6 65.8 4.38 136 200
1High or increasing dissolved-solids concentrations but low Cl/Br ratios indicate groundwater is affected by flushing of naturally occurring solutes in vadose zone prior to reservoir construction.
2Replicate sample not reported because submersible pump was re-installed for sample collection and dissolved-solids concentration differed by more than 10 percent.

36 Assessment of Managed Aquifer Recharge at Sand Hollow Reservoir, Washington County, Utah
Table 3. Field measurements and concentrations of major ions, selected trace elements, and nutrients in groundwater and surface water from selected sites in Sand Hollow, Washington County, Utah.—Continued [°C, degrees Celsius; μS/cm, microsiemens per centimeter at 25 degrees Celsius; mg/L, milligrams per liter; Cl/Br, chloride to bromide ratio; µg/L, micrograms per liter; µg/L, micrograms per liter; —, no data available; <, less than; E, estimated; ft, feet]
Site name Chloride (mg/L as Cl)
Fluoride (mg/L as F)
Bromide (mg/L as Br) Cl/Br
Silica(mg/L as
SiO2)
Iron(μg/L as Fe)
Manganese (μg/L as
Mn)
Arsenic (μg/L as As)
Nitrogen(nitrite + nitrate)
(mg/L as N)
Nitrogen, nitrite
(mg/L as N)
Nitrogen, ammonia
(mg/L as N)
Phosphorus (orthophos-
phate)(mg/L as P)
WD 16 31.6 0.20 0.19 168 13.3 <4.0 <0.2 5.8 4.69 <0.001 <0.01 0.00831.6 0.22 0.18 174 13.7 <4.0 <0.2 5.9 4.35 <0.001 <0.01 0.006
WD 17 55.2 0.34 0.30 187 15.0 20.8 0.57 12.8 3.06 <0.001 <0.01 0.01552.1 0.42 0.28 185 15.8 6.4 <0.20 12.9 2.78 <0.001 <0.01 0.014
WD 18 36.1 0.37 0.21 171 16 16 1 10.6 3.15 0.002 <0.02 0.0134.1 0.33 0.22 154 15.8 <6 <0.2 10.0 3.14 <0.002 <0.02 0.0235.1 0.36 0.22 163 15.3 <3.2 <0.16 10.2 3.12 <0.001 <0.01 0.0138.0 0.35 0.21 178 15.4 10.8 0.42 10.1 3.09 <0.001 <0.01 0.014
1WD 19 252 0.37 1.17 215 17.1 <3.2 <0.16 9.9 8.75 <0.001 <0.01 0.02(1,2) 192 0.34 0.89 216 17.5 5.2 0.16 9.3 9.38 <0.001 <0.01 0.03WD 20 16.4 0.28 0.09 178 14 53 1 7.7 2.41 E0.001 <0.02 0.02
17.2 0.24 0.09 185 14.2 <6 0.53 8.0 2.40 <0.002 <0.02 0.0216.9 0.22 0.09 197 14.3 <3.2 <0.16 7.6 2.37 <0.001 <0.01 0.0216.2 0.24 0.08 195 14.7 47.5 0.74 7.6 2.37 <0.001 <0.01 0.03927.8 0.37 0.15 189 16.3 545 25.4 3.4 2.17 <0.001 <0.01 0.01351.6 0.38 0.12 426 15.6 <4.0 12.8 13.3 0.79 <0.001 <0.01 0.03351.4 0.39 0.11 451 15.8 4.9 <0.20 13.7 0.71 <0.001 <0.01 0.030
Well 1 at 890 ft 16.9 1.08 — — 11 11 19 9.1 3.37 0.008 0.03 0.01Well 2 at 400 ft 17.8 0.2 — — 11 10 12 2.6 3.41 0.008 0.10 0.02Well 2 at 615 ft 13.2 0.23 — — 11 27 6 4.6 3.73 0.004 <0.04 0.02Well 2 at 750 ft 14.3 0.23 0.10 143 12 19 3 5.9 3.84 <0.008 0.03 0.02Well 4 44.4 E0.1 0.20 218 13 <10 <3 7.1 1.50 <0.006 <0.04 0.02
42.0 0.2 0.17 247 13 <10 <2 8.0 2.10 <0.008 <0.04 0.02Well 8 at 245 ft 38.7 0.29 0.15 258 14 <10 5 16.6 1.72 0.03 0.18 0.01Well 9 13.0 0.20 0.07 186 13 <10 <3 12.4 2.40 <0.006 <0.04 0.02
72.2 0.20 0.28 258 14.2 250 6.0 17.0 2.20 <0.008 <0.04 0.02053.8 0.33 0.08 706 11.7 13.5 2.61 13.8 0.56 <0.001 <0.01 0.009
Sand Hollow Reservoir water
Haul road 76.0 0.30 0.02 3,800 4.9 <10 <2 2.0 0.04 <0.008 <0.04 0.02Boat ramp 50.0 0.21 0.01 5,000 7.3 <6 1.3 1.1 — — — —
54.9 0.31 0.04 1,227 2.9 <4 0.3 1.4 0.04 0.002 <0.02 0.00860.4 0.28 0.05 1,313 1.5 <6 0.2 1.6 <0.04 <0.002 <0.02 0.00861.7 0.30 0.04 1,374 1.4 6.3 1.7 1.3 E0.03 <0.002 0.02 <0.00857.0 0.30 0.04 1,390 4.0 <3.2 2.0 1.13 0.10 0.004 0.03 <0.00458.3 0.27 0.05 1,108 4.2 <3.2 0.86 1.01 0.12 0.001 0.01 <0.00465.8 0.25 0.08 875 2.9 5.2 1.22 <0.04 0.09 0.007 0.04 <0.00465.3 0.27 0.05 1,280 1.2 <4 0.74 1.3 0.04 0.002 <0.01 <0.00467.3 0.24 <0.06 1,346 4.0 <4.0 1.10 1.5 <0.04 0.002 0.02 <0.00467.2 0.26 0.046 1,461 4.3 <4.0 0.73 1.6 0.11 0.002 0.02 <0.004
SH 1-18 54.6 0.27 0.04 1,318 3.0 <4 0.4 1.4 0.04 0.003 0.13 0.008— 0.24 — — 1.3 3 0.3 1.6 <0.04 <0.002 <0.02 0.008
61.6 0.30 0.04 1,417 1.2 6.2 1.8 1.4 E0.02 <0.002 0.02 <0.00857.2 0.30 0.04 1,546 3.9 <3.2 2.10 1.12 0.10 0.005 0.02 <0.00456.5 0.27 0.05 1,060 4.1 <3.2 1.31 1.04 0.09 0.001 0.02 <0.00465.3 0.25 0.07 898 2.8 2.1 0.82 1.2 0.09 0.007 0.03 <0.00463.2 0.26 0.05 1,170 1.1 <4 0.45 1.2 0.04 0.001 <0.01 <0.004

References Cited 37
Summary Since its inception in 2002, diversions to Sand Hollow
Reservoir from the nearby Virgin River generally have resulted in rising reservoir stage, ranging from about 3,000 feet in 2002 to a maximum of about 3,060 feet in 2006, which then fluctuated between about 3,040 and 3,060 feet from 2008 through 2016. Similarly, groundwater levels in monitoring wells closest to the reservoir generally rose between 2002 and 2006, and then fluctuated with reservoir altitude and pumpage rate from nearby production wells. Water levels in monitoring wells farther from the reservoir were still rising through 2016.
Between 2004 and 2016, about 37,000 acre-feet (acre-ft) of groundwater were withdrawn from production wells located near Sand Hollow Reservoir. French drains, installed to capture shallow seepage near the reservoir, were also pumped as they filled with water. About 9,000 acre-ft of groundwater were pumped from the North Dam drain between 2003 and 2016. Initially, this water was returned to the reservoir, but since 2007, has been used by Sand Hollow Resort for irrigation. About 2,300 acre-ft of water were pumped from the West Dam drain back into the reservoir from 2005 through 2016. In 2006, the West Dam Spring drain was constructed and has largely replaced the function of the West Dam drain. About 26,000 acre-ft were pumped from this drain into the Washington County Water Conservancy District’s municipal supply system from 2006 through 2016.
Total annual surface-water inflow to Sand Hollow Reservoir ranged from about 56,000 acre-ft in 2005 to 800 acre-ft in 2007. Total inflow from 2002 through 2016 was about 256,000 acre-ft. The general increase in reservoir water-level altitude and surface area from 2002 to 2007 resulted in a steady increase in the volume of annual evaporation from about 1,000 to about 6,600 acre-ft through 2006, which then leveled off from 2007 through 2016. Total estimated cumulative evaporative loss from 2002 through 2016 was about 85,000 acre-ft. During this same period, annual reservoir recharge to the underlying Navajo Sandstone aquifer fluctuated between about 5,000 and 18,000 acre-ft. Total calculated reservoir recharge from 2002 through 2016 was about 141,000 acre-ft with a two standard deviation uncertainty of 13,300 acre-ft. From 2002 through 2016, calculated monthly recharge volumes ranged from 12 to almost 3,500 acre-ft, and average daily recharge rates (calculated for each month) ranged from 0.000 to 0.430 foot.
Annual water-quality sampling for field parameters, chemistry, and environmental tracers (tritium, chlorofluoro-carbons, sulfur hexafluoride) was continued during 2015 and 2016. The most significant changes in water quality occurred at monitoring wells WD 4 (2,600 feet from the reservoir) and WD 12 (1,000 feet away), where increases in salinity (specific conductance) and dissolved oxygen (and environmental tracer concentrations at WD 4) indicate rising groundwater levels and mobilization of vadose-zone salts, likely a precursor to the arrival of reservoir recharge. At wells WD 9 (55 feet from
the reservoir) and WD 11 (160 feet away), field parameters and water-quality and environmental tracer data indicate that reservoir recharge arrived several years prior to 2014. At well WD 6 (1,000 feet away), increases in salinity and chloride/bromide ratios, along with environmental tracer data all indicate the recent arrival of reservoir recharge. Although well WD 8 is located only 500 feet from the reservoir, it is downgradient of an area of high natural recharge on Sand Mountain and may lie along a groundwater boundary between the two recharge mounds; relatively high concentrations of modern environmental tracers may be caused by natural recharge. At wells WD 15 and WD 16 (nested wells located 2,400 feet from the reservoir), water-quality and environmental tracer data indicate a rising water table, but no arrival yet of reservoir recharge.
References Cited Heilweil, V.M., and Marston, T.M., 2011, Assessment of
managed aquifer recharge from Sand Hollow Reservoir, Washington County, updated to conditions in 2010: U.S. Geological Survey Scientific Investigations Report 2011–5142, 39 p.
Heilweil, V.M., and McKinney, T.S., 2007, Net-infiltration map of the Navajo Sandstone outcrop area in western Washington County, Utah: U.S. Geological Survey Scientific Investigations Map 2988.
Heilweil, V.M., McKinney, T.S., Zhdanov, M.S., and Watt, D.E., 2007, Controls on the variability of net infiltration to desert sandstone: Water Resources Research, v. 43, W07431, DOI:10.1029/2006WR005113, 15 p.
Heilweil, V.M., Ortiz, G., and Susong, D.D., 2009, Assessment of managed aquifer recharge at Sand Hollow Reservoir, Washington County, Utah, updated to conditions through 2007: U.S. Geological Survey Scientific Investigations Report 2009–5050, 19 p.
Heilweil, V.M., and Solomon, D.K., 2004, Millimeter- to kilometer-scale variations in vadose-zone bedrock solutes—Implications for estimating recharge in arid settings, in Phillips, F., Scanlon, B., and Hogan, J., eds., Groundwater recharge in a desert environment—The southwestern United States: Water Science and Application, v. 9, Washington, D.C., American Geophysical Union, p. 49–67.
Heilweil, V.M., Solomon, D.K., and Gardner, P.M., 2006, Borehole environmental tracers for evaluating net infiltration and recharge through desert bedrock: Vadose Zone Journal, v. 5, p. 98–120.
Heilweil, V.M., Solomon, D.K., and Ortiz, G., 2009, Silt and gas accumulation beneath an artificial recharge spreading basin, southwestern Utah, U.S.A: Boletin Geologico y Minero, v. 120, no. 2, p. 185–195.

38 Assessment of Managed Aquifer Recharge at Sand Hollow Reservoir, Washington County, Utah
Heilweil, V.M., Solomon, D.K., Perkins, K.S., and Ellett, K.M., 2004, Gas-partitioning tracer test to quantify trapped gas during recharge: Ground Water, v. 42, no. 4, p. 589–600.
Heilweil, V.M., and Susong, D.D., 2007, Assessment of artificial recharge at Sand Hollow Reservoir, Washington County, Utah, updated to conditions through 2006: U.S. Geological Survey Scientific Investigations Report 2007–5023, 14 p.
Heilweil, V.M., Susong, D.D., Gardner, P.M., and Watt, D.E, 2005, Pre- and post-reservoir ground-water conditions and assessment of artificial recharge at Sand Hollow, Washington County, Utah, 1995–2005: U.S. Geological Survey Scientific Investigations Report 2005–5185, 74 p.
Heilweil, V.M., and Watt, D.E., 2011, Trench infiltration for managed aquifer recharge to permeable bedrock: Hydrological Processes 25, DOI: 10.1002/hyp.7833, p. 141–151.
Marston, T.M., and Heilweil, V.M., 2012, Numerical simulation of groundwater movement and managed aquifer recharge from Sand Hollow Reservoir, Hurricane Bench area, Washington County, Utah: U.S. Geological Survey Scientific Investigations Report 2012–5236, 34 p.
Marston, T.M., and Heilweil, V.M., 2013, Assessment of managed aquifer recharge at Sand Hollow Reservoir, Washington County, Utah, updated to conditions in 2012: U.S. Geological Survey Scientific Investigations Report 2013–5057, 40 p.
Marston, T.M., and Heilweil, V.M., 2016, Assessment of managed aquifer recharge at Sand Hollow Reservoir, Washington County, Utah, updated to conditions through 2014: U.S. Geological Survey Open-File Report 2016–1078, 35 p.
McGuinness, J.L., and Bordne, E.F., 1971, A comparison of lysimeter-derived potential evapotranspiration with computed values: U.S. Department of Agriculture Technical Bulletin 1472, Washington, D.C., Agricultural Research Service, 71 p.
Rosenberry, D.O., Winter, T.C., Buso, D.C., and Likens, G.E., 2007, Comparison of 15 evaporation methods applied to a small mountain lake in the northeastern USA: Journal of Hydrology, v. 340, p. 149–166.
Wilde, F.D., and Radtke, D.B., 1998, National field manual for the collection of water-quality data―Field measurements: U.S. Geological Survey Techniques of Water-Resources Investigations, book 9, chap. A6, 233 p.

For additional information, contact:
Director, Utah Water Science Center U.S. Geological Survey 2329 West Orton Circle Salt Lake City, UT 84119-2047 801 908-5000
https://ut.water.usgs.gov/
Marston and N
elson—A
ssessment of M
anaged Aquifer Recharge at Sand H
ollow Reservoir, W
ashington County, Utah, U
pdated to Conditions Through 2016—Open-File Report 2018–1140
ISSN 2331-XXXX (online)https://doi.org/10.3133/ofr2018-1140