assessment, evaluation, review and updating of the air … quo assessment presentatio… ·...
TRANSCRIPT

Assessment, Evaluation, Review and Updating of the Air Quality Management Plan (AQMP) for
eThekwini
Air quality status quo
19, 20 and 26 May 2015

The AQMP development process
STEP 1: Establish stakeholder database
STEP 2: Undertake baseline assessment
STEP 3: Undertake gap and problem analysis
STEP 4: Develop vision, mission and goals
STEP 5: Develop intervention plan
STEP 6: Implement AQMP and intervention plan
STEP 7: Evaluate and revise interventions if necessary

Status Quo Assessment Report• The most comprehensive air quality baseline study to
date for eThekwini
• Includes:
– Contextual information important to air quality
– Comprehensive inventory of emissions
– Ambient monitoring data and model outputs
– Capacity assessment
– Potential effect of proposed development
– Gaps, issues, problems, challenges

About eThekwini• The only A-municipality in KZN
• Covers 2 295 km2
• Tongaat to Umkomaas, west to Cato Ridge
• Population of 3.5 million
• 103 municipal wards
• Port of Durban
• Major manufacturing hub
• Tourist destination

Topography of eThekwini
• Two marked ridges on the coast
• General increase in elevation westward
• Channelling effect along the coast
• Limits westward movement
• Promotes eastward drainage

eThekwini’s climate• Sub-tropical climate
• Warm summers, mild winters
• Rainfall in summer
• High frequency of moderate to strong wind
• Good air pollution dispersion potential

Durban health study (2004-2006)
• 12% of children in the south had persistent asthma, somewhat higher than the north
• Marked airway hyper-responsiveness was 3-fold higher in the south than in the north
• Adjusting for other causes of poor health, exposure to the air pollutants caused poorer lung function, worse in children with persistent asthma or a genetic profile for asthma
• The health status has since not been updated
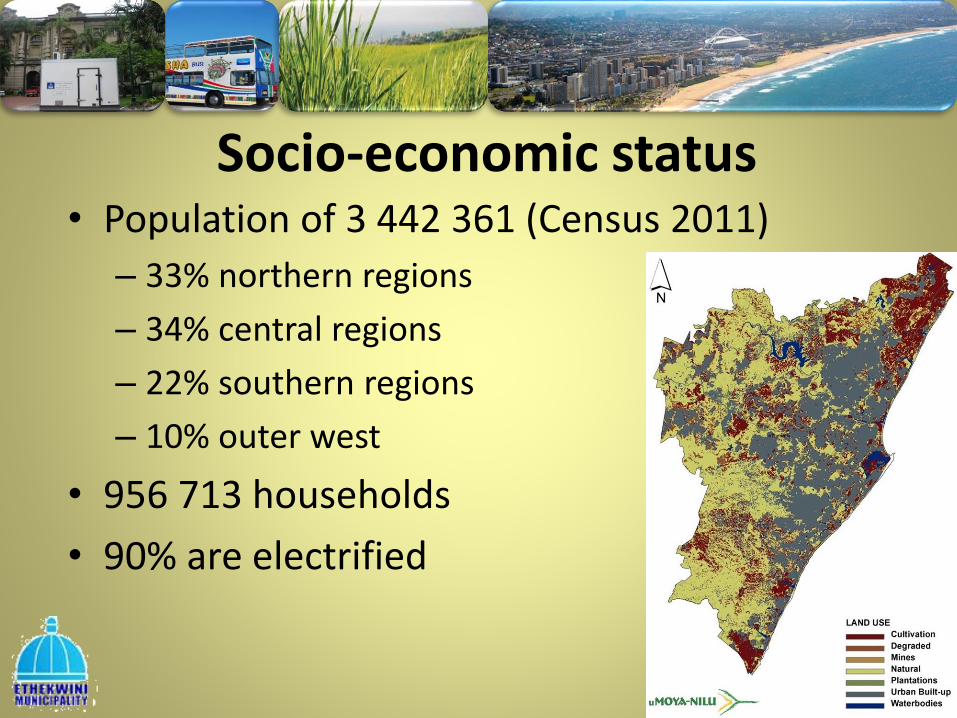
Socio-economic status• Population of 3 442 361 (Census 2011)
– 33% northern regions
– 34% central regions
– 22% southern regions
– 10% outer west
• 956 713 households
• 90% are electrified

Emissions vs AmbientConcentrations

Emissions• Emissions refer to pollutants released into the
atmosphere
• Documented in an emission inventory:
– Sources (Industry, vehicles, port, KSIA, residential fuel, biomass burning, quarrying)
– Pollutants (SO2, NOX, particulates, CO, VOC)
– Location (eThekwini Municipality)
– Gaps (Waste management, biogenic emissions)

Listed Activities
• Industrial sources that require an AEL
• 85 facilities currently hold an AEL in eThekwini
• AELs and emission testing reports used for emission estimates
• Gaps – AELs not yet issued to all Listed Activities

Emissions in tons per yearListed Activity SO2 NOX CO PM10 VOC Benzene
Combustion installations
1 745 331 218 576 3
Chemicals manufacture
32 95 22 12 1
Metallurgical industry 2 321 1 660 904 566 15
Mineral processing, storage and handling
882 133 401 109 177
Petroleum industries 6 997 1 699 562 389 5 087 68
Pulp and paper 1 214 1 170 375 384 23
Thermal treatment of waste
7 1 0 1 1
TOTAL 13 197 5 090 2 482 2 036 5 307 68

Controlled Emitters• Boilers < 50 MW, but > 10 MW heat input
• Regulated in terms of municipal by-law
• 13 facilities, operating 33 boilers
• Emission estimates using fuel consumption and type and emission factors
• Gaps – Database does not yet included all facilities
Emissions in tons per year
SO2 NOX CO PM10 VOC
5 845 895 425 1 055 2.4

Fuel Burning Appliances
• Refers to boilers < 10 MW heat input
• Regulated in terms of Scheduled Trade Permit
• 98 facilities operating 135 FBA
• Fuels include coal, HFO, LFO, diesel, kerosene, paraffin, wood and gas
• Gaps – Database does not yet included all facilities

Motor Vehicle Emissions
• Based on 2014 eNATIS registered vehicle data
• Motorcycles, passenger cars, LDVs, buses, HDVs
• Unleaded fuel, LRP, diesel
• Emissions estimated for licensing districts, not at street level

Emissions in tons per yearLicensing district NOx SO2 PM10 NMVOC Benzene
Amanzimtoti 4 752 108 159 1 261 1
Camperdown 1 306 29 43 514 2
Durban 41 501 976 1 556 16 828 24
Ndwewe 43 1 1 12 0
Pinetown 11 199 254 370 3 316 6
Umbumbulu 85 2 3 23 0
Umhlanga 4 194 96 138 1 241 2
Umlazi 1 490 34 48 412 1
Verulam 3 722 85 121 1 034 2
Total 68 292 1 585 2 439 24 642 38

Port of Durban• Busiest port in Africa
• 21 km circumference
• 300 km of railway line, 4000 vessels per year
• Emission estimates based on 2010 activity
• Gaps – dated and generic information used

Emissions in tons per annum
Source SO2 NOx PM PM10 Benzene
Ships 5 187 6 520 733 -
Commercial boats 7.6 115 12.6 -
Motor vehicles 25 746 33 - 1.8
Locomotives 2.5 177 4.8 0.3
Boilers 268 30.1 15.7
Storage piles - - 4.1 -
Grain elevators - - 44.4 12.4
Storage tanks 18.8
Total 5 490 7 588 827 32.9 20.9

King Shaka International Airport• 3rd busiest airport in the country
• 4.47 million passengers in 2013-2014
• 49 559 traffic movements
• Emission inventory by WSP in 2012
Emissions in tons per annumNOX SO2 PM HC
Aircraft 453.6 59.4 20.2 78.1Vehicles 11.5 0.005 57.9 22.8Fuel Storage 10.9Generators 3.5 0.03 0.16 0.57Total 468.6 59.4 78.3 112.4
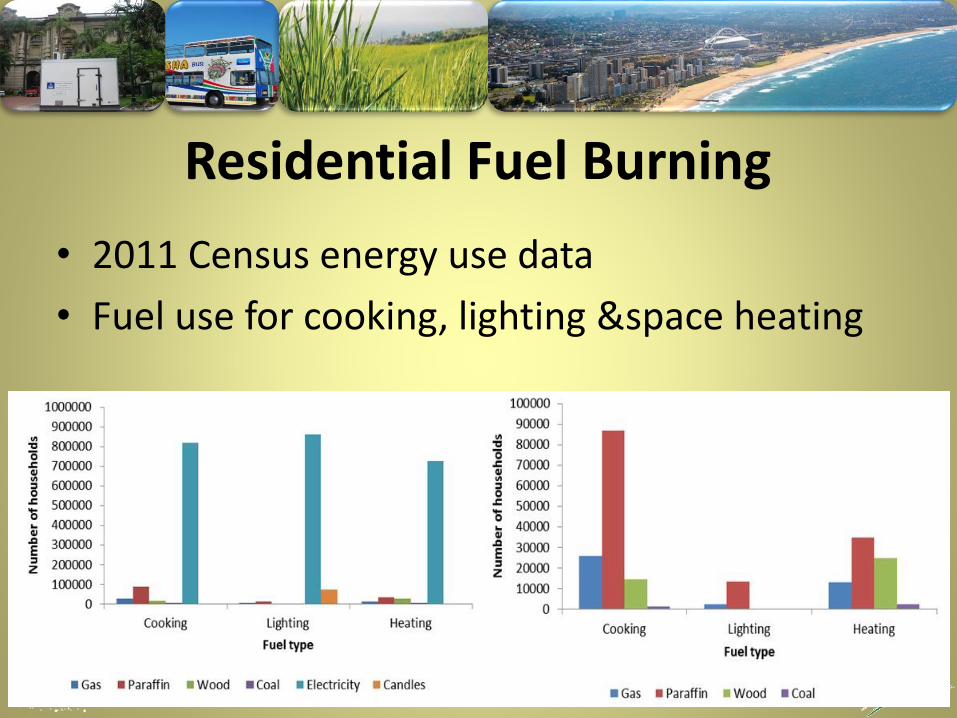
Residential Fuel Burning
• 2011 Census energy use data
• Fuel use for cooking, lighting &space heating

Emission in tons per annum
Fuel SO2 NOX PM10
Gas 0.0 0.1 0.0Paraffin 9.3 23.5 1.4Wood 0.7 5.0 54.7Coal 4.0 0.6 0.4Total 14.0 29.2 56.5

Biomass Burning• Refers to vegetation
burning (controlled and uncontrolled fires)
• Assume all biomass burning is sugar cane
• Use area burnt, fuel load and emission factors
Emissions in tons per annum
PM NOX VOCs
68 25 151

eThekwini Emissions (tons per annum)Sectors SO2 NOx PM10 VOC BenzeneListed Activities 13 197 5 090 2 036 5 307 68Controlled emitters 5 845 895 1 055 2Residential fuels 14 29 56Motor vehicles 1 585 68 292 2 439 24 642 38Port of Durban 5 490 7588 33 2 421 21
King Shaka IA 60 469 782 112Biomass burning 25 682 151Quarries 1202
Total 26 191 82 388 5 885 32 635 1081: Benzene from storage tanks included in Listed Activities2: Total particulates
A 4 000 MW power station emits up to 300 000 tons SO2
per annum, eThekwini emission in 3 months
2nd highest metro in South Africa after Johannesburg
28 000 tons per annum in Rustenburg from mine tailings
77 tons per year in Joburgfrom motor vehicles

Emission by sector
SO2
NOX
PM10

Ambient Air Quality• The air that we breath
• Measured against the health-based NAAQS
PollutantAveraging
PeriodLimit value
(µg/m3)Tolerated exceedances
per annum
SO2
1 hour 350 8824 hour 125 4
1 year 50 0
NO2
1 hour 200 881 year 40 0
PM10
24 hour 75 41 year 40 0
O3 8 hours 120 11Benzene 1year 5 0Pb 1 year 5 0

Ambient Air Quality Monitoring• eThekwini monitoring
– 18 smoke and SO2
bubblers since 1995
– 10 continuous monitoring stations since 2003, 4 additional stations in 2014
– Numerous monitoring campaigns
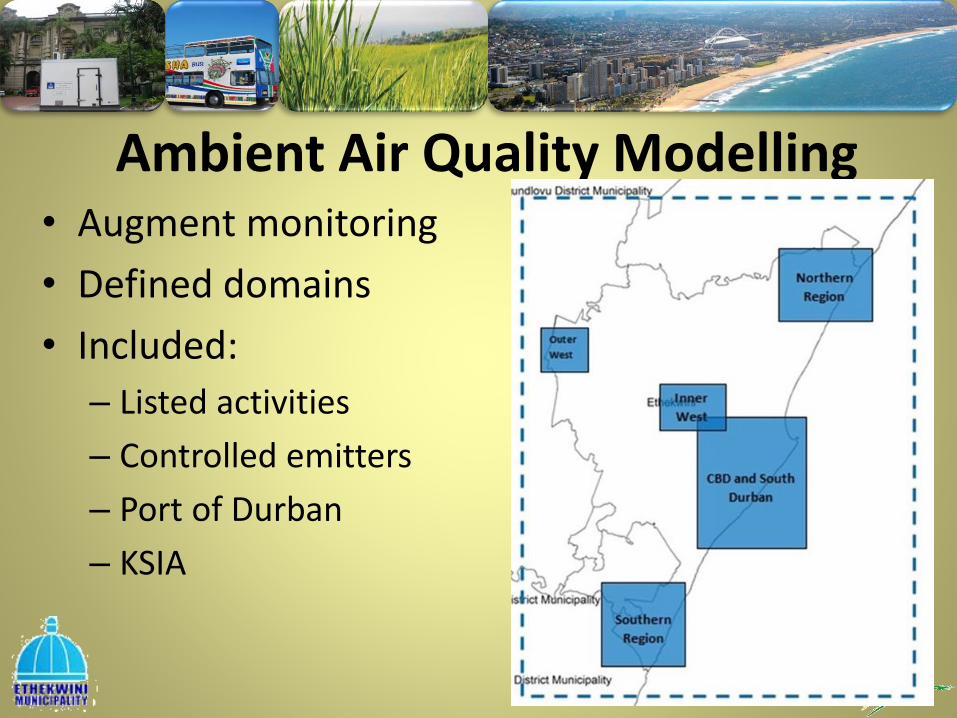
Ambient Air Quality Modelling• Augment monitoring
• Defined domains
• Included:
– Listed activities
– Controlled emitters
– Port of Durban
– KSIA
Sulphur dioxide (SO2)
• Sulphur is a component of fossil fuels
• SO2 is produced when these are combusted
• More than 26 000 tons emitted annually
• 73% by industry, 21% by the Port

Annual SO2 concentrationsBubblers

Annual SO2 concentrationsContinuous

24-hour exceedances

Modelled SO2
Annual 24-hour 1-hour

Nitrogen dioxide (NO2)
• Product of high temperature combustion
• More than 82 000 tons emitted annually
• 83% by vehicles, 9% by the Port, 6% industry

Annual NO2 concentrationsContinuous
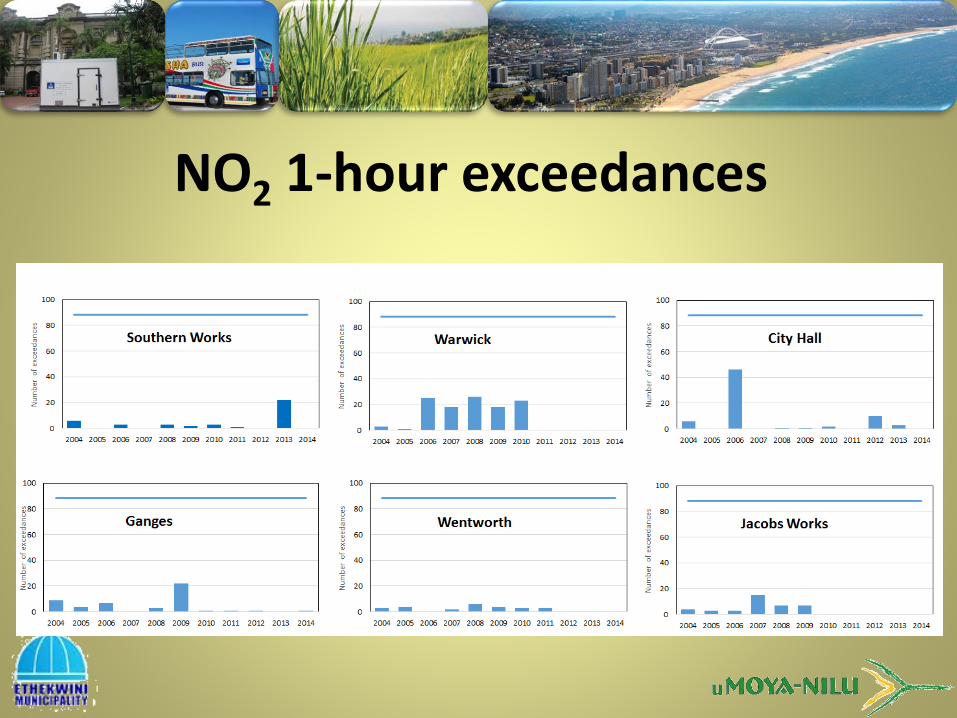
NO2 1-hour exceedances

Particulate Matter (PM10)
• Anthropogenic and natural sources as long range transport
• 5 885 tons per annul from eThekwini sources
• 52% from industry, 41% from vehicles
• Background concentration of about 16 μg/m3

Annual PM10 concentrationsContinuous

Annual PM2.5 concentrationsContinuous

Number of daily exceedancesPM10
PM2.5

Benzene• A natural component of crude oil
• Emissions from processing, storage & handling and combustion of petrochemical products
• 108 tons per annum in eThekwini
• 63% from Listed Activities, 35% from vehicles

Benzene concentrations

Modelled annual benzene concentrations
Year Annual average (μg/m3)
2011 1.85
2012 5.04
2013 5.03

523 air quality complaints12 month period
Air pollution emissions
Chemical smell
Dust Vehicle emissions
Number 115 126 66 6
Percent 22 24 13 1
Odour Smoke Sugarcane burning
Number 166 42 2
Percent 32 8 < 1
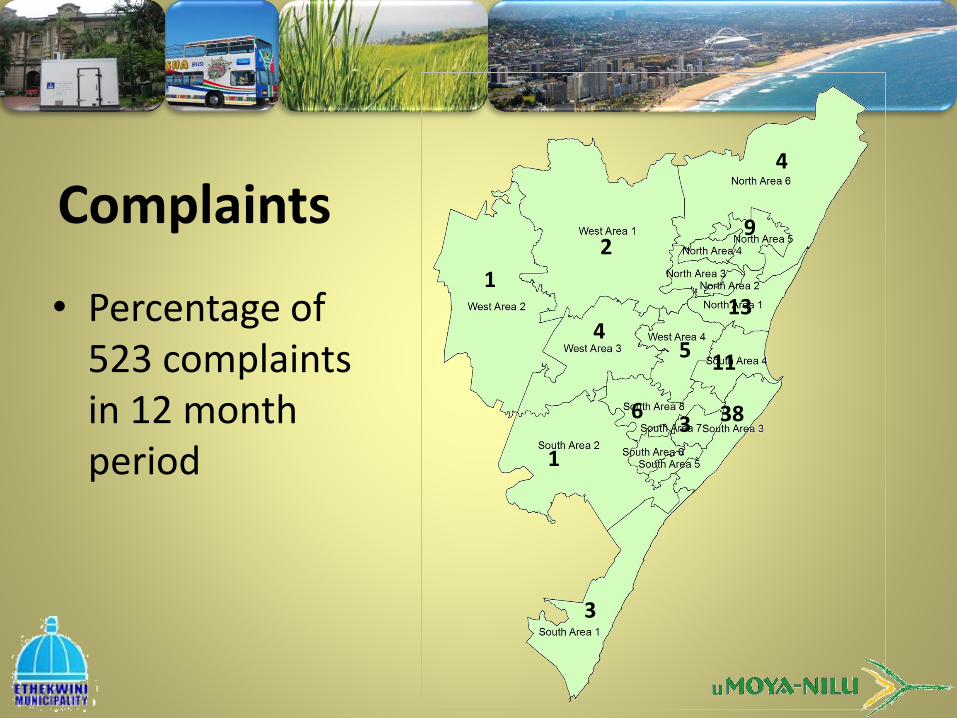
Complaints
• Percentage of 523 complaints in 12 month period
13
9
4
3
1
38
11
36
2
1
45
Air Quality Management• AQM active in eThekwini since late 1990’s
• Significant increase in activity with MMP in 2003
– Monitoring network of 14 stations
– Technical capacity building
– AQMP in 2007 and its implementation
– Data capture and reporting
– Dispersion modelling
• Health study in 2006
• Mandated function expanded in 2007 with AQA

Air Quality Management Capacity
• Capacity assessment used 6 ‘S’ model:
– Organisational Structure
– Systems or tools available for AQM function
– Incumbent Skills to perform the function
– Strategy to achieve AQM goals
– IncentiveS refer to motivational policies
– InterrelationshipS with other departments and stakeholders

Structure• AQM section is well established in Pollution
Control & Risk Management in Health Department
• Air Quality Officer was designated in 2011
• Incumbent and capable technical staff in the regions
• AEL function is established
• Support and buy-in for AQM throughout eThekwini structures

Structure
• Current organogram was developed prior to regulation of mandated functions of the NEM: AQA. Does not cater for:
– AEL function
– Compliance and enforcement

Systems• Current approach to AQM is defined by 2007 AQMP and
mandated functions of NEM:AQA
• Extensive ambient monitoring network, expanded in 2014, original equipment needs maintenance and replacement
• Emission inventory developed, needs on-going upkeep
• Dispersion model set-up, needs to be transferred to eThekwini
• AEL function is in place, 85 AELs issued to date
• Air quality management by-laws in final draft

Skills
• Incumbent capability in ambient monitoring and data management
• Loss of trained personnel
• Replacement with appropriate skilled capacity is difficult
• Technical training opportunities are limited in South Africa
Incentives• Significant investment made in AQM in 2014
• AQM a growing field with career opportunities
• AQM is challenging and rewarding career
• AQM needs partnerships, but these are limited
• Opportunities for external funding have not been explored

Strategy
• Strategy guided by AQMP developed in 2007
• AQMP revised in 2014-2015 for integration into the IDP to steer AQM for the next 5 years
• AQMP will includes an Implementation Plan for short, medium and long term goals

Inter-relationships
• Good relationship exists with the DEA and Province
• Established working relationships exist with other departments and agencies
• Good working relationships exist with most stakeholders

SummaryOur assessment shows that:
• Generally ambient air quality in eThekwini is good, and
• Air Quality Management in eThekwini meets the mandated requirements of the NEM:AQA
It also shows that there are:
• Gaps and issues that need to be addressed, and
• A number of challenges face eThekwini and other stakeholders

Discussion on the status quo assessment

Way forward
• Status quo assessment report will be available from 27 May 2015
• Available for download: www.projectsa.co.za/aqmp
• Comment period to Friday 27 June 2015
• Comments and response report will be developed
• Comments will be used to:
– Finalise the status quo assessment report
– Inform the development of the AQMP
Way forward
• Project team, with eThekwini will draft the AQMP
• Meetings with stakeholders where necessary
• Draft AQMP presented to stakeholders before the end of 2015