assessing the performance and transport properties of
TRANSCRIPT

Journal of Advanced Concrete Technology Vol. 18, 437-455, July 2020 / Copyright © 2020 Japan Concrete Institute 437
Scientific paper
Assessing the Performance and Transport Properties of Concrete using Electrical Property Measurements Benny Suryanto1*, Jaehwan Kim2, William John McCarter3, Gerard Starrs4 and Martin William Aitken5
Received 21 March 2020, accepted 5 July 2020 doi:10.3151/jact.18.437
Abstract The electrical properties of porous systems are intimately linked to mass transport and flow processes such as diffusion and permeability and offer a simple testing methodology for assessing those properties which are responsible for the durability and long-term performance of construction materials. In the current study, electrical impedance spectra for concretes containing both plain and blended Portland cement binders were obtained over a period of 360 days. In-situ impedance measurements were used to accurately identify the bulk resistance (hence evaluation of resistivity) of the concretes and the optimum frequency range for bulk resistance measurements. The bulk resistivity was normalised by that of the pore-fluid resistivity obtained from computer simulations and the results indicated that the pore-fluid resis-tivity decreased only marginally with time once the hydration process had advanced beyond 28 days. It is shown that the normalised resistivity – termed the Formation Factor – displayed a continual increase with time, highlighting on-going hydration/pozzolanic reaction and pore structure refinement over the entire test period. This was particularly evident for the slag concretes. Using the normalisation process, a simple approach is presented to evaluate the effective diffusion coefficient of the concretes and a durability/performance classification system, based on the Formation Factor, is presented. 1. Introduction
The durability and long-term performance of reinforced concrete structures depend on the microporous nature of the cementitious binder and the environment to which the structure is exposed (Jennings et al. 1996; McCarter et al. 2001; Maekawa et al. 2008; Song et al. 2008; Kim et al. 2016). For reinforced concrete structures located in, or near, the marine environment, or where de-icing salt is used for winter maintenance purposes, it is the protective qualities of concrete against chloride-induced corrosion of the steel reinforcement which are of considerable interest to engineers (Streicher and Alexander 1995; Yokota et al. 2009; Ueda et al. 2020). In practice, the ability of concrete to protect the embedded steel (hence chloride ingress) is based on a prescriptive or deem-to-satisfy
approach (Andrade et al. 2013; McCarter et al. 2017) and often equated with strength. In BS EN206-1:2013 (BSI 2016) and BS 8500-1:2015 (BSI 2019a), for example, a list of deterioration mechanisms, each containing a pre-scriptive measure of minimum grade, maximum wa-ter-binder ratio, and minimum binder content, is speci-fied to ensure durability and is used in conjunction with a series of well-defined environmental classifications.
With increasing importance placed on producing du-rable concrete, there is now a growing interest and, in-deed, an inevitable need to relate the desired perform-ance of concrete to an easily measurable parameter through an appropriate performance-based test (hence performance-based approach) (Baroghel-Bouny et al. 2014; Alexander and Thomas 2015; McCarter et al. 2017; Beushausen et al. 2019). In this case, the focus is on those performance requirements which have a direct influence on the corrosion of the steel reinforcement e.g. chloride ion diffusivity, resistivity of concrete and cor-rosion potential (Tang and Utgenannt 2007; Nanukuttan et al. 2008; Moradi-Marani et al. 2010; Pack et al. 2010; Pang and Li 2016; Wattanapornprom and Ishida 2017; Kim et al. 2018; Chlayon et al. 2020; Kim et al. 2020; Tran et al. 2020). It should be noted that although BS EN206-1:2013 (BSI 2016) still defines prescriptive de-sign methods for durability, Section 5.3.3 of this code allows for performance-related methods and defines concrete on the basis of an equivalent durability proce-dure (EDP); more details on the EDP are available in PD CEN/TR 16563 (BSI 2013). To fully implement a per-formance-based approach, the following need to be considered. (i) Long-term experience of local materials and practices,
1Associate Professor, School of Energy, Geoscience, Infrastructure and Society, Heriot-Watt University, Edinburgh, Scotland, United Kingdom. *Corresponding author, E-mail: [email protected] Research Fellow, Sustainable InfrastructureResearch Center, Korea Institute of Civil Engineering and Building Technology, Gyeonggi-do, Korea. 3Professor Emeritus, School of Energy, Geoscience, Infrastructure and Society, Heriot-Watt University, Edinburgh, Scotland, United Kingdom. 4Honorary Research Fellow, School of Energy, Geoscience, Infrastructure and Society, Heriot-Watt University, Edinburgh, Scotland, United Kingdom. 5Senior Technical Specialist, School of Energy, Geoscience, Infrastructure and Society, Heriot-Watt University, Edinburgh, Scotland, United Kingdom.

B. Suryanto, J. Kim, W. J. McCarter, G. Starrs and M. W. Aitken / Journal of Advanced Concrete Technology Vol. 18 437-455, 2020 438
and detailed knowledge of the local environment; (ii) Test methods based on approved and proven tests
that are representative of actual conditions and have approved performance criteria; and,
(iii) Analytical models that are developed based on the physics underlying the problem and are corroborated against test-data representative of actual conditions in practice.
With regard to the durability of concrete, it is the permeation properties of concrete which are of impor-tance, and terms such as diffusivity, permeability and sorptivity are used in this respect (Guimarães et al. 2011; Patel et al. 2016; McCarter et al. 2000, 2018; Alaswad et al. 2018). As the permeation properties of concrete are intimately linked to microstructural features of concrete such as capillary pore size, pore-size distribution, pore tortuosity and the connectedness of the capillary pore network (McCarter et al. 2013b; Ishida et al. 2009), a testing technique that is capable of quantifying the hier-archical porous microstructure of the cement system and relating this information to the desired performance would address (ii) above. Given that the underlying mechanism associated with permeability and diffusion is analogous to the flow of current under a potential gra-dient (hence, electrical conductivity, or its reciprocal, electrical resistivity), it is understandable that there is now increasing attention directed towards utilisation of the electrical properties of concrete as a durability indi-cator/index (Sengul 2014; Van Noort et al. 2016; McCarter et al. 2017; Riding et al. 2018; Torres-Acosta et al. 2019). This recent initiative builds upon continued developments in the application of electrical property measurements that started to emerge around three dec-ades ago, when the multi-frequency approach was first applied to cementitious systems (McCarter et al. 1988) and subsequently triggered widespread interests from the research community (Coverdale et al. 1993; Liu and Beaudoin 1999; Neithalath et al. 2006; Nokken and Hooton 2008). Electrical property measurements, as applied to cement systems, continued to evolve until today and are increasingly finding their way beyond research laboratories.
In this paper, the electrical properties of concrete – both the bulk concrete and the pore fluid within the cap-
illary pore network – are developed to highlight the testing methodology as a potential performance-based testing technique. A concrete durability/performance classification system/criteria, based on intrinsic electrical properties, is presented with emphasis placed on as-sessing the relative performance of Portland cement (PC) concrete and concretes containing ground granulated blast furnace slag (GGBS) which is now routinely specified in concreting operations (Kanda et al. 2015; Hashimoto et al. 2016; Lye et al. 2016; Ishida et al. 2018; Matthes et al. 2018). Data are presented for concrete specimens undergoing continuous moist curing, and as such, results are directly relevant to concrete that remains saturated (little/no time to dry out). It is envisaged that the testing methodology could be developed and ex-ploited as a pre-qualification test at the design stage, prior to concreting operations or during construction to ensure that the concrete, as delivered, is substantially the same as the pre-qualified concrete.
2. Experimental programme
2.1 Materials and mix proportions The cementitious materials used in this experimental programme were CEM I 52.5 N Portland cement, con-forming to BS EN197-1:2011 (BSI 2019b), and GGBS (Regen, supplied by Hanson UK) conforming to BS EN15167-1:2006 (BSI 2006). Four concrete mixes with a water/binder ratio of 0.5 were produced and summa-rised in Table 1: one mix contained plain Portland ce-ment (CEM I), whereas the other three contained varying levels of GGBS with replacement levels of 35%, 50%, and 65%, which can all be categorised as CEM III/A (BSI 2019b). Typical oxide analysis and physical prop-erties of the materials are presented in Tables 2 and 3. A high-range water-reducing (HRWR) admixture (Mas-terGlenium ACE499) was used in all mixes at a dosage of 0.5% by mass of binder.
Table 3 Physical properties of cementitious materials.
Material Specific gravity Blaine surface area (m2/kg)
CEM I 3.15 400 GGBS 2.90 not determined
Table 2 Oxide analysis of cementitious materials. Material SiO2 Al2O3 Fe2O3 CaO MnO MgO TiO2 SO3 K2O Na2O CEM I 19.9 4.94 3.07 62.02 Not determined 2.08 n.d. 3.0 0.62 0.15 GGBS 33.27 13.38 0.56 41.21 0.3 8.49 0.9 n.d. 0.50 0.00
Table 1 Summary of concrete mixes (w/b = 0.5). Mix
Designation CEM I 52.5 N
kg/m3 GGBS kg/m3
20 mm kg/m3
10 mm kg/m3
Fine (< 4 mm) kg/m3
HRWR kg/m3
PC 380 0 620 410 840 1.9 GGBS/35 247 133 617 407 835 1.9 GGBS/50 190 190 616 406 833 1.9 GGBS/65 133 247 614 406 832 1.9
Note: HRWR means high range water reducer.

B. Suryanto, J. Kim, W. J. McCarter, G. Starrs and M. W. Aitken / Journal of Advanced Concrete Technology Vol. 18 437-455, 2020 439
2.2 Sample dimensions, fabrication and curing A total of 21 cubes were produced for each mix; three cubes with dimensions of 150 × 150 × 150 mm were used for electrical testing and the remaining eighteen cubes with dimensions of 100 × 100 × 100 mm were used for mechanical testing. A pair of 2.4 mm diameter stainless steel (Grade 316L) pin-electrodes were embedded inside each 150 mm cube (see Fig. 1) during casting at a cen-tre-to-centre spacing of 50 mm (i.e. > 2 × maximum aggregate size). Both pins were inserted into the centre of each cube at a depth of 100 mm from the top surface. They were secured in position by means of an acrylic former placed over the top centreline of each cube. Each pin was sleeved with heat shrink tubing apart from the 50 mm tip inside the cube (and a short tip outside of the cube) to facilitate electrical measurements (see Fig. 1). Embedding the electrodes in this fashion not only en-sures intimate contact between the electrodes and con-crete, but also negates any electrode/concrete interfacial effects on the measured electrical response [see, for example, McCarter et al. (2015a, 2015b)]. It should be noted this type of embedded electrode system is ideally suited for saturated concrete (i.e. concrete undergoing continuous moist curing). For partially saturated concrete (i.e. concrete exposed to wetting/drying cycles), the multi-electrode arrays, with pairs of electrodes placed at discrete depths from the exposed surface [see, for ex-ample, McCarter et al. (2012)], could be used.
Each concrete mix was manufactured at one-week intervals using a 200-litre pan mixer in accordance with BS EN 12390-2:2019 (BSI 2009). After mixing, the fresh concrete was cast into respective moulds (polystyrene moulds for the 150 mm cubes and steel moulds for the 100 mm cubes) before being compacted in two equal layers on a vibrating table; all moulds were treated prior to casting with a proprietary release agent. Immediately after casting, the cubes were covered with cling film to prevent moisture loss and demoulded at 24 hours before being placed in a curing tank located in a tempera-ture-controlled laboratory (20 ± 2°C). The cubes re-mained in the curing tank until they were required for testing.
2.3 Electrical and mechanical testing Once the appropriate curing age was achieved, each cube was removed from the curing tank, surface dried with a paper towel, and electrical measurement taken using a Solartron 1260 frequency response analyser (FRA). The analyser was operated in voltage drive mode at a signal amplitude of 350 mV rms, with logarithmic sweep measurements taken over the 1 Hz to 10 MHz frequency range at 20 points per decade. The measurements were taken using four individually screened short coaxial leads in a two-point mode configuration i.e. the cur-rent-generator and potential-high leads were coupled to one electrode, by means of an alligator clip, and the current-input and potential-low leads to the other elec-trode though another alligator clip. The cubes were re-turned to the curing tank and measurements repeated on a regular basis over a 360-day period.
The strength development of the concrete cubes was determined using a 3000 kN Avery-Denison testing machine over a 180-day period. The load was applied at a rate of 240 kN/min, representing the lower bound of the recommended rates in BS EN 12390-3:2019 (BSI 2019c).
2.4 Preliminaries and data processing When a cement-based sample is placed between a pair of electrodes and subjected to a small amplitude alternating current extending over several decades of frequency, the complex impedance response at any frequency, *( )Z ω , is given in Nyquist format as,
*( ) ( ) ( )Z Z iZω ω ω′ ′′= − (1)
where ( )Z ω′ is the resistive or in-phase component; ( )Z ω′′ is the quadrature or out-of-phase component; ω
is the applied (angular) frequency and 1i = − . Both components can be measured as a function of frequency of applied electrical field and are commonly presented on a Nyquist form, where ( )Z ω′′− is plotted against
( )Z ω′ over several decades of frequency. A typical impedance response obtained using the two-point method described in Section 2.3 is presented in Fig. 2,
` `
150
50
50150
Heat shrinktubing
Acrylic
`
150
100
2.4 mmdia pinelectrode
(Dimensions: mm)Fig. 1 Schematic diagram showing concrete sample and electrode configuration used in the experimental pro-gramme.
Fig. 2 Schematic showing the typical impedance re-sponse of a cementitious system displaying the defini-tions of electrode and bulk responses, and the bulk re-sistance, R.

B. Suryanto, J. Kim, W. J. McCarter, G. Starrs and M. W. Aitken / Journal of Advanced Concrete Technology Vol. 18 437-455, 2020 440
with frequency increasing from right-to-left across the curve. The Nyquist plot comprises two distinct regions: a spur at the right-hand (low-frequency) side of the plot, which is representative of the polarisation at the elec-trode/sample interface, and an arc whose centre is de-pressed below the real axis at the left-hand (high-frequency) side, which can be associated with the bulk response of the sample (McCarter and Brousseau 1990; Christensen et al. 1994; Suryanto et al. 2016; Kim et al. 2019). The junction between the electrode spur and the arc is commonly referred to as the cusp point. The bulk resistance of the test sample, R (Ω), which will be related to ionic conduction processes (Whittington et al. 1981), can be obtained from the intercept of the low-frequency end of the arc with the real axis and is easily identifiable. This value is then multiplied by the electrode geometrical factor, k (m), to give the bulk re-sistivity, ρ (Ωm), as given by:
mkRρ = Ω (2)
The electrical field between the pin-electrodes in the two-point method is ill-defined and the geometrical factor for this spatial arrangement cannot be readily calculated; however, this can be evaluated through a calibration procedure using the four-point method (McCarter et al. 2013a). This was conducted by placing a stainless-steel plate-electrodes at opposite (external) faces of each cube, with a saturated synthetic sponge inserted between the plate and the specimen interface to provide intimate contact (McCarter et al. 2015a; Sury-anto et al. 2018b). These plates were then connected to the current generator and input terminals in the FRA, whereas the embedded pin-electrodes were connected to the potential high and low terminals.
As the electrical field between the current electrodes is uniform and electrode polarisation problems are, effec-tively, eliminated using the four-point method, the measured concrete resistance can be converted to resis-tivity through the geometrical factor, k = A/L (McCarter et al. 2015b), where, for the prismatic sample, A (m2) is
the cross-sectional area of the test sample (0.15 × 0.15 m = 0.0225 m2) and L (m) the distance between the two potential electrodes (= 0.05 m). The frequency in the four-point measurement was taken at 1 kHz, following the findings in a previous study (McCarter et al. 2015b).
Figure 3 presents concrete resistivity calculated using the four-point method, plotted against concrete resistance measured between the embedded pin-electrodes using the two-point method. Both measurements were taken at 28 days curing, with the markers representing the meas-ured data (mean value) and the x and y error bars repre-senting ± 1 standard deviation (note that in cases where the error bar appears missing, the data markers are larger than the error bar). The slope of the best linear-fit relation gives the geometrical constant (= 0.065 m) for the em-bedded electrode pair. Measured resistance readings at any curing time could, therefore, be simply converted to resistivity through the relationship:
0.065 mRρ = Ω (3)
where R is the low-frequency intercept obtained from the impedance response discussed above.
In the discussion below, the two-point method is used as, from a practical point of view, it has the added ad-vantage of being much simpler to perform than the four-point method [and other methods such as the time domain reflectometry (TDR) (Woo et al. 2007; Rangelov and Nassiri 2019)] and hence lends itself to in-situ monitoring and remote interrogation (McCarter et al. 2012).
3. Results and Discussion
3.1 Strength development Although the focus of this paper is to assess the durability performance of concrete based on its electrical properties, for completeness, it was considered appropriate to dis-cuss the compressive strength development of the con-cretes. Figure 4 presents the mean compressive strengths versus curing time for all mixes over the initial 180-day
Fig. 3 Calibration curve for the embedded electrode pair presented in Fig. 1.
0 30 60 90 120 150 1800
10
20
30
40
50
60
PC A PC S GGBS/35 GGBS/35 GGBS/50 GGBS/50 GGBS/65 GGBS/65
Com
pres
sive
stre
ngth
(MP
a)
Time (days)
Experiment Analysis
Fig. 4 Compressive strength development over the initial 180-day curing period.
B. Suryanto, J. Kim, W. J. McCarter, G. Starrs and M. W. Aitken / Journal of Advanced Concrete Technology Vol. 18 437-455, 2020 441
period, with the markers representing the test data and the error bars representing ± 1 standard deviation. Also, as before, in cases where the error bar appears to be missing, the data marker is larger than the error bar. In general terms, it is evident that as the curing period in-creases, the compressive strength of the concrete also increases. The increase in strength with time is repre-sented by best fit curves in Fig. 4 using the BS EN 1992-1-1:2004 expression (BSI 2015):
0.5ref(1 ( / ) )
ref( ) MPas t tf t f e −= (4)
where ( )f t is the predicted compressive strength at age t (day); fref is the compressive strength at reference age tref (= 28 days) and the exponent s is a constant that indicates the rate of strength development. Best-fit curves for each mix are plotted on this figure in solid lines through the measurement points using the parameters presented in Table 4.
With reference to Fig. 4, in the short term, the PC mix gains strength more rapidly than the GGBS mixes, whereas in the longer term (i.e. > 60 days) the PC mix only develops a marginal strength increase. This is as expected as the PC mix undergoes hydration reaction, whereas the GGBS mixes undergo both hydration and pozzolanic reaction, the latter occurring at a reduced rate (Hinrichs and Odler 1989; Luan et al. 2012). This is in agreement with the magnitude of the s parameter used to fit the data, which was evaluated as 0.25 for the PC mix and 0.38 for the GGBS mixes (i.e. the higher the s value the lower the rate of strength development).
It is also apparent from Fig. 4 that although the re-placement of PC with GGBS reduces the short-term compressive strength of the concrete, it is not detrimental
in the long-term due to the pozzolanic reaction of the GGBS which continues over an extended period of time. At 90 and 180 days, for example, the GGBS/35 and GGBS/50 mixes both demonstrate a comparable, if not higher, compressive strength than the PC mix high-lighting the beneficial effect of GGBS at a longer time scale.
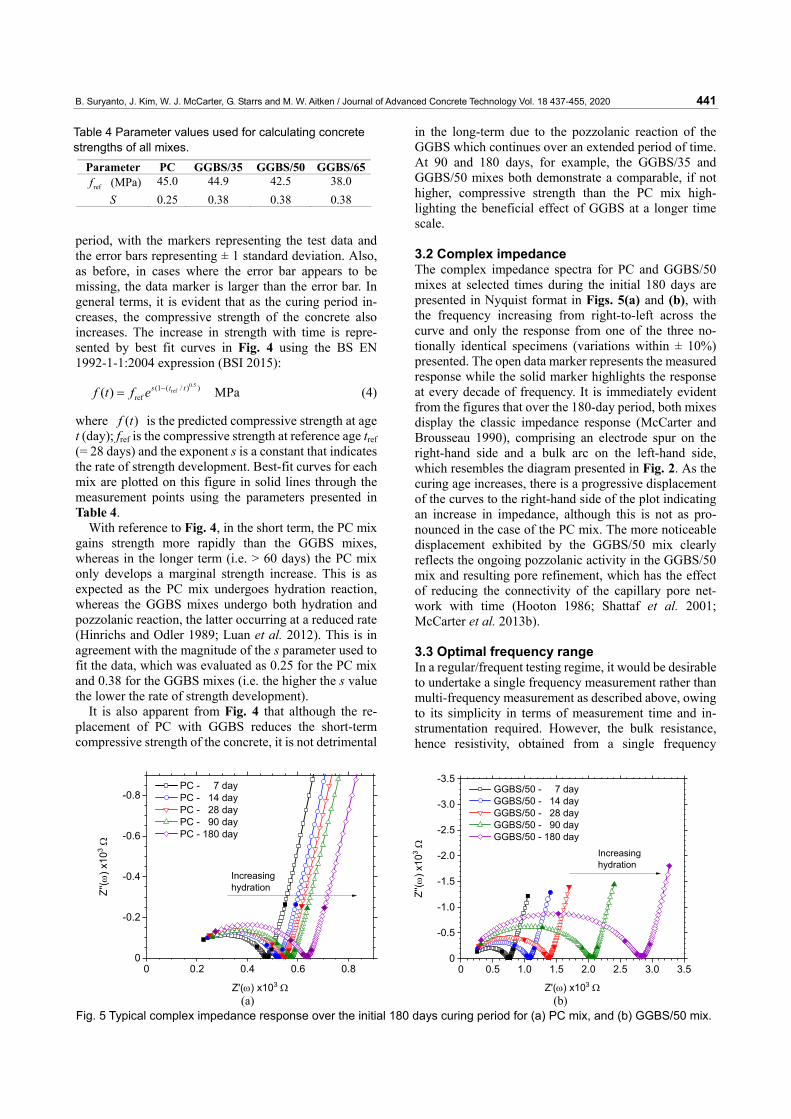
3.2 Complex impedance The complex impedance spectra for PC and GGBS/50 mixes at selected times during the initial 180 days are presented in Nyquist format in Figs. 5(a) and (b), with the frequency increasing from right-to-left across the curve and only the response from one of the three no-tionally identical specimens (variations within ± 10%) presented. The open data marker represents the measured response while the solid marker highlights the response at every decade of frequency. It is immediately evident from the figures that over the 180-day period, both mixes display the classic impedance response (McCarter and Brousseau 1990), comprising an electrode spur on the right-hand side and a bulk arc on the left-hand side, which resembles the diagram presented in Fig. 2. As the curing age increases, there is a progressive displacement of the curves to the right-hand side of the plot indicating an increase in impedance, although this is not as pro-nounced in the case of the PC mix. The more noticeable displacement exhibited by the GGBS/50 mix clearly reflects the ongoing pozzolanic activity in the GGBS/50 mix and resulting pore refinement, which has the effect of reducing the connectivity of the capillary pore net-work with time (Hooton 1986; Shattaf et al. 2001; McCarter et al. 2013b). 3.3 Optimal frequency range In a regular/frequent testing regime, it would be desirable to undertake a single frequency measurement rather than multi-frequency measurement as described above, owing to its simplicity in terms of measurement time and in-strumentation required. However, the bulk resistance, hence resistivity, obtained from a single frequency
Table 4 Parameter values used for calculating concrete strengths of all mixes.
Parameter PC GGBS/35 GGBS/50 GGBS/65reff (MPa) 45.0 44.9 42.5 38.0
S 0.25 0.38 0.38 0.38
0 0.2 0.4 0.6 0.80
-0.2
-0.4
-0.6
-0.8 PC - 7 day S PC - 14 day PC - 28 day PC - 90 day PC - 180 day
Z''(ω
) x10
3 Ω
Z'(ω) x103 Ω
Increasinghydration
0 0.5 1.5 2.5 3.51.0 2.0 3.00
-0.5
-1.5
-2.5
-3.5
-1.0
-2.0
-3.0 GGBS/50 - 7 day S GGBS/50 - 14 day GGBS/50 - 28 day GGBS/50 - 90 day GGBS/50 - 180 day
Z''(ω
) x10
3 Ω
Z'(ω) x103 Ω
Increasinghydration
(a) (b) Fig. 5 Typical complex impedance response over the initial 180 days curing period for (a) PC mix, and (b) GGBS/50 mix.

B. Suryanto, J. Kim, W. J. McCarter, G. Starrs and M. W. Aitken / Journal of Advanced Concrete Technology Vol. 18 437-455, 2020 442
measurement can be affected by spurious electrode po-larisation effects if the frequency is too low or relaxation processes if the frequency is too high, which can lead to significant errors. A priori evaluation of the optimal frequency/frequency range (using multi-frequency measurements) over which the electrode effects are re-duced to minimal proportions is discussed below.
Figure 6 displays the frequency obtained from the cusp point for all mixes using the electrode geometry and spatial arrangement described above. It is clear that the cusp-point frequency is affected by binder type and curing time. As curing time increases, there is an overall reduction in cusp-point frequency, particularly over the initial 60 days suggesting that the cusp-point frequency is related not only to the electrode configuration, but also to the rate of hydration and microstructural changes within the cementitious binder which are, in turn, affected by the GGBS replacement level. It is also apparent that the cusp-point frequency attains an almost constant value in the longer term. To obtain the optimal frequency range which could then be used in a single frequency meas-urement, resistivity was de-embedded from the imped-ance data obtained over the entire frequency range of investigation through the relationship (Suryanto et al.
2016; 2018a): 2 2( ) ( )( ) m
( )Z Z k
Zω ωρ ω
ω′ ′′+
= Ω′
(5)
where ( )Z ω′ and ( )Z ω′′ are as in Eq. (1) and k is the geometrical constant for the embedded electrode pair (= 0.065 m).
Figures 7(a) and (b) display the resistivity of the PC and GGBS/50 mixes calculated using Eq. (5) and plotted in the frequency domain, with the frequency at the cusp-point highlighted using circular data markers. It is evident that the resistivity decreases with frequency across the entire frequency range of the investigation and increases with increasing hydration (or curing time). The overall increase in resistivity with time is due to the continual refinement of pore-structure as a result of the on-going hydration and pozzolanic activity (further dis-cussed in the section below), whereas the decrease in resistivity with an increase in frequency is due to the reducing electrode polarisation and relaxation/dispersion of the bulk polarisation processes within the concrete. In general, the frequency-domain response can be divided into three distinct frequency regions: low (< 100 Hz), intermediate (100 Hz to 100 kHz) and high frequency (> 100 kHz) range. Over the low frequency range, electrode polarisation operates and results in an increased resistiv-ity with decreasing frequency, increasing to anomalously high values at 1 Hz. For example, the PC mix, resistivity increases to > 300 Ωm at 1 Hz. Over the intermediate frequency range, there is a very gradual decrease in re-sistivity with increasing frequency and is a direct result of relaxation of the polarisation processes (e.g. double layer). Over the higher frequency range, a greater re-duction in resistivity is evident and this can be associated with the relaxation of double-layer polarisation relaxing within the kHz region (Schwan et al. 1962) and a stronger contribution resulting from relaxation of Max-well-Wagner interfacial polarisation processes at fre-quencies > 1 MHz (Hasted 1973).
Overall, based on the range of the cusp-point fre-
0 60 120 180 240 300 3600.1
1
10
PC GGBS/35 GGBS/50 GGBS/65
Cus
p-po
int f
requ
ency
(kH
z)
Time (days)Fig. 6 Cusp-point frequency for all mixes.
100 101 102 103 104 105 106 107
100
20
600
Increasinghydration
3 7 14 28 42 56 90 180 360 Cusp
Bul
k re
sist
ivity
(Ωm
)
Frequency (Hz)
PC
frequencyrange
Optimal
Age (days)
100 101 102 103 104 105 106 107
100
20
600
hydrationIncreasing
3 7 14 28 42 56 90 180 360 Cusp
Bul
k re
sist
ivity
(Ωm
)
Frequency (Hz)
GGBS/50frequency
range
OptimalAge (days)
(a) (b)
Fig. 7 Frequency domain response of resistivity for the (a) PC and (b) GGBS/50 mixes.

B. Suryanto, J. Kim, W. J. McCarter, G. Starrs and M. W. Aitken / Journal of Advanced Concrete Technology Vol. 18 437-455, 2020 443
quencies obtained from all mixes using the testing ar-rangement described above, the work indicates that the optimal frequencies which can be used in a single fre-quency measurement are in the 400 Hz to 8 kHz range; this frequency range falls within the plateau region of the frequency domain responses presented in Figs. 7(a) and (b). This frequency range is large enough to minimise errors due to electrode polarisation effects and low enough to ensure that bulk polarisation processes do not influence the resistance. The bulk electrical property of cement-based systems can therefore be determined within this frequency range (i.e. via a single-frequency measurement) without the need for plotting and locating the cusp point (as described earlier in Figs. 2 and 5). This approach would still maintain a high level of accuracy and due to its ease of use and practicality, it can be ap-plied to a regular/frequent testing regime more effec-tively. It is, therefore, recommended that a-priori (multi-frequency) measurements, as described above, should, ideally, be undertaken, particularly when differ-ent electrode configurations are used.
3.4 Bulk resistivity Figure 8 presents the bulk resistivity obtained from the cusp-point frequency for all mixes presented on a semi logarithmic scale, with the data markers displaying the measured data obtained using Eq. (6) and the error bar representing ± 1 standard deviation. The solid lines are the best-fit curves for each mix and plotted through the data points using the relationship,
refref
( ) mn
ttt
ρ ρ⎛ ⎞
= Ω⎜ ⎟⎝ ⎠
(6)
where ρ(t) (Ωm) is the predicted resistivity at time t (day); refρ and reft are, respectively, the reference resistivity (Ωm) and reference time (day); and n, is the ageing exponent which is related to both hydration and pozzolanic activity. In this work, the reference time is taken as 28 days. Overall, all mixes display a continual increase in resistivity mimicking the strength develop-
ment curve. Mixes containing GGBS, generally, exhibit a higher resistivity than the PC mix except during the initial period of about 10 days when the PC mix displays higher values than the GGBS/35 mix. There are several competing factors that influence the resistivity of the concretes, which include the following: (a) The release of ions during hydration which will in-
crease ionic concentrations within the pore fluid (Taylor 1987; Larbi et al. 1990). Although some of these ions would be captured in the hydrate formation, dissolution will generally have a more dominant in-fluence. This will therefore have the effect of de-creasing the pore-fluid resistivity and hence the bulk resistivity;
(b) Pore structure refinement resulting from on-going hydration and pozzolanic activity which will decrease porosity (Zhou et al. 2010; Berodier and Scrivener 2015; Kurumisawa and Nawa 2016) and hence in-crease the bulk resistivity; and
(c) Increasing constriction and tortuosity and decreasing connectedness of the pore network, which is as a di-rect result of pore structure refinement (Gallucci et al. 2007; Promentilla et al. 2009; Yio et al. 2019; Song et al. 2020; Zhang et al. 2020). This will, in turn, in-crease the bulk resistivity.
Figure 8 would suggest that (b) and (c) must exert a greater influence on bulk resistivity than (a) – viz, mi-crostructural changes have a greater influence than changes in pore-fluid chemistry. Furthermore, it is in-teresting to note at the end of the test period that whilst the four different concrete mixes display comparable compressive strength (to within ± 10%, see Fig. 4), they display a more distinguishable variation in bulk resistiv-ity (i.e. up to an order of magnitude in Fig. 8). This clearly reflects the role of GGBS in producing concrete with a much more disconnected and tortuous pore structure although not necessarily of a lower porosity than the plain PC mix (Kim et al. 2018).
3.5 Formation factor and pore-fluid resistivity The resistivity of concrete alone cannot be used as a measure of its ability to resist chloride ingress as it is dependent not only upon the interconnectivity of the capillary pore network, but also on the resistivity of the pore fluid. To investigate the influence of changes in the concrete microstructure alone, the effect of the pore fluid resistivity must be taken into consideration.
In relation to saturated rock formations (Archie 1942), the ratio of the bulk resistivity of the saturated rock, ρ (Ωm), to the resistivity of the saturating fluid (i.e. pore fluid), ρf (Ωm), is related to the rock porosity, φ , through the relationship,
f
mF aρ φρ
−= = (7)
where F is defined as the formation factor; a is a correc-tion factor, which is valid over a specified range of po-rosities φ ; and the exponent m is the cementation factor
0 60 120 180 240 300 360
100
20
600PC S GGBS/35GGBS/50 GGBS/65
Bul
k re
sist
ivity
(Ωm
)
Time (days)
ρ = 35 (t/28)0.10
ρ = 55 (t/28)0.30
ρ = 93 (t/28)0.34
ρ = 165 (t/28)0.32
R2 = 0.86
R2 = 0.98
R2 = 0.98
R2 = 0.91
Fig. 8 Bulk resistivity versus time response for all mixes and fitting equations.

B. Suryanto, J. Kim, W. J. McCarter, G. Starrs and M. W. Aitken / Journal of Advanced Concrete Technology Vol. 18 437-455, 2020 444
which is related to the tortuosity and connectivity of the pore network within the rock. A wide range of values have been reported for m and a for different rock and sediment formations, with a in the range 0.4 to 2.5 and m in the range 1.2 to 2.5 (Worthington 1993; Khalil and Monterio Santos 2009). Whilst the pore fluid resistivity can be determined experimentally through using a pore-fluid expression technique [see, for example, Ba-rneyback and Diamond (1981), Lothenbach and Winne-feld (2006) and Tsui-Chang et al. (2019)], this method is extremely difficult to execute in concretes especially at
longer timescales. In this work, the Virtual Cement and Concrete Testing
Laboratory (VCCTL) software (NIST 2019) was used to evaluate the pore fluid resistivity, ρf (Ωm). VCCTL is a virtual platform that can be used to model the hydration, microstructural development, and physical properties of cementitious systems. The pore-fluid resistivity is cal-culated based on the pore structure generated by the software [see, for example, Fig. 9(a)] and pore-fluid chemistry which is calculated automatically in the soft-ware from the concentration of primary ions (i.e. Na+, K+, SO4
2- and OH–) in the pore-water and their equivalent conductivity, using the NIST model (Snyder et al. 2003; Bentz 2007). The ionic concentrations are calculated using the binder composition and the total and soluble alkali contents in the cementitious materials. Regarding the latter, it was assumed that 35% of the Na2O and 55% of the K2O are released into the pore-water upon gauging, following the recommendations in Brouwers and vanEijk (2003). The accuracy of the core platforms implemented in the VCCTL for determining the pore-fluid chemistry and resulting conductivity was previously studied by several investigators [see, for example, Chen and Brouwers (2010), Tsui Chang (2017) and Riding et al. (2018)] and varying degrees of success were obtained.
Figure 9(b) presents the computed pore-fluid resis-tivity for each mix over the entire test period. It is ap-parent that there is a rapid reduction in pore fluid resis-tivity over the initial few weeks of curing which is then followed by a continual reduction over the remainder of the test period, albeit at a much decreased rate when hydration has already advanced beyond the 28-day cur-ing period, which reaffirms statement (a) in Section 3.4. The plots also show that the pore-fluid resistivity in-creases with an increasing level of GGBS replacement (due to decreasing ionic concentrations in the pore fluid) and that the difference in value remains almost constant and envisaged as an offset. This is due to the assumption that it is only alkalis in the cement that contribute to the pore solution chemistry as those in the slag are absorbed on the slag products of hydration (Bentz 2007; Schäfer and Meng 2001). As such, it should be possible to cal-culate the pore solution resistivity of the GGBS mixes based on the magnitude of replacement levels without the need to perform laborious and complex pore-water ex-traction or computer simulation. This aspect is currently being investigated and not presented in the current work.
Having evaluated the pore-fluid resistivity, it is now possible to determine the formation factor using Eq. (8). Figure 10 presents the computed formation factor over the 360-day period for each concrete mix. The data markers represent the test data while the lines are the best-fit curves plotted through the data points using the relationship:
refref
( )n
tF t Ft
⎛ ⎞= ⎜ ⎟
⎝ ⎠ (8)
(a)
0 60 120 180 240 300 3600
0.1
0.2
0.3
0.4
0.5
0.6 PC S GGBS/35 GGBS/50 GGBS/65
Por
e so
lutio
n re
sist
ivity
(Ωm
)
Time (days)(b)
Fig. 9 (a) Pore structure generated at 6 hours and 90 days of hydration for the matrix in the PC and GGBS/50 mixes. (b) Estimated pore solution resistivity at various GGBS replacement levels.

B. Suryanto, J. Kim, W. J. McCarter, G. Starrs and M. W. Aitken / Journal of Advanced Concrete Technology Vol. 18 437-455, 2020 445
where ( )F t is the predicted formation factor at time t (day); refF and reft are, respectively, the reference formation factor and time (day); and n, is the ageing exponent which is related to hydration and pozzolanic activity. As before, the reference time was taken as 28 days. The trend is similar to that observed in the bulk resistivity and it is evident from Fig. 10 that all mixes display a continual increase in formation factor over the entire test period, indicating ongoing pore structure re-finement, which reaffirms statements (b) and (c) in Sec-tion 3.4. It is clearly observed that the GGBS mixes exhibit a higher formation factor than the PC mix, apart from the initial stage up to about 28 days where the op-posite trend is observed. The higher formation factor exhibited by the GGBS mixes indicates that the re-placement of Portland cement with GGBS results in further pore structure refinement in the longer term by producing a capillary pore network which is more tor-tuous and disconnected in nature. This is as a direct result of gradual infilling of the capillary pore space with fur-ther hydrate formation from the reaction of the GGBS with cement hydrates. The reduced pore interconnectiv-ity will reduce ionic mobility and, therefore, increase the resistance of the concrete to ionic (i.e. chloride) ingress (Takahashi and Ishida 2016). At the end of the test period, the formation factor (± 5) increases in the order PC (315); GGBS/35 (545); GGBS/50 (835) and GGBS/65 (1040). It is accepted that these values are based on the evalua-tion of the resistivity of the pore-water which is currently at best approximate and work is continuing in this respect. Finally, it is noteworthy that while the formation factor can give a measure of the resistance of concrete to chlo-ride ingress, the resistivity of concrete surrounding the embedded steel reinforcement has a key role to play in corrosion dynamics as it governs the magnitude of the corrosion current, hence the corrosion rate of steel after depassivation. The higher the concrete resistivity, the lower will be the corrosion current flow between the anodic and cathodic areas along the surface of the steel reinforcement and therefore a lower corrosion rate will result.
3.6 A performance-based durability index Given that concrete durability and the formation factor are both linked to the hierarchical porous nature of the cementitious binder, the formation factor parameter de-scribed above could be used to rank the relative per-formance of the concretes. In this work, the previously reported empirical concrete durability classification systems by Broomfield and his co-workers (Broomfield 1997; ACI Committee 222 2001) and by Balestra et al. (2019) are used to establish performance (formation-factor) based durability criteria. Based on the assumption that the pore-fluid resistivity in the previous studies is com-parable to this study, the empirical resistivity thresholds in the two classification systems are normalised against the pore-fluid resistivity of the PC mix at 28 days (ρf = 0.15 Ωm), as its value changes only marginally beyond this point of time. The results are further compared with the durability classification system suggested in Alex-ander et al. (1999); in this classification, however, as the concrete is pre-conditioned by vacuum saturation with 5 M NaCl solution, the pore-fluid resistivity in the analysis is taken as 0.035 Ωm (McCarter et al. 1996) assuming that the concrete is fully saturated with the NaCl solution despite its very high molarity. The computed formation factor (± 50) for each empirical concrete resistivity threshold is presented in Tables 5, 6 and 7. Overall, it is evident that the computed formation factor thresholds presented in Table 6 are the most stringent, whereas those presented in Table 7 are the most lenient.
Table 8 provides the performance of the concrete mixes investigated in this study at selected curing ages over the 360-day period based on the classifications presented in Tables 5, 6 and 7. With reference to classi-fications in Table 5, it is apparent that the performance of the concretes to corrosion varies from “Low” to “High” depending on the binder type and time. The PC mix,
Table 6 Concrete resistivity values for marine concrete adapted from Balestra et al. (2019) and estimated formation factor classification.
Probable corrosion risk
Resistivity (Ωm) (Balestra et al. 2019)
Estimated Formation Factor*
Very High < 150 < 1000 High 150 to 200 1000 to 1350
Medium 200 to 550 1350 to 3700 Low 550 to 800 3700 to 5350
Negligible > 800 > 5350 Note: *Based on pore-fluid resistivity of 0.15 Ωm.
Table 5 Concrete resistivity thresholds adapted from Broomfield (1997) and estimated formation factor classification.
Resistance to corrosion
Resistivity (Ωm) (Broomfield 1997)
Estimated Formation Factor*
Low < 50 < 350 Low/Moderate 50 to 100 350 to 700
High 100 to 200 700 to 1400 Very High > 200 > 1400
Note: *Based on pore-fluid resistivity of 0.15 Ωm.
0 60 120 180 240 300 360100
1000
200
500
2000PC S GGBS/35GGBS/50 GGBS/65
Form
atio
n Fa
ctor
Time (days)
F = 245 (t/28)0.10
F = 260 (t/28)0.31
F = 340 (t/28)0.36
F = 435 (t/28)0.35
Fig. 10 Estimated Formation Factor for all mixes.

B. Suryanto, J. Kim, W. J. McCarter, G. Starrs and M. W. Aitken / Journal of Advanced Concrete Technology Vol. 18 437-455, 2020 446
regardless of time, exhibits Low performance throughout as would be expected from a plain PC mix with a mod-erate w/c ratio. The GGBS mixes consistently outrank the PC mix at longer timescales, in particular GGBS/50 and GGBS/65, which show a transition from Low to High resistance against corrosion with increasing time. This result would suggest that as electrical measurements are technically simple and straightforward to perform, multiple measurements could be performed during the normal curing period (and beyond) to evaluate the like-lihood of future performance of a concrete mix in terms of its resistance to chloride ingress. This is especially useful in assessing the performance of concretes with supplementary cementitious materials such as the GGBS concretes investigated in this study which normally un-dergo a more progressive pore structure development than plain PC concretes.
Based on the performance classification in Table 6, it is surprising that all the concretes are now classified as a “Very High” risk of corrosion, although they all satisfy the maximum w/b ratio and minimum binder content requirements specified in BS 8500-1:2015 (BSI 2019a) to resist environmental exposure classes XD1 and XD2 (exposure to chlorides other than from sea water) for an intended working life of at least 100 years with a 50 mm cover to steel, and requirements specified by the Japan Society of Civil Engineers (JSCE 2007b) to resist envi-
ronmental exposure classification “Undersea” and other classifications (i.e. “Offshore air” and “Splash zone”) if supplemented with test data. It is also noteworthy that the GGBS concretes investigated in this study also meet the minimum w/b ratio and binder content requirements in BS 8500-1:2015 to resist environmental exposure classes XD3 (cyclic wet and dry from water containing chlorides other than from sea water); XS1 (airborne salt from sea water) and XS2 (permanently submerged in sea water) for the same intended working life (> 100 years) with a 60 mm cover; and XS3 (tidal, splash and spray zones) with a thicker (70 mm) cover. This would indicate that the performance criteria adopted in this classification are too stringent. In contrast, based on the durability per-formance indices presented in Table 7, it is evident that all mixes now fall primarily under either “Good” or “Excellent” durability category, including the PC mix. Referring to the requirements of BS 8500-1:2015 (BSI 2019a) and the JSCE specification (2007b) above, there is evidence to suggest that the performance criteria in this classification are too lenient and more stringent criteria would be required to disqualify mixes that potentially have low performance in terms of its resistance to chlo-ride ingress in the longer term. The large discrepancies amongst the estimated performance index thresholds clearly warrant further investigation and will be the di-rection of future work.
Table 8 Relative performance of concrete mixes investigated in this study based on the classifications presented in Tables 5, 6 and 7.
Time PC GGBS/35
Days
F
Resistance to corrosion
(Table 5)
Probable corrosion
risk (Table 6)
Durability class
(Table 7)
F
Resistance to corrosion
(Table 5)
Probable corrosion
risk (Table 6)
Durability class
(Table 7)
7 203 Low Very High Good 139 Low Very High Poor 28 250 Low Very High Good 256 Low Very High Good 90 269 Low Very High Good 372 Moderate Very High Good
180 289 Low Very High Good 469 Moderate Very High Excellent 360 315 Low Very High Good 546 Moderate Very High Excellent
Time GGBS/50 GGBS/65
Days
F
Resistance to corrosion
(Table 5)
Probable corrosion
risk (Table 6)
Durability class
(Table 7)
F
Resistance to corrosion
(Table 5)
Probable corrosion
risk (Table 6)
Durability class
(Table 7)
7 176 Low Very High Poor 201 Low Very High Good 28 342 Low Very High Good 434 Moderate Very High Excellent 90 509 Moderate Very High Excellent 633 Moderate Very High Excellent
180 662 Moderate Very High Excellent 827 High Very High Excellent 360 836 High Very High Excellent 1038 High High Excellent
Table 7 Durability classification system adapted from Alexander et al. (1999) and estimated formation factor classification.Durability
class Chloride Resistivity Index*(Ωm)
(Alexander et al. 1999) Estimated
Formation Factor** Very Poor < 4 < 100
Poor 4 to 6.5 100 to 200 Good 6.5 to 13.5 200 to 400
Excellent > 13.5 > 400 Notes: *Specimen vacuum saturated with 5 M NaCl solution;
**Based on pore-fluid resistivity of 0.035 Ωm.

B. Suryanto, J. Kim, W. J. McCarter, G. Starrs and M. W. Aitken / Journal of Advanced Concrete Technology Vol. 18 437-455, 2020 447
3.7 Formation factor and diffusion To provide a further direct measure of the ability of the concrete mixes to resist chloride ingress, the diffusivity of the concretes is discussed. As the solid phase in the concrete can be regarded as non-conductive in com-parison to that of the pore-fluid, diffusivity and ionic conductivity of a saturated porous material are connected through the Nernst-Einstein relationship (Lu 1997; Tu-midajski et al. 1996; McCarter et al. 2015c);
o
f i
DF
Dρρ
= = (9)
where Di (m2/s) is the instantaneous diffusion coefficient of the ion within the porous material; Do (m2/s) is the free-solution diffusion coefficient of the ion in an infi-nitely dilute bulk solution [in this work, the chloride ion is chosen and Do = 1.84 × 10⁻⁹ m2/s at 20°C (Li and Gregory 1974)] and other parameters are as before. It is noteworthy that Nernst-Einstein relation can be expected to always overestimate the conductivity (therefore, un-derestimate the resistivity) of an electrolyte as it disre-gards the formation of ion complexes in the pore solution
(such as ions with opposite charges in contact that do not produce a net charge, therefore not contributing for the dc-conductivity), as discussed for instance in the work of Harris and Kanakubo (2015). For the ionic concentration typically found in the pore solution of cement systems, however, the Nernst-Einstein relation could be consid-ered as a good approximation. Equations (6), (8) and (9) can, therefore, be combined to determine the instanta-neous diffusion coefficient at time t, as given by:
o refi
ref
( )nD t
D tF t
⎛ ⎞= ⎜ ⎟⎝ ⎠
m2/s (10)
Figure 11 presents the instantaneous diffusion coeffi-cient versus curing time over the entire 360-day test period, evaluated using Eq. (10). In this figure, the data markers represent the test data while the lines represent the best-fit curves. In general terms, it is apparent that all mixes display a similar trend, each exhibiting a rapid decrease in instantaneous diffusion which is then fol-lowed by a continuous gradual reduction over the re-mainder of the test period, indicating an enhanced resis-tance to chloride ingress with curing time. It is also ap-parent from the figure that the instantaneous diffusion coefficient decreases with increasing GGBS replacement levels, which at the end of the test period are in the order PC (5.8 × 10⁻¹² m2/s); GGBS/35 (3.2 × 10⁻¹² m2/s); GGBS/50 (2.2 × 10⁻¹² m2/s); and GGBS/65 (1.7 × 10⁻¹² m2/s).
It should be noted that the instantaneous diffusion coefficient discussed above is different to the diffusion coefficient normally obtained from the solution of the error function complement (erfc) to a one-dimensional chloride profile obtained from dust drillings of concrete exposed to chloride. This is generally referred to as the effective diffusion coefficient, Deff (m2/s), (Delagrave et al. 1996; Kato and Uomoto 2005; Patel et al. 2018) or when chloride binding is included, referred to as the apparent diffusion coefficient. For clarity, Fig. 12(a)
0 60 120 180 240 300 3601
10
2
5
20PC S GGBS/35GGBS/50 GGBS/65
Di x
10-1
2 (m2 /s
)
Time (days)
Di = 7.51x10⁻¹² (28/t)0.10
Di = 7.08x10⁻¹² (28/t)0.31
Di = 4.23x10⁻¹² (28/t)0.35
Di = 5.41x10⁻¹² (28/t)0.36
Fig. 11 Estimated instantaneous diffusion coefficient, Di.
0 60 120 180 240 300 360
10
2
5
20
PC B GGBS/35 GGBS/50 GGBS/65
Def
f x10
-12 (m
2 /s)
Exposure time, t-tex (days)
tex = 28 days
(a) (b) Fig. 12 (a) Schematic showing the definition of Di and Deff (McCarter et al. 2015), and (b) Estimated Deff assuming tex = 28 days plotted against exposure time (t-tex).

B. Suryanto, J. Kim, W. J. McCarter, G. Starrs and M. W. Aitken / Journal of Advanced Concrete Technology Vol. 18 437-455, 2020 448
displays the relationship between the instantaneous and the effective diffusion coefficient, Di and Deff, respec-tively, which can be related through the following rela-tionship (Pack et al. 2010; McCarter et al. 2015c),
exeff i
ex
1( ) ( )t
tD t D t
t t=
− ∫ m2/s (11)
where eff ( )D t is effective diffusion coefficient of the concrete at time t after casting; i ( )D t is the corre-sponding instantaneous diffusion coefficient of the con-crete at time t, with t being time at which the effective diffusion coefficient is required and ext being time at which the exposure to chloride starts. Figure 12(b) dis-plays the predicted effective diffusion coefficient, effD , over a period of one year, with zero time for exposure,
ext , taken as 28 days after casting. There is clearly a general reduction in effD with time, with the GGBS mixes displaying a more significant reduction in effD than the PC mix.
Figure 13 presents the comparison of the computed effective diffusion coefficients for the PC and GGBS/50 mixes over the 360-day period with some of the diffusion coefficients available in the literature (Collepardi et al. 1973; Diab et al. 1988; Dhir et al. 1990; Page et al. 1991; Tang and Nilsson 1992a, 1992b; Bamforth 1993; Mangat and Molloy 1994; Zhang and Gjorv 1995; Tang 1995; Arsenault et al. 1995; Higgins 1995; Polder 1995; Baroghel Bouny et al. 1995; Bentz et al. 1996; Johnson et al. 1996; Hooton et al. 1997; Kanaya et al. 1998; Pedersen and Arntsen 1998; Bleszynski et al. 2002; Yeau and Kim 2005; Thomas et al. 2008; Li et al. 2011; Chen et al. 2012; Maes et al. 2013; Shin et al. 2016), which are limited to an exposure time of one year, w/b ratios from 0.3 to 0.7 and slag replacement ratio of about 50%. Also presented on the figure is the apparent diffusion coeffi-cients of PC and GGBS cement concretes based on the Japan Society of Civil Engineers models (JSCE 2007a;
JSCE 2010): 2
10 eff,PC 3.9( / ) 7.2( / ) 13.99Log D w c w c= − + − m2/s (12)
210 eff,GGBS 3.0( / ) 5.4( / ) 13.69Log D w c w c= − + − m2/s (13)
where w/c is the water/cement ratio. It is worth noting that in these empirical equations, the effect of time is not considered. Equation (13) was proposed for GGBS ce-ment Type B to JIS R 5211 (JSA 2009) which corre-sponds to a replacement range of 30 to 60% (or, on av-erage, close to GGBS/50). For the mixes used in the work presented in this paper (w/c = 0.5), eff,PCD is evaluated as 4.3 × 10⁻¹² m2/s and eff,GGBSD as 1.8 × 10⁻¹² m2/s using, respectively, Eqs. (12) and (13).
It is apparent from Fig. 13, that there is clearly a large scatter in published values for diffusion coefficients of similar concretes and the effective diffusion coefficients computed for the PC and GGBS/50 mixes are within the range of the anticipated values. When compared with the JSCE predictions, the method of determination of the diffusion coefficient using the formation factor tends to overestimate the actual values (i.e. 4.3 × 10⁻¹² m2/s vs 6.3 × 10⁻¹² m2/s at 1 year, and 1.8 × 10⁻¹² m2/s vs 2.9 × 10⁻¹² m2/s at 1 year). This could possibly be attributed to the longer timescale from which the empirical equations were derived and possibly due to the fact that in the formation factor approach, no consideration on chloride binding and associated physical changes has been given. Accordingly, when the Deff derived from formation factor is used to make predictions as to the time to activation of corrosion, they would result in conservative estimates, i.e. they will underestimate the time to activation of corro-sion.
The estimated diffusion coefficients are based on the accuracy of the VCCTL model in predicting the resis-tivity of the pore-water which has not been experimen-tally validated; however, considering the extremely wide variation in published values for diffusion coefficients [see, for example, Fig. 13 or Bamforth et al. (1997)], the method of determination of the diffusion coefficient using the formation factor could be regarded as a good alternative and further developed as a means of indexing concrete performance based on its ability to resist chlo-ride ion penetration. The technique could, potentially, be exploited as a rapid, non-destructive method in a pre-qualification testing programme and further devel-oped to allow early estimation of the long-term diffusion coefficient.
4. Conclusions and concluding remarks
The work presented highlights the application of elec-trical property measurements to study microstructural changes and the ability of Portland cement concrete and concretes containing various levels of GGBS to resist chloride ingress. Testing was conducted over a 360-day period using a combination of bulk resistivity measure-ments and virtual pore-fluid simulations in the computer.
0.3 0.4 0.5 0.6 0.70.1
1
10
100
PC Eq. (12) GGBS . Eq. (13) Deff,PC,360 days Deff,GGBS/50,360 days
D ×
10-1
2 (m2 /s
)
w/bFig. 13 Comparison of the predicted and measured val-ues of diffusion coefficient reported in previous studies for PC and GGBS concretes with w/b ratios ranging from 0.3 to 0.7 and exposure time of less than 1 year.

B. Suryanto, J. Kim, W. J. McCarter, G. Starrs and M. W. Aitken / Journal of Advanced Concrete Technology Vol. 18 437-455, 2020 449
The role of multi-frequency measurements (over the 1 Hz to 10 MHz range) to minimise errors resulting from polarisation effects is highlighted and used to identify the optimum range for single-frequency resistance meas-urements. The bulk resistivity was normalised against the pore fluid resistivity following the Nernst-Einstein equation and termed the formation factor. Using this presentation formalism, it was possible to account for the pore fluid effect and differences in pore-solution chem-istry between the different binders. As such, changes in the formation factor can be related solely to microstruc-tural changes. The results were then used to assess the diffusivity of the concretes.
The following conclusions can be drawn from this study: 1) Over the test period, all mixes are shown to exhibit an
increase in resistivity and formation factor which re-flects on-going hydration and pozzolanic reaction with resulting pore-structure refinement.
2) GGBS exerts a more significant influence on bulk resistivity and formation factor than compressive strength, indicating that further hydrate accretion into the capillary pore space has a greater influence on the interconnectivity of the capillary pore network (i.e. reduction in both pore size and pore connectivity as well as enhancement in both pore tortuosity and pore constrictivity) than the matrix strength.
3) No detectable decrease in bulk resistivity resulting from an increase in ionic concentration within the pore fluid was observed over the entire test duration. This indicates that during this period, microstructural changes resulting from on-going hydration and poz-zolanic reaction exerts a more dominant influence than changes in ionic concentration within the capil-lary pore fluid.
4) The GGBS concretes exhibited a more marked in-crease in resistivity relative to both their initial and 28-day values than the plain PC concrete. This was attributed primarily to the pozzolanic reaction, which continued over the longer term, and resulting physical influence on the pore network. At the end of the test period, the resistivity of GGBS/65 mix was one order of magnitude higher than the PC mix.
5) Using the NIST model, hydration is shown to influ-ence the pore-fluid resistivity during the first two weeks of hydration resulting mainly from increasing ionic concentration within the pore fluid. Once the degree of hydration was in the advanced stage, the pore fluid resistivity remained virtually constant. The pore-fluid resistivity is shown to increase with an in-crease in GGBS replacement levels. It is also shown that within the GGBS systems, the influence of poz-zolanic reaction on the electrical properties of the pore-fluid was limited.
6) Concretes containing GGBS had a higher formation factor than the plain PC concrete at time-scales > 28 days. The formation factor at 360 days increased in the order PC (315) < GGBS/35 (545) < GGBS/50
(835) < GGBS/65 (1040) highlighting microstructural differences in the capillary pore network.
7) Based on the durability classifications using the for-mation factor, it is shown the GGBS mixes outrank the PC mix at longer timescales (i.e. beyond 28 days), particularly at higher replacement levels (i.e. 50% and 65%).
8) The instantaneous and effective diffusion coefficients of the concretes were found to decrease with an in-crease in curing time, indicating an enhanced ability to resist chloride ingress with increasing time; the GGBS mix was found to outperform the PC mix in the longer term (i.e. beyond the normal 28 days curing period).
9) Almost the same aging factor n was obtained from the functional forms that were used to describe the tem-poral changes in resistivity, formation factor and dif-fusion for a given cement system. The formation factor and arguments based on Nernst-Einstein equa-tion are approximations and the results in this work corroborate that these approximations are sufficiently good to describe the aging of a complex system such as concrete and to define cross-property correlations that are useful for durability assessment. Overall, it is shown that the resistivity of concrete is
relatively straightforward to evaluate and the method of determining the diffusion coefficient using the formation factor could be further exploited as a pre-qualification test for evaluating concrete performance or in-situ evaluation of the as-delivered concrete.
Acknowledgements Aspects of the work presented form part of the concrete durability programme investigating improvements into the performance of reinforced concrete in chloride en-vironments and in the development of perform-ance-based testing procedures. The financial support of the Scottish Funding Council through a Global Chal-lenges Research Fund is gratefully acknowledged. The Authors wish to thank Hanson UK for supplies of ground granulated blast furnace slag and Professor Malcolm Chrisp, Head of the School of Energy, Geoscience, In-frastructure and Society, for placing the facilities of the School at their disposal. Thanks are also expressed to Dr A Tambusay, Mr R Arthur and Ms R Wilson for their assistance in the experimental work. References ACI Committee 222, (2001). “222R-01: Protection of
metals in concrete against corrosion.” Technical Report for ACI Committee 222. Farmington Hills, Michigan, USA: American Concrete Institute, 1-41.
Alaswad, G., Suryanto, B. and McCarter, W. J., (2018). “Moisture movement within concrete exposed to simulated hot arid/semi-arid conditions.” Proceedings of the Institution of Civil Engineers - Construction Materials, 171, 1-15.
Alexander, M. G., Mackechnie, J. R. and Ballim, Y., (1999). “Research Monograph 2: Guide to the use of

B. Suryanto, J. Kim, W. J. McCarter, G. Starrs and M. W. Aitken / Journal of Advanced Concrete Technology Vol. 18 437-455, 2020 450
durability indexes for achieving durability in concrete structures [online].” Cape Town, South Africa. The University of Cape Town. Available from: <http://www. comsiru.uct.ac.za/sites/default/files/image_tool/images/333/Research/Downloads/Monograph_2_Nov_09.pdf> [Accessed 07 March 2020].
Alexander, M. and Thomas, M., (2015). “Service life prediction and performance testing - Current develop-ments and practical applications.” Cement and Concrete Research, 78, 155-164.
Andrade, C., Prieto, M., Tanner, P., Tavares, F. and D’Andrea, R., (2013). “Testing and modelling chloride penetration into concrete.” Construction and Building Materials, 39, 9-18.
Archie, G. E., (1942). “The electrical resistivity log as an aid in determining some reservoir characteristics.” Transactions of the American Institute of Mining, Metallurgical, and Petroleum Engineers, 146, 54-62.
Arsenault, J., Bigas, J. P. and Ollivier, J. P., (1995). “Determination of chloride diffusion coefficient using two different steady-state methods: Influence of concentration gradient.” In: L. O. Nilsson and J. P. Ollivier, Eds. Proceedings of the First International RILEM Workshop on Chloride Penetration into Concrete, Saint-Rémy-lès-Chevreuse, France 15-18 October 1995. Paris: RILEM Publications, 150-160.
Balestra, C. E. T., Nakano, A. Y., Savaris, G. and Medeiros-Junior, R. A., (2019). “Reinforcement corrosion risk of marine concrete structures evaluated through electrical resistivity: Proposal of parameters based on field structures.” Ocean Engineering, 187, 106167.
Bamforth, P., (1993). “Concrete classification for RC structures exposed to marine and other salt-laden environments.” In: M. C. Forde, Ed. Proceedings of the Fifth International Conference on Structural Faults and Repair-93, Edinburgh, UK 29 June 1993. Edinburgh: Engineering Technics Press, Vol. II, 31-40.
Bamforth, P. B., Price, W. F. and Emerson, M., (1997). “Contractor report 359: An international review of chloride ingress into structural concrete.” Edinburgh, UK: Transport Research Laboratory, 1-162.
Barneyback, R. S. and Diamond, S., (1981). “Expression and analysis of pore fluids from hardened cement pastes and mortars.” Cement and Concrete Research, 11, 279-285.
Baroghel Bouny, V., Chaussadent, T. and Raharinaivo, A., (1995). “Experimental investigations on binding of chloride and combined effects of moisture and chloride in cementitious materials.” In: L. O. Nilsson and J. P. Ollivier, Eds. Proceedings of the First International RILEM Workshop on Chloride Penetration into Concrete, Saint-Rémy-lès-Chevreuse, France 15-18 October 1995. Paris: RILEM Publications, 290-301.
Baroghel-Bouny, V., Thiery, M. and Wang, X., (2014). “Performance-based assessment of durability and pre-diction of RC structure service life: Transport properties as input data for physical models.” Materials and
Structures, 47, 1669-1691. Bentz, E. C., Thomas, M. D. A. and Evans, C. M., (1996).
“Chloride diffusion modelling for marine exposed concretes.” Special Publication-Royal Society of Chemistry, 183, 136-145.
Bentz, D. P., (2007). “A virtual rapid chloride permeability test.” Cement and Concrete Composites, 29, 723-731.
Berodier, E. and Scrivener, K., (2015). “Evolution of pore structure in blended systems.” Cement and Concrete Research, 73, 25-35.
Beushausen, H., Torrent, R. and Alexander, M. G., (2019). “Performance-based approaches for concrete durability: State of the art and future research needs.” Cement and Concrete Research, 119, 11-20.
Bleszynski, R., Hooton, R. D., Thomas, M. D. and Rogers, C. A., (2002). “Durability of ternary blend concrete with silica fume and blast-furnace slag: Laboratory and outdoor exposure site studies.” ACI Materials Journal, 99(5), 499-508.
Broomfield, J. P., (1997). “Corrosion of steel in concrete.” London & New York: E & FN Spon.
Brouwers, H. J. H. and van Eijk, R. J., (2003). “Alkali concentrations of pore solution in hydrating OPC.” Cement and Concrete Research, 33, 191-196.
BSI, (2006). “BS EN 15167-1:2006: Ground granulated blast furnace slag for use in concrete, mortar and grout (part 1): Definitions, specifications and conformity criteria.” London: British Standards Institution.
BSI, (2009). “BS EN 12390-2:2019: Testing hardened concrete (part 2): Making and curing specimens for strength tests.” London: British Standards Institution.
BSI, (2013). “PD CEN/TR 16563:2013: Principles of the equivalent durability procedure.” London: British Standards Institution.
BSI, (2015). “BS EN 1992-1-1:2004+A1:2014: Eurocode 2: Design of concrete structures: General rules and rules for buildings.” London: British Standards Institution.
BSI, (2016). “BS EN 206:2013+A1:2016: Concrete: Specification, performance, production and conformity.” London: British Standards Institution.
BSI, (2019a). “BS 8500-1:2015+A2:2019: Concrete: Complementary British Standard to BS EN 206-1 (part 1): Method of specifying and guidance for the specifier.” London: British Standards Institution.
BSI, (2019b). “BS EN 197-1:2011: Cement (part 1): Composition, specifications and conformity criteria for common cements.” London: British Standards Institution.
BSI, (2019c). “BS EN 12390-3:2019: Testing hardened concrete (part 3): Compressive strength of test specimens.” London: British Standards Institution.
Chen, W. and Brouwers, H. J. H., (2010). “Alkali binding in hydrated Portland cement paste.” Cement and Concrete Research, 40(5), 716-722.
Chen, H. J., Huang, S. S., Tang, C. W., Malek, M. A. and Ean, L. W., (2012). “Effect of curing environments on strength, porosity and chloride ingress resistance of
B. Suryanto, J. Kim, W. J. McCarter, G. Starrs and M. W. Aitken / Journal of Advanced Concrete Technology Vol. 18 437-455, 2020 451
blast furnace slag cement concretes: A construction site study.” Construction and Building Materials, 35, 1063-1070.
Chlayon, T., Iwanami, M. and Chijiwa, N., (2020). “Impacts from concrete microstructure and surface on the settlement of sessile organisms affecting chloride attack.” Construction and Building Materials, 239, 117863.
Christensen, B. J., Coverdale, T. R., Olson, R. A., Ford, S. J., Garboczi, E. J., Jennings, H. M. and Mason, T., (1994). “Impedance spectroscopy of hydrating cement-based materials: Measurement, interpretation, and application.” Journal of American Ceramic Society, 77, 2789-2804.
Collepardi, M., Marcialis, A. and Turriziani, R., (1972). “Penetration of chloride ions into cement pastes and concrete.” Journal of American Ceramic Society, 55(10), 534-535.
Coverdale, R. T., Garboczi, E. J., Jennings, H. M., Christensen, B. J. and Mason, T. O., (1993). “Computer simulation of impedance spectroscopy in two dimensions: Application to cement paste.” Journal of the American Ceramic Society, 76(6), 1513-1520.
Delagrave, A., Marchand, J. and Samson, E., (1996). “Prediction of diffusion coefficients in cement-based materials on the basis of migration experiments.” Cement and Concrete Research, 26(12), 1831-1842.
Dhir, R. K., Jones, M. R., Ahmed, H. E. H. and Seneviratne, A. M. G., (1990). “Rapid estimation of chloride diffusion coefficient in concrete.” Magazine of Concrete Research, 42, 177-185.
Diab, H., Bentur, A., Heitner-Wirguin, C. and Ben-Dor, L., (1988). “The diffusion of Cl- ions through Portland cement and Portland cement-polymer pastes.” Cement and Concrete Research, 18, 715-722.
Gallucci, E., Scrivener, K., Groso, A., Stampanoni, M. and Margaritondo, G., (2007). “3D experimental investigation of the microstructure of cement pastes using synchrotron x-ray microtomography (μCT).” Cement and Concrete Research, 37(3), 360-368.
Guimarães, A. T. C., Climent, M. A., De Vera, G., Vicente, F. J., Rodrigues, F. T. and Andrade, C., (2011). “Determination of chloride diffusivity through partially saturated Portland cement concrete by a simplified procedure.” Construction and Building Materials, 25, 785-790.
Harris, K. R. and Kanakubo, M., (2015). “Self-diffusion, velocity cross-correlation, distinct diffusion and resistance coefficients of the ionic liquid [BMIM][Tf 2 N] at high pressure.” Physical Chemistry Chemical Physics, 17(37), 23977-23993.
Hashimoto, M., Sakata, N., Sakai, E., Yonezawa, T., Hayashi, D. and Muronoi, T., (2016). “Study on concrete for civil engineering structures using high volume blast furnace slag cement.” Journal of Advanced Concrete Technology, 14(4), 163-171.
Hasted, J. B., (1973). “Aqueous Dielectrics.” London: Chapman and Hall.
Higgins, D. D., (1995). “The effect of some test variables on chloride profiles.” In: L. O. Nilsson and J. P. Ollivier, Eds. Proceedings of the First International RILEM Workshop on Chloride Penetration into Concrete, Saint-Rémy-lès-Chevreuse, France 15-18 October 1995. Paris: RILEM Publications, 234-242.
Hinrichs, W. and Odler, I., (1989). “Investigation of the hydration of Portland blast furnace slag cement: hydration kinetics.” Advances in Cement Research, 2(5), 9-13.
Hooton, R., (1986). “Permeability and pore structure of cement pastes containing fly ash, slag, and silica fume.” In: G. Frohnsdorff, Ed. Blended Cements, West Conshohocken: ASTM International, 128-143.
Hooton, R. D., Pun, P., Kojundic, T. and Fidjestol, P., (1997). “Influence of silica fume on chloride resistance of concrete.” In: L. H. Johal, Ed. Proceedings of PCI/FHWA International Symposium on High Performance Concrete, New Orleans, Louisiana, USA 20-22 October 1997. Illinois, USA: Precast/Prestressed Concrete Institute, 245-256.
Ishida, T., Iqbal, P. O. N. and Anh, H. T. L., (2009). “Modeling of chloride diffusivity coupled with non-linear binding capacity in sound and cracked concrete.” Cement and Concrete Research, 39(10), 913-923.
Ishida, T., Pen, K., Tanaka, Y., Kashimura, K. and Iwaki, I., (2018). “Numerical simulation of early age cracking of reinforced concrete bridge decks with a full-3D multiscale and multi-chemo-physical integrated analysis.” Applied Sciences, 8(3), 394.
Jennings, H. M., Hsieh, J., Srinivasan, R., Jaiswal, S., Garci, M., Sohn, D., Hinners, C., Heppner, S. and Neubauer, C., (1996). “Modelling and materials science of cement-based materials, part 1: An overview.” In: H. Jennings, J. Kropp, K. Scrivener, Eds. Proceedings of the of the NATO Advanced Research Workshop on Modelling of Microstructure and its Potential for Studying Transport Properties and Durability, Saint-Remy-Ies-Chevreuse, France 10-13 July 1994. Dordrech, Germany: Springer Science and Business Media B. V., 29-62.
Johnson, D., Miltenberger, M. and Amey, S. L., (1996). “Determining chloride diffusion coefficients for concrete using accelerated test methods.” In: V. M. Malhotra, Ed. Proceedings of the 3rd CANMET/ACI International Conference on Performance of Concrete in Marine Environment, St Andrews by-the-Sea, New Brunswick, Canada 4-9 August 1996. Farmington Hills, Michigan, USA: American Concrete Institute, 95-114.
JSA, (2009). “JIS R 5211:2009: Portland blast-furnace slag cement.” Tokyo: Japanese Standards Association.
JSCE, (2007a). “Standard specifications for concrete structures – 2007: Design.” Tokyo: Japan Society of Civil Engineers.
JSCE, (2007b). “Standard specifications for concrete structures – 2007: Materials and construction.” Tokyo: Japan Society of Civil Engineers.

B. Suryanto, J. Kim, W. J. McCarter, G. Starrs and M. W. Aitken / Journal of Advanced Concrete Technology Vol. 18 437-455, 2020 452
JSCE, (2010). “Standard specifications for concrete structures – 2007: Maintenance.” Tokyo: Japan Society of Civil Engineers.
Kanaya, M., Masuda, Y., Abe, M. and Nishiyama, N., (1998). “Diffusion of chloride ions in concrete exposed in the coastal area.” In: E. Gjorv, K. Sakai, N. Banthia, Eds. Proceedings of the Second International Conference on Concrete Under Severe Conditions: Environment and Loading, Tromso, Norway 21-24 June 1998. London & New York: E & FN Spon, Vol. I, 242-249.
Kanda, T., Momose, H. and Imamoto, K., (2015). “Shrinkage cracking resistance of blast furnace slag blended cement concrete - Influencing factors and enhancing measures.” Journal of Advanced Concrete Technology, 13(1), 1-14.
Kato, Y. and Uomoto, T., (2005). “Modeling of effective diffusion coefficient of substances in concrete considering spatial properties of composite materials.” Journal of Advanced Concrete Technology, 3(2), 241-251.
Khalil, M. A. and Monterio Santos, F. A., (2009). “Influence of degree of saturation in the electric resistivity-hydraulic conductivity relationship.” Surveys in Geophysics, 30, 601-615.
Kim, J., McCarter, W. J., Suryanto, B., Nanukuttan, S., Basheer, P. A. M. and Chrisp, T. M., (2016). “Chloride ingress into marine exposed concrete: A comparison of empirical and physically-based models.” Cement and Concrete Composites, 72, 133-145.
Kim, J., McCarter, W. J. and Suryanto, B., (2018). “Performance assessment of reinforced concrete after long-term exposure to a marine environment.” Construction and Building Materials, 192, 569-583.
Kim, J., Suryanto, B. and McCarter W. J., (2019). “Conduction, relaxation and complex impedance studies on Portland cement mortars during freezing and thawing.” Cold Regions Science and Technology, 166, 102819.
Kim, J., McCarter, W. J. and Suryanto, B., (2020). “Cover-zone protective qualities under corrosive en-vironments.” Journal of Building Engineering, 101618.
Kurumisawa, K. and Nawa, T., (2016). “Electrical conductivity and chloride ingress in hardened cement paste.” Journal of Advanced Concrete Technology, 14(3), 87-94.
Larbi, J. A., Fraay, A. L. A. and Bijen, J. M. J. M., (1990). “The chemistry of the pore fluid of silica fume-blended cement systems.” Cement and Concrete Research, 20(4), 506-516.
Li, Y. H. and Gregory, S., (1974). “Diffusion of ions in sea-water and in deep sea sediments.” Geochimica et Cosmochimica Acta, 38, 703-714.
Li, P., Su, D., Wang, S. and Fan, Z., (2011). “Influence of binder composition and concrete pore structure on chloride diffusion coefficient in concrete.” Journal of Wuhan University Technology-Materials Science Edition, 26(1), 160-164.
Liu, Z. and Beaudoin, J. J., (1999). “An assessment of the relative permeability of cement systems using AC impedance techniques.” Cement and Concrete Research, 29(7), 1085-1090.
Lu, X., (1997). “Application of the Nernst-Einstein equation to concrete.” Cement and Concrete Research, 27, 293-302.
Luan, Y., Ishida, T., Nawa, T. and Sagawa, T., (2012). “Enhanced model and simulation of hydration process of blast furnace slag in blended cement.” Journal of Advanced Concrete Technology, 10(1), 1-13.
Lothenbach, B. and Winnefeld, F., (2006). “Thermody-namic modelling of the hydration of Portland cement.” Cement and Concrete Research, 36(2), 209-226.
Lye, C. Q., Dhir, R. K. and Ghataora, G. S., (2016). “Carbonation resistance of GGBS concrete.” Magazine of Concrete Research, 68(18), 936-969.
Maekawa, K., Ishida, T. and Kishi, T., (2008). “Multi-scale modeling of structural concrete.” Abingdon, UK: Taylor & Francis.
Maes, M., Gruyaert, E. and De Belie, N., (2013). “Resistance of concrete with blast-furnace slag against chlorides, investigated by comparing chloride profiles after migration and diffusion.” Materials and Structures, 46(1-2), 89-103.
Mangat, P. S. and Molloy, B. T., (1994). “Prediction of long term chloride concentration in concrete.” Materials and Structures, 27, 338-346.
Matthes, W., Vollpracht, A., Villagrán, Y., Kamali-Bernard, S., Hooton, D., Gruyaert, E., Soutsos, M. and De Belie, N., (2018). “Ground granulated blast-furnace slag.” In: N. De Belie, M. Soutsos, E. Gruyaert, Eds. Properties of Fresh and Hardened Concrete Containing Supplementary Cementitious Materials (State-of-the-Art Report of the RILEM Technical Committee 238-SCM, Working Group 4). Cham, Switzerland: Springer, 1-53.
McCarter, W. J., Garvin, S. and Bouzid, N., (1988). “Impedance measurements on cement paste.” Journal of Materials Science Letters, 7, 1056-1057.
McCarter, W. J. and Brousseau, R., (1990). “The A.C. response of hardened cement paste.” Cement and Concrete Research, 20, 891-900.
McCarter, W. J., Ezirim, H. and Emerson, M., (1996). “Properties of concrete in the cover zone: Water penetration, sorptivity and ionic ingress.” Magazine of Concrete Research, 48(176), 149-156.
McCarter, W. J., Starrs, G. and Chrisp, T. M., (2000). “Electrical conductivity, diffusion, and permeability of Portland cement-based mortars.” Cement and Concrete Research, 30, 1395-1400.
McCarter, W. J., Chrisp, T. M., Butler, A. and Basheer, P. A. M., (2001). “Near-surface sensors for condition monitoring of cover-zone concrete.” Construction and Building Materials, 15, 115-124.
McCarter, W. J., Chrisp, T. M., Starrs, G., Adamson, A., Owens, E., Basheer, P. A. M., Nanukuttan, S. V., Srinivasan, S. and Holmes, N., (2012). “Developments in performance monitoring of concrete exposed to

B. Suryanto, J. Kim, W. J. McCarter, G. Starrs and M. W. Aitken / Journal of Advanced Concrete Technology Vol. 18 437-455, 2020 453
extreme environments.” ASCE Journal of Infrastructure Systems, 18(3), 167-175.
McCarter, W. J., Chrisp, T. M., Starrs, G., Adamson, A., Basheer, P. A. M., Nanukuttan, S. V., Srinivasan, S. and Green, C., (2013a). “Characterization of physio-chemical processes and hydration kinetics in concretes containing supplementary cementitious materials using electrical property measurements.” Cement and Concrete Research, 50, 26-33.
McCarter, W. J., Starrs, G., Adamson, A., Chrisp, T. M. and Basheer, P. A. M., (2013b). “Influence of different European cements on the hydration of cover-zone concrete during the curing and postcuring periods.” ASCE Journal of Materials in Civil Engineering, 25(9), 1335-1343.
McCarter, W. J., Starrs, G., Kandasami, S., Jones, R. and Chrisp, M., (2015a). “Electrode configurations for resistivity measurements on concrete.” ACI Materials Journal, 106(3), 258-264.
McCarter, W. J., Taha, H. M., Suryanto, B. and Starrs, G., (2015b). “Two-point concrete resistivity measurements: Interfacial phenomena at the electrode-concrete contact zone.” Measurement Science and Technology, 26(8), Article ID 085007.
McCarter, W. J., Chrisp, T. M., Starrs, G., Basheer, P. A. M., Nanukuttan, S., Srinivasan, S. and Magee, B. J., (2015c). “A durability performance-index for concrete: Developments in a novel test method.” International Journal of Structural Engineering, 6(1), 2-22.
McCarter, W. J., Suryanto, B., Taha, H. M., Nanukuttan, S. and Basheer, P. A. M., (2017). “A testing methodol-ogy for performance-based specification.” Journal of Structural Integrity and Maintenance, 2(2), 78-88.
McCarter, W. J., Alaswad, G. and Suryanto, B., (2018). “Transient moisture profiles in cover-zone concrete during water absorption.” Cement and Concrete Research, 108, 167-171.
Moradi-Marani, F., Shekarchi, M., Dousti, A., Mobasher, B. and Asce, M., (2010). “Investigation of corrosion damage and repair system in a concrete jetty structure.” Journal of Performance of Constructed Facility, 24, 294-301.
Nanukuttan, S. V., Basheer, L., McCarter, W. J., Robinson, D. J. and Basheer, P. M., (2008). “Full-scale marine exposure tests on treated and untreated concretes: Initial 7-year results.” ACI Materials Journal, 105(1), 81-87.
Neithalath, N., Weiss, J. and Olek, J., (2006). “Characterizing enhanced porosity concrete using electrical impedance to predict acoustic and hydraulic performance.” Cement and Concrete Research, 36(11), 2074-2085.
Nokken, M. R. and Hooton, R. D., (2008). “Using pore parameters to estimate permeability or conductivity of concrete.” Materials and Structures, 41(1), 1-16.
NIST, (2019). “Virtual cement and concrete testing laboratory (VCCTL) software, version 9.5. [online].” Gaithersburg, USA. National Institute of Standards and Technology (NIST). Available from: <https://www.nist.
gov/services-resources/software/vcctl-software> [Accessed 01 September 2019].
Pack, S. W., Jung, M. S., Song, H. W., Kim, S. H. and Ann, K. Y., (2010). “Prediction of time dependent chloride transport in concrete structures exposed to a marine environment.” Cement and Concrete Research, 40, 302-312.
Page, C. L., Lambert, P. and Vassie, P. R. W., (1991). “Investigations of reinforcement corrosion 1. The pore electrolyte phase in chloride-contaminated concrete.” Materials and Structures, 24, 243-252.
Pang, L. and Li, Q., (2016). “Service life prediction of RC structures in marine environment using long term chloride ingress data: Comparison between exposure trials and real structure surveys.” Construction and Building Materials, 113, 979-987.
Patel, R. A., Phung, Q. T., Seetharam, S. C., Perko, J., Jacques, D., Maes, N., De Schutter, G., Ye, G. and Van Breugel, K., (2016). “Diffusivity of saturated ordinary Portland cement-based materials: A critical review of experimental and analytical modelling approaches.” Cement and Concrete Research, 90, 52-72.
Patel, R. A., Perko, J., Jacques, D., De Schutter, G., Ye, G. and Van Bruegel, K., (2018). “Effective diffusivity of cement pastes from virtual microstructures: Role of gel porosity and capillary pore percolation.” Construction and Building Materials, 165, 833-845.
Pedersen, V. and Arntsen, B., (1998). “Effect of early-age curing on penetration of chloride ions into concrete in the tidal zone.” In: E. Gjorv, K. Sakai, N. Banthia, Eds. Proceedings of the Second International Conference on Concrete Under Severe Conditions, Tromso, Norway June 21-24 1998. London & New York: E & FN Spon, Vol. I, 468-477.
Polder, R. B., (1995). “Chloride diffusion and resistivity testing of five concrete mixes for marine environment.” In: L. O. Nilsson and J. P. Ollivier, Eds. Proceedings of the First International RILEM Workshop on Chloride Penetration into Concrete, Saint-Rémy-lès-Chevreuse, France October 15-18 1995. Paris: RILEM Publications, 225-233.
Promentilla, M. A. B., Sugiyama, T., Hitomi, T. and Takeda, N., (2009). “Quantification of tortuosity in hardened cement pastes using synchrotron-based X-ray computed microtomography.” Cement and Concrete Research, 39(6), 548-557.
Riding, K. A., Thomas, M. D., Hooton, R. D., Obla, K. H. and Weiss, W. J., (2018). “Performance-based specifi-cations for concrete exposed to chlorides.” Concrete International, 40, 41-47.
Rangelov, M. and Nassiri, S., (2019). “Sensor-based time-dependent formation factor in prediction of chloride ingress in mortar.” Magazine of Concrete Research, 71(22), 1180-1192.
Schäfer, E. and Meng, B., (2001). “Influence of cement and additions on the quantity of alkalis available for an alkali-silica reaction.” Düsseldorf: VDZ.
Schwan, H. P., Schwarz, G., Maczuk, J. and Pauly, H.,

B. Suryanto, J. Kim, W. J. McCarter, G. Starrs and M. W. Aitken / Journal of Advanced Concrete Technology Vol. 18 437-455, 2020 454
(1962). “On the low-frequency dielectric dispersion of colloidal particles in electrolyte solution.” The Journal of Physical Chemistry, 66(12), 2626-2635.
Sengul, O., (2014). “Use of electrical resistivity as an indicator for durability.” Construction and Building Materials, 73, 434-441.
Shattaf, N. R., Alshamsi, A. M. and Swamy, R. N., (2001). “Curing/environment effect on pore structure of blended cement concrete.” ASCE Journal of Materials in Civil Engineering, 13(5), 380-388.
Shin, H. O., Yang, J. M., Yoon, Y. S. and Mitchell, D., (2016). “Mix design of concrete for prestressed concrete sleepers using blast furnace slag and steel fibers.” Cement and Concrete Composites, 74, 39-53.
Snyder, K. A., Feng, X., Keen, B. D. and Mason, T. O., (2003). “Estimating the electrical conductivity of cement paste pore solutions from OH-, K+ and Na+ concentrations.” Cement and Concrete Research, 33, 793-798.
Song, H. W., Lee, C. H. and Ann, K. Y., (2008). “Factors influencing chloride transport in concrete structures exposed to marine environments.” Cement and Concrete Composites, 30(2), 113-121.
Song, Y., Dai, G., Zhao, L., Bian, Z., Li, P. and Song, L., (2020). “Permeability prediction of hydrated cement paste based on its 3D image analysis.” Construction and Building Materials, 247, 118527.
Streicher, P. E. and Alexander, M. G., (1995). “A chloride conduction test for concrete.” Cement and Concrete Research, 25, 1284-1294.
Suryanto, B., McCarter, W. J., Starrs, G. and Ludford-Jones, G. V., (2016). “Electrochemical immittance spectroscopy applied to a hybrid PVA/steel fiber engineered cementitious composite.” Material & Design, 105, 179-189.
Suryanto, B., Buckman, J. O., McCarter, W. J. and Taha, H., (2018a). “In-situ dynamic WetSEM imaging and electrical impedance measurements on Portland cement during early hydration.” Materials Characterization, 142, 86-100.
Suryanto, B., Takaoka, H., McCater, W. J., Saraireh, D. and Taha, H., (2018b). “Impedance measurements on an engineered cementitious composite: A critical evaluation of testing protocols.” Measurement, 129, 445-456.
Takahashi, Y. and Ishida, T., (2016). “Modeling of chloride transport resistance in cement hydrates by focusing on nanopores.” Journal of Advanced Concrete Technology, 14(11), 728-738.
Tang, L., (1995). “On chloride diffusion coefficients obtained by using the electrically accelerated methods.” In: L. O. Nilsson and J.P. Ollivier, Eds. Proceedings of the First International RILEM Workshop on Chloride Penetration into Concrete, Saint-Rémy-lès-Chevreuse, France October 15-18 1995. Paris: RILEM Publications, 126-134.
Tang, L. and Nilsson, L. O., (1992a). “Rapid determination of chloride diffusivity in concrete by applying an
electric field.” ACI Materials Journal, 49(1), 49-53. Tang, L. and Nilsson, L. O., (1992b). “Chloride
diffusivity in high strength concrete at different ages.” Nordic Concrete Research, 11(1), 162-171.
Tang, L. and Utgenannt, P., (2007). “SP report 2007-76: Chloride ingress and reinforcement corrosion in concrete under de-icing highway environment – A study after 10 years’ field exposure.” Borås, Sweden: SP Technical Research Institute of Sweden.
Taylor, H. F., (1987). “A method for predicting alkali ion concentrations in cement pore solutions.” Advances in Cement Research, 1(1), 5-17.
Thomas, M. D. A., Scott, A., Bremner, T., Bilodeau, A. and Day, D., (2008). “Performance of slag concrete in marine environment.” ACI Materials Journal, 105(6), 628-634.
Torres-Acosta, A. A., Presuel-Moreno, F. and Andrade, C., (2019). “Electrical resistivity as durability index for concrete structures.” ACI Materials Journal, 116(6), 245-253.
Tran, D. V. P., Sancharoen, P., Klomjit, P. and Tangtermsirikul, S., (2020). “Electrical resistivity and corrosion potential of reinforced concrete: Influencing factors and prediction models.” Journal of Adhesion Science and Technology, 34, 1-13.
Tsui-Chang, M., Suraneni, P., Montanari, L., Muñoz, J. F. and Weiss, W. J., (2019). “Determination of chemical composition and electrical resistivity of expressed cementitious pore solutions using x-ray fluorescence.” ACI Materials Journal, 116(1), 155-164.
Tumidajski, P. J., Schumacher, A. S., Perron, S., Gu, P. and Beaudoin, J. J., (1996). “On the relationship between porosity and electrical resistivity in cementitious systems.” Cement and Concrete Research, 26, 539-544.
Ueda, H., Sakai, Y., Kinomura, K., Watanabe, K., Ishida, T. and Kishi, T., (2020). “Durability design method considering reinforcement corrosion due to water penetration.” Journal of Advanced Concrete Technology, 18(1), 27-38.
Van Noort, R., Hunger, M. and Spiesz, P., (2016). “Long-term chloride migration coefficient in slag cement-based concrete and resistivity as an alternative test method.” Construction and Building Materials, 115, 746-759.
Wattanapornprom, R. and Ishida, T., (2017). “Modeling of chloride penetration into concrete under airborne chloride environmental conditions combined with washout effects.” Journal of Advanced Concrete Technology, 15(3), 126-142.
Whittington, H. W., McCarter, J. and Forde, M. C., (1981). “The conduction of electricity through concrete.” Magazine of Concrete Research, 33(114), 48-60.
Woo, L. Y., Kidner, N. J., Wansom, S. and Mason, T. O., (2007). “Combined time domain reflectometry and AC-impedance spectroscopy of fiber-reinforced fresh-cement composites.” Cement and Concrete Research, 37(1), 89-95.

B. Suryanto, J. Kim, W. J. McCarter, G. Starrs and M. W. Aitken / Journal of Advanced Concrete Technology Vol. 18 437-455, 2020 455
Worthington, P. F., (1993). “The uses and abuses of the Archie equations, 1: The formation factor-porosity relationship.” Journal of Applied Geophysics, 30, 215-228.
Yio, M. H. N., Wong, H. S. and Buenfeld, N. R., (2019). “3D pore structure and mass transport properties of blended cementitious materials.” Cement and Concrete Research, 117, 23-37.
Yeau, K. Y. and Kim, E. K., (2005). “An experimental study on corrosion resistance of concrete with ground granulate blast-furnace slag.” Cement and Concrete Research, 35, 1391-1399.
Yokota, H., Kato, E. and Iwanami, M., (2009). “Chloride-induced corrosion of reinforcement and its effect on performance of structures.” International Journal of Modelling, Identification and Control, 7(2), 179-184.
Zhang, T. and Gjorv, O. E., (1995). “An electrochemical method for accelerated testing of chloride diffusivity in concrete.” In: L. O. Nilsson and J. P. Ollivier, Eds. Proceedings of the First International RILEM Workshop on Chloride Penetration into Concrete, Saint-Rémy-lès-Chevreuse, France 15-18 October 1995. Paris: RILEM Publications, 105-114.
Zhang, Y., Ye, G. and Yang, Z., (2020). “Pore size dependent connectivity and ionic transport in saturated cementitious materials.” Construction and Building Materials, 238, 117680.
Zhou, J., Ye, G. and Van Breugel, K., (2010). “Characterization of pore structure in cement-based materials using pressurization–depressurization cycling mercury intrusion porosimetry (PDC-MIP).” Cement and Concrete Research, 40(7), 1120-1128.