assessing the economic value of making the right customer ... · assessing the economic value of...
TRANSCRIPT

Cisco Internet Business Solutions Group (IBSG)
Cisco IBSG © 2013 Cisco and/or its affiliates. All rights reserved. 03/13
Point of View
Assessing the Economic Value of Making the Right Customer Satisfaction Decisions—and the Impact of Dissatisfaction on Churn
By Joel Barbier, Andy Noronha, and Amitabh Dixit, Cisco® Internet Business Solutions Group (IBSG)
Research shows that addressing customer dissatisfaction issues and improving customer loyalty can be a very profitable strategy. This paper summarizes Cisco IBSG secondary research findings that provide useful references when it comes to quantifying decisions that impact customer satisfaction.
More specifically, it provides:
● Quantified examples of how customer dissatisfaction causes churn ● A methodology to size the value associated with improving customer satisfaction
Debunking Several Myths About Customer Satisfaction
More often than not, enterprise decision makers dismiss customer experience and satisfaction as quantifiable drivers of revenue growth and profitability. Many executives feel that costly levels of customer care are required to exceed customer expectations. Others argue that despite a negative customer experience, it is not economical to reach a superior level of service, as most customers will remain loyal to a company and relatively few will actually leave. Finance executives also often argue that improving customer loyalty is a “soft” metric and cannot be considered when assessing the economic value of an investment.
Research indicates that these common ideas may result in making the wrong decisions about customer service. It shows that poor customer experience may result in either lower customer business (fewer purchases, less repeat business, smaller basket size) or increased customer attrition. While most unhappy customers may not bother to complain, a majority will simply leave.
Figure 1 illustrates the impact of positive versus negative customer experiences at critical “moments of truth” in retail banking. It shows that 72 percent of customers who have a negative customer service experience either reduce their overall engagement with the bank or switch banks altogether. It also shows that 87 percent customers who had a positive customer experience either made a purchase decision or increased their overall engage-ment with the bank.

Cisco IBSG © 2013 Cisco and/or its affiliates. All rights reserved. Page 2
Point of View
Figure 1. “Moments of Truth” in Retail Banking Customer Service.
Other Survey Results Show Importance of Customer Service
● Research shows that the majority of dissatisfied customers—nearly two-thirds—actually do switch when they experience poor customer service, as shown in Figure 2.
– Emerging-market customers—for example, customers in fast-growing economies such as China, India, Russia, Brazil, Mexico, or Southeast Asia—are even more likely to switch than their counterparts in developed markets.
– Nearly two-thirds of customers who switch take their business to a competitor, while the remainder abandon the purchase altogether.1
● Consumers are very likely to do business with firms that exceed their expectations.
– According to a Forrester survey, 81 percent of respondents are very likely to provide repeat business to firms that have exceeded their expectations.
● According to the Accenture 2010 Global Consumer Research Survey, lower price is not a substitute for customer service; 54 percent of respondents were not willing to compromise on customer service even if it ensured the lowest price.2 Additionally, the importance of price in choosing a new service vendor declined from 68 percent in 2008 to 57 percent in 2010.
1 Source: “The Cost of Poor Customer Service: The Economic Impact of the Customer Experience and 2 Source: Accenture 2010 Global Consumer Research Survey.
Positive Customer Experience: 100% = 1,528 respondents
Negative Customer Experience: 100% = 701 respondents
Source: McKinsey Quarterly, 2006

Cisco IBSG © 2013 Cisco and/or its affiliates. All rights reserved. Page 3
Point of View
Figure 2. Impact of Poor Customer Service on Rate of Switching to a Competitor.
Impact of Customer Satisfaction on Customer Lifetime Value
Does customer satisfaction impact Customer Lifetime Value (CLV)? The answer is an overwhelming “yes.”
CLV is the present value of total profits generated by a customer (net of acquisition costs) and is based on the profits earned from a customer, customer acquisition costs (CAC), cost of capital, industry growth, and the customer retention rate.
CLV is highly sensitive to changes in customer revenues and retention rate, both of which are dependent upon customer satisfaction. If organizations are successful at attracting customers and increasing transaction intensity (either higher transaction frequency or average size of transaction), CLV will increase. For subscriber-based organizations, customer retention is the key metric impacting the long-term value of firms, as monthly revenues generally do not vary significantly. Lastly, customer satisfaction (and, as a result, customer loyalty) largely impacts CAC, and can significantly impact CLV.
Figure 3. Customer Lifetime Value (CLV).
M: profits generated from customers; A: customer acquisition cost; R: retention rate; d: discount rate; G: market growth rate
⎭⎬⎫
⎩⎨⎧
−−+×−=
RGdAMCLV
11)(
Sources: The Loyalty Effect: The Hidden Force Behind Growth, Profits, and Lasting Value, Frederick F. Reichheld, HBS, 2001; Managing Customers as Investments: The Strategic Value of Customers in the Long Run, Sunil Gupta and Donald Lehmann, 2005; Cisco IBSG, 2012.
Source: Accenture 2010 Global Consumer Research

Cisco IBSG © 2013 Cisco and/or its affiliates. All rights reserved. Page 4
Point of View
We have estimated the CLV for a retail bank using hypothetical assumptions for revenue per customer, margins, customer acquisition costs, and retention rate. Our analysis showed that CLV is highly sensitive to changes in customer loyalty (or customer retention rate). At an 85 percent retention rate, CLV is estimated at US$1,052 per retail banking customer (see Figure 4). If the bank is successful in increasing the retention rate by 5 percent, CLV can increase by 45 percent, to $1,530. On the other hand, CLV could decline by 26 percent, to $777, if the customer retention rate decreases by 5 percent.
Figure 4. Impact of Changes in Retention Rate on Customer Lifetime Value: Retail Banking.
Figure 5. Key Assumptions.
Assumption Annual revenue per customer US$900
Direct cost (% of revenues)3 69%
One-time customer acquisition cost US$240
Annual customer retention cost US$40
Cost of capital 4.5%
3 Computed as (PBT Ex. provisions for credit losses & marketing costs)*(1-tax rate) + depreciation and amortization.
Source: Cisco IBSG, 2012
Sources: Cisco IBSG, 2012; company annual reports

Cisco IBSG © 2013 Cisco and/or its affiliates. All rights reserved. Page 5
Point of View
Certain Industries Are More Vulnerable to Customer Churn
In our view, organizations operating in industry sectors that provide undifferentiated services or have low switching costs are more vulnerable to churn as a result of poor customer ser-vice. We have analyzed the impact of customer satisfaction using the framework of Maslow’s hierarchy of human needs.
Abraham Maslow proposed his theory of hierarchy of needs in 1943, categorizing various human needs in a pyramid. According to the theory, human beings first focus on satisfying needs low in the hierarchy (relating to survival and safety). Once these are satisfied, they move to more complex needs, which are also more social and psychological in nature (friendship, intimacy, self-esteem, self-actualization, and so on). Various categories of needs, according to Maslow’s hierarchy, are depicted in Figure 6.
Figure 6. Maslow’s Hierarchy of Human Needs.
We have modified this theory to reflect the realities of the 21st century, where in addition to survival needs (water, food, sleep, warmth), services such as retail, communication, banking and insurance, and cable television have become an integral part of today’s living, especially in developed economies. Because these services have increasingly become necessities rather than luxuries, and due to the wide availability of alternative providers and low switching costs, customers tend to have a low emotional bond with the service provider. This results in high churn when there is low customer satisfaction with the service and/or service provider.
Source: Cisco IBSG, 2012
Cisco IBSG © 2013 Cisco and/or its affiliates. All rights reserved. Page 6
Point of View
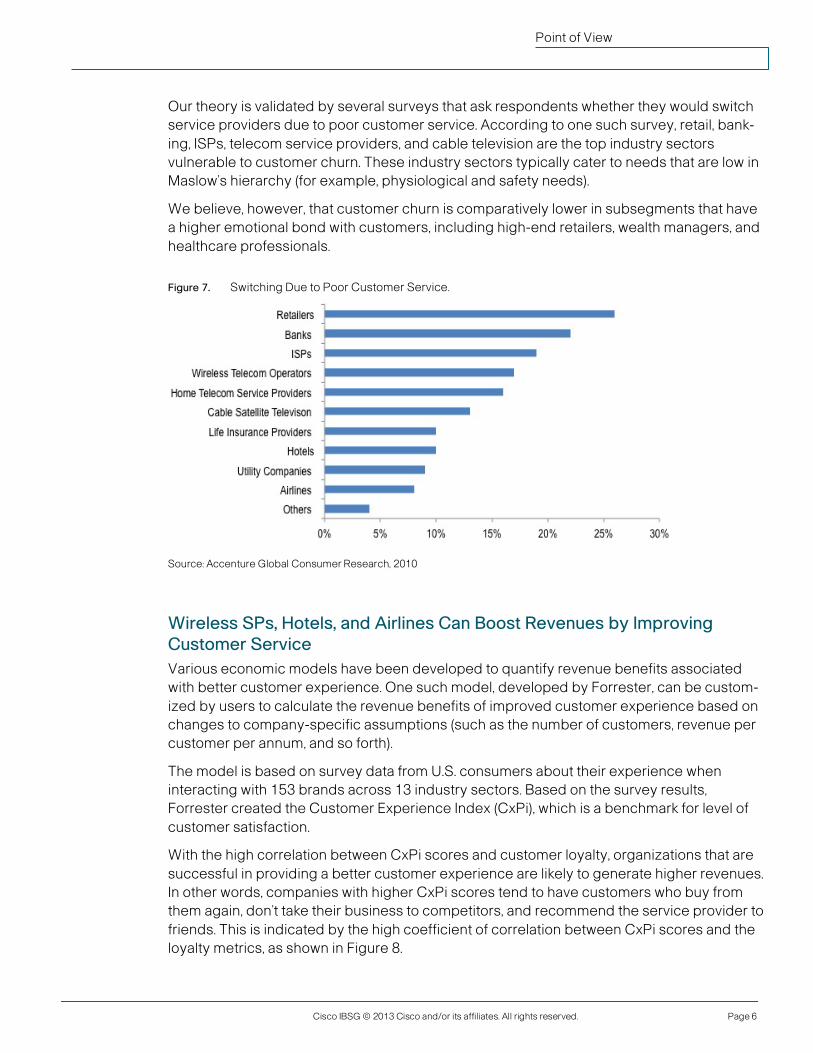
Our theory is validated by several surveys that ask respondents whether they would switch service providers due to poor customer service. According to one such survey, retail, bank-ing, ISPs, telecom service providers, and cable television are the top industry sectors vulnerable to customer churn. These industry sectors typically cater to needs that are low in Maslow’s hierarchy (for example, physiological and safety needs).
We believe, however, that customer churn is comparatively lower in subsegments that have a higher emotional bond with customers, including high-end retailers, wealth managers, and healthcare professionals.
Figure 7. Switching Due to Poor Customer Service.
Wireless SPs, Hotels, and Airlines Can Boost Revenues by Improving Customer Service Various economic models have been developed to quantify revenue benefits associated with better customer experience. One such model, developed by Forrester, can be custom-ized by users to calculate the revenue benefits of improved customer experience based on changes to company-specific assumptions (such as the number of customers, revenue per customer per annum, and so forth).
The model is based on survey data from U.S. consumers about their experience when interacting with 153 brands across 13 industry sectors. Based on the survey results, Forrester created the Customer Experience Index (CxPi), which is a benchmark for level of customer satisfaction.
With the high correlation between CxPi scores and customer loyalty, organizations that are successful in providing a better customer experience are likely to generate higher revenues. In other words, companies with higher CxPi scores tend to have customers who buy from them again, don’t take their business to competitors, and recommend the service provider to friends. This is indicated by the high coefficient of correlation between CxPi scores and the loyalty metrics, as shown in Figure 8.
Source: Accenture Global Consumer Research, 2010

Cisco IBSG © 2013 Cisco and/or its affiliates. All rights reserved. Page 7
Point of View
Figure 8. Correlation Between CxPi Score and Loyalty Metrics.
Loyalty Metric Coefficient of Correlation with CxPi
Willingness to consider the company for another purchase
0.66
Likelihood to switch business to a competitor -0.40
Likelihood to recommend to a friend or colleague 0.70
Although all the industry sectors analyzed experienced revenue benefits from improved customer service, the magnitude differed across industries (see Figure 7). Wireless service providers, hotels, and airlines are the industry sectors that can generate maximum revenue benefits if organizations move from a below-average to above-average CxPi score.
On the other hand, the benefits are lowest for retailers. It is important to note that Forrester calculated the benefits for a hypothetical retail chain with 4 million customers (versus millions of subscribers assumed for the wireless service provider). The benefits, of course, would be higher for big retailers, such as Walmart and Target, which have much larger customer bases.
Figure 9. Revenue Benefits Due to Better Customer Service by Industry.
Source: Forrester Research
Source: Business Impact of Customer Experience, Forrester, June 2011

Cisco IBSG © 2013 Cisco and/or its affiliates. All rights reserved. Page 8
Point of View
Customer Satisfaction Drives Long-Term Shareholder Value
Does customer satisfaction translate into growth of long-term shareholder value? Common wisdom says that satisfied customers tend to be more loyal, provide repeat sales, and refer businesses to family / friends. This translates into revenues that are both higher and more stable:
● Existing customers provide more cross-selling / up-selling opportunities, as they are receptive to advertising and promotional offers.
● Current customers tend to be more loyal, resulting in stable earnings and lower marketing costs.
● New customers are added due to positive word-of-mouth advertising (physical and online).
Organizations that manage to keep their customers satisfied have been successful in generating higher stock price returns. Analysis of returns for the S&P 500 index and organizations with the top 20 percent of ACSI4 scores between 1997 and 2003 indicated that the latter significantly outperformed the S&P 500, with cumulative returns of 40 percent versus 13 percent for the S&P 500 index.
Quantifying the Impact of Customer Service
The above findings are further validated by a study published in 20055, based on the ACSI scores of 200 Fortune 500 companies. The study found that a positive and significant relationship exists between customer satisfaction and cash flow growth, while a negative and significant relationship exists between customer satisfaction and future cash flow variability (in other words, greater customer satisfaction equates to less fluctuation in cash flow).
For every one-point increase in customer satisfaction, operating cash flows increased by $1.01 the following year (for every $1,000 in assets). Putting this in perspective, for a company with $54 billion of assets, a one-point increase in customer satisfaction translates into incremental future cash flows of $55 million and a decline of 4 percent in cash flow variability.
Thus, higher cash flows combined with the lower cost of capital (due to stable cash flows) result in higher present value of future cash flows (or higher shareholder value).
4ACSI: American Customer Satisfaction Index. 5 “Customer Satisfaction, Cash Flow, and Shareholder Value,” Journal of Marketing, June 2005.

Cisco IBSG © 2013 Cisco and/or its affiliates. All rights reserved. Page 9
Point of View
Figure 10. Cumulative Returns: ACSI Top 20% Versus S&P 500.
Technology Can Help Make the Difference
Companies offering services with low switching costs and a low emotional bond for customers can differentiate their offerings through improved and personalized customer service levels, as well as seamless customer and brand experience across various means of interaction (such as physical, mobile, web, and television). With the changing demographic profile of customers, growth of e-commerce, and proliferation of mobile devices, the oppor-tunity for technology to make a difference is unprecedented.
The potential is highest in the retail, banking, Internet, and telecommunications sectors, where customer interaction occurs across many different channels. In these industries, relevant technology applications can make the difference because they allow companies to scale at lower cost and provide mass differentiation. These technology applications include e-commerce platforms and digital channels, social networks, remote experts, customer recognition and service personalization, self-service, mobility, and many others. While they may help enhance service options and levels, increase flexibility and customization, and lead to more selling opportunities, they can also scale at much lower overall cost. The example of Netflix, the U.S. leader in online DVD and on-demand video entertainment, shows how a low-touch service model coupled with mass customization is possible with technology.
Source: Journal of Marketing

Cisco IBSG © 2013 Cisco and/or its affiliates. All rights reserved. Page 10
Point of View
Conclusion
We believe that customer satisfaction, far from being a “soft” metric, is an important deter-minant of Customer Lifetime Value and shareholder value. Organizations that focus on improving customer satisfaction are likely to be more successful in expanding their customer base, generating higher sales from existing customers, and building loyalty. Maximizing customer share-of-wallet and customer loyalty are especially important in today’s challenging economic environment, which includes intense competition from organizations in emerging economies.
Industry sectors more vulnerable to churn related to customer dissatisfaction can differentiate their offerings through technology innovations because they allow companies to provide mass differentiation and scale at lower costs. Increasing customer satisfaction and loyalty in this manner will ultimately contribute to lower customer churn and shareholder value creation.