assessing roadway traffic count duration and frequency ... · assessing roadway traffic count...
TRANSCRIPT
1
Assessing Roadway Traffic Count Duration and Frequency Impacts on Annual Average Daily Traffic (AADT) Estimation Assessing Accuracy Issues with Current Known Methods in AADT Estimation from Continuous Traffic Monitoring Data
Publication No. FHWA-PL-015-008
November 2014

Notice This document is disseminated under the sponsorship of the United States Department of Transportation in the interest of information exchange. The United States Government assumes no liability for its contents or use thereof. This report does not constitute a standard, specification, or regulation.
The United States Government does not endorse products or manufacturers. Trade and manufacturers’ names appear in this report only because they are considered essential to the object of the document.
Quality Assurance Statement The Federal Highway Administration (FHWA) provides high-quality information to serve Government, industry, and the public in a manner that promotes public understanding. Standards and policies are used to ensure and maximize the quality, objectivity, utility, and integrity of its information. FHWA periodically reviews quality issues and adjusts its programs and processes to ensure continuous quality improvement.

i
Technical Report Documentation Page
1. Report No. FHWA-PL-015-008
2. Government Accession No.
3. Recipient's Catalog No.
4. Title and Subtitle Assessing Roadway Traffic Count Duration and Frequency Impacts on Annual Average Daily Traffic Estimation: Assessing Accuracy Issues with Current Known Methods in AADT Estimation from Continuous Traffic Monitoring Data
5. Report Date November 2014 6. Performing Organization Code
7. Author(s) Robert Krile, Jingyu Feng, Jeremy Schroeder (Battelle)
8. Performing Organization Report No.
9. Performing Organization Name and Address Battelle 505 King Ave. Columbus, Ohio 43201
10. Work Unit No. (TRAIS) 11. Contract or Grant No. DTFH61-13-D-00012
12. Sponsoring Agency Name and Address Federal Highway Administration Office of Highway Policy Information 1200 New Jersey Avenue SE Washington, DC 20590
13. Type of Report and Period Covered 14. Sponsoring Agency Code
15. Supplementary Notes Project performed in cooperation with the U.S. Department of Transportation, Federal Highway Administration and a Technical Advisory Committee (TAC) consisting of Alaska DOT & Public Facilities, Georgia DOT, Illinois DOT, Minnesota DOT, Pennsylvania DOT, Texas DOT, and Wisconsin DOT. Steven Jessberger (Task Manager) 16. Abstract Numerous factoring and baseline values are required to ensure annual average daily traffic (AADT) data are collected and reported correctly. The variability of numerous methods currently used are explored so that those in the traffic community will clearly know the limitations and the extent of each method used and how to properly utilize methods for their agency to obtain the necessary results. Federal Highway Administration (FHWA) Travel Monitoring Analysis System (TMAS) data from 14 years consisting of 24 hours of the day and 7 days of the week volume data from over 6000 continuous permanent volume traffic data sites in the United States comprised the reference dataset for this research. Randomly selected (with some constraints) sites each include one year of 100% complete daily reporting and the set of sites represent 12 functional classes, years 2000 through 2013, 43 states and DC, and various volume ranges. Four AADT estimation methods were examined for accuracy when data from various time periods were removed. This report is a final task report that summarizes identified inaccuracies with current methods that are used for AADT estimation, and includes the analysis methodology and summary statistics findings.
17. Key Words Annual average daily traffic, AADT, continuous traffic monitoring, TMAS
18. Distribution Statement No restrictions. This document is available to the public.
19. Security Classif.(of this report) Unclassified
20. Security Classif. (of this page) Unclassified
21. No. of Pages 23
22. Price
Form DOT F 1700.7 (8-72) Reproduction of completed page authorized

ii
Preface We would like to acknowledge the following Technical Advisory Committee members for their contributions, support and technical guidance during this project. Jennifer Anderson Alaska DOT & Public Facilities Scott Susten Georgia DOT William Morgan Illinois DOT Gene Hicks, Thomas Nelson, Mark Flinner Minnesota DOT Jeremy Freeland, Joseph Pipe Pennsylvania DOT William Knowles Texas DOT Rhonda McDonald Wisconsin DOT
ASSESSING ACCURACY ISSUES WITH CURRENT KNOWN METHODS IN
AADT ESTIMATION FROM CONTINUOUS TRAFFIC MONITORING DATA
iii
Table of Contents Executive Summary ...................................................................................................................................... 4
Introduction ................................................................................................................................................... 4
Methods ......................................................................................................................................................... 5
Traffic Monitoring Site Data ..................................................................................................................... 5
Completeness Results ............................................................................................................................. 8
Site Selection ........................................................................................................................................... 9
Simulated Data Removal ....................................................................................................................... 11
AADT Estimation Methods ..................................................................................................................... 12
Simulated Data Removal, Calculation and Characterization of Bias ..................................................... 15
Results ........................................................................................................................................................ 16
Discussion ................................................................................................................................................... 16
List of Figures Figure 1. National Bias ................................................................................................................................ 18
Figure 2. Bias with 30 Days of Data Removed ........................................................................................... 19
Figure 3. Bias with 60 Days of Data Removed ........................................................................................... 20
List of Tables Table 1. State and Year Combinations for Which No Data Have Been Provided ........................................ 5
Table 2. Functional Classification Code ........................................................................................................ 7
Table 3. Summary of Data Cleaning ............................................................................................................. 7
Table 4. Traffic Direction Code ..................................................................................................................... 8
Table 5. Lane of Travel ................................................................................................................................. 8
Table 6. Number of Sites by Functional Classification Code ........................................................................ 9
Table 7. Number of Sites by Volume Range ................................................................................................. 9
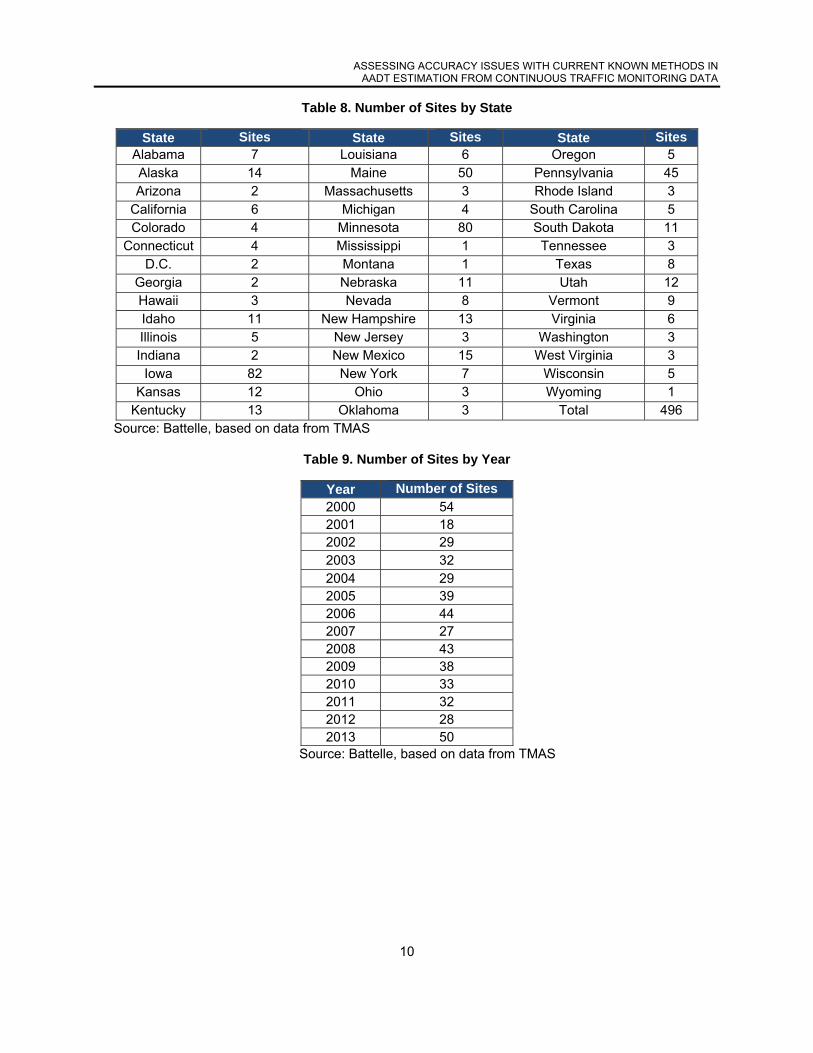
Table 8. Number of Sites by State .............................................................................................................. 10
Table 9. Number of Sites by Year ............................................................................................................... 10
Table 10. Analysis of National AADT Bias Findings ................................................................................... 18

ASSESSING ACCURACY ISSUES WITH CURRENT KNOWN METHODS IN
AADT ESTIMATION FROM CONTINUOUS TRAFFIC MONITORING DATA
4
Executive Summary Numerous factoring and baseline values are required to ensure annual average daily traffic (AADT) data are collected and reported correctly. The variability of numerous methods currently used are explored so that those in the traffic community will clearly know the limitations and the extent of each method used and how to properly utilize methods for their agency to obtain the necessary results. Federal Highway Administration (FHWA) Travel Monitoring Analysis System (TMAS) data from 14 years consisting of 24 hours of the day and 7 days of the week volume data from over 6000 continuous permanent volume traffic data sites in the United States comprised the reference dataset for this research. Almost 500 randomly selected (with some constraints) sites each include one year of 100% complete daily reporting and the set of sites represent 12 functional classes, years 2000 through 2013, 43 states and DC, and various volume ranges. Four AADT estimation methods were examined for accuracy when data from various time periods were removed. This report is a final task 2 report that summarizes the results of a study of continuous traffic monitoring sites and inaccuracies with current methods that are used for AADT estimation, and includes the analysis methodology and summary statistics findings.
Introduction Annual Average Daily Traffic (AADT) volume is central to many transportation performance and planning measures. It can be calculated in different manners, including formulations that attempt to account for the scenario in which some of the data for a year are either missing or removed for being inaccurate. While it is necessary to have AADT estimation methods that can function in the absence of some data, the estimation of AADT from incomplete data is prone to bias. The objectives of this research were to examine the bias in AADT calculation for the methods in most common use as well as to determine if the methods can be improved. This bias evaluation was conducted with data from actual permanent traffic count stations where complete (all hours of the day for all days of the year), hourly annual data were available. In these cases, a true AADT is available as a simple average of all hourly traffic counts for the year. The evaluation employed an iterative simulation method to tag for removal some amount of actual observed traffic volume data, to subsequently estimate the AADT from the remaining untagged data, and then to compare the AADT calculated for the reduced set of data to the true known AADT for that traffic monitoring station. The difference between the removed data AADT and the true AADT was the bias of the method for that particular iteration of the data removal scenario. The simulation was conducted a large number of times and statistics were generated for the range of different bias results observed. Different degrees of data removal were simulated from as little as one day a month to as large as approximately nine months (7 days per month remaining). The data removal also looked at different patterns of removal ranging from sporadic or random removal to systemic or continuous block removal. Each data removal scenario is documented in greater detail in this regard. The bias evaluation was conducted for a sufficiently large number of traffic monitoring sites that nationally representative results could be reported. Additionally, results were reported by subdivisions of traffic monitoring sites to include volume ranges, functional classifications, and states. At the most detailed level, the bias statistics were determined for each individual traffic monitoring station. This report is organized into discussions of the data obtained for the evaluation, the methods employed for the AADT estimation, the simulated data removal, the subsequent bias calculation and characterization, and finally the results obtained.

ASSESSING ACCURACY ISSUES WITH CURRENT KNOWN METHODS IN
AADT ESTIMATION FROM CONTINUOUS TRAFFIC MONITORING DATA
5
Methods TrafficMonitoringSiteDataTo carry out this evaluation, data from actual permanent traffic count stations were obtained. Sites were selected first for having a complete annual accounting of volume by hour of day so that a known true AADT could be determined. The FHWA TMAS traffic volume data were extracted for 496 (of 6000+ eligible) permanent traffic counting sites. The randomly selected (with some constraints) sites each include one year of 100% complete daily reporting (all hours for every day in the given year) and the set of sites are characterized overall by:
• 12 current functional classifications (2 of 14 excluded for lack of data) • Years 2000 through 2013 • 44 states (including D.C. – 7 excluded for lack of data) • 4 AADT Volume Ranges (<1k, 1k-<10k, 10k-<100k, and ≥100k)
This section documents the scope and completeness of the traffic volume data used. It also highlights some of the technical difficulties encountered and indicates how they were addressed. Finally, it provides a methodology for meeting the task requirement of selecting at least 400 continuous monitoring sites for subsequent analysis.
The traffic volume data files received from the FHWA contain records from years 2000 through 2013. A total of 100,107,278 records were read in from 9,634 data volume files. There were a number of state and year combinations for which no volume data were provided. They are identified in Table 1 below. Additionally, there were a number of individual months for select states that were missing volume data. Ultimately, FHWA decided to proceed with the evaluation without these records as the potential benefits of adding them were judged insufficient to justify the additional time and effort required to obtain them.
Table 1. State and Year Combinations for Which No Data Have Been Provided
State
Year (20xx)
00 01 02 03 04 12 13 Arizona X Colorado X D.C. X X X Delaware X X X Louisiana X X Maine X X X X X Maryland X X X West Virginia X X
Source: Battelle
DataIssuesThe format of each traffic volume file was a flat ASCII text file in the FHWA 2001 Traffic Monitoring Guide (TMG) format, not delimited, with (generally) 140 (the restriction code blank) or 141 columns of data. A key for reading in the files was provided in the 2001 TMG. The process of reading in the data records did include some unanticipated challenges. For instance, the volume record length was not uniform in all cases.
An example of a record with a different length than 140 or 141 occurs when the hourly counts were coded in 6 digits rather than 5 digits. Below is an example:
ASSESSING ACCURACY ISSUES WITH CURRENT KNOWN METHODS IN
AADT ESTIMATION FROM CONTINUOUS TRAFFIC MONITORING DATA
6
Record containing “-00001”:
Inside “dec 2010.VOL” File
35111781341301012095000610005200020-00001-00001-00001-00001001680079600679 00633005680069400640007170093300922009920071800488004930026300260001580
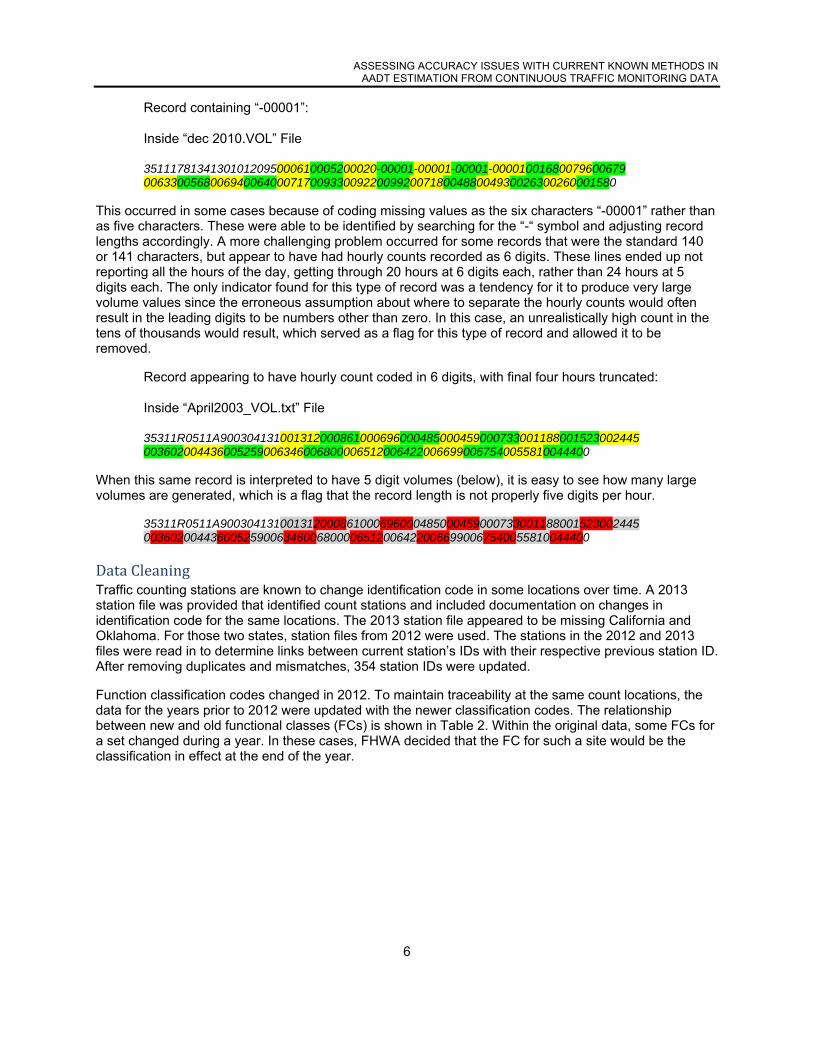
This occurred in some cases because of coding missing values as the six characters “-00001” rather than as five characters. These were able to be identified by searching for the “-“ symbol and adjusting record lengths accordingly. A more challenging problem occurred for some records that were the standard 140 or 141 characters, but appear to have had hourly counts recorded as 6 digits. These lines ended up not reporting all the hours of the day, getting through 20 hours at 6 digits each, rather than 24 hours at 5 digits each. The only indicator found for this type of record was a tendency for it to produce very large volume values since the erroneous assumption about where to separate the hourly counts would often result in the leading digits to be numbers other than zero. In this case, an unrealistically high count in the tens of thousands would result, which served as a flag for this type of record and allowed it to be removed.
Record appearing to have hourly count coded in 6 digits, with final four hours truncated:
Inside “April2003_VOL.txt” File
35311R0511A900304131001312000861000696000485000459000733001188001523002445 0036020044360052590063460068000065120064220066990067540055810044400
When this same record is interpreted to have 5 digit volumes (below), it is easy to see how many large volumes are generated, which is a flag that the record length is not properly five digits per hour.
35311R0511A900304131001312000861000696000485000459000733001188001523002445 0036020044360052590063460068000065120064220066990067540055810044400
DataCleaning
Traffic counting stations are known to change identification code in some locations over time. A 2013 station file was provided that identified count stations and included documentation on changes in identification code for the same locations. The 2013 station file appeared to be missing California and Oklahoma. For those two states, station files from 2012 were used. The stations in the 2012 and 2013 files were read in to determine links between current station’s IDs with their respective previous station ID. After removing duplicates and mismatches, 354 station IDs were updated.
Function classification codes changed in 2012. To maintain traceability at the same count locations, the data for the years prior to 2012 were updated with the newer classification codes. The relationship between new and old functional classes (FCs) is shown in Table 2. Within the original data, some FCs for a set changed during a year. In these cases, FHWA decided that the FC for such a site would be the classification in effect at the end of the year.

ASSESSING ACCURACY ISSUES WITH CURRENT KNOWN METHODS IN
AADT ESTIMATION FROM CONTINUOUS TRAFFIC MONITORING DATA
7
Table 2. Functional Classification Code
New FC Old FC Definition 1R 1 Principal Arterial - Interstate 3R 2 Principal Arterial - Other 4R 6 Minor Arterial 5R 7 Major Collector 6R 8 Minor Collector 7R 9 Local 1U 11 Principal Arterial - Interstate
2U 12 Principal Arterial-Other Freeways &
Expressways 3U 14 Principal Arterial - Other 4U 16 Minor Arterial 5U 17 Collector 7U 19 Local
Source: FHWA
After the preprocessing, some limited data cleaning was performed. The data cleaning resulted in 51,724,032 records being removed, with 48,383,246 records remaining. The detailed cleaning steps and number of record removals is shown in Table 3.
Table 3. Summary of Data Cleaning
Reason to Remove
# of Removed Records
Restriction Code is larger than 1. 2,146 All counts are empty 790,078
If any hour is larger than 10,000, the hour is compared to the previous hour, if it 100 times larger or smallera 6,729
Duplicate Records (all fields identical) 28,493,923 Duplicate Record key (FIPS, FC, Station, year, month, day,
direction, lane identical)b 22,431,156 a This step removed misaligned records, some records having counts as 6 digits instead of 5 digits b The last of the records having the same record key was retained Source: Battelle, based on data from TMAS
Following are the defined restriction codes:
0 = no restrictions 1 = construction or other activity affected traffic flow, traffic pattern not impacted 2 = traffic counting device problem (e.g., malfunction or overflow)
Since the restriction code of 2 denotes an error in the counting device, these records were removed. Restriction codes larger than 2 were observed. The 2001 TMG volume format does not support these. It is possible that the cases where a value of 3 or more was observed in the restriction code were instances of the truncated 6-digit volume records. Regardless, these records were excluded from further consideration.
Examples of the duplicate records and records which have duplicate key are:
ASSESSING ACCURACY ISSUES WITH CURRENT KNOWN METHODS IN
AADT ESTIMATION FROM CONTINUOUS TRAFFIC MONITORING DATA
8
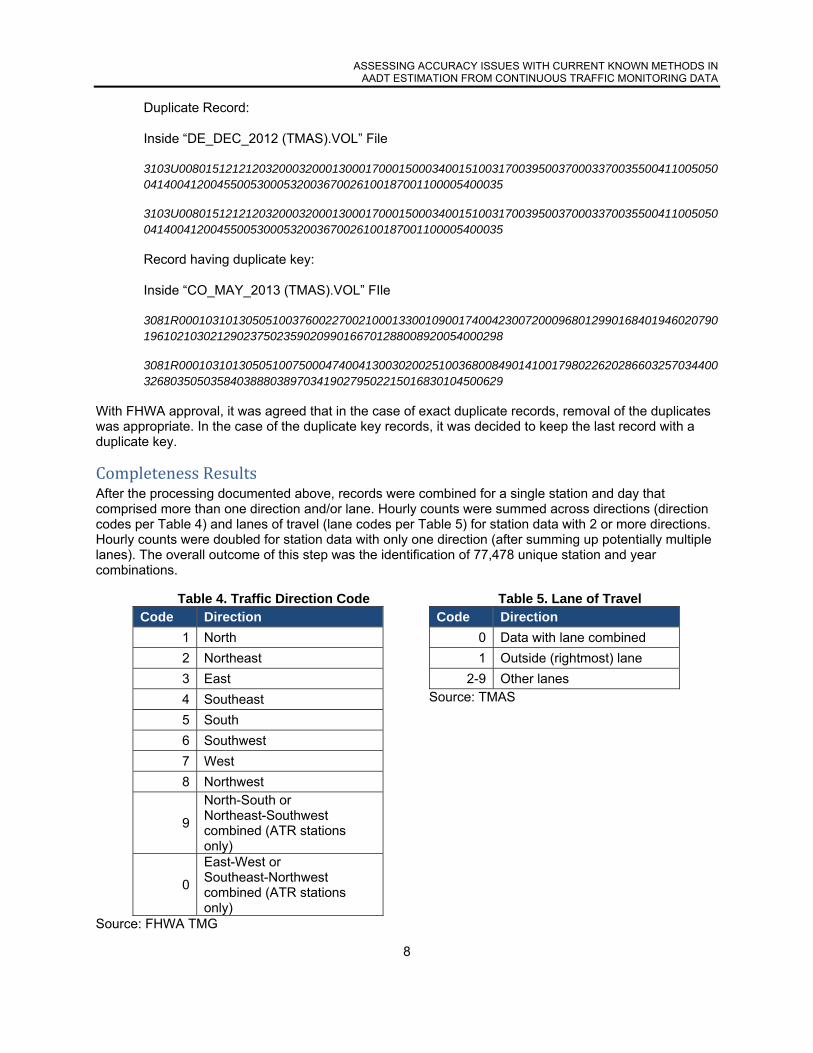
Duplicate Record:
Inside “DE_DEC_2012 (TMAS).VOL” File
3103U008015121212032000320001300017000150003400151003170039500370003370035500411005050041400412004550053000532003670026100187001100005400035
3103U008015121212032000320001300017000150003400151003170039500370003370035500411005050041400412004550053000532003670026100187001100005400035
Record having duplicate key:
Inside “CO_MAY_2013 (TMAS).VOL” FIle
3081R000103101305051003760022700210001330010900174004230072000968012990168401946020790196102103021290237502359020990166701288008920054000298
3081R000103101305051007500047400413003020025100368008490141001798022620286603257034400326803505035840388803897034190279502215016830104500629
With FHWA approval, it was agreed that in the case of exact duplicate records, removal of the duplicates was appropriate. In the case of the duplicate key records, it was decided to keep the last record with a duplicate key.
CompletenessResultsAfter the processing documented above, records were combined for a single station and day that comprised more than one direction and/or lane. Hourly counts were summed across directions (direction codes per Table 4) and lanes of travel (lane codes per Table 5) for station data with 2 or more directions. Hourly counts were doubled for station data with only one direction (after summing up potentially multiple lanes). The overall outcome of this step was the identification of 77,478 unique station and year combinations.
Table 4. Traffic Direction Code Code Direction
1 North
2 Northeast
3 East
4 Southeast
5 South
6 Southwest
7 West
8 Northwest
9
North-South or Northeast-Southwest combined (ATR stations only)
0
East-West or Southeast-Northwest combined (ATR stations only)
Table 5. Lane of Travel Code Direction
0 Data with lane combined
1 Outside (rightmost) lane
2-9 Other lanes Source: TMAS
Source: FHWA TMG

ASSESSING ACCURACY ISSUES WITH CURRENT KNOWN METHODS IN
AADT ESTIMATION FROM CONTINUOUS TRAFFIC MONITORING DATA
9
In order to be used for the Task 2 analysis, a station and year had to have data for every hour of day for the entire year. Only 6,017 of the station and year combinations met this criteria.
SiteSelectionAfter processing the raw data, hourly traffic volume by day was obtained for a total of 6,017 site and year combinations where data were complete for every day and for all hours of the day. From this initial set of sites, a reduced sample of at least 400 sites was required to continue with the Task. That sample was obtained through a random selection process, but subject to some constraints. The constraints involved:
Including an approximately equal number of sites for each functional class; Including sites for all volume ranges; Including every state to the extent possible; and Including an approximately equal allocation of years.
To assure the minimum number of sites would be included, an oversample was initially taken. The proposed sites were submitted for review by FHWA and the Technical Advisory Committee (TAC). Some minor adjustments were required. The final list of sites included 496 site and year combinations. These are summarized by representation of functional classes, volume ranges, states, and years in the tables below.
Table 6. Number of Sites by Functional Classification Code
FC Number of Sites 1R 37 1U 40 2U 40 3R 48 3U 43 4R 47 4U 42 5R 55 5U 42 6R 44 7R 16 7U 42
Source: Battelle, based on data from TMAS
Table 7. Number of Sites by Volume Range
Volume Range AADT Range Number of Sites 1 AADT <1,000 65 2 1,000 ≤ AADT < 10,000 223 3 10,000 ≤ AADT < 100,000 149 4 AADT ≥ 100,000 59
Source: Battelle, based on data from TMAS
ASSESSING ACCURACY ISSUES WITH CURRENT KNOWN METHODS IN
AADT ESTIMATION FROM CONTINUOUS TRAFFIC MONITORING DATA
10
Table 8. Number of Sites by State
State Sites State Sites State Sites Alabama 7 Louisiana 6 Oregon 5 Alaska 14 Maine 50 Pennsylvania 45 Arizona 2 Massachusetts 3 Rhode Island 3
California 6 Michigan 4 South Carolina 5 Colorado 4 Minnesota 80 South Dakota 11
Connecticut 4 Mississippi 1 Tennessee 3 D.C. 2 Montana 1 Texas 8
Georgia 2 Nebraska 11 Utah 12 Hawaii 3 Nevada 8 Vermont 9 Idaho 11 New Hampshire 13 Virginia 6 Illinois 5 New Jersey 3 Washington 3 Indiana 2 New Mexico 15 West Virginia 3
Iowa 82 New York 7 Wisconsin 5 Kansas 12 Ohio 3 Wyoming 1
Kentucky 13 Oklahoma 3 Total 496 Source: Battelle, based on data from TMAS
Table 9. Number of Sites by Year
Year Number of Sites 2000 54 2001 18 2002 29 2003 32 2004 29 2005 39 2006 44 2007 27 2008 43 2009 38 2010 33 2011 32 2012 28 2013 50
Source: Battelle, based on data from TMAS
ASSESSING ACCURACY ISSUES WITH CURRENT KNOWN METHODS IN
AADT ESTIMATION FROM CONTINUOUS TRAFFIC MONITORING DATA
11
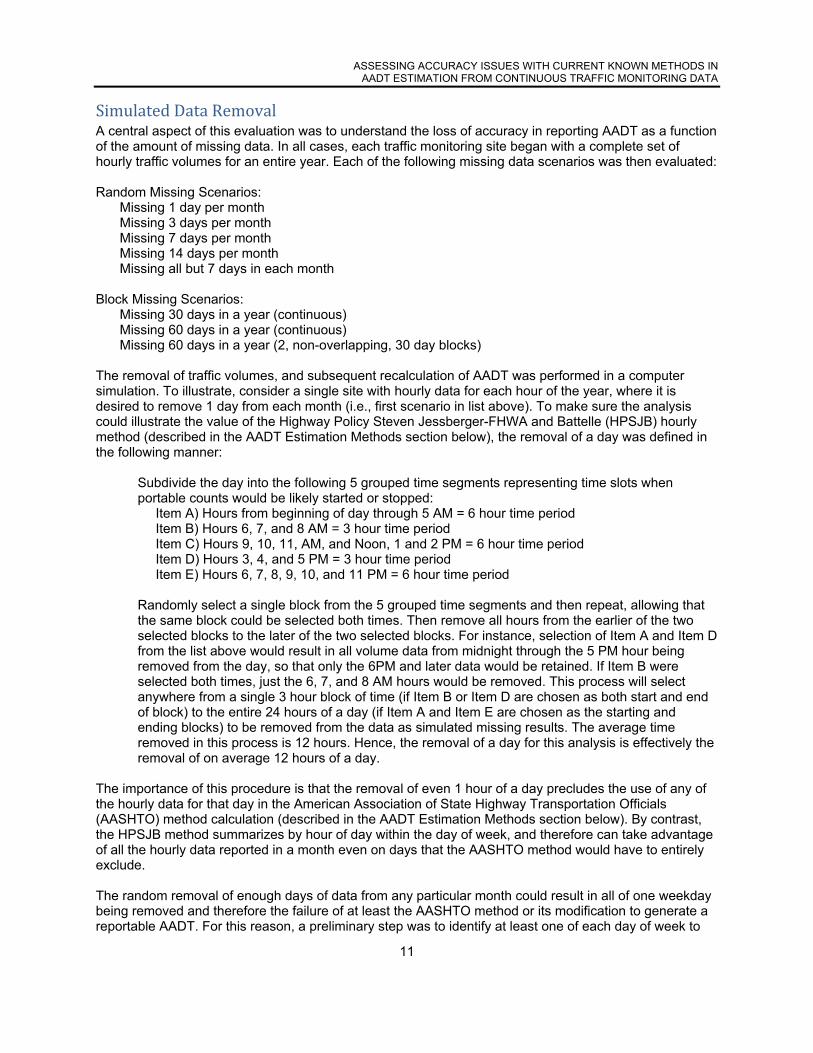
SimulatedDataRemovalA central aspect of this evaluation was to understand the loss of accuracy in reporting AADT as a function of the amount of missing data. In all cases, each traffic monitoring site began with a complete set of hourly traffic volumes for an entire year. Each of the following missing data scenarios was then evaluated: Random Missing Scenarios:
Missing 1 day per month Missing 3 days per month Missing 7 days per month Missing 14 days per month Missing all but 7 days in each month
Block Missing Scenarios:
Missing 30 days in a year (continuous) Missing 60 days in a year (continuous) Missing 60 days in a year (2, non-overlapping, 30 day blocks)
The removal of traffic volumes, and subsequent recalculation of AADT was performed in a computer simulation. To illustrate, consider a single site with hourly data for each hour of the year, where it is desired to remove 1 day from each month (i.e., first scenario in list above). To make sure the analysis could illustrate the value of the Highway Policy Steven Jessberger-FHWA and Battelle (HPSJB) hourly method (described in the AADT Estimation Methods section below), the removal of a day was defined in the following manner:
Subdivide the day into the following 5 grouped time segments representing time slots when portable counts would be likely started or stopped:
Item A) Hours from beginning of day through 5 AM = 6 hour time period Item B) Hours 6, 7, and 8 AM = 3 hour time period Item C) Hours 9, 10, 11, AM, and Noon, 1 and 2 PM = 6 hour time period Item D) Hours 3, 4, and 5 PM = 3 hour time period Item E) Hours 6, 7, 8, 9, 10, and 11 PM = 6 hour time period
Randomly select a single block from the 5 grouped time segments and then repeat, allowing that the same block could be selected both times. Then remove all hours from the earlier of the two selected blocks to the later of the two selected blocks. For instance, selection of Item A and Item D from the list above would result in all volume data from midnight through the 5 PM hour being removed from the day, so that only the 6PM and later data would be retained. If Item B were selected both times, just the 6, 7, and 8 AM hours would be removed. This process will select anywhere from a single 3 hour block of time (if Item B or Item D are chosen as both start and end of block) to the entire 24 hours of a day (if Item A and Item E are chosen as the starting and ending blocks) to be removed from the data as simulated missing results. The average time removed in this process is 12 hours. Hence, the removal of a day for this analysis is effectively the removal of on average 12 hours of a day.
The importance of this procedure is that the removal of even 1 hour of a day precludes the use of any of the hourly data for that day in the American Association of State Highway Transportation Officials (AASHTO) method calculation (described in the AADT Estimation Methods section below). By contrast, the HPSJB method summarizes by hour of day within the day of week, and therefore can take advantage of all the hourly data reported in a month even on days that the AASHTO method would have to entirely exclude. The random removal of enough days of data from any particular month could result in all of one weekday being removed and therefore the failure of at least the AASHTO method or its modification to generate a reportable AADT. For this reason, a preliminary step was to identify at least one of each day of week to

ASSESSING ACCURACY ISSUES WITH CURRENT KNOWN METHODS IN
AADT ESTIMATION FROM CONTINUOUS TRAFFIC MONITORING DATA
12
keep in each month, before designating any days for removal. Note that this was not strictly necessary for the 1 and 3 day removal scenarios, but for programming simplicity was used in these scenarios as well. After the designated protected days were determined, the algorithm randomly removed the 1, 3, 7, or 14 days from each month per the method above. Beyond 14 days per month missing, the most extreme case of missing data that would still permit AASHTO method calculation of AADT would be to have exactly one of each day of week within each month. This would effectively be 21 to 24 days of missing data (depending on the length of the month). To evaluate this extreme scenario, the initially protected 7 days of each month, one for each day of week, were just used as the sample. For each of the missing days scenarios, the selection of days to remove was performed in a random manner 1,000 times. At each iteration, the AADT from each of the four evaluated methods was calculated for all the data remaining in the year for each traffic monitoring site. To evaluate the impact from removal of blocks of time, a slightly modified procedure was used. Starting with January 1, the algorithm picked a random block of time to start removal from that day. An ending date 30 (or 60) days in the future was selected, also with a final time block. All data from the starting time block through the finishing time block were then removed from the data. The algorithm then produced a second iteration starting January 2, and so forth. This process continued until a 30 or 60 day block could no longer be obtained (December 1 was the last starting date for the 30 day removal and November 1 was the last starting date for the 60 day removal). In this manner, there were only 335 unique scenarios evaluated for the 30 day removal, and 305 unique scenarios evaluated for the 60 day removal (one additional scenario in a leap year). In addition to looking at overall accuracy of AADT statistics in these two scenarios, results were also evaluated by starting day of the year for which data were first removed. A second 60 day removal scenario was evaluated where the 60 days removed were the result of two non-overlapping 30 day time periods for removal. This scenario was evaluated in 1,000 iterations. It should be noted that the 30 or 60 day period of missing data could create a conflict with the definition of the AADT methods. If a removal started with the first time period on April 1 and extended through the last time period on April 30, for instance, all of April would be removed and consequently none of the methods that first calculated a Monthly Average Daily Traffic (MADT) could be applied. To address this issue, the calculation methodologies were altered to only include those months for which an MADT was able to be calculated. For the AASHTO method, then, the average of all monthly Mondays, Tuesdays, Wednesdays, Thursdays, Fridays, Saturdays, and Sundays was first tabulated for the 11 months not missing and then the 7 day of week averages were averaged to get the overall AADT.
AADTEstimationMethodsThe average daily traffic volume may be calculated in different ways, as discussed in the FHWA TMG1 [p.1-5]. While the TMG discusses annual average traffic volumes, volumes are commonly calculated first at a monthly level, and then yearly values determined by a simple average of the 12 monthly results. This methodology produces a bias by equally weighting the volume contributions of months whether they have 28, 29, 30, or 31 days, but it is the established practice in the field. In the text that follows, monthly average daily traffic volume will be denoted as MADT. Annual average daily traffic volume will be denoted as AADT.
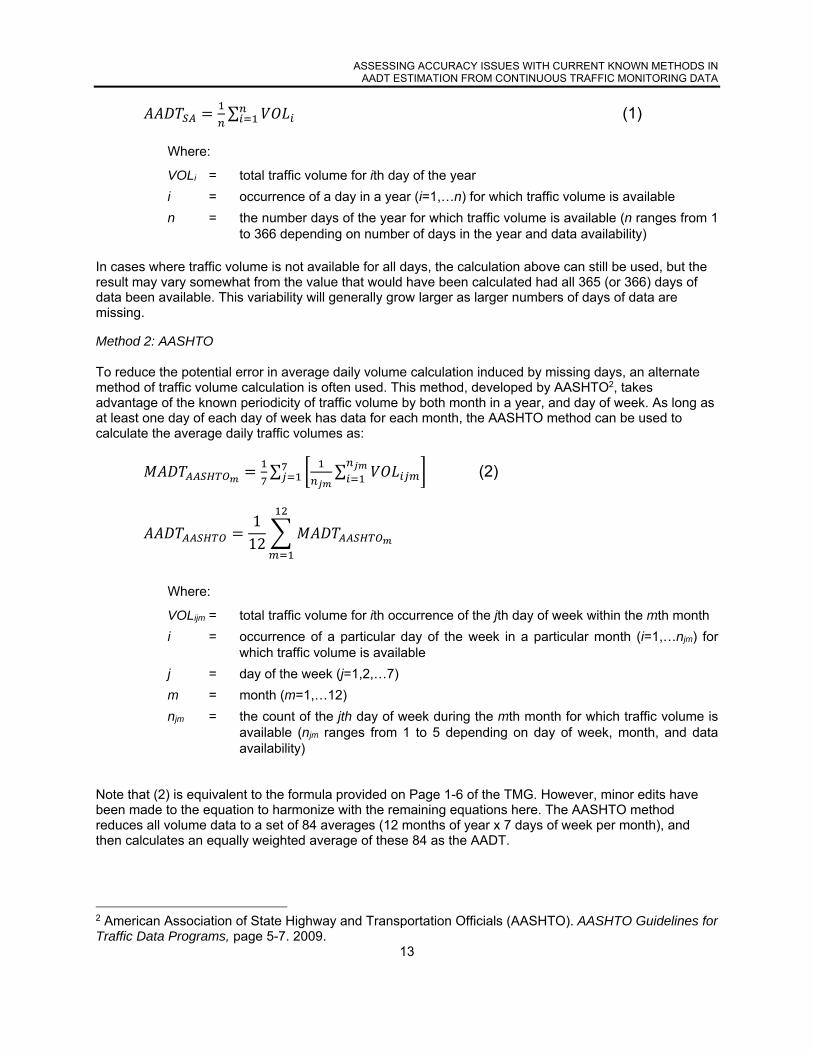
Method 1: Simple Average
In the evaluation of accuracy of AADT estimation, we propose the consideration of four different methods. The first method is a simple average of all days. This method may be expressed mathematically as:
1 U.S. Department of Transportation, Federal Highway Administration, Office of Highway Policy Information. Traffic Monitoring Guide. September 2013.
ASSESSING ACCURACY ISSUES WITH CURRENT KNOWN METHODS IN
AADT ESTIMATION FROM CONTINUOUS TRAFFIC MONITORING DATA
13
∑ (1)
Where:
VOLi = total traffic volume for ith day of the year
i = occurrence of a day in a year (i=1,…n) for which traffic volume is available
n = the number days of the year for which traffic volume is available (n ranges from 1 to 366 depending on number of days in the year and data availability)
In cases where traffic volume is not available for all days, the calculation above can still be used, but the result may vary somewhat from the value that would have been calculated had all 365 (or 366) days of data been available. This variability will generally grow larger as larger numbers of days of data are missing.
Method 2: AASHTO
To reduce the potential error in average daily volume calculation induced by missing days, an alternate method of traffic volume calculation is often used. This method, developed by AASHTO2, takes advantage of the known periodicity of traffic volume by both month in a year, and day of week. As long as at least one day of each day of week has data for each month, the AASHTO method can be used to calculate the average daily traffic volumes as:
∑ ∑ (2)
112
Where:
VOLijm = total traffic volume for ith occurrence of the jth day of week within the mth month
i = occurrence of a particular day of the week in a particular month (i=1,…njm) for which traffic volume is available
j = day of the week (j=1,2,…7)
m = month (m=1,…12)
njm = the count of the jth day of week during the mth month for which traffic volume is available (njm ranges from 1 to 5 depending on day of week, month, and data availability)
Note that (2) is equivalent to the formula provided on Page 1-6 of the TMG. However, minor edits have been made to the equation to harmonize with the remaining equations here. The AASHTO method reduces all volume data to a set of 84 averages (12 months of year x 7 days of week per month), and then calculates an equally weighted average of these 84 as the AADT.
2 American Association of State Highway and Transportation Officials (AASHTO). AASHTO Guidelines for Traffic Data Programs, page 5-7. 2009.
ASSESSING ACCURACY ISSUES WITH CURRENT KNOWN METHODS IN
AADT ESTIMATION FROM CONTINUOUS TRAFFIC MONITORING DATA
14
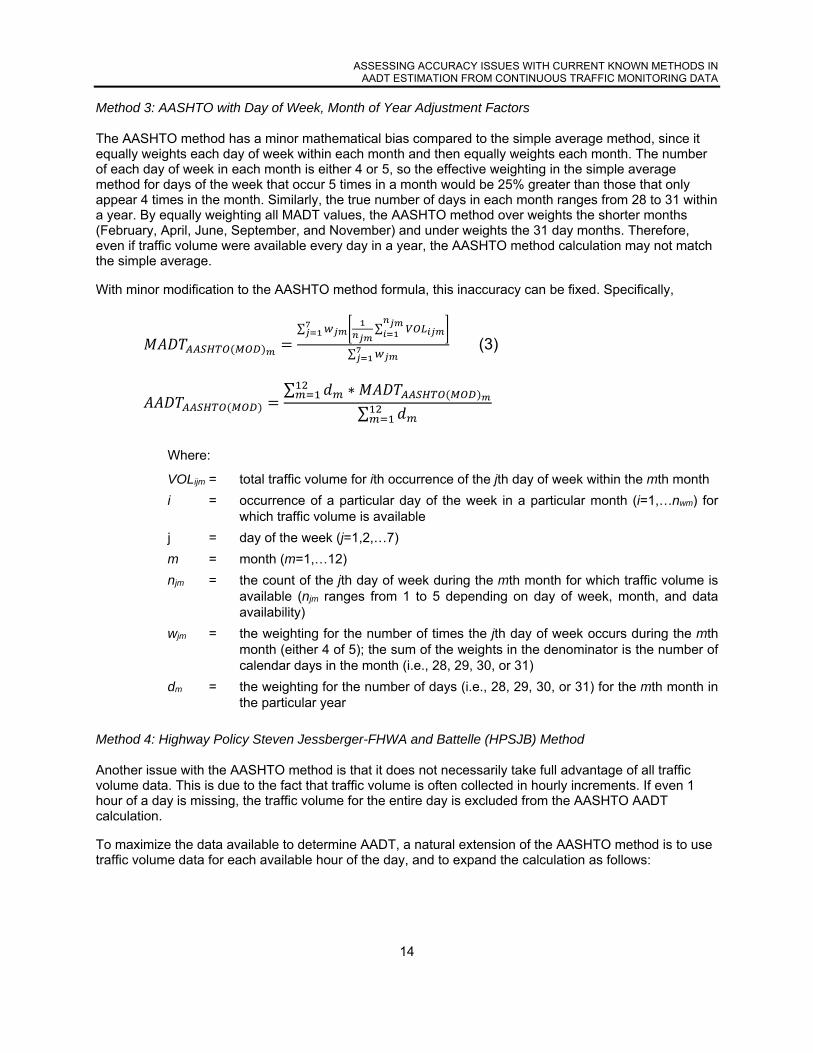
Method 3: AASHTO with Day of Week, Month of Year Adjustment Factors
The AASHTO method has a minor mathematical bias compared to the simple average method, since it equally weights each day of week within each month and then equally weights each month. The number of each day of week in each month is either 4 or 5, so the effective weighting in the simple average method for days of the week that occur 5 times in a month would be 25% greater than those that only appear 4 times in the month. Similarly, the true number of days in each month ranges from 28 to 31 within a year. By equally weighting all MADT values, the AASHTO method over weights the shorter months (February, April, June, September, and November) and under weights the 31 day months. Therefore, even if traffic volume were available every day in a year, the AASHTO method calculation may not match the simple average.
With minor modification to the AASHTO method formula, this inaccuracy can be fixed. Specifically,
∑ ∑
∑ (3)
∑ ∗∑
Where:
VOLijm = total traffic volume for ith occurrence of the jth day of week within the mth month
i = occurrence of a particular day of the week in a particular month (i=1,…nwm) for which traffic volume is available
j = day of the week (j=1,2,…7)
m = month (m=1,…12)
njm = the count of the jth day of week during the mth month for which traffic volume is available (njm ranges from 1 to 5 depending on day of week, month, and data availability)
wjm = the weighting for the number of times the jth day of week occurs during the mth month (either 4 of 5); the sum of the weights in the denominator is the number of calendar days in the month (i.e., 28, 29, 30, or 31)
dm = the weighting for the number of days (i.e., 28, 29, 30, or 31) for the mth month in the particular year
Method 4: Highway Policy Steven Jessberger-FHWA and Battelle (HPSJB) Method
Another issue with the AASHTO method is that it does not necessarily take full advantage of all traffic volume data. This is due to the fact that traffic volume is often collected in hourly increments. If even 1 hour of a day is missing, the traffic volume for the entire day is excluded from the AASHTO AADT calculation.
To maximize the data available to determine AADT, a natural extension of the AASHTO method is to use traffic volume data for each available hour of the day, and to expand the calculation as follows:

ASSESSING ACCURACY ISSUES WITH CURRENT KNOWN METHODS IN
AADT ESTIMATION FROM CONTINUOUS TRAFFIC MONITORING DATA
15
∑ ∑ ∑
∑ (4)
∑ ∗
∑
Where:
VOLihjm= total traffic volume for ith occurrence of the hth hour of day within jth day of week during the mth month
i = occurrence of a particular hour of day within a particular day of the week in a particular month (i=1,…nhjm) for which traffic volume is available
h = hour of the day (h=1,2,…24)
j = day of the week (j=1,2,…7)
m = month (m=1,…12)
nhjm = the number of times the hth hour of day within the jth day of week during the mth month has available traffic volume (nhjm ranges from 1 to 5 depending on hour of day, day of week, month, and data availability)
wjm = the weighting for the number of times the jth day of week occurs during the mth month (either 4 of 5); the sum of the weights in the denominator is the number of calendar days in the month (i.e., 28, 29, 30, or 31)
dm = the weighting for the number of days (i.e., 28, 29, 30, or 31) for the mth month in the particular year
For the precision to which traffic volume data are reported (i.e., hourly totals), this method is expected to provide the smallest possible error when data are missing, since it replaces any missing hourly data with an average of the same hour of day on the same day of week within the same month from available data. As long as the assumption of reasonable correlation between hours of day, days of week, and months holds, this method should provide the most accurate estimate under a scenario with missing data. Additionally, it has the advantage of being able to calculate an AADT in cases where the AASHTO method fails, since it only requires one instance of each hour of given day within each day of the week and month, as opposed to complete, 24 hour data required by the AASHTO method.
SimulatedDataRemoval,CalculationandCharacterizationofBiasThe bias incurred by any particular data removal scenario for a given replicate of the simulation was calculated as a simple percent change.
Biasij = 100*(AADTij – AADTtrue)/AADTtrue
Where i is a particular data removal scenario (e.g., one day of each month) j is a replicate of the simulation (j=1, 2,…,1000)
The distribution of the Biasij terms was then characterized with a set of descriptive statistics. Both the mean and standard deviation of the bias terms were calculated and reported. However, due to the potential for the bias distribution to show some skewness, the median and the 2.5th and 97.5th percentiles of the distribution were the statistics selected for graphical presentation. The median is a measure of the central tendency of the bias results and is not sensitive to a small number of possibly extreme values as

ASSESSING ACCURACY ISSUES WITH CURRENT KNOWN METHODS IN
AADT ESTIMATION FROM CONTINUOUS TRAFFIC MONITORING DATA
16
the mean. A median bias less than zero indicates a method that prevalently underestimates AADT, while a median greater than zero indicates a method that prevalently overestimates AADT. Since this evaluation is based on a random sampling of data, the bias estimate is subject to error. To account for this error, the difference between the 97.5th and 2.5th percentile estimates is a useful statistic. This range provides the observer with 95 percent probabilistic confidence of bracketing the true bias that exists for the method and data removal interval. A narrow range for this statistic provides better assurance that the observed median bias is the true median bias for the condition.
Results The full results of the analysis are provided in a separate document entitled “Assessing Accuracy Issues with Current Known Methods in AADT Estimation from Continuous Traffic Monitoring Data – Supplemental Tables and Figures”. The tables in that document are organized in groupings of three, with the first table in each grouping showing national level, volume range level, and functional class level results. The second table is comprised of state level results. The third table in each grouping is results for the 496 individual stations. There are eight groupings, one for each of the data removal scenarios evaluated (1 day, 3 days, 7 days, 14 days, all but 7 days in a month; 30 days, 60 days continuous, and 2, 30 days blocks). This accounts for a total of 24 tables of results.
Within each table, the results in each row of the table apply to one aggregation of permanent traffic count stations (national, volume range, functional classification, state, or station). The reported values in each row consist of the mean bias, standard deviation of bias, 2.5th percentile of percent bias, median percent bias, and 97.5th percentile of percent bias for each of the four AADT estimation methods, as compared to the known true AADT for that aggregation.
The tables of results are followed by a series of 19 figures that provide graphical presentations of the results. In the first 17 figures, the median percent bias and corresponding 95 percent confidence bounds (as defined by the 2.5th and 97.5th percentile points in the tables) are plotted across the four AADT calculation methods in each of the data removal scenarios. The figures are ordered by level of data aggregation starting with the national results (A-1), the volume range results (A-2 through A-5), and the functional classification results (A-6 through A-17). By comparing the width of the error bars about each AADT method within the same missing days scenario, a sense of the relative accuracy of the AADT estimation methods can be gained. Additionally, the absolute impact in accuracy associated with each level of missing data can be compared.
Figures A-18 and A-19 are special presentations of the results for removing 30 and 60 days, respectively, in a year across all 496 stations. Each plot shows the difference from true AADT as a function of a particular starting day of the year. The four AADT estimation methods are each represented by a different color.
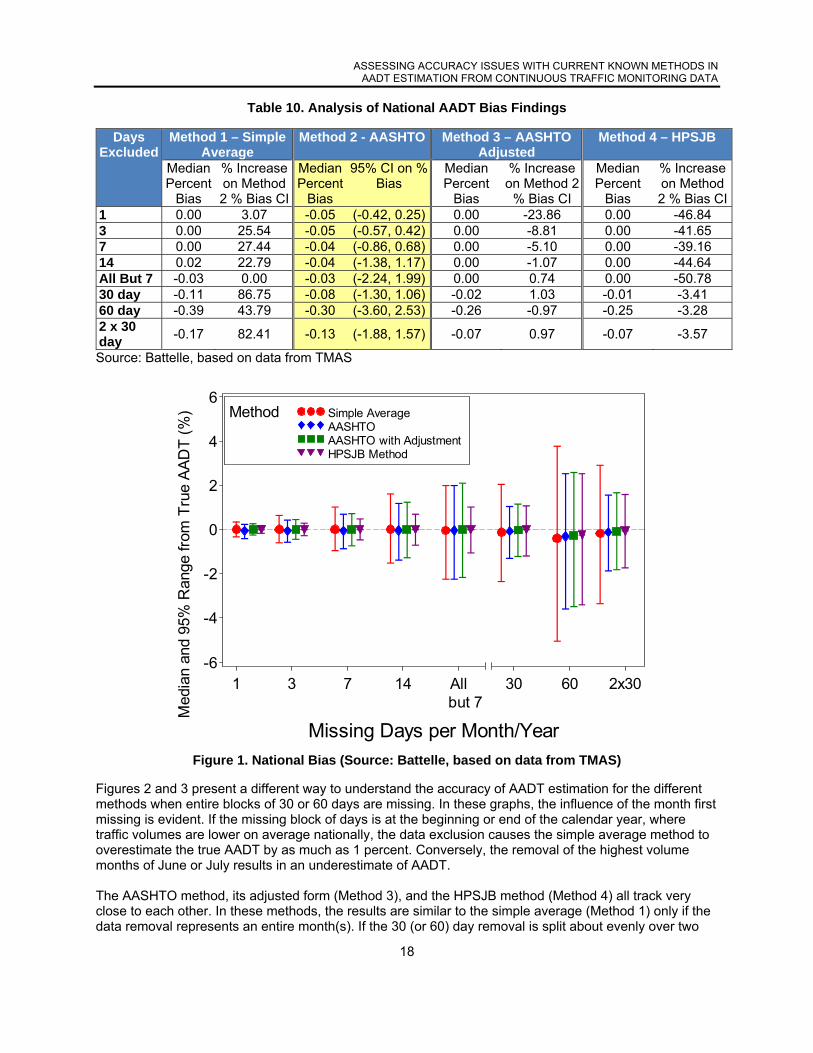
Discussion Table 10 presents an extract and calculation of the national level results (derived from Table A-1, A-4, A-7, A-10, A-13, A-16, A-19, and A-22 that are found within a separate document entitled “Assessing Accuracy Issues with Current Known Methods in AADT Estimation from Continuous Traffic Monitoring Data – Supplemental Tables and Figures”). This subset of the national results is evaluated to compare the accuracy of the different AADT methods. For this table, the AASHTO method (Method 2) is selected as the baseline since it is the method in most common use. Its results are highlighted in yellow. The median percent bias and the 95% confidence interval for this median percent bias are shown for each of the data exclusion scenarios. It is immediately apparent that there is a small, but repeatable bias for the AASHTO method. As indicated earlier, this is due to the fact that this method calculates volume for each day of the week within each month, but then does not weight the subsequent results by the number of times each day of the week appears within each month, or by the number of days in each month. The resulting estimated AADT only underestimates volume by a few hundredths of a percent. The 95 percent confidence interval on the percent bias for the AASHTO method increases as the amount of missing data

ASSESSING ACCURACY ISSUES WITH CURRENT KNOWN METHODS IN
AADT ESTIMATION FROM CONTINUOUS TRAFFIC MONITORING DATA
17
increases. With only one day missing per month, the AASHTO AADT is accurate to within +0.25 to -0.42 percent, 95 percent of the time. By the time the missing data has increased to the most extreme amount possible (i.e., all but 7 days missing (one of each day of week) within each month), the bias in estimating AADT from the remaining data using the AASHTO method has expanded to +1.99 to -2.24 percent with 95 percent confidence. When extending to the 30 or 60 day blocks of missing data, the effects of missing data are most pronounced at 60 continuous days where the resulting AADT estimate by the AASHTO method can vary +2.53 to -3.60 percent relative to the true AADT.
When looking at the results for the other three methods, the random removal of days provides little bias on median compared to the true AADT. This is due to all of Method 1, Method 3, and Method 4 weighting (either explicitly as in the case of Method 3 and 4, or implicitly, as in the case of Method 1) their AADT calculation by the number of each day of week within each month, and the number of days of each month within the year. Hence, from a bias perspective, any of Methods 1, 3, or 4 are superior to the AASHTO method. Importantly, though, the differences are very small.
The bigger impact of the alternative methods of AADT calculation, though, are for the precision of bias estimation. This result is best seen as a percent increase or decrease in the width of the 95 percent confidence interval around the percent bias for each method compared to the AASHTO method. Looking at Figure 1, this is equivalent to comparing the overall width of the error bars for each AADT method to each other. In Method 1, the simple average does not take advantage of the day of week information like the AASHTO, and hence its percent bias interval is 3.07 percent larger than that of the AASHTO method with 1 day of data randomly excluded per month. For larger numbers of days missing, the simple average variability jumps to about 25 percent larger than that of the AASHTO. This is a strong indication of the original utility of the AASHTO method. From Table 10, for sampling all but 7 days per month (one of each day of week), the simple average reverts to being identical to the AASHTO and the difference between confidence interval widths is zero, because both methods are estimating at exactly one of each day of week within each month.
The incorporation of day of week within month and days per month adjustments to the AASHTO method (Method 3) results in less variability, but the impact diminishes as the number of missing days gets larger. The real difference among the tested methods is Method 4, using the hourly traffic volumes as well as day of the week. This method improves the confidence interval widths anywhere from 39 to 50 percent. In the largest data removal scenario (all but 7 days retained per month), this equates to a reduction in uncertainty from +1.99 to -2.24 percent to +1.03 to -1.05. In other words, the AADT estimates for the HPSJB method would be 50% more accurate than those of the AASHTO method. This clearly illustrates the value of including the data for individual hours of the day even if entire days are not available.
When the data are not missing at random within each month, but are missing in entire blocks of 30 or 60 days, the results are somewhat different. First, all four methods show some non-zero level of median bias relative to the true AADT, ranging up to 0.39% for the 60 days missing in a continuous block. The median levels are similar between methods. The variability of the accuracy of the simple method is now even larger than that of the AASHTO. However, neither Method 3 nor Method 4 show an appreciable reduction in the variability of the bias. This suggests that these methods, while not any worse than AASHTO, nevertheless do not produce an improved accuracy of measuring AADT when entire monthly blocks of data are missing.
ASSESSING ACCURACY ISSUES WITH CURRENT KNOWN METHODS IN
AADT ESTIMATION FROM CONTINUOUS TRAFFIC MONITORING DATA
18
Table 10. Analysis of National AADT Bias Findings
Days Excluded
Method 1 – Simple Average
Method 2 - AASHTO Method 3 – AASHTO Adjusted
Method 4 – HPSJB
Median Percent
Bias
% Increase on Method 2 % Bias CI
Median Percent
Bias
95% CI on %Bias
Median Percent
Bias
% Increase on Method 2
% Bias CI
Median Percent
Bias
% Increase on Method 2 % Bias CI
1 0.00 3.07 -0.05 (-0.42, 0.25) 0.00 -23.86 0.00 -46.84 3 0.00 25.54 -0.05 (-0.57, 0.42) 0.00 -8.81 0.00 -41.65 7 0.00 27.44 -0.04 (-0.86, 0.68) 0.00 -5.10 0.00 -39.16 14 0.02 22.79 -0.04 (-1.38, 1.17) 0.00 -1.07 0.00 -44.64 All But 7 -0.03 0.00 -0.03 (-2.24, 1.99) 0.00 0.74 0.00 -50.78 30 day -0.11 86.75 -0.08 (-1.30, 1.06) -0.02 1.03 -0.01 -3.41 60 day -0.39 43.79 -0.30 (-3.60, 2.53) -0.26 -0.97 -0.25 -3.28 2 x 30 day
-0.17 82.41 -0.13 (-1.88, 1.57) -0.07 0.97 -0.07 -3.57
Source: Battelle, based on data from TMAS
Figure 1. National Bias (Source: Battelle, based on data from TMAS)
Figures 2 and 3 present a different way to understand the accuracy of AADT estimation for the different methods when entire blocks of 30 or 60 days are missing. In these graphs, the influence of the month first missing is evident. If the missing block of days is at the beginning or end of the calendar year, where traffic volumes are lower on average nationally, the data exclusion causes the simple average method to overestimate the true AADT by as much as 1 percent. Conversely, the removal of the highest volume months of June or July results in an underestimate of AADT. The AASHTO method, its adjusted form (Method 3), and the HPSJB method (Method 4) all track very close to each other. In these methods, the results are similar to the simple average (Method 1) only if the data removal represents an entire month(s). If the 30 (or 60) day removal is split about evenly over two
Med
ian
and
95%
Ran
ge fr
om T
rue
AA
DT
(%
)
-6
-4
-2
0
2
4
6
Missing Days per Month/Year
1 3 7 14 Allbut 7
30 60 2x30
Method Simple AverageAASHTOAASHTO with AdjustmentHPSJB Method

ASSESSING ACCURACY ISSUES WITH CURRENT KNOWN METHODS IN
AADT ESTIMATION FROM CONTINUOUS TRAFFIC MONITORING DATA
19
(or the first and last of three) months, these methods can successfully adjust for the missing data in each of the months and still get a fairly accurate AADT. The 60 day removal will always have an entire calendar month missing, which is why the Method 2, 3, and 4 bias results do not return to zero in the middle of the starting month of removal except for the two seasonal months that are closest to the yearly volume average (April and October). In the 30 and 60 day removal scenarios, the only element of random removal is on the first and last days of the period. Unlike the other data removal scenarios (e.g., 1, 3, 7, 14, and all but 7), there are not large numbers of days with chunks of hours retained. As such, the 30 and 60 day removal scenarios provide no basis for improved estimation under the HPSJB method (Method 4).
Figure 2. Bias with 30 Days of Data Removed (Source: Battelle, based on data from TMAS)
%D
iffer
ence
from
Tru
e A
AD
T
-1.0
-0.5
0.0
0.5
1.0
1.5
Starting Day of Missing 30 Days
01JAN 01FEB 01MAR 01APR 01MAY 01JUN 01JUL 01AUG 01SEP 01OCT 01NOV 01DEC
Method Simple AverageAASHTOAASHTO with AdjustmentHPSJB Method

ASSESSING ACCURACY ISSUES WITH CURRENT KNOWN METHODS IN
AADT ESTIMATION FROM CONTINUOUS TRAFFIC MONITORING DATA
20
Figure 3. Bias with 60 Days of Data Removed (Source: Battelle, based on data from TMAS)
%D
iffer
ence
from
Tru
e A
AD
T
-1.5
-1.0
-0.5
0.0
0.5
1.0
1.5
2.0
Starting Day of Missing 60 Days
01JAN 01FEB 01MAR 01APR 01MAY 01JUN 01JUL 01AUG 01SEP 01OCT 01NOV
Method Simple AverageAASHTOAASHTO with AdjustmentHPSJB Method

U.S. Department of Transportation Federal Highway Administration Office of Highway Policy Information 1200 New Jersey Ave., SE Washington, D.C. 20590 https://www.fhwa.dot.gov/policyinformation November 2014 FHWA-PL-015-008