2014 annual report on roadway traffic congestion in the denver … annual traffic... · 2014 annual...
TRANSCRIPT

2014 Annual Report on Roadway Traffic
Congestion in the Denver Region
DENVER REGIONAL COUNCIL OF GOVERNMENTS
We make life better!
October 2015

Visit our partner agency websites for more information:
Colorado Department of Transportation www.coloradodot.info Regional Transportation District www.rtd-denver.com Traveler Information www.cotrip.org
For ways to avoid or adapt to congestion via mobility options please visit:
Way to Go http://waytogo.org
Preparation of this report has been financed in part through grants from the U.S. Department of Transportation, Federal Highway Administration and Federal Transit Administration. This report and others are available at the DRCOG Congestion Mitigation webpage at: http://drcog.org//node/178.
Contact Robert Spotts, Senior Transportation/Air Quality Planner, at [email protected] for additional information regarding DRCOG’s Congestion Mitigation Program.
The 3-A’s of Congestion Mitigation
Interesting Videos on Traffic Congestion The Phantom Traffic Jam – an explanation https://www.youtube.com/watch?v=goVjVVaLe10 Traffic Waves https://www.youtube.com/watch?v=19S3OdK6710

1
2014 Annual Report on Roadway Traffic Congestion in the Denver Region October 9, 2015
1. Introduction The Denver Regional Council of Governments has prepared annual reports on traffic congestion since 2006. Since that time, several trends have emerged:
Overall traffic has grown slightly; but at a rate less than population and employment growth.
Miles driven per person has decreased slightly.
Traffic congestion is a little worse across the region, though some specific locations are experiencing either much greater or even less congestion.
More transit options are available to help people avoid driving in severe congestion and there is greater popularity and opportunities to walk, bicycle, or carpool to places.
There is much greater access to real-time information on traffic conditions, major incidents, and travel options to avoid driving alone.
On one hand, traffic congestion can have a negative impact on attracting or retaining many types of businesses and economic activity. On the other hand, congestion can also be a sign of a strong economy. Large urban areas like the Denver region are vibrant places offering a variety of employment and recreation opportunities. Therefore some traffic congestion at some points in time is inevitable.
2. How much do we travel on a typical day? (Trends in VMT – Vehicle Miles of Travel) People travel nearly 110 million person-miles in the Denver region every weekday. Travel occurs behind the wheel, on foot, in wheelchairs, as a passenger, on a bicycle, and in other ways. Motor vehicle drivers (cars, trucks, buses, ambulances, delivery vans, etc.) make up 75% of the miles traveled, or about 75 million VMT per day. In addition to transporting people, goods, raw materials and services, those vehicles also burn almost 4 million gallons of petroleum fuel, and cause over 170 traffic crashes per day. Figure 1 depicts average weekday VMT for the entire Denver region over the past 14 years. The solid blue line shows that total daily VMT rose steadily through 2006, flattened out through 2011, but has increased in the past three years. Economic and population growth combined with lower fuel costs likely played a role in the recent increase. Factoring in population growth however, shows VMT per capita has actually decreased slightly since its peak in 2006.
Figure 1
2
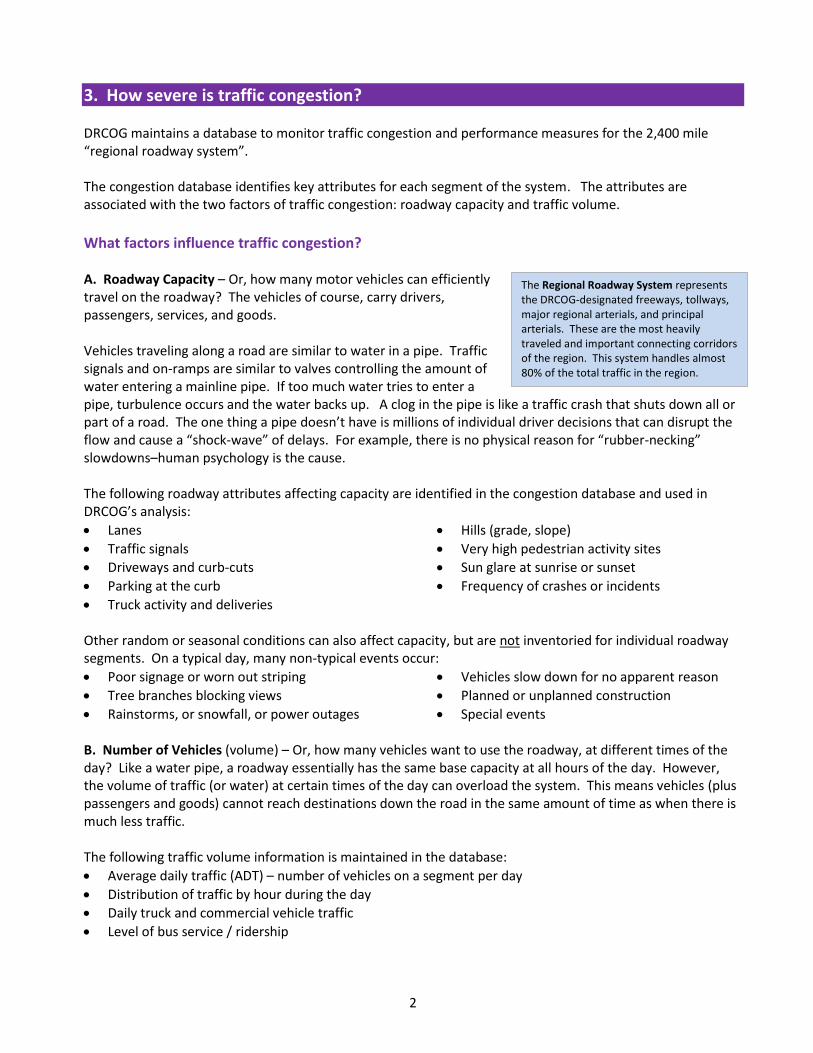
The Regional Roadway System represents the DRCOG-designated freeways, tollways, major regional arterials, and principal arterials. These are the most heavily traveled and important connecting corridors of the region. This system handles almost 80% of the total traffic in the region.
3. How severe is traffic congestion? DRCOG maintains a database to monitor traffic congestion and performance measures for the 2,400 mile “regional roadway system”. The congestion database identifies key attributes for each segment of the system. The attributes are associated with the two factors of traffic congestion: roadway capacity and traffic volume.
What factors influence traffic congestion? A. Roadway Capacity – Or, how many motor vehicles can efficiently travel on the roadway? The vehicles of course, carry drivers, passengers, services, and goods. Vehicles traveling along a road are similar to water in a pipe. Traffic signals and on-ramps are similar to valves controlling the amount of water entering a mainline pipe. If too much water tries to enter a pipe, turbulence occurs and the water backs up. A clog in the pipe is like a traffic crash that shuts down all or part of a road. The one thing a pipe doesn’t have is millions of individual driver decisions that can disrupt the flow and cause a “shock-wave” of delays. For example, there is no physical reason for “rubber-necking” slowdowns–human psychology is the cause. The following roadway attributes affecting capacity are identified in the congestion database and used in DRCOG’s analysis:
Lanes
Traffic signals
Driveways and curb-cuts
Parking at the curb
Truck activity and deliveries
Hills (grade, slope)
Very high pedestrian activity sites
Sun glare at sunrise or sunset
Frequency of crashes or incidents
Other random or seasonal conditions can also affect capacity, but are not inventoried for individual roadway segments. On a typical day, many non-typical events occur:
Poor signage or worn out striping
Tree branches blocking views
Rainstorms, or snowfall, or power outages
Vehicles slow down for no apparent reason
Planned or unplanned construction
Special events B. Number of Vehicles (volume) – Or, how many vehicles want to use the roadway, at different times of the day? Like a water pipe, a roadway essentially has the same base capacity at all hours of the day. However, the volume of traffic (or water) at certain times of the day can overload the system. This means vehicles (plus passengers and goods) cannot reach destinations down the road in the same amount of time as when there is much less traffic. The following traffic volume information is maintained in the database:
Average daily traffic (ADT) – number of vehicles on a segment per day
Distribution of traffic by hour during the day
Daily truck and commercial vehicle traffic
Level of bus service / ridership

2
Types of Congestion Measures Traffic congestion is reflected in different ways. DRCOG calculates measures of the Regional Roadway System (see Figure 2 and Table 1) for several situations:
Duration “THE ROAD IN FRONT OF MY BUSINESS WAS CONGESTED FOR MORE THAN 5 HOURS YESTERDAY!” 2014 DATA: 21% of regional roadways were severely congested for 3 or more
hours per day
2040 ESTIMATE: 31%
Severity “I WAS STOPPED IN TRAFFIC FOR AT LEAST HALF OF MY DRIVE HOME LAST NIGHT!” 2014 DATA: 16% of vehicular travel occurred in congested conditions (14% of all
person trips)
2040 ESTIMATE: 28%
Magnitude “THERE WERE THOUSANDS OF CARS STUCK IN TRAFFIC. WE ALL WASTED SO MUCH TIME!” 2014 Data: People were delayed a total of over 280,000 total hours per day.
2040 ESTIMATE: 720,000
Variation “I HAVE TO DRIVE MY SON TO A SOCCER GAME RIGHT DURING RUSH HOUR TODAY. IT’S GOING TO
TAKE A LOT LONGER THAN ON SATURDAY!” 2014 DATA: The average rush hour trip took 22% longer than in the off-peak.
2040 ESTIMATE: 36%
Reliability “ANOTHER CRASH SHUT DOWN THE ROAD, AND I COULDN’T MAKE MY DELIVERY IN TIME!” 2014 DATA: An average of 130 reported crashes occur every day on the regional
roadway system (+ ~100 other traffic disrupting incidents such as break-downs, unreported fender-benders, visual distractions, work zones, etc.).

3
4
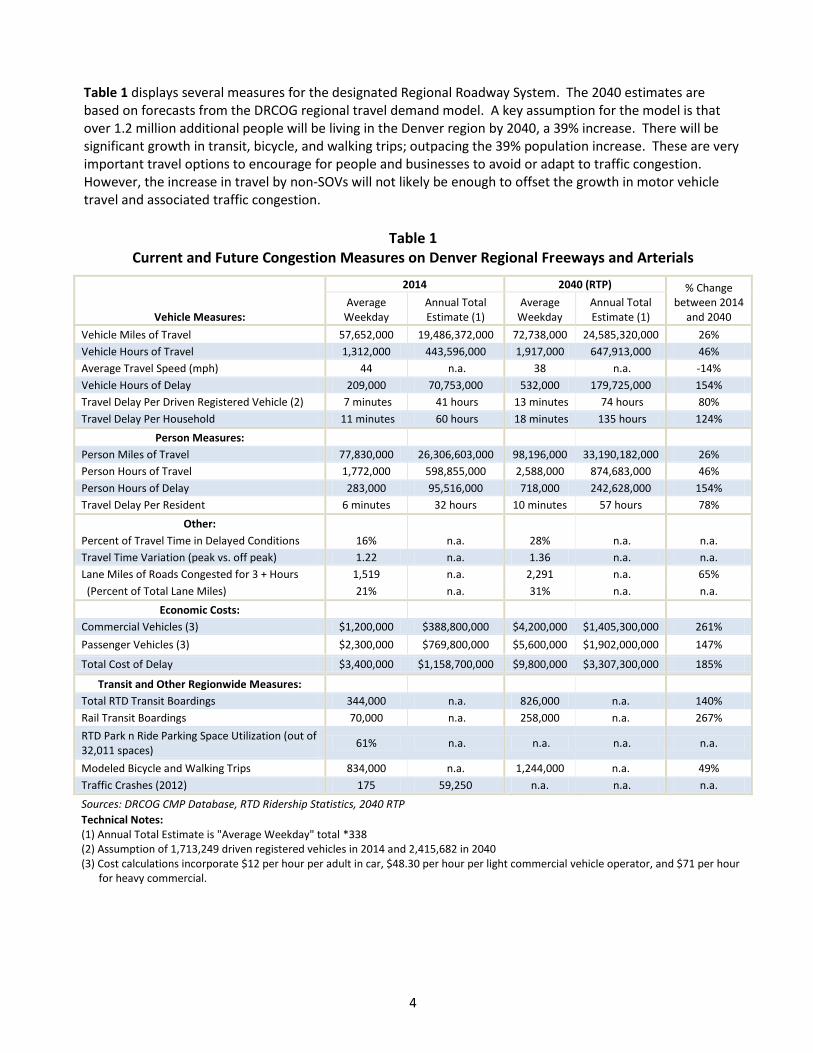
Table 1 displays several measures for the designated Regional Roadway System. The 2040 estimates are based on forecasts from the DRCOG regional travel demand model. A key assumption for the model is that over 1.2 million additional people will be living in the Denver region by 2040, a 39% increase. There will be significant growth in transit, bicycle, and walking trips; outpacing the 39% population increase. These are very important travel options to encourage for people and businesses to avoid or adapt to traffic congestion. However, the increase in travel by non-SOVs will not likely be enough to offset the growth in motor vehicle travel and associated traffic congestion.
Table 1
Current and Future Congestion Measures on Denver Regional Freeways and Arterials
Vehicle Measures:
2014 2040 (RTP) % Change between 2014
and 2040 Average
Weekday Annual Total Estimate (1)
Average Weekday
Annual Total Estimate (1)
Vehicle Miles of Travel 57,652,000 19,486,372,000 72,738,000 24,585,320,000 26%
Vehicle Hours of Travel 1,312,000 443,596,000 1,917,000 647,913,000 46%
Average Travel Speed (mph) 44 n.a. 38 n.a. -14%
Vehicle Hours of Delay 209,000 70,753,000 532,000 179,725,000 154%
Travel Delay Per Driven Registered Vehicle (2) 7 minutes 41 hours 13 minutes 74 hours 80%
Travel Delay Per Household 11 minutes 60 hours 18 minutes 135 hours 124%
Person Measures:
Person Miles of Travel 77,830,000 26,306,603,000 98,196,000 33,190,182,000 26%
Person Hours of Travel 1,772,000 598,855,000 2,588,000 874,683,000 46%
Person Hours of Delay 283,000 95,516,000 718,000 242,628,000 154%
Travel Delay Per Resident 6 minutes 32 hours 10 minutes 57 hours 78%
Other:
Percent of Travel Time in Delayed Conditions 16% n.a. 28% n.a. n.a.
Travel Time Variation (peak vs. off peak) 1.22 n.a. 1.36 n.a. n.a.
Lane Miles of Roads Congested for 3 + Hours 1,519 n.a. 2,291 n.a. 65%
(Percent of Total Lane Miles) 21% n.a. 31% n.a. n.a.
Economic Costs:
Commercial Vehicles (3) $1,200,000 $388,800,000 $4,200,000 $1,405,300,000 261%
Passenger Vehicles (3) $2,300,000 $769,800,000 $5,600,000 $1,902,000,000 147%
Total Cost of Delay $3,400,000 $1,158,700,000 $9,800,000 $3,307,300,000 185%
Transit and Other Regionwide Measures:
Total RTD Transit Boardings 344,000 n.a. 826,000 n.a. 140%
Rail Transit Boardings 70,000 n.a. 258,000 n.a. 267%
RTD Park n Ride Parking Space Utilization (out of 32,011 spaces)
61% n.a. n.a. n.a. n.a.
Modeled Bicycle and Walking Trips 834,000 n.a. 1,244,000 n.a. 49%
Traffic Crashes (2012) 175 59,250 n.a. n.a. n.a.
Sources: DRCOG CMP Database, RTD Ridership Statistics, 2040 RTP
Technical Notes:
(1) Annual Total Estimate is "Average Weekday" total *338
(2) Assumption of 1,713,249 driven registered vehicles in 2014 and 2,415,682 in 2040
(3) Cost calculations incorporate $12 per hour per adult in car, $48.30 per hour per light commercial vehicle operator, and $71 per hour for heavy commercial.

5
Time and Length of Congestion A key aspect of traffic is the time of day people will be traveling, today and in 2040. The majority of severe traffic congestion today occurs during the weekday morning and afternoon rush hours. The rush “hour” time period is forecast to expand significantly in the future. The DRCOG model results shown in Figure 3 forecast the period from 2:00 to 4:00 p.m. in 2040 to have as much traffic as from 4:00 to 6:00 p.m. today. Therefore, it is very important that transportation partners in the region work to reduce mid-day crashes, incidents, and their impacts. As traffic increases in mid-hours of the day, there will be less time available for traffic back-ups (queues) to clear out before the busiest rush-hours. The average clearance time to move crashed vehicles off the road and out of sight must be improved.
Figure 3
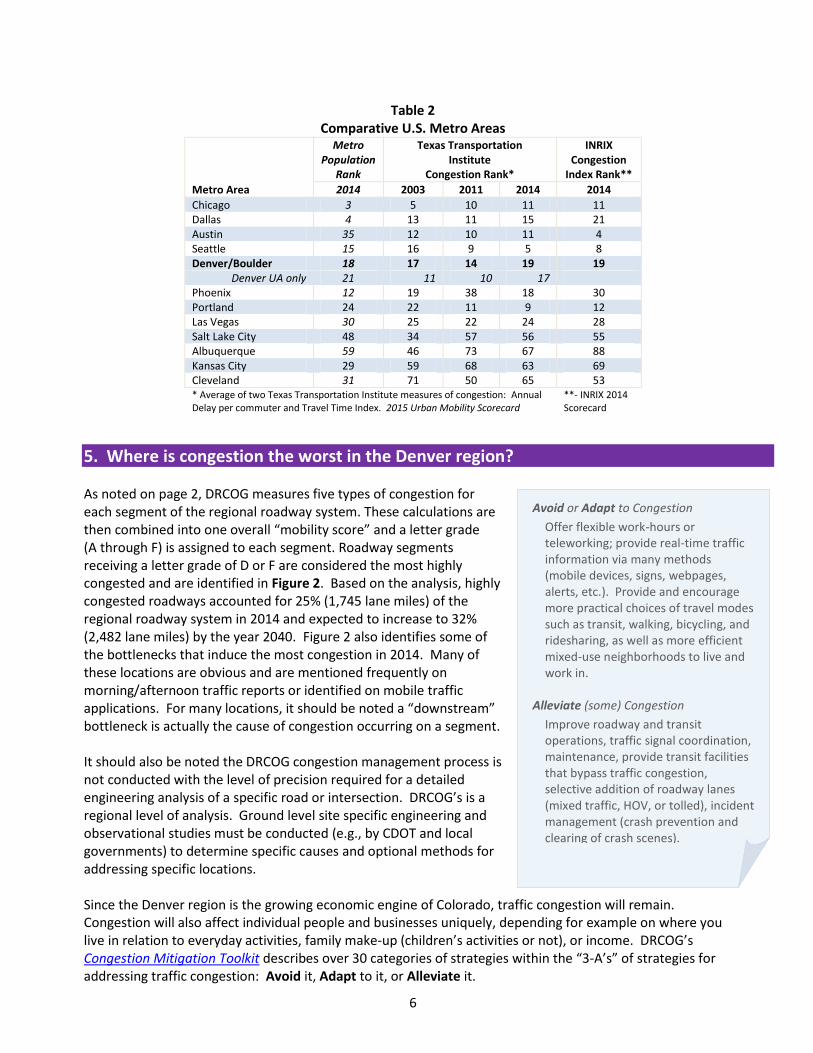
4. How does the Denver region compare to other metro areas? Traffic congestion affects metropolitan areas across the country to varying degrees. There are many types of congestion measures used to rank metropolitan areas. DRCOG staff calculated the average of the two most common (annual hours of delay and peak hour travel time index) measures referenced in the Urban Mobility Scorecard prepared by the Texas Transportation Institute. Table 2 shows the combined Denver/Aurora/Boulder “urbanized area” ranked about 19th worse in congestion in 2014. The values are not precise. A small change in a measure’s value can cause a ranking to shift three to four spots. Denver’s ranking did not change much between 2003 and 2014. Noticeable are the distinctly worse ranks of the Seattle and Portland areas, two key economic competitors with Denver. Another source of comparative congestion data is produced by the company INRIX. INRIX uses a comprehensive dataset retrieved from cars, cell phones and other devices that move along the nation’s roadways. Data is obtained on speeds, delays, back-ups and other variables for several million miles of roadways, every day of the year. Thus, in addition to routine travel delays, it also incorporates delays induced by crashes, incidents, construction, and bad weather. A scorecard is produced annually by INRIX with comparative results for areas around the United States. For the overall congestion index, again the Denver region ranked 19th worse in 2014. Noticeable again were Seattle, Portland, and Austin, whose congestion rank was worse than their population rank might indicate. For individual freeways reported by INRIX, the segment of I-25 from Colorado Boulevard to 84th Avenue just cracked the top 100 list of most severely congested freeways in the country in 2014.
6
Avoid or Adapt to Congestion
Offer flexible work-hours or teleworking; provide real-time traffic information via many methods (mobile devices, signs, webpages, alerts, etc.). Provide and encourage more practical choices of travel modes such as transit, walking, bicycling, and ridesharing, as well as more efficient mixed-use neighborhoods to live and work in.
Alleviate (some) Congestion
Improve roadway and transit operations, traffic signal coordination, maintenance, provide transit facilities that bypass traffic congestion, selective addition of roadway lanes (mixed traffic, HOV, or tolled), incident management (crash prevention and clearing of crash scenes).
Table 2 Comparative U.S. Metro Areas
Metro Area
Metro Population
Rank
Texas Transportation Institute
Congestion Rank*
INRIX Congestion
Index Rank**
2014 2003 2011 2014 2014
Chicago 3 5 10 11 11 Dallas 4 13 11 15 21 Austin 35 12 10 11 4 Seattle 15 16 9 5 8 Denver/Boulder 18 17 14 19 19
Denver UA only 21 11 10 17 Phoenix 12 19 38 18 30 Portland 24 22 11 9 12 Las Vegas 30 25 22 24 28 Salt Lake City 48 34 57 56 55 Albuquerque 59 46 73 67 88 Kansas City 29 59 68 63 69 Cleveland 31 71 50 65 53 * Average of two Texas Transportation Institute measures of congestion: Annual Delay per commuter and Travel Time Index. 2015 Urban Mobility Scorecard
**- INRIX 2014 Scorecard
5. Where is congestion the worst in the Denver region? As noted on page 2, DRCOG measures five types of congestion for each segment of the regional roadway system. These calculations are then combined into one overall “mobility score” and a letter grade (A through F) is assigned to each segment. Roadway segments receiving a letter grade of D or F are considered the most highly congested and are identified in Figure 2. Based on the analysis, highly congested roadways accounted for 25% (1,745 lane miles) of the regional roadway system in 2014 and expected to increase to 32% (2,482 lane miles) by the year 2040. Figure 2 also identifies some of the bottlenecks that induce the most congestion in 2014. Many of these locations are obvious and are mentioned frequently on morning/afternoon traffic reports or identified on mobile traffic applications. For many locations, it should be noted a “downstream” bottleneck is actually the cause of congestion occurring on a segment. It should also be noted the DRCOG congestion management process is not conducted with the level of precision required for a detailed engineering analysis of a specific road or intersection. DRCOG’s is a regional level of analysis. Ground level site specific engineering and observational studies must be conducted (e.g., by CDOT and local governments) to determine specific causes and optional methods for addressing specific locations. Since the Denver region is the growing economic engine of Colorado, traffic congestion will remain. Congestion will also affect individual people and businesses uniquely, depending for example on where you live in relation to everyday activities, family make-up (children’s activities or not), or income. DRCOG’s Congestion Mitigation Toolkit describes over 30 categories of strategies within the “3-A’s” of strategies for addressing traffic congestion: Avoid it, Adapt to it, or Alleviate it.

7
6. CMP Transportation Projects Recently Completed or Underway Several important congestion relief projects have been completed by local governments, CDOT, and RTD in the past year or are underway, as shown in Table 3. Transit and bicycle/pedestrian projects provide optional modes of travel for many people avoid congestion.
Table 3 Example Transportation Projects Addressing Congestion and Mobility
Interchange/Roadway Projects: Status Reconstruct Colfax Avenue @ I-225 interchange Completed Widen I-225 from Mississippi Avenue to Parker Road Completed Widen I-70 Twin Tunnels east of Idaho Springs Completed 120
th Avenue Bridge extension from US-36 to US-287/Vance Street Underway
Extend Central Park Boulevard from 47th
Avenue to 56th
Avenue Underway Peak period shoulder managed lane: I-70 eastbound Clear Cr. Co. Underway Add managed lanes/BRT to US-36 from Boulder to I-25 Underway Add managed lanes to I-25 from US-36 to 120
th Avenue Underway
Reconfigure ramps on US-6 Freeway from Federal Blvd. to I-25 Underway Widen I-25 from Ridgegate Parkway to C-470/County Line Road Underway
Rapid Transit Projects: Status
Denver Union Station (DUS) Completed I-225 Corridor: (9 Mile/Parker Road to Peoria/Smith) light rail Underway Gold Line (Ward Road to DUS) commuter rail Underway Northwest Corridor (Westminster to DUS) commuter rail Underway East Rail Line (DUS to DIA) commuter rail Underway North Metro Rail Line (DUS to 124
th-Eastlake) commuter rail Underway
Bicycle/Pedestrian Projects: Status
West Light Rail Golden Pedestrian & Bicycle overpass of US-6 Completed Quebec Avenue Bicycle & Pedestrian overpass of C-470 Completed Tollgate Creek Trail connection (north of Mississippi Avenue) Completed Longmont Diagonal/Airport Road underpass Completed US-36 Bikeway Completed Kipling Avenue Multi-use Path (32
nd Avenue to 44
th Avenue) Underway
Pearl Parkway Multi-use Path (30th
Street to Foothills Parkway) Underway 38
th/Blake Street Station area pedestrian access improvements Underway
I-70 Eastbound Twin Tunnels Quebec Avenue Overpass of C-470

Denver Regional Council of Governments1290 Broadway, Suite 700Denver, CO 80203-5606
www.drcog.org - 303-455-1000
DENVER REGIONAL COUNCIL OF GOVERNMENTS
We make life better!
2014 Annual Report on Roadway Traffic Congestion in the Denver Region
October 2015