asia pacific equity research 24 january 2011 top...
TRANSCRIPT

Asia Pacific Equity Research
24 January 2011
Top Stories MediaTek Inc. (OW), Taiwan Top turnaround story among large-cap tech – buy on 1Q trough (Alvin Kwock) While Mediatek is likely to see a meaningful earnings decline for FY11, multiple signs suggest 1Q will mark the trough. Notably, the new-product launch schedule has been smoother than the past, and in some cases there is even a schedule pull-in – the new management team seems to be executing quite well.
CapitaLand (OW), Singapore We reduce our PT to S$4.60, but stay Overweight (Christopher Gee, CFA) Due to an enlarged capital base, the stock has underperformed its relevant benchmark indices in the past 18 months. For this to reverse, we believe the group would need to lift its ROE above the past eight-year average of 10% and carry this positive ROE growth trajectory forwards; we estimate an FY11E ROE of 9.4%.
CapitaMalls Asia (OW), Singapore At the heel of the hockey stick – price target raised to S$2.75 (Joy Wang) While we still see near-term headwinds, with the stock trading at a 15% discount to our estimated tangible asset value and pricing in zero value for the group’s funds management business and for its platform, we see the current price as an attractive entry level. Added to our AFL, the stock is now one of our high-conviction OWs.
Doosan Corp (OW), South Korea New OW, with PT of W190,000 implying 22% upside (Youna Kim) We expect to see a strong revenue growth in Doosan’s own operations along with higher OPM, an upward revision in the market’s valuation of DIP Holdings, and better equity-method gains on stronger earnings visibility of its major subsidiary. It was the second best performing holding company in 2010, rallying 57% vs. KOSPI.
LG Display (OW), South Korea Cost-reduction efforts and earnings momentum to be key catalysts (JJ Park) Due to the delay in panel price recovery, LGD’s stock has underperformed YTD. Although it is likely to post another loss in 1Q11, aggressive cost reduction efforts and panel-demand recovery along with panel price stabilization from 2Q11 should drive strong earnings momentum. We reiterate our Dec-11 price target of W52,000.
Sunil Garg (852) 2800-8518 [email protected] Send me your feedback! AM perspective Adrian Mowat, Chief Equity Strategist Overheating is a risk in China
Source: Bloomberg, 20 January 2011.
A decline in China’s December CPI is a temporary reversal in trend. We advise reducing China exposure into any rally. Look for slower growth and a sustained decline in inflation to end the 17-month bear market in A-shares. But lower growth probably requires further policy tightening. We continue to view higher inflation and secular changes in China as ultimately negative for the commodity demand. If China moves from an investment-driven model, then the growth in its demand for commodities is overestimated. But structural changes are very difficult to time. Wait for policy tightening, combined with a breakdown in commodity prices, before moving significantly underweight. For more, please see Key Trades and Risks – Emerging Markets Equity Strategy, Mowat et al, 17 January 2011

Click below for the: J.P. Morgan Daily Valuations Latest Weekly AP Banks Analyzer (.xls) Daily Global Economic Briefing
Link to Other FTMs page Link to Morgan Markets page
See the end pages of each individual note for analyst certification and important disclosures, including non-US analyst disclosures. J.P. Morgan does and seeks to do business with companies covered in its research reports. As a result, investors should be aware that the firm may have a conflict of interest that could affect the objectivity of this report. Investors should consider this report as only a single factor in making their investment decision.
Recommendation and Forecast Changes CapitaLand (Overweight), Singapore (Christopher Gee,
CFA) Markers for the next decade
CapitaMalls Asia (Overweight), Singapore (Joy Wang) At the heel of the hockey stick
Doosan Corp (Overweight), South Korea (Youna Kim)
Growth with value
Hyundai Mobis (Overweight), South Korea (Wan Sun Park)
4Q10 preview: surpassing OEMs' growth. Raise PT to W370,000
JSW Energy Ltd. (Neutral), India (Shilpa Krishnan) Higher fuel costs and execution delays result in earnings cut
LG Display (Overweight), South Korea (JJ Park) Cost-reduction efforts and earnings momentum to be key catalysts
Reliance Industries Ltd (Overweight), India (Pradeep
Mirchandani, CFA) Steady 3Q, but no clarity on E&P ramp-up
Strategy Market Strategy, Global (Adrian Mowat)
Herd Instinct: Key Emerging Markets and Developed Asia Fund Flow Weekly, 13 January – 19 January 2011
Market Strategy, TIPV Markets (Sriyan Pietersz) Vietnam Strategy Update: CP Congress sets stage for post-Tet signals on policy
Economics Economy, Malaysia (Matt Hildebrandt)
Looking for a tightening signal at BNM’s meeting Thursday
Results and Company Views Bank of Ayudhya (Overweight), TIPV Markets (Anne
Jirajariyavech) Results slightly below expected on lower non-NII: loan growth & NIM above expectation
Bangkok Bank (Neutral), TIPV Markets (Anne
Jirajariyavech) NP in-line; strong loan growth in Dec10
Bank of India (Overweight), India (Adarsh Parasrampuria)
Strong improvement in asset quality
China Railway Construction Corporation Limited (Overweight), China (Karen Li, CFA) Improved protection for minority shareholder may help shift focus back to fundamentals and attractive valuation - ALERT
Dish TV (Overweight), India (Princy Singh) Strong sub additions and ARPU expansion continue
HTC Corp (Overweight), Taiwan (Laura Chen) Set to take off
Hyundai Motor Company (Overweight), South Korea (Wan Sun Park) 4Q10 preview: mix improvement and strong equity method gain
ITC Limited (Overweight), India (Latika Chopra, CFA) Q3FY11 : strong quarter; encouraging cigarette volume growth trends
Mapletree Logistics Trust (Neutral), Singapore (Joy
Wang) FY10 results review - better growth
Neowiz Games Corp. (Overweight), South Korea (Sungmin Chang, CFA) Lawsuit result is slightly positive - ALERT
Punjab National Bank (Overweight), India (Adarsh
Parasrampuria) 3Q11: NII growth strong, but asset quality disappoints
State Bank of India (Neutral), India (Seshadri K Sen,
CFA) Cheap, but high NPLs persist
Suntec REIT (Neutral), Singapore (Joy Wang) FY10 results review - carrying least office leasing risk
WCT Berhad (Overweight), Malaysia (Hoy Kit Mak) Warrant exercise price fixed at M$2.75 - ALERT
Sector Research Banks, TIPV Markets (Harsh Wardhan Modi)
Philippine Banks: Bond Yield Sell-Off to Lead the Unwind Conglomerates & Multi-industry, South Korea (Youna
Kim) Korea Holding Companies: Share price performance outlook and Valuation summary
Infrastructure, Asia Pacific (Karen Li, CFA) China tollroad sector: Limited impact from potential toll rate reform, and Class 2 government-funded highways turning toll free - ALERT
Integrated Oils, China (Brynjar Eirik Bustnes, CFA) China oil product marketing: China R&M margins strong in 4Q - Sinopec should benefit the most
Metals & Mining, India (Pinakin Parekh, CFA) The Lodestone: While scrap prices surge seems to be peaking out (for the time at least), HRC price surge continues
Mining, TIPV Markets (Stevanus Juanda) We view that export ban scare on low ranked coal is unfounded - ALERT

Asia Analyst Focus List Company Name Ticker Analyst Rating
Mkt. Cap (MM)
Mkt. Cap (US$ MM)
Focus List Add Date
Focus List Add Price
Close 01/20/11
Target Price
Date Target Price Set
Australia Campbell Brothers Limited (A$) CPB AU Alexander Mees, ACA OW 2697 2664 9-Sep-09 24.33 39.95 39.18 30-Nov-10 iiNet (A$) IIN AU Laurent Horrut OW 415 410 2-Aug-10 2.78 2.73 3.33 2-Aug-10 China Baoshan Iron & Steel – A (Rmb) 600019 CH Nathan M. Zibilich, CFA OW 114879 17443 12-Oct-10 7.11 6.56 10.00 12-Oct-10 China Cosco Holdings, Ltd. 1919 HK Corrine Png OW 114521 14705 11-Jan-11 8.63 9.04 11.80 29-Oct-10 China Minsheng Banking - A (Rmb) 600016 CH Samuel Chen OW 136009 20651 27-Nov-10 5.13 5.00 8.10 27-Nov-10 China Minsheng Banking - H (HK$) 1988 HK Samuel Chen OW 160825 20651 27-Nov-10 6.90 6.61 9.80 27-Nov-10 Industrial and Commercial Bank of China - A (Rmb) 601398 CH Samuel Chen OW 1538920 233665 30-Oct-09 4.95 4.22 6.70 27-Nov-10 Hong Kong AAC Acoustic (HK$) 2018 HK Charles Guo OW 24867 3193 8-Sep-09 6.91 20.25 22.00 2-Nov-10 China High Speed Transmission (HK$) 658 HK Boris Kan OW 16721 2147 6-May-10 18.42 12.16 24.30 6-May-10 China Unicom (Hong Kong) Limited (HK$) 762 HK Lucy Liu OW 290757 37335 2-Aug-10 10.22 12.34 12.90 1-Nov-10 Cosco Pacific (HK$) 1199 HK Karen Li OW 40510 5202 26-Aug-08 10.64 14.94 16.10 10-Nov-10 Geely Automobile Holdings Ltd. (HK$) 175 HK Frank Li OW 26340 3382 15-Oct-10 3.79 3.54 6.20 15-Oct-10 HSBC Holdings plc (HK$) 5 HK Sunil Garg OW 1529794 196437 24-May-10 71.65 86.40 115.00 22-Apr-10 K Wah International Holdings (HK$) 173 HK Amy Luk, CFA OW 8265 1061 13-Apr-10 2.98 3.24 3.80 25-Aug-10 Longfor Properties Co. Ltd. (HK$) 960 HK Ryan Li OW 63510 8155 18-Nov-10 9.44 12.32 13.50 18-Nov-10 Mongolian Mining Corporation (HK$) 975 HK Nathan M. Zibilich, CFA OW 38532 4948 15-Nov-10 8.68 10.40 11.45 9-Jan-11 Pacific Basin Shipping 2343 HK Corrine Png OW 9853 1265 11-Jan-11 5.01 5.10 7.00 3-Aug-10 Shenzhen Expressway H Share (HK$) 548 HK Karen Li, CFA OW 11306 1452 8-Sep-10 3.90 4.31 8.70 2-Dec-10 The United Laboratories (HK$) 3933 HK Leon Chik, CFA OW 16998 2183 5-Nov-10 15.52 13.06 24.00 7-Jan-11 Wheelock & Company Ltd (HK$) 20 HK Benjamin Lo, CFA OW 65832 8453 19-Nov-10 28.85 32.40 38.10 19-Nov-10 Zhejiang Expressway (HK$) 576 HK Karen Li, CFA OW 30966 3976 20-Apr-10 6.83 7.13 9.10 21-Nov-10 India Apollo Hospitals Enterprise Ltd. (Rs) APHS IN Princy Singh OW 59568 1306 5-Oct-10 463.15 477.65 575.00 5-Oct-10 Ballarpur Industries Ltd (Rs) BILT IN Princy Singh OW 22999 504 20-Oct-10 35.20 35.00 50.00 20-Oct-10 IndusInd Bank (Rs) IIB IN Seshadri K Sen, CFA OW 107989 2367 19-Nov-10 265.15 232.05 350.00 11-Oct-10 Sintex Industries Limited (Rs) SINT IN Princy Singh OW 42313 928 13-Jan-11 167.30 155.00 243.00 13-Jan-11 Spicejet Ltd (Rs) SJET IN Princy Singh OW 29253 641 2-Dec-10 82.15 72.25 115.00 2-Dec-10 Japan Canon (¥) 7751 JT Hisashi Moriyama OW 5415080 65372 14-Jan-11 4240.00 4060.00 5000.00 14-Jan-11 Dainippon Screen Mfg. (¥) 7735 JT Hisashi Moriyama OW 174480 2106 22-Jun-10 478.00 687.00 1000.00 17-Jan-11 FUJIFILM Holdings (¥) 4901 JT Hisashi Moriyama OW 1551597 18731 26-Jan-10 2942.00 3015.00 4500.00 28-May-10 Hitachi (¥) 6501 JT Yoshiharu Izumi OW 2006072 24218 29-Jul-09 293.00 444.00 590.00 23-Apr-10 Honda Motor (¥) 7267 JT Kohei Takahashi OW 5932428 71618 19-Jan-10 3370.00 3275.00 3600.00 22-Oct-10 Inpex Corporation (¥) 1605 JT Brynjar Eirik Bustnes OW 1818765 21957 1-Sep-10 389000.00 497500.00 630000.00 31-Aug-10 Nikon (¥) 7731 JT Hisashi Moriyama OW 736014 8885 4-Jan-11 1747.00 1836.00 2500.00 4-Jan-11 Malaysia RHB Capital (M$) RHBC MK Harsh Wardhan Modi OW 18305 5982 18-Nov-10 7.80 8.50 10.60 16-Nov-10 Philippines International Container Terminal Services, Inc. (Php) ICT PM Jeanette Yutan OW 81304 1828 8-Sep-10 35.20 42.00 49.00 20-Oct-10 Philippine Stock Exchange Inc (Php) PSE PM Harsh Wardhan Modi OW 11111 250 9-Oct-07 407.50 362.20 605.00 4-Oct-10 Singapore CapitaLand (S$) CAPL SP Christopher Gee OW 15516 12076 29-Sep-08 3.26 3.64 5.30 18-Jan-10 DBS Group (S$) DBS SP Harsh Wardhan Modi OW 34217 26632 8-Aug-08 14.36 14.82 24.00 19-Jan-11 Global Logistic Properties Ltd (S$) GLP SP Christopher Gee OW 9559 7440 18-Nov-10 2.18 2.08 2.90 18-Nov-10 Noble Group Ltd (S$) NOBL SP Ajay Mirchandani OW 13267 10326 12-Nov-09 1.83 2.20 2.50 10-Nov-10 Olam International (S$) OLAM SP Ajay Mirchandani OW 6613 5147 2-Oct-08 1.80 3.11 3.70 10-Aug-09 Singapore Airlines (S$) SIA SP Corrine Png OW 18033 14036 23-May-10 14.60 15.06 20.00 10-Nov-10 South Korea LG Chem Ltd (W) 051910 KS Samuel Lee, CFA OW 26409030 23555 14-Oct-10 327000.00 398500.00 430000.00 14-Oct-10 LG Display (W) 034220 KS JJ Park OW 13346530 11904 15-Mar-10 35900.00 37300.00 52000.00 12-Jan-11 LG Electronics (W) 066570.KS JJ Park OW 17647030 15740 15-Jan-11 114000.00 122000.00 150000.00 15-Jan-11 LG Innotek (W) 011070 KS Hyunjoon Roh OW 2576253 2298 23-Mar-10 115000.00 128000.00 240000.00 15-Jul-10 Samsung SDI (W) 006400 KS Hyunjoon Roh OW 7243776 6461 23-Jun-09 96100.00 159000.00 220000.00 28-Oct-10 SK Energy Co Ltd (W) 096770 KS Brynjar Eirik Bustnes OW 16874970 15051 5-Oct-07 147500.00 182500.00 165000.00 13-Sep-10 CJO Shopping (W) 035760 KS Jinah Lee OW 1540044 1374 11-Jan-11 250500.00 248800.00 277000.00 11-Jan-11 Taiwan First Financial Holding Co Ltd (NT$) 2892 TT Dexter Hsu OW 174551 6002 3-Sep-10 18.45 26.95 33.00 8-Jan-11 Formosa Chemicals and Fibre Corp (NT$) 1326 TT Samuel Lee, CFA OW 550838 18942 9-Dec-10 93.20 96.80 109.00 9-Dec-10 Novatek Microelectronics Corp (NT$) 3034 TT Cynthia Chou OW 56661 1948 3-Dec-10 98.50 95.10 120.00 3-Dec-10 Pegatron Corp (NT$) 4938 TT Gokul Hariharan OW 85855 2952 24-Aug-10 40.15 38.05 52.00 24-Aug-10 Powertech Technology Inc (NT$) 6239 TT Cynthia Chou OW 74756 2571 2-Aug-10 101.50 104.50 130.00 3-Aug-10 Quanta Computer Inc. (NT$) 2382 TT Alvin Kwock OW 237636 8172 13-Oct-10 48.05 62.00 68.00 29-Oct-10 TSMC (NT$) 2330 TT Rick Hsu OW 1932688 66461 19-Jan-11 78.00 74.60 88.00 7-Dec-10 Unimicron Technology Corp. (NT$) 3037 TT Christopher Ma OW 89750 3086 18-Apr-10 40.75 58.00 60.00 18-Apr-10 Thailand Banpu Public (Bt) BANPU TB Sukit Chawalitakul OW 213050 6943 15-Oct-10 724.00 784.00 906.00 15-Dec-10 PTT Public Company (Bt) PTT TB Sukit Chawalitakul OW 965825 31475 23-Mar-10 256.00 339.00 395.00 15-Sep-10 LPN Development(Bt) LPN TB Anne Jirajariyavech OW 12691 414 18-Jan-11 8.15 8.60 9.70 17-Jan-11 United States Focus Media (US$) FMCN Dick Wei OW 3393 3393 3-Jun-10 15.44 23.70 28.00 29-Sep-10
Source: Bloomberg, J.P. Morgan estimates. *Under applicable law and/or JPMorgan Chase & Co policy, all J.P. Morgan ratings and estimates for this company have been removed.
For details on the AFL methodology, please see the Asia Cash Equities page on mm.jpmorgan.com or contact your J.P. Morgan salesperson/the covering analyst. Your feedback can help us to make the FTM better. Please take a moment to tell us what you think. Click here to send comments Click here for the Blackberry version Click here to unsubscribe
Asia Pacific Equity Research 21 January 2011
MediaTek Inc.
Overweight 2454.TW, 2454 TT
More signs of turnaround
Price: NT$398.00
Price Target: NT$540.00
Taiwan Semiconductors
Alvin KwockAC
(852) 2800-8533 [email protected]
J.P. Morgan Securities (Asia Pacific) Limited
Charles Guo (852) 2800-8532 [email protected]
J.P. Morgan Securities (Asia Pacific) Limited
Laura Chen (886-2) 2725-9867 [email protected]
J.P. Morgan Securities (Taiwan) Limited.
Ashish Gupta (91-22) 6157-3284 [email protected]
J.P. Morgan India Private Limited
350
500
650
NT$
Jan-10 Apr-10 Jul-10 Oct-10 Jan-11
Pr ice Per fo rman ce
2454.TW share price (NT$)TSE (rebased)
YTD 1m 3m 12m Abs -4.7% -7.4% 1.4% -30.9% Rel -5.3% -10.3% -9.6% -40.6%
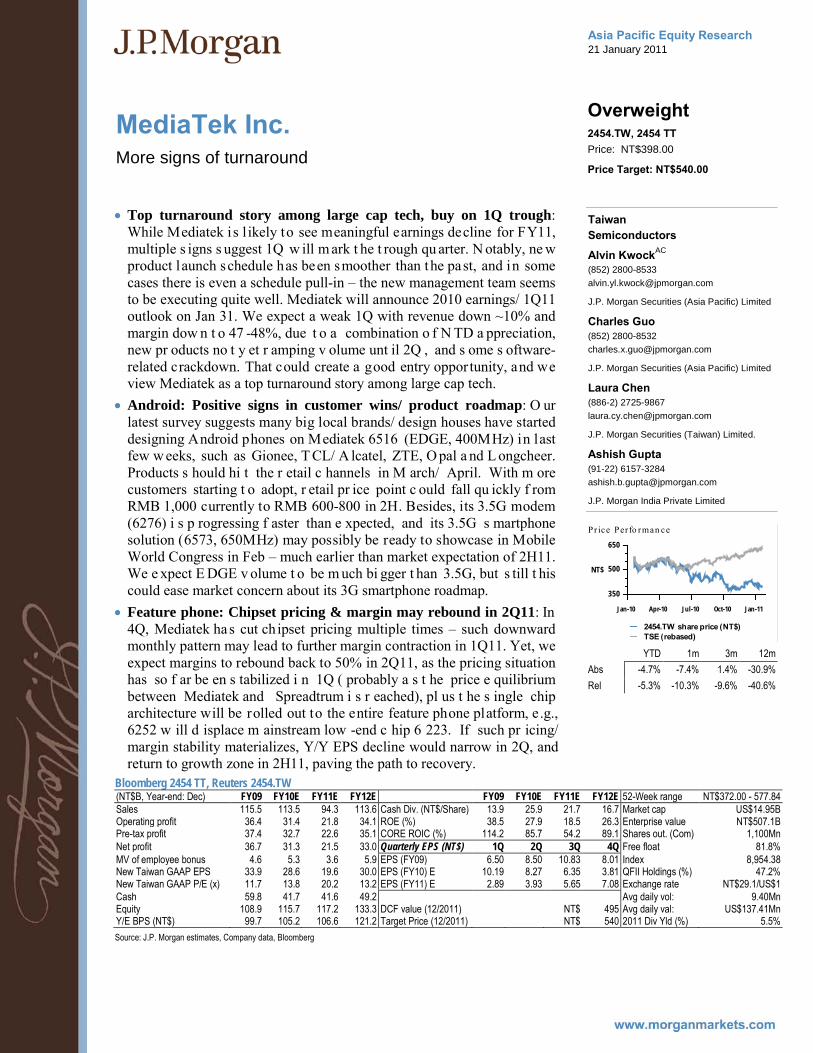
• Top turnaround story among large cap tech, buy on 1Q trough: While Mediatek is l ikely to see meaningful earnings decline for FY11, multiple s igns s uggest 1Q w ill m ark t he t rough qu arter. N otably, ne w product launch schedule has been smoother than the past, and in some cases there is even a schedule pull-in – the new management team seems to be executing quite well. Mediatek will announce 2010 earnings/ 1Q11 outlook on Jan 31. We expect a weak 1Q with revenue down ~10% and margin dow n t o 47 -48%, due t o a combination o f N TD a ppreciation, new pr oducts no t y et r amping v olume unt il 2Q , and s ome s oftware-related crackdown. That could create a good entry opportunity, and we view Mediatek as a top turnaround story among large cap tech.
• Android: Positive signs in customer wins/ product roadmap: O ur latest survey suggests many big local brands/ design houses have started designing Android phones on Mediatek 6516 (EDGE, 400MHz) in last few w eeks, such as Gionee, T CL/ A lcatel, ZTE, O pal a nd L ongcheer. Products s hould hi t the r etail c hannels in M arch/ April. With m ore customers starting t o adopt, r etail pr ice point c ould fall qu ickly f rom RMB 1,000 currently to RMB 600-800 in 2H. Besides, its 3.5G modem (6276) i s p rogressing f aster than e xpected, and its 3.5G s martphone solution (6573, 650MHz) may possibly be ready to showcase in Mobile World Congress in Feb – much earlier than market expectation of 2H11. We e xpect E DGE v olume t o be m uch bi gger t han 3.5G, but s till t his could ease market concern about its 3G smartphone roadmap.
• Feature phone: Chipset pricing & margin may rebound in 2Q11: In 4Q, Mediatek has cut chipset pricing multiple times – such downward monthly pattern may lead to further margin contraction in 1Q11. Yet, we expect margins to rebound back to 50% in 2Q11, as the pricing situation has so f ar be en s tabilized i n 1Q ( probably a s t he price e quilibrium between Mediatek and Spreadtrum i s r eached), pl us t he s ingle chip architecture will be rolled out to the entire feature phone platform, e.g., 6252 w ill d isplace m ainstream low -end c hip 6 223. If such pr icing/ margin stability materializes, Y/Y EPS decline would narrow in 2Q, and return to growth zone in 2H11, paving the path to recovery.
Bloomberg 2454 TT, Reuters 2454.TW (NT$B, Year-end: Dec) FY09 FY10E FY11E FY12E FY09 FY10E FY11E FY12E 52-Week range NT$372.00 - 577.84 Sales 115.5 113.5 94.3 113.6 Cash Div. (NT$/Share) 13.9 25.9 21.7 16.7 Market cap US$14.95B Operating profit 36.4 31.4 21.8 34.1 ROE (%) 38.5 27.9 18.5 26.3 Enterprise value NT$507.1B Pre-tax profit 37.4 32.7 22.6 35.1 CORE ROIC (%) 114.2 85.7 54.2 89.1 Shares out. (Com) 1,100Mn Net profit 36.7 31.3 21.5 33.0 Quarterly EPS (NT$) 1Q 2Q 3Q 4Q Free float 81.8% MV of employee bonus 4.6 5.3 3.6 5.9 EPS (FY09) 6.50 8.50 10.83 8.01 Index 8,954.38 New Taiwan GAAP EPS 33.9 28.6 19.6 30.0 EPS (FY10) E 10.19 8.27 6.35 3.81 QFII Holdings (%) 47.2% New Taiwan GAAP P/E (x) 11.7 13.8 20.2 13.2 EPS (FY11) E 2.89 3.93 5.65 7.08 Exchange rate NT$29.1/US$1 Cash 59.8 41.7 41.6 49.2 Avg daily vol: 9.40Mn Equity 108.9 115.7 117.2 133.3 DCF value (12/2011) NT$ 495 Avg daily val: US$137.41Mn Y/E BPS (NT$) 99.7 105.2 106.6 121.2 Target Price (12/2011) NT$ 540 2011 Div Yld (%) 5.5% Source: J.P. Morgan estimates, Company data, Bloomberg

Asia Pacific Equity Research 21 January 2011
CapitaLand
Overweight CATL.SI, CAPL SP
Markers for the next decade ▼
Price: S$3.64
Price Target: S$4.60 Previous: S$5.30
Singapore Real Estate
Christopher Gee, CFAAC
(65) 6882-2345 [email protected]
Joy Wang (65) 6882-2312 [email protected]
J.P. Morgan Securities Singapore Private Limited
3.4
4.0
4.6S$
Jan-10 Apr-10 Jul-10 Oct-10 Jan-11
Pr ice Per fo rman ce
CATL.SI share price (S$)FTSTI (rebased)
YTD 1m 3m 12m Abs -3.2% -0.3% -8.5% -13.1% Rel -1.6% -1.7% -9.2% -24.8%
CapitaLand (Reuters: CATL.SI, Bloomberg: CAPL SP) S$ in mn, year-end Dec FY09A FY10E FY11E FY12E Revenue 2,957 3,490 3,839 4,223 Net Profit 1,053.0 1,233.8 1,420.0 1,360.1 EPS (S$) 0.26 0.29 0.33 0.32 DPS (S$) 0.069 0.065 0.065 0.065 EPS growth (%) -41.4% 10.8% 15.1% -4.2% ROE 8.7% 8.9% 9.4% 8.4% P/E (x) 13.9 12.5 10.9 11.4 BVPS (S$) 3.16 3.40 3.67 3.93 RNAV/Share 5.31 5.31 5.71 P/BV (x) 1.2 1.1 1.0 0.9 Dividend Yield 1.9% 1.8% 1.8% 1.8%
Shares O/S (mn) 4,263 Market cap (S$ mn) 15,516 Market cap ($ mn) 12,047 Price (S$) 3.64 Date Of Price 21 Jan 11 Free float (%) 60.0% 3-mth trading value (S$ mn) 106.9 3-mth trading value ($ mn) 83.0 3-mth trading volume (mn) 11.5 FTSTI 3,185 Exchange Rate 1.29 Fiscal Year End Dec
Source: Company data, Bloomberg, J.P. Morgan estimates.
• Conservative positioning at the end of an exceptional first ten years: Since 2000 when the group emerged from the merger of DBS Land and Pidemco Land, CapitaLand has evolved into a significant regional real estate developer differentiated by its breadth of exposure in Asia-Pacific as well as i ts real estate funds platform. However, due to an enlarged capital base the stock has underperformed its relevant benchmark indices in the past 18 months. We set out in this report what we believe are the major mi lestones for a r eversal o f t his sha re p rice p erformance t rend. We retain our Overweight rating on the stock, but remove the stock from our Asia Analyst Focus List.
• Higher base of comparison: Over 10 years the group’s managed assets have more than doubled (CAGR of 8.4%), whilst the aggregate market capitalization o f t he l isted e ntities w ithin t he g roup ha s e xpanded 4 x (15% CAGR). We estimate the group ROE will increase from the FY09 trough to above 9% in FY Dec 11E, and we have rolled over our SOTP valuation to FY 11E which is now at S$5.71/share (from S$5.35/share).
• The next moves in the next decade: Greater capital productivity at the business un it level, e specially in the m ajor s egments of r etail, commercial and serviced residences, as well as moving the capital base to t he g roup’s op timal gearing r ange of 50-70% (via acc retive investment or by way of capital reduction or both) would accelerate ROE growth. We estimate the group’s investment capacity at between S$5.1-8.8billion, 30-54% of the group’s market capitalization.
• New Dec 2011 target price of S$4.60/share, based on a historical average 19% discount to our end Dec 2011 SOTP valuation. Key risks to our target pr ice would be an i nability t o deploy the group's investment capacity into accretive investments and/or a prolonged failure to shift the group's capi tal base towards i ts optimal gearing range via active capital management.

Asia Pacific Equity Research 21 January 2011
CapitaMalls Asia
Overweight CMAL.SI, CMA SP
At the heel of the hockey stick ▲
Price: S$1.91
Price Target: S$2.75 Previous: S$2.60
Singapore Property
Joy WangAC
(65) 6882-2312 [email protected]
Christopher Gee, CFA (65) 6882-2345 [email protected]
J.P. Morgan Securities Singapore Private Limited
1.8
2.2
2.6
S$
Jan-10 Apr-10 Jul-10 Oct-10 Jan-11
Pr ice Per fo rman ce
CMAL.SI share price (S$)FTSTI (rebased)
YTD 1m 3m 12m Abs 0.0% 2.7% -13.2% -18.7% Rel 1.6% 1.3% -13.9% -30.4%
Unit data 52-week range S$1.83 - 2.41 Market cap (S$MM) 7,418 Market cap (US$MM) 5,777 Shares outstanding (MM) 3,884 Avg daily value (S$MM) 10.8 Avg daily value (US$MM) 8.4 Avg daily volume (shares) 5.5 STI 3,185 Exchange rate S$1.284/US$ Source: Bloomberg
• We reiterate our Overweight rating and raise our Dec-11 price target to S$2.75, based on our SOTP valuation. The stock has de-rated over the past six months, and is currently t rading at 1 .1x FY11E book and 11x FY11 r eported P /E. While we st ill see n ear-term he adwinds, w ith the stock trading at a 15% discount to our estimated tangible asset value and pricing in zero value for the group’s funds management business and for its platform, we see the current level as an attractive entry level and add CMA to our Asia Analyst Focus List.
• The earnings power of CMA's China portfolio – a ‘J’ curve: Given that the group’s China portfolio has not been contributing significantly, especially for those private funds, the market is of the view that earnings are likely to be weak for the next few years. We argue, however, based on our p roperty-by-property ana lysis, that t he group’s rental ear nings from China will more than double by 2012. This, together with the likely strong revaluation gains from China, would help the group to achieve a three-year earnings CAGR of 23%, on our estimates.
• Book value understates CMA’s underlying asset value, in our view. While the group revalues its investment assets on a semi-annual basis, the income approach adopted has resulted in a rather conservative book value, in our view. In addition, we estimate that more than S$1 billion worth of assets (on an effective stake basis) in China has yet to be carried on the group’s book, and most of the 2nd- and 3rd-tier city malls are still carried on the group’s book at cost.
• Key risks to our rating and price target: Our O verweight r ating is predicated on the v iew t hat C hina ope rations for the group will turn around i n the ne xt 12 -18 m onths. I n a ddition, t he g roup c ontinues t o carry sizable surplus capital, which could drag down the return on equity should management be unable to deploy it in time.
Reuters: CMAL.SI; Bloomberg: CMA SP S$ in millions, year-end December FY09 FY10E FY11E FY12E Sales 229 229 221 230 Reported profit 388 494 680 722 Reported EPS (S$) 0.10 0.13 0.18 0.19 Recurring EPS (S$) 0.05 0.08 0.06 0.08 DPS (S$) 0.01 0.01 0.01 0.01 ROE (%) 7 8 10 10 Recurring P/E (x) 35 23 32 25 Reported P/E (x) 19 15 11 10 BVPS (S$) 1.41 1.54 1.70 1.88 SOTP per share (S$) 2.60 2.75 2.93 P/B (x) 1.4 1.2 1.1 1.0 Div yield (%) 0.5 0.5 0.5 0.5 Source: Company data, J.P. Morgan estimates.

Asia Pacific Equity Research 21 January 2011
Doosan Corp Initiation
Overweight 000150.KS, 000150 KS
Growth with value
Price: W155,500
Price Target: W190,000
South Korea Conglomerates & Multi-industry
Youna KimAC
(82-2) 758-5715 [email protected]
Scott YH Seo (82-2) 758 5759 [email protected]
J.P. Morgan Securities (Far East) Ltd, Seoul Branch
80,000
120,000
160,000
W
Jan-10 Apr-10 Jul-10 Oct-10 Jan-11
Pr ice Per fo rman ce
000150.KS share price (W )KOSPI (rebased)
YTD 1m 3m 12m Abs -1.3% 0.3% 0.3% 32.3% Rel -1.3% -1.3% -10.1% 12.1%
• Initiating coverage with an OW rating and Jun-11 PT of W190,000, implying 22% ups ide potential f rom c urrent le vels. W e expe ct to see: (1) strong revenue growth in Doosan Corp’s own operations along with higher OPM; (2) an upw ard r evision in the market’s v aluation of DIP Holdings; and (3) better e quity method ga ins on s tronger e arnings v isibility of it s major subsidiary.
• Macro conditions and product mix changes support top-line growth and OPM expansion for operational divisions: Based on t he p ositive outlook for fixed i nvestment i n C hina and Korea, we forecast strong t op-line growth for Mottrol (17% of 2011 OP), as its sales are concentrated on three major dom estic c onstruction e quipment makers which ha ve large exposure to Korea a nd C hina, and di rect e xports to C hinese c onstruction equipment makers are increasing. For the electro-material di vision (23% 2011E OP) we expect increasing sales of high-end/higher operating margin CCL to support a divisional operating margin at historical highs.
• DIP Holdings is still undervalued: We estimate the value of DIP Holdings at about W 585B, or W200B higher t han Doosan C orp’s i nvested c apital when e stablishing D IP Holdings ( including W 110B of bor rowings). We think this value is underestimated by the market. If DIP Holdings and other PEFs w ere to de cide t o s ell t he unde rlying a ssets, w e t hink t he r esulting discussion on sale prices would give greater v isibility around the intrinsic value in DIP, and act as a catalyst for Doosan’s share price.
• Valuation and risks: Our pr ice t arget of W190,000 is ba sed on S OTP. Risks to our PT are: (1) softer-than-expected equity method gains from DHI; (2) lower-than-anticipated OP margins in Mottrol and Electro-material; and (3) potential concerns about DII’s and D IC’s a bility t o honor liabilities related to put-back options to FIs and balance sheet management.
Bloomberg: 000150 KS; Reuters: 000150 KS Won in billions, year-end December
FY08 FY09 FY10E FY11E FY12E Operating Profit 35 -38 310 346 457 52-week range W173,500-80,200 OP Growth (%) (61.7) (207.2) (915.2) 11.5 32.3 Market cap W4,057B Net Profit 110 232 245 289 394 Market cap US$3,618MM NP Growth (%) 215.3 111.7 5.3 18.0 36.3 Shares issued 25.MM EPS (Won) 4,428 9,386 9,802 11,530 15,721 Free float 34.4% P/E (x) 36.6 17.3 16.5 14.1 10.3 Fiscal Year End Dec BVPS (Won) 86,446 99,655 113,070 125,578 143,794 Price (W) 162,000 P/B (x) 1.9 1.6 1.4 1.3 1.1 Date of Price 20-Jan-11 DPS (Won) 1,000 2,500 2,500 2,500 2,500 Avg daily value W31.9B Dividend Yield (%) 0.6 1.5 1.5 1.5 1.5 Avg daily value US$28.4MM NAV per share (Won) 156,867 220,162 218,851 220,027 219,561 Avg daily volume 0.2MM shares P/NAV (x) 1.0 0.7 0.7 0.7 0.7 KOSPI 2,107 ROE (%) 9.7 13.7 12.6 13.2 15.9 Exchange Rate W1,121.2/US$ Source: Company reports, Bloomberg, J.P. Morgan estimates

Asia Pacific Equity Research 22 January 2011
LG Display
Overweight 034220.KS, 034220 KS
Cost-reduction efforts and earnings momentum to be key catalysts
Price: W37,300
Price Target: W52,000
South Korea Semiconductors
JJ ParkAC
(822) 758-5717 [email protected]
J.P. Morgan Securities (Far East) Ltd, Seoul Branch
Hyunjoon Roh (82-2) 758 5712 [email protected]
J.P. Morgan Securities (Far East) Ltd, Seoul Branch
Narci Chang (886-2) 2725-9899 [email protected]
J.P. Morgan Securities (Taiwan) Limited.
Justin J. Park (82-2) 758-5725 [email protected]
J.P. Morgan Securities (Far East) Ltd, Seoul Branch
30,000
40,000
50,000
W
Jan-10 Apr-10 Jul-10 Oct-10 Jan-11
Pr ice Per fo rman ce
034220.KS share price (W )KOSPI (rebased)
YTD 1m 3m 12m Abs -8.7% -5.1% -5.4% -11.0% Rel -8.7% -6.7% -15.8% -31.2%
• Focus on cost reduction in 2011: As we expected (see our 12 January 2011 report), LGE has announced aggressive initiatives to reduce costs from 1Q11 onw ards. C ompared w ith 2010 , when L GD e xperienced a Y/Y cost i ncrease, its cost reduction curve should return t o nor mal in 2011 due to a lower number of LED bars and falling component prices.
• Panel prices likely to hit bottom in mid-1Q11: Management expects TV panel prices to bottom out in February-March, and IT panel prices are already showing signs of stabilizing. Also, inventory across channels is at a normal level, except for LED TVs. This is in line with our view on the LCD market, although we now expect a meaningful recovery in LGD’s earnings to take place in 2Q11, rather than in 1Q11.
• Big promotion on FPR-based 3D TV: LGD sh owcased its F ilm Patterned Retarder (FPR) 3D TV during the analyst m eeting and criticized its existing Shutter Glass (SG) 3D TV, pointing at the flicker, cross-talk, bulky g lasses, and other ne gatives. W e came ba ck w ith a positive impression based on o ur own e xperience, and also positive feedback from major r etailers. LGD expects the g lobal 3D TV market sales to reach 30 million units (almost 15% of expected global total LCD TV sales) in 2011. LGD targets 70% of global 3D TV sales in 2011.
• Compelling valuation and earnings momentum: Due to the delay in panel price recovery, LGD’s stock has underperformed YTD. Although the c ompany is likely to post a nother loss i n 1Q 11, a ggressive cost reduction efforts a nd panel-demand r ecovery, along with panel p rice stabilization f rom 2Q 11, will dr ive s trong e arnings momentum, in our view. T he s tock i s currently t rading a t 1. 1x F Y11E book a nd 0.9 x FY12E book , with a double-digit R OE. H ence, w e r ecommend that investors ac cumulate the s tock. We m aintain our P /BV-based Dec-11 price target of W52,000, which is based on a mid-cycle valuation.
Reuters: 034220.KS; Bloomberg: 034220 KS W B, YE Dec. FY09 FY10 FY11E FY12E ADR Sales 20,038 25,511 26,317 27,917 52-week range W48,100-32,600 Reuters LPL.N Operating profit 1,010 1,310 1,488 2,018 Market cap W13,347B Bloomberg LPL US Net profit 1,153 1,116 1,361 1,778 Market cap US$11,873MM 52-wk range US$ 21.59~13.75 EPS (KRW) 3,222 3,119 3,804 4,968 Shares 358MM Ratio 1:2 Cash 3,362 3,271 1,062 1,697 Free Float 56% Avg daily vol. 985,754 ROE (%) 11.8 10.5 11.6 13.4 Avg daily value W103.5B Cur. premium 0.8% P/E (x) 11.6 12.0 9.8 7.5 Avg daily value US$92.MM BPS (KRW) 28,551 30,802 34,605 39,573 Avg daily vol. 2.6MM shares EV/EBITDA (x) 3.4 3.1 3.0 2.4 Index KOSPI 2,069.92 Div yield (%) 2% 2% 2% 2% Exchange rate W1,124/US$1 Quarterly EPS (KRW) 1Q 2Q 3Q 4Q Date of price 21-Jan-11 EPS (FY10) 1,813 1,429 627 -749 Price target W52,000 EPS (FY11)E -257 1,030 1,592 1,439 Consensus PT W47,000 EPS (FY12)E 1,099 1,122 1,662 1,086 Difference 11%
Source: Company reports, Bloomberg, J.P. Morgan estimates. Share price is as of 21 January, 2011.

Asia Pacific Equity Research 23 January 2011
Hyundai Mobis
Overweight 012330.KS, 012330 KS
4Q10 preview: surpassing OEMs' growth. Raise PT to W370,000 ▲
Price: W283,500
Price Target: W370,000 Previous: W350,000
South Korea Auto Parts
Wan Sun ParkAC
(82-2) 758-5722 [email protected]
Gon Suk Lee (82-2) 758 5710 [email protected]
J.P. Morgan Securities (Far East) Ltd, Seoul Branch
100,000
200,000
300,000
W
Jan-10 Apr-10 Jul-10 Oct-10 Jan-11
Pr ice Per fo rman ce
012330.KS share price (W )KOSPI (rebased)
YTD 1m 3m 12m Abs -3.7% -2.2% 11.8% 86.5% Rel -3.7% -3.8% 1.4% 66.3%
Bloomberg JPMA WPARK <GO>
• We expe ct strong 4Q 10 e arnings with revenue to c ome i n at W3.7T (+16% YoY; +13% QoQ), OP at W487B (+39% YoY; +12% QoQ), and NP at W695B (+46% YoY; +15% QoQ). Despite production disruption at H MC, increasing hi gh v alue a dded pa rts sales to ne w m odels o f KIA/HMC, stable A/S revenue and equity method gains will likely bring one of the strongest YoY and QoQ growths in auto/parts sector.
• We raised 2011-2012 top-line by 2~4% and NP by 4~9%, by revisiting A/S a nd m anufacturing business g rowth a nd m argins. We b elieve recently a nnounced business pl an, e specially pa rent r evenue of W14T, looks conservative, as c ompany ha s t rack r ecord of beating targeted annual business guidance. Revenue g uidance for 2010E w as W11.7T vs. JPMe of W13.7T.
• A/S revenue growth (11% CAGR in 2010E-2012E) will be quite stable, supported by strong increase in UIO of HMC and KIA globally. Also, 2011 will see addition of 3 warehouses in Italy, Russia, and US, which will be positive for expanding overseas A/S business. We assume 24% OPM for A/S business for 2011-2012.
• Module/component revenue will be growing broadly in-line, but slightly higher than HMC and KIA’s global production at 12% CAGR. Mobis started Russia module plant from Jan and will also ramp up Brazil plant in 2012E.
• We ex pect overall margin t o improve steadily on r ising C KD pa rt to HMC and KIA’s new overseas p lants and e xisting production s ites to meet capacity increase. We assume module margin of 4% and core parts margin of 6%.
• Our new Dec-11 PT of W370,000 (reflecting 2011 NP increase of 4%) is based on a PER multiple of 12x. Key r isks to our view and PT include (1) HMC/KIA production f luctuations ( +/-); ( 2) e xecution r isk of ne w manufacturing facilities (-); and (3) cash re-investment risk (-).
Hyundai Mobis (Bloomberg: 012330 KS; Reuters: 012330.KS) Won in billions, year-end December FY09A FY10E FY11E FY12E Sales (W Bn) 10,633 13,735 15,215 16,845 52-week range W318,000-140,500 Net profit (W Bn) 1,615 2,527 2,933 3,306 Market cap W27,597B EPS (W) 18,843 26,521 30,782 34,702 Market cap US$24,550MM Sales growth (%) 13.4 29.2 10.8 10.7 Shares issued 97.3MM EPS growth (%) 47.8 40.7 16.1 12.7 Price (W) 283,500 ROCE (%) 24.0 22.2 18.5 16.7 Avg daily value 40,565.00 ROE (%) 24.5 28.4 25.8 23.0 Avg daily value W84.4B P/E (x) 14.4 10.2 8.8 7.8 Avg daily volume US$75.1MM P/B (x) 3.0 2.6 2.0 1.6 KOSPI 0.3MM shares EV/EBITDA (x) 16.1 11.8 11.5 9.9 Exchange Rate 2,069.9 Source: Bloomberg, J.P. Morgan estimates. Price as of Jan 21, 2011.

Asia Pacific Equity Research 21 January 2011
JSW Energy Ltd.
Neutral JSWE.BO, JSW IN
Higher fuel costs and execution delays result in earnings cut ▼
Price: Rs88.20
Price Target: Rs93.00 Previous: Rs116.00
India Electric Utilities
Shilpa KrishnanAC
(91-22) 6157-3580 [email protected]
Sumit Kishore (91-22) 6157-3581 [email protected]
Deepika Belani (91-22) 6157-3582 [email protected]
J.P. Morgan India Private Limited
80
110
140
Rs
Jan-10 Apr-10 Jul-10 Oct-10 Jan-11
Pr ice Per fo rman ce
JSW E.BO share price (Rs)NIFTY (rebased)
YTD 1m 3m 12m Abs -11.6% -9.9% -27.9% -19.5% Rel -4.4% -5.9% -23.4% -28.9%
JSW Energy Ltd. (Reuters: JSWE.BO, Bloomberg: JSW IN) Rs in mn, year-end Mar FY10A FY11E FY12E FY13E Revenue 23,551 40,000 72,710 71,408 Adjusted Profit 7,455 8,329 13,716 14,252 EPS (Rs) 5.16 5.08 8.36 8.69 Revenue growth (%) 28.3% 69.8% 81.8% -1.8% Adjusted profit growth (%) (Rs) 169.4% 11.7% 64.7% 3.9% ROCE 10.7% 9.7% 14.9% 15.0% ROE 23.8% 16.3% 22.8% 20.0% P/E (x) 17.1 17.4 10.5 10.1 P/BV (x) 3.0 2.7 2.2 1.9 EV/EBITDA (x) 17.8 14.6 8.4 7.1
Shares O/S (mn) 1,640 Market cap (Rs mn) 144,653 Market cap ($ mn) 3,177 Price (Rs) 88.20 Date Of Price 20 Jan 11 Free float (%) 23.3% 3mth Avg daily volume (mn) 1.73 3M - Average daily Value (Rs mn) 182.32 Average 3m Daily Turnover ($ mn) 4.00 NIFTY 5,712 Exchange Rate 45.54 Fiscal Year End Mar
Source: Company data, Bloomberg, J.P. Morgan estimates.
• Dec-q weak, as expected. 3Q adjusted PAT of Rs1.8B (down 1% qoq) was broadly i n-line w ith our estimate (Rs1.74B) a nd 2 0% be low c onsensus. Reported PLFs were broadly in line with our estimates based on CEA data: 1) Vijaynagar (860MW) - 94% PLF up 300bps qoq; 2) Ratnagiri (300MW) - 73%, impacted by t eething issues, lower de mand; and 3) Barmer (2x135MW) - 61.5%, equipment br eakdown and fuel transportation logistics. Despite i ncrease i n operating capacity, EBITDA margins declined by ~550bps qoq: 1) ST r ealizations of Rs4.87/kwh i n 3 Q vs Rs4.65/kwh in 2Q , but be low our e stimate of R s5; 2) h igher l anded fuel cost/unit of Rs2.7/kwh (or implied ~US$140/MT for 6,100Kcal/kg coal).
• Exposure to spot coal prices erodes profitability. We de lay commissioning of Barmer (Rajasthan SEB to be averse on buying expensive power a nd on logistical is sues on coal tr ansportation) and R atnagiri (shortage of sand procurement) and assume a 3-4 month buffer in estimates. Also on a ccount of i ncreased c oal c osts, we r educe o ur FY11 and F Y12 estimates by 32% and 25%, respectively. At the analyst meet, management conceded to a 15% qoq increase in coal cost for the Mar-q. Increasing coal prices c ontinue to hur t bot tom l ine a s although captive c oal f rom S outh Africa is expected t o c ome through in F Y12, quantity i s m inimal ( 1MT). Whereas linkage coal for Barmer (on regulated returns) remains elusive and land acquisition for the J alipa ligni te mine s is a c hallenge. Management expects lignite production from Kaprudi to commence in 4QFY11.
• We reduce our Mar-12 SOTP-based price target to Rs93 from Rs116 earlier; maintain Neutral. The stock has underperformed Sensex by ~24% over the la st 3 months, and over the same pe riod, benchmark coal pr ices have increased ~15%. B ased on the nascent stage of development of the captive mine associated with the West Bengal project (Rs1,620MW) and the initial execution thrust for only 300MW, we reduce the value for the project to Rs3/share from Rs20.5/share earlier. Our SOTP valuation includes Rs80.4 for ope rational/under-construction pr ojects a nd Rs3.5/share for pi peline projects. At 8.4x FY12E EV/EBITDA, t he s tock i s a t a di scount t o ot her IPPs, which is warranted in our view due to poor pipeline visibility and fuel price risks. Higher-than-expected merchant prices or PLFs are upside risks.

Asia Pacific Equity Research 22 January 2011
Reliance Industries Ltd
Overweight RELI.BO, RIL IN
Steady 3Q, but no clarity on E&P ramp-up ▼
Price: Rs986.80
Price Target: Rs1,240.00 Previous: Rs1,260.00
India Integrated Oils
Pradeep Mirchandani, CFAAC
(91-22) 6157-3591 [email protected]
Neil Gupte (91-22) 6157 3592 [email protected]
J.P. Morgan India Private Limited
900
1,050
1,200Rs
Jan-10 Apr-10 Jul-10 Oct-10 Jan-11
Pr ice Per fo rman ce
RELI.BO share price (Rs)BSE30 (rebased)
YTD 1m 3m 12m Abs -6.5% -8.0% -8.8% -6.4% Rel 1.1% -2.8% -2.6% -17.9%
Reliance Industries Ltd (Reuters: RELI.BO, Bloomberg: RIL IN) Rs in mn, year-end Mar FY09A FY10A FY11E FY12E FY13E Revenue 1,512,245 2,037,400 2,561,487 2,609,727 2,682,566 Net Profit 152,492.6 158,180.0 218,872.3 244,952.9 312,046.2 EPS (Rs) 48.46 48.14 66.62 74.55 94.97 DPS (Rs) 6.03 7.00 10.00 10.00 11.00 Revenue growth (%) 13.3% 34.7% 25.7% 1.9% 2.8% EPS growth (%) -7.7% -0.6% 38.4% 11.9% 27.4% ROCE 13.3% 11.3% 13.0% 12.6% 14.3% ROE 18.9% 14.6% 17.0% 16.6% 18.2% P/E (x) 20.4 20.5 14.8 13.2 10.4 P/BV (x) 3.2 2.7 2.4 2.0 EV/EBITDA (x) 13.9 10.7 8.4 7.2 5.5 Dividend Yield 0.6% 0.7% 1.0% 1.0% 1.1%
Shares O/S (mn) 3,273 Market cap (Rs mn) 3,229,691 Market cap ($ mn) 70,928 Price (Rs) 986.80 Date Of Price 21 Jan 11 Free float (%) 50.2% 3mth Avg daily volume 5,388,555.00 3M - Average daily Value (Rs mn) 5,616.96 Average 3m Daily Turnover ($ mn) 123.35 BSE30 19,008 Exchange Rate 45.54 Fiscal Year End Mar
Source: Company data, Bloomberg, J.P. Morgan estimates.
• Steady 3Q, but no clarity on E&P ramp-up: RIL’s 3QFY11 ne t profits of Rs51.4bn came in line with our expectations. While operating performance on Refining and Petrochemicals w as v ery st rong, E&P business continues to lag, even as there is no clarity on gas ramp-up.
• Refining – strong quarter, with more to follow: RIL ha d an exceptionally strong refining quarter, with GRMs of US$9/bbl (ahead of our expectation of US$8.8/bbl). RIL continues to be positive on refining outlook w ith strong de mand g rowth east o f t he S uez and s upport f or diesel sp reads due t o ch anges i n sp ecs f or off-road diesel i n Europe. Complex refiners will continue to benefit on low OPEC compliance and a weak outlook for fuel oil, in RIL’s view.
• Petrochemicals: record quarter: P olymer spreads h ave he ld steady despite the large capacity additions in 2010 (8% cap add). With limited capacity a dditions on the hor izon, w e expect t he polymer c ycle t o bottom b y mid-2011. Polyester m argins w ere st rong acr oss t he ch ain, which benefited integrated producers l ike RIL. With high cotton prices likely to sustain, we believe, polyester outlook for FY12 is positive.
• E&P stays the dark horse: KGD6 volumes are currently averaging 52-55mmscmd. RIL did not indicate timelines for ramp-up, saying it was in talks w ith the g overnment/DGH on a g amut of i ssues r elated to i ts domestic E&P portfolio, including technical and regulatory issues. With no g uidance on E &P r amp up, w e are r educing our FY12 g as sa les estimates.
• Stock reflects E&P disappointment, not positive refining and petchem outlook: We reduce our FY11/FY12 EPS estimates by 4%/5% primarily to reflect lower gas production, and adjust our PT to Rs1240. We reiterate ou r O W on RIL. E ven bui lding i n a slower r amp-up i n E&P, three-year earnings CAGR is 25% and we think valuations a re undemanding a t 12x FY12E adj. P/E. K ey risk: Weak er economic recovery will hurt refining, petchem cycles.

Emerging Markets Equity Research 21 January 2011
Herd Instinct
Key Emerging Markets and Developed Asia Fund Flow Weekly, 13 January - 19 January 2011
Emerging Market Equity Strategy
Adrian MowatAC
(852) 2800-8599 [email protected]
J.P. Morgan Securities (Asia Pacific) Limited
Ben Laidler (1-212) 622-5252 [email protected]
J.P. Morgan Securities LLC
David Aserkoff, CFA (44-20) 7325-1775 [email protected]
J.P. Morgan Securities Ltd.
Deanne Gordon (27-21) 712-0875 [email protected]
J.P. Morgan Equities Ltd.
Rajiv Batra (91-22) 6157-3568 [email protected]
J.P. Morgan India Private Limited
Sanaya Tavaria (91-22) 6157-3312 [email protected]
J.P. Morgan India Private Limited
Faheem S Desai (91-22) 6157-3329 [email protected]
J.P. Morgan India Private Limited
During the week to 19 January, there were net inflows into all emerging market equity funds except BRIC equity. The net flows by mandate were: Total EM equity funds US$1.8billion subscription. GEMS
equity funds US$1.2billion subscription. EMEA equity funds US$715million subscription. LatAm equity funds US$172million redemption. Asia ex Japan equity funds US$75million subscription. BRIC equity funds US$82million redemption. US equity funds US$6.8billion subscription. US bond market US$3.8billion subscription. US money market US$32.8billion redemption. Net foreign buying/selling activity: Japan inflows of US$3.6billion. Outflows from all emerging markets except South Africa and Taiwan: Taiwan US$1.1billion inflows South Africa US$171million inflows Brazil US$211million outflows Thailand US$201million outflows India US$197million outflows For countries that do not publish official foreign transactions in their equity markets, we use the monthly data from EPFR Global (they cover 12,000 international, EM and US funds with total net assets greater than US$ 6 trillion). During the month of November, funds were net buyers in Australia, Singapore, China, Malaysia, Mexico, Russia, and Poland. Funds were net sellers in Hong Kong, Chile and Turkey. Please see page 13 for global portfolio weightings and household equity weights. Also see page 14 for the consensus overweight and underweight markets for November 2010.
Table 1: Market data & net foreign investment, 13 January – 19 January 2011 Index Net MTD 2011 2010 12M chg Flows YTD Agg. Avg. (%) US$M US$M US$M US$M (x).
Stock Exchange Investors' Trading Data Japan (1 wk lag) 0.3 3616 6719 6719 37974 1.9 South Africa -0.8 171 534 534 4825 0.9 Brazil** 0.6 -211 1341 1341 3600 -0.6 Taiwan 1.6 1113 2331 2331 8689 1.5 Korea 1.3 -50 736 736 18595 -0.1 India -2.7 -197 -718 -718 28711 -0.4 Thailand 2. 0 -201 -574 -574 1923 -1.1 Indonesia -1.0 -7 -425 -425 2331 -0.1 Philippines -0.1 -30 -74 -74 1231 -0.9 Monthly Tracking of Cross Border Funds (November)* # Australia -2. 0 298 - - 356 0.8 Singapore 0.4 280 - - -120 1.7 Hong Kong 1.8 -208 - - -719 -0.7 China -2.2 647 - - 2827 0.7 Malaysia -1.6 184 - - 390 1.1 Mexico 2.9 172 - - -815 1.1 Russia 1. 6 427 - - 641 1.2 Chile 0.7 -65 - - -255 -0.6 Poland -1.9 85 - - 710 0.8 Turkey -5.3 -128 - - 661 -1.3 Regional & US Mutual Fund Flows Total EM Equity**** -0.2 1764 - 6733 84112 0.8 Global EM Equity* -0.2 1229 - 3550 55045 0.9 LatAm Equity* -1.6 -172 - 904 1842 -1.0 EMEA Equity* -0.6 715 - 1434 6567 3.2 Asia ex-Japan Equity* 0.6 75 - 1267 19609 0.1 BRIC Equity* -1.0 -82 - -422 1049 -1.4 Japan Equity Funds 2.2 455 - 928 -840 2.1 Developed Europe* 2.1 961 - 595 -10256 1.3 International Equity* 1.4 1452 - 5628 6500 1.5 US Equity*** -0.3 6758 - 21635 33467 1.5 US Bond*** 3.4 3789 - 10687 149347 1.2 US Money Market*** 0.2 -32825 - -42000 -395262 -1.8
Source: Bloomberg, J.P. Morgan, I:Net, MKK, Lipper FMI, MSCI, Datastream. *EPFR Global data. **Data for Brazil is from 12 January – 18 January 2011. # 2010 Agg. figures are up to November 2010 only. ***Data from Lipper FMI. BRIC Funds separated from EM Funds from 11 May 07. The final column is designed to show the scale of net subscriptions or redemptions - the calculation is if net inflows (This weeks net subscription/(average of weeks with net subscriptions)( or if net redemptions /(This weeks net redemptions/(average of weeks with net redemptions)). ****Total EM Equity includes Global EM, LatAm, EMEA, Asia ex Japan and BRIC equity funds.

Asia Pacific Equity Research 21 January 2011
Vietnam Strategy Update
CP Congress sets stage for post-Tet signals on policy
Vietnam Market strategy
Sriyan PieterszAC (662) 684 2670 [email protected]
JPMorgan Securities (Thailand) Limited
Adrian Mowat (852) 2800-8599 [email protected]
J.P. Morgan Securities (Asia Pacific) Limited
Figure 1: VNINDEX Index
0200400600800
100012001400
2006 2007 2008 2009 2010
Source: Bloomberg.
• No surprises at the CPV Congress. The Party Congress which ended this week a nnounced the pol itical leadership a t the pa rty level for t he next five-year cy cle. The three k ey appointments, those of P rime Mi nister (PM), President, and Party Secretary General have been confirmed, with former National Assembly Chairman Nguyen Phu Trong being e lected party S ecretary G eneral, while P M N guyen Tan D ung ha s r eceived a second term and Truong Tan Sang was appointed President.
• The l eadership annou ncements ar e s een as positive be cause: 1) t hey clear up uncertainty over t he political succession a nd allow the government to get back to addressing the economy; and 2) Mr. Dung's re-appointment as PM is viewed as constructive (despite his association with/support f or th e S OEs), given his r eformist cr edentials and the expectation that he will provide continuity.
• First task of the new government will be macroeconomic stability. With a y oung popul ation a nd l ow s tandard of living, the g overnment understandably maintains a policy bias toward strong growth. However, this bias, at times, comes at the expense of economic stability. Given the inflation a nd B oP c oncerns, w e expect the g overnment t o tighten monetary conditions more aggressively after Tet New Year.
• Stock m arket ne eds pol icy confirmation. While t he m acro stability backdrop is u ndeniably w eak, we be lieve the m arket is focusing on macro and policy de velopments as a ( positive) inflection po int. We would look at several catalysts for entry into the stock market, including:1) A peak in inflation, which will benefit from more favorable base c omparisons in March/April 11; 2) F urther currency de valuation (most likely post-Lunar New Year); and 3) More overt policy signals on a shift toward stability (such as further interest rate hikes).
Table 1: Vietnam Market Statistics 2011YTD HOSE HASTC
Index 519.50 (+7.2%) 107.87 (-5.6%) Daily T/O (US$MM) 50.374 25.74 Market cap (US$B) 32.687 6.171 Number of stocks 279 373 2010 Market P/E 11.81 6.92 Exchange (VND/US$) 19498 O/N interbank (%) 7.2
Source: Bloomberg.

Asia Pacific Equity Research 21 January 2011
Bank of Ayudhya
Overweight BAY.BK, BAY TB
Results slightly below expected on lower non-NII: loan growth & NIM above expectation
Price: Bt25.75
Price Target: Bt30.00
Thailand Banks
Anne JirajariyavechAC (66-2) 684-2684 [email protected]
JPMorgan Securities (Thailand) Limited
Sunil Garg (852) 2800-8518 [email protected]
J.P. Morgan Securities (Asia Pacific) Limited
18
24
30
Bt
Jan-10 Apr-10 Jul-10 Oct-10 Jan-11
Price Performance
BAY.BK share price (Bt)SET (rebased)
YTD 1m 3m 12mAbs 1. 0% 9.6% 4.3% 26.8%Rel 2. 9% 8.0% 0.9% -12.9%
Company data52 Wk Range 28.25-18.00Market cap (Bt mn) 162,483Market cap (USD MM) 5,334Share O/S (MM) 6,074Free Float (%) 67.1Ave. daily volume (MM) 50.1Ave. daily Value (Bt MM) 585Exchange rate 30.46Index 1, 025Year-end DecSource: Bloomberg. Price date 20 Jan 2011
• BAY’s NP came in at Bt8.8 billion for FY10 growing 32% Y/Y. This was 4% lower than our expectation due to lower-than-expected fee income and slightly higher opex. BAY’s NP for 4Q10 was Bt2.3 billion (+32% Y/Y, -3% Q/Q).
• Strong loan growth (similar to other banks), +6% Q/Q and +8% for FY10. NIM expanded 17bp Q/Q to 5.14%, driven by 17bp Q/Q reduction in funding cost.
• Non-NII dropped 5% Y/Y and -21% Q/Q, weaker than peers. We have to touch base with the bank on what drives the lower non-NII. Opex grew 35% Y/Y and 19%, partly due to more marketing and promotion expenses.
• Asset quality improved substantially with NPLs declined 20% Q/Q to Bt23 billion or 3.6% of loans (from 5.7% at YE09). Coverage ratio strengthened to 88% (from 72% at YE09). Credit cost was relatively flat at 193bp.
• We maintain our forecast and expect strong EPS growth of 28% in FY11E driven by revenue growth and credit cost reduction.
• We maintain OW rating on BAY with Dec11 PT at Bt30 based on DDM approach with 15.0% ROE, 12.0% COE, and 8.0% growth. Risks are rising competition in second hand car lending and auto cash as well as funding cost pressure in the rising interest rate environment.
Bank of Ayudhya earnings results summary (Bloomberg: BAY TB Reuters:BAY.BK) Earnings revision and valuation Bt millions (per sh. data in Bt) 4Q10 4Q09 Y/Y 3Q10 Q/Q 2011E 2012ELoan growth 6.3% 8.3% -1.2% Old EPS (Bt) 1.9 2.5 NIM 5. 14% 4.65% 49 4.96% 17 New EPS (Bt) 1.9 2.5 Credit cost 1.93% 2.08% (15) 1.96% (3) % change 0% 0%Non-NII 2, 643 2,779 -5% 3,323 -20% P/E (x) 13.9 10.6 PPOP 4, 258 4,869 -13% 5,826 -27% ROE (%) 11.5% 13.9%Net profit 2,261 1, 708 32% 2,331 -3% P/B (x) 1.5 1.4 EPS 0.4 0.3 32% 0.4 -3% Dec11 PT 30 Source: Company, J.P. Morgan estimates.

Asia Pacific Equity Research 21 January 2011
Bangkok Bank
Neutral BBLf.BK, BBL TB
NP in-line; strong loan growth in Dec10
Price: Bt164.00
Price Target: Bt165.00
Thailand Banks
Anne JirajariyavechAC (66-2) 684-2684 [email protected]
JPMorgan Securities (Thailand) Limited
Sunil Garg (852) 2800-8518 [email protected]
J.P. Morgan Securities (Asia Pacific) Limited
25,000
40,000
55,000
Rp
Jul-09 Oct-09 Jan-10 Apr-10 Jul-10
Pr ice Per fo rman ce
ASII.JK share price (Rp)JCI (rebased)
YTD 1m 3m 12m Abs 5.3% 8.1% 9.9% 233.8% Rel 4.1% 9.9% 6.8% 138.4%
Company data 52 Wk Range 169.50-105.00 Market cap (Bt mn) 311,141 Market cap (USD MM) 10,215 Share O/S (MM) 1,909 Free Float (%) 97.8 Ave. daily volume (MM) 5.1 Ave. daily Value (Bt MM) 456 Exchange rate 30.46 Index 1,025 Year-end Dec Source: Bloomberg. Price date 20 January 2011
• BBL’s NP came in at Bt24.6 billion, in-line with our expectation, +20% Y/Y. The bank’s 4Q10 NP at Bt5.6 billion dropped 5% Y/Y and 9% Q /Q. PPOP a t B t9.4 billion for 4Q 10 w as 13 % h igher Q /Q bu t dropped 4% Q/Q due to seasonality in opex (+14% Q/Q).
• Strong loan growth achieved in Dec10. BBL recorded F Y10 l oan growth of 9.9%. In 4Q10 alone loan g rowth was very s trong a t 7.7%. This w as dr iven by bot h seasonal w orking cap ital d emand as w ell a s long-waited corporate term loan demand. This was hugely above market expectation (growth consensus around 4-5% for FY10).
• Flat NIM. As l oan growth came just in Dec10, it h as yet t o generate significant i nterest i ncome. This ha s an impact on NIM w hich was a t 2.99% for the quarter, flat Q/Q. Loan yield was up 11bp due to interest rate hi ke. F unding c ost, however, w ent up by 13bp w ith r ising s hort-term borrowing cost. LDR edged higher to 90% from 84% a year ago. This remains lower than peers but BBL always prefers having low LDR.
• Non-NII growth continued to lag its peers. Total op. Non-NII g rew 7% Y/Y and Q/Q (FY10 grew 5%). Fee income a lone grew 10% Y/Y and 4% Q /Q ( +8% f or F Y10). This i s st ill c onsidered lagged performance. This is due to the bank’s lower exposure in the retail area.
• NPL declined to 3.0% (from 4.4% YE09) with coverage ratio very high at 160% (from 117% at YE09).
• Early adoption of TAS 19 (employee be nefit) resulting i n approximately Bt4 bi llion decrease in shareholders’ equity. There i s no significant P&L impact. Tier 1 capital ratio remains strong at 12.5%.
• We will revisit our forecast given the s tronger-than-expected l oan growth.
• We maintain Neutral on BBL with Dec11 PT at Bt165 which is based on D DM a pproach w ith 1 3.4% R OE, 12.0% C OE, a nd 7.0% g rowth. Risks are weaker than expected loan growth. On the upside, risk is higher than expected working capital ahead of rising interest rate.
Bangkok Bank earnings results summary (Bloomberg: BBL TB; Reuters: BBL.BK) Earnings revision and valuation Bt millions (per sh. data in Bt) 4Q10 4Q09 Y/Y 3Q10 Q/Q 2011E 2012E Loan growth 7.7% 3.9% -0.5% Old EPS (Bt) 13.0 14.7 NIM 2.99% 2.93% 6 3.00% (1) New EPS (Bt) 13.0 14.7 Credit cost 0.57% 0.56% 1 0.58% (2) % change 0% 0% Non-NII 5,774 5,374 7% 5,393 7% P/E (x) 12.5 11.1 PPOP 9,434 8,344 13% 9,827 -4% ROE (%) 11.3% 11.9% Net profit 5,649 5,917 -5% 6,174 -8% P/B (x) 1.4 1.3 EPS 3.0 3.1 -5% 3.2 -8% Dec11 PT 165 Source: Company, J.P. Morgan estimates.

Asia Pacific Equity Research 22 January 2011
Bank of India
Overweight BOI.BO, BOI IN
Strong improvement in asset quality
Price: Rs432.55
Price Target: Rs590.00
India Banks
Adarsh ParasrampuriaAC
(91-22) 6157-3576 [email protected]
J.P. Morgan India Private Limited
Seshadri K Sen, CFA (91-22) 6157-3575 [email protected]
J.P. Morgan India Private Limited
Sunil Garg (852) 2800-8518 [email protected]
J.P. Morgan Securities (Asia Pacific) Limited
300
450
600
Rs
Jan-10 Apr-10 Jul-10 Oct-10 Jan-11
Pr ice Per fo rman ce
BOI.BO share price (Rs)BSE30 (rebased)
YTD 1m 3m 12m Abs 2.1% 2.2% -16.3% 35.6% Rel 9.7% 7.4% -10.1% 24.1%
Bank of India (Reuters: BOI.BO, Bloomberg: BOI IN) Year-end Mar (Rs in mn) FY09A FY10A FY11E FY12E FY13E Operating Profit 47,107 41,112 55,290 63,064 75,704 Net Profit 30,073 17,411 27,323 34,478 42,029 Cash EPS (Rs) 57.14 33.11 51.95 65.56 79.92 Fully Diluted EPS (Rs) 42.96 21.82 48.15 60.80 75.16 DPS (Rs) 8.00 7.00 7.79 9.83 11.99 EPS growth (%) 49.5% (42.1%) 56.9% 26.2% 21.9% ROE 29.2% 14.2% 19.6% 20.9% 21.4% P/E 8.1 13.9 8.9 7.0 5.8 BVPS (Rs) 223.90 243.41 286.25 340.30 406.19 P/BV 2.1 1.9 1.6 1.4 1.1 Div. Yield 1.7% 1.5% 1.7% 2.1% 2.6%
52-wk range (Rs) 589.00 - 308.85 Market cap (Rs mn) 227,165 Market cap ($ mn) 4,989 Shares outstanding (mn) 525 Fiscal Year End Mar Price (Rs) 432.55 Date Of Price 20 Jan 11 Avg daily value (Rs mn) 163.1 Avg daily value ($ mn) 3.6 Avg daily vol (mn) 0.2 BSE30 19,008 Exchange Rate 45.54
Source: Company data, Bloomberg, J.P. Morgan estimates.
• Strong 3Q FY11: Bank of India reported net profit of Rs6.5B, up 61% y/y. Profits were marginally lower than our estimates as provisions were affected by a one -off de rivative loss of Rs2.0B. Asset quality improvement was strong, although the recent ou tperformance has reduced the valuation gap with peers.
• Good improvement in asset quality: Gross NPAs fell in 3Q given the large upg rade, bu t ov erall a sset qua lity i mproved a lso be cause o f significantly lower gross slippages at <1.0% vs 1.6% in 1H FY11. As a result, c redit c osts de creased t o ~ 70bp from ~ 1.0% in 1H FY11 a nd provision c overage i mproved by ~500bp. Management e xpects t he positive asset quality momentum to continue.
• Margin surprises: BOI’s N II i ncreased 12% q /q, with m argins improving t o 3.09% , up ~28bp q/q, given the l ow ba se i mpact a s margins in 2Q FY11 were af fected by a one-off. The ~ 30bp margin improvement w as m uch b etter t han expected, but we exp ect margin pressure over the next 2-3 quarters given the increase in funding costs.
• Some concerns: (1) The p ension liability (Rs40-45B), though not y et finalized, is higher than expected. (2)>20% growth with current tier-1 at ~8.5% could lead to dilution over the medium term. (3) Management’s increasing focus on SME/Agri/Retail to improve yields cou ld lead to asset quality risks over the medium term.
• Maintain Overweight: Our upgrade on BOI was based on a revival in asset qu ality and r elatively at tractive v aluations. Asset q uality improvement was indeed strong in 3Q, which should help profitability. With the recent ou tperformance, the valuation gap w ith P NB/BOB has narrowed to ~10%. However, our Sep-11 price target of Rs590 for BOI still implies considerable absolute upside. We maintain our Overweight rating on BOI.

Asia Pacific Equity Research 23 January 2011
China Railway Construction Corporation Limited
Overweight 1186.HK, 1186 HK
Improved protection for minority shareholder may help shift focus back to fundamentals and attractive valuation - ALERT
Price: HK$9.72
21 January 2011
Infrastructure
Karen Li, CFAAC
(852) 2800-8589 [email protected]
J.P. Morgan Securities (Asia Pacific) Limited
Other key takeaways from the call 1) Railway investments are expected to stay at high levels, with an annual capex no less than Rmb700 billion (for civil works only) in 2011-2015, based on recent remarks by key government officials; 2) CRCC is confident in achieving a 40~45% share in railway new orders; 2) CRCC’s new contracts received during 2010 exceeded the annual target set previously. 3) Management expects limited impact on margin from the rising raw material costs given most of the contracts have cost-plus formulas; in some contracts, it is customers which are responsible for procurement o raw materials. 4) CRCC and its consortium is bidding for the high speed railway project in the US, although the bid is not yet finalized.
Trading of CRCC’s A share and H- share was suspended from Jan. 20. We participated in the analyst conference call at 10 am hosted by the company on Jan. 22 (Saturday). CRCC's trading will resume on Jan. 24. Key takeaway from the call: • Transferring the Mecca Light Rail Project back to the parent,
reducing the loss to Rmb1.385 billion at most, with the difference against the provision made reflected through the balance sheet (Table 1 for details related to the loss and compensation).
1) All obligations related to the Mecca project has been transferred back to the parent, with Oct. 31 2010 as the cut off date.
2) Furthermore, CRCC will receive cash compensation in an amount of Rmb2.077 bi llion from t he pa rent to be pa id i n s everal installments with full settlements no later than mid-2014.
3) Against the write-off i t h as a lready m ade L TD i n a n a mount of Rmb4.1 bi llion ( of w hich Rmb0.294 bi llion w as boo ked i n 2009 and Rmb3.854 billion in 2010), CRCC’s loss would be reduced to a maximum of Rm1.385 billion, while a w rite-back on t he difference of R mb2.763 bi llion ( including t he cash compensation of Rmb2.077 billion to be received from the parent and a reversal on the es timated future loss o f R mb0.686 bi llion pr eviously booked) will be reflected through the balance sheet (accounted for as "capital surplus").
4) Meanwhile, C RCC i s e ntitled t o first c laim of a ny f uture compensation obtained from the Mecca project as an offset against the remaining loss of Rmb1.385 billion;
5) CRCC is also entitled to any compensation exceeding the parent’s payment of R mb2.077 bi llion and t he s ubsequent loss (if a ny), which will be reflected through the income statement as a gain.
• Minority shareholders’ interest should be better protected now through the proposed arrangement for the Mecca project, while CRCC ensures it has exercised more stringent risk control in executing its overseas contracts: Trading i s e xpected t o r esume on Jan.24. The ne ws should com e down as a pos itive in our v iew, particularly in light th at t he e ntire s ector ha s de -rated since end -Oct-2010, taking i nto account C RCC’s f allout i n S audi A rabia. More importantly, management at the analyst call ensured that it has exercised extra caution with overseas projects, with commercial interest as key consideration, which may reduce concerns that the companies are simply acting as government utility. Maintain OW on CRCC, CRG and CSR.
Asia Pacific Equity Research 21 January 2011
Dish TV
Overweight DSTV.BO, DITV IN
Strong sub additions and ARPU expansion continue
Price: Rs61.05
Price Target: Rs79.00
India Mid-Cap
Princy SinghAC
(91-22) 6157 3587 [email protected]
Dinesh S. Harchandani, CFA (91-22) 6157-3583 [email protected]
J.P. Morgan India Private Limited
30
50
70
Rs
Jan-10 Apr-10 Jul-10 Oct-10 Jan-11
Pr ice Per fo rman ce
DSTV.BO share price (Rs)BSE30 (rebased)
YTD 1m 3m 12m Abs -14.7% -8.6% 9.9% 26.7% Rel -7.1% -3.4% 16.1% 15.2%
Dish TV (Reuters: DSTV.BO, Bloomberg: DITV IN) Rs in mn, year-end Mar FY09A FY10A FY11E FY12E FY13E Adjusted EPS (Rs) -10.02 -3.19 -2.29 -0.16 1.10 EPS growth (% ) 1% -68% -28% -93% -805% Revenue 7,377 10,848 13,589 18,289 21,412 Net Profit -4,763 -2,621 -2,441 -166 1,169 DPS (Rs) 0.00 0.00 0.00 0.00 0.00 Revenue growth (% ) 78.5% 47.1% 25.3% 34.6% 17.1% EBITDA -1,350 947 2,226 5,299 6,830 EBITDA margin -18.3% 8.7% 16.4% 29.0% 31.9% P/E (x) -6.1 -19.1 -26.6 -391.4 55.5 P/BV (x) 8.3 3.1 4.0 46.5 26.7 EV/EBITDA (x) -47.2 59.9 26.9 11.4 8.5 Dividend Yield 0.0% 0.0% 0.0% 0.0% 0.0%
Shares O/S (mn) 1,064 Market cap (Rs mn) 64,952 Market cap ($ mn) 1,426 Price (Rs) 61.05 Date Of Price 21 Jan 11 Free float (% ) 34.1% 3-mth trading value (Rs mn) 153.5 3-mth trading value ($ mn) 3.4 3-mth trading volume (mn) 3.7 BSE30 19,008 Exchange Rate 45.54 Fiscal Year End Mar
Source: Company data, Bloomberg, J.P. Morgan estimates.
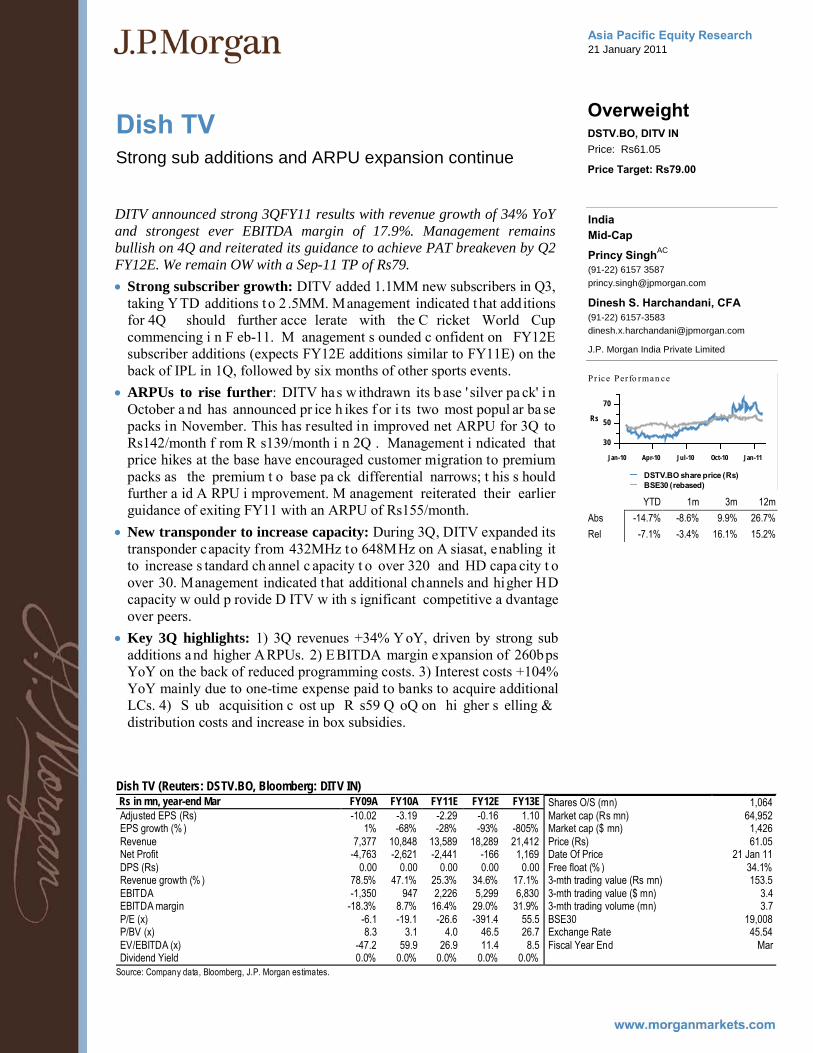
DITV announced strong 3QFY11 results with revenue growth of 34% YoY and strongest ever EBITDA margin of 17.9%. Management remains bullish on 4Q and reiterated its guidance to achieve PAT breakeven by Q2 FY12E. We remain OW with a Sep-11 TP of Rs79. • Strong subscriber growth: DITV added 1.1MM new subscribers in Q3,
taking YTD additions t o 2 .5MM. Management indicated t hat additions for 4Q should further acce lerate with the C ricket World Cup commencing i n F eb-11. M anagement s ounded c onfident on FY12E subscriber additions (expects FY12E additions similar to FY11E) on the back of IPL in 1Q, followed by six months of other sports events.
• ARPUs to rise further: DITV has w ithdrawn its b ase ' silver pa ck' i n October a nd has announced pr ice h ikes f or i ts two most popul ar ba se packs in November. This has resulted in improved net ARPU for 3Q to Rs142/month f rom R s139/month i n 2Q . Management i ndicated that price hikes at the base have encouraged customer migration to premium packs as the premium t o base pa ck differential narrows; t his s hould further a id A RPU i mprovement. M anagement reiterated their earlier guidance of exiting FY11 with an ARPU of Rs155/month.
• New transponder to increase capacity: During 3Q, DITV expanded its transponder capacity f rom 432MHz to 648MHz on A siasat, enabling it to increase s tandard ch annel c apacity t o over 320 and HD capa city t o over 30. Management indicated that additional channels and higher HD capacity w ould p rovide D ITV w ith s ignificant competitive a dvantage over peers.
• Key 3Q highlights: 1) 3Q revenues +34% YoY, driven by strong sub additions and higher ARPUs. 2) EBITDA margin expansion of 260bps YoY on the back of reduced programming costs. 3) Interest costs +104% YoY mainly due to one-time expense paid to banks to acquire additional LCs. 4) S ub acquisition c ost up R s59 Q oQ on hi gher s elling & distribution costs and increase in box subsidies.

Asia Pacific Equity Research 21 January 2011
HTC Corp
Overweight 2498.TW, 2498 TT
Set to take off
Price: NT$888.00
Price Target: NT$1,100.00
Taiwan Technology
Laura ChenAC
(886-2) 2725-9867 [email protected]
J.P. Morgan Securities (Taiwan) Limited.
Alvin Kwock (852) 2800-8533 [email protected]
J.P. Morgan Securities (Asia Pacific) Limited
Ashish Gupta (91-22) 6157-3284 [email protected]
J.P. Morgan India Private Limited
200
500
800NT$
Jan-10 Apr-10 Jul-10 Oct-10 Jan-11
Pr ice Per fo rman ce
2498.TW share price (NT$)TSE (rebased)
YTD 1m 3m 12m Abs -3.6% 1.1% 28.3% 141.0% Rel -2.8% -0.3% 18.2% 130.8%
• Guidance inline, we see upside potential. HTC hos ted i ts a nalyst meeting t oday. The management guided 8.5m uni ts s hipment i n 1Q 11 (down 7 % Q oQ) w ith s ales o f N T$9.4bn ( down 10 % Q oQ). Due t o increased higher-end product shipments, they expect gross margin to be substantial at 29-30%. OPEX ratio is guided to be 14-15%, also in line with our e stimate of 14.8 %. Due to the strong demand i n i ts existing product and new product kicking off in late 1Q, we see upside potential to its 1Q shipment/sales.
• 4G and dual core product help to sustain ASP and margin. During 4Q10, H TC s aw 6% A SP i ncrease on the ba ck of i ts s trong hi gh-end product de mand, such as Desire H D, Desire Z and Desire. Thanks t o Verizon, AT&T and Sprint’s push on 4G service, we expect 4G product (including L TE, W imax a nd H SPA+) t o c ontribute 15 -20% of H TC’s 2011 s ales. I n a ddition, t he c ompany w ill i ntroduce its f irst du al c ore product c alled “Pyramid" in e arly 2Q . T his m odel will b e w ith 4.3” touch s creen, 1080p full HD a nd HDMI s upport. We e xpect to see i ts ASP to trend up with stable margin outlook.
• Enter “the 3rd branding phase” Management is bul lish on smartphone industry growth and is set to accelerate its branding business with b etter i nventory/component m anagement, c hannel/capacity expansion and brand preference. We expect HTC will further gain share cross the region and see more upside from both Europe and Asia.
• Strong earnings growth with attractive valuation; Overweight. We stay pos itive on H TC a nd e xpect t he c ompany to r egister s trong sales/earnings growth with plenty of new product launches in late 1Q11. HTC is trading at 11x FY11 EPS with almost 70% earning growth on our estimates, we r emain Overweight w ith Dec-11 P T N T$1,100 ba sed on 14x/12x FY11E/12E earnings. Key r isks to our PT include a decline in smartphone demand, and higher margin/ASP pressure from competition.
. Table 1: 1Q11 comparison NT$ millions 1Q11 (JPM) Consensus 1Q11 Guidance Comments Net Sales 103,674 86,999 NT$94 bn, 147% YoY Gross Profit 31,362 25,740 Operating profit (EBIT) 16,065 13,392 New Taiwan GAAP Net Profit 14,255 12,881 New TW GAAP EPS 17.43 13.1 Shipments (mn units) 10.0 8.5 mn units, 157% YoY Margins (%) Gross Margin 30.25 29.59 29.5±0.5 Operating margin 15.50 15.39 Opex Ratio of 14.5±0.5 New Taiwan GAAP Net margin 13.75 14.81
Source: Company reports, Bloomberg and J.P. Morgan estimates.

Asia Pacific Equity Research 23 January 2011
Hyundai Motor Company
Overweight 005380.KS, 005380 KS
4Q10 preview: mix improvement and strong equity method gain
Price: W185,500
Price Target: W210,000
South Korea Automobile Manufacture
Wan Sun ParkAC
(82-2) 758-5722 [email protected]
Gon Suk Lee (82-2) 758 5710 [email protected]
J.P. Morgan Securities (Far East) Ltd, Seoul Branch
80,000
140,000
200,000
W
Jan-10 Apr-10 Jul-10 Oct-10 Jan-11
Pr ice Per fo rman ce
005380.KS share price (W )KOSPI (rebased)
YTD 1m 3m 12m Abs 4.8% 4.5% 14.2% 70.2% Rel 4.8% 2.9% 3.8% 50.0%
Bloomberg JPMA WPARK <GO>
• We expect HMC’s 4Q10 result likely to be a record high one despite production disruption in U lsan p lant. We ex pect r evenue to c ome in at W9.7T ( +0.6% YoY; + 9.7% Qo Q), OP at W877B ( +4.5% Y oY; + 16.4% Q oQ), a nd N P at W1.4T (+49.8% YoY; +4.8% QoQ). (1) Production decline to impact top-line. Production disruption in Ulsan plant will lead to 5% YoY decline in 4Q Korea plant shipment to 455,052 units (+8% QoQ). (2) Mix improvement to support profit. However, we estimate 4Q10 revenue and OP to rise slightly by 1% and 5% YoY, r espectively, du e t o i mproved mix. % of a bove m id-sized v ehicles which rose to 53% of the Korea plant shipment, an increase from 49% in 4Q09 and 50% i n 3Q 10. We noted that domestic mix d eteriorated, b ut strong SUV export (Tucson and Santa Fe) lifted the mix, leading to OP margin expansion to 9% (vs. 8.7% in 4Q09 and 8.5% in 3Q10). (3) Strong NP boosted by equity method income. We ex pect n et eq uity i ncome o f W 800B, + 54% YoY, o n contributions from KIA and China/US subsidiaries.
• Short-term share price expectations. W e ex pect January’s s easonally weak retail sales in US a nd China, inert M/S mo vement could lead t o jitters in the share price. Since Jan 14 of record high share price (W200,500 or 9.4x 2011 PER), share price has declined 8%, with valuation falling to 8.7x vs. 9.7x by global peers. We expect share price rebound towards latter half of the 1Q11 as (1) s trong new model l aunchings i n Korea will l ead to e xpansion i n domestic market share; (2) Two o ut o f top 3 volume seller o f HMC in US, i .e. Avante and Accent, will be selling from end January; (3) competitors launch schedules and earnings recovery are going to be still quiet during 1Q11.
• Concerns for 2011. However, (1) We co ntinue t o s ee H MC’s o perating leverage pe aking ou t with over 100% u tilization. ( 2) S uperiority i n Y oY earnings growth i s al so f ading co mpared t o g lobal p eers ( table 4). We n otice competitors are just beginning to enjoy operating leverage and resuming model cycles. In expectations of changing global OEM production growth dynamics in 2H11 and onwards, we reiterate our p reference for selective auto parts makers and tires. Our top picks are Mando and Hankook Tire. We maintain OW and PT of W210,000 (June-2011) for HMC, which is based on 10x 2011E EPS. Risks include US/Europe market volatilities; sharp fluctuations in F/X rates.
Hyundai Motor: (Reuters: 005380.KS; Bloomberg: 005380 KS) Won in billions, year-end December
FY09A FY10E FY11E FY12E Sales (W Bn) 31,859 36,544 39,572 42,444 52-week range W203,000-104,000 Net profit (W Bn) 2,962 5,296 5,816 6,325 Market cap W40,861B EPS (W) 10,890 19,476 21,387 23,257 Market cap US$36,350MM Sales growth (%) -1.0% 14.7% 8.3% 7.3% Shares issued 220.3MM EPS growth (%) 104.5% 78.8% 9.8% 8.7% Free float 62.9% ROE (%) 15.6% 23.3% 20.7% 18.7% Avg daily value W164.B ROCE (%) 14.6% 18.4% 15.8% 14.1% Avg daily value US$145.9MM P/E (x) 17.0 9.5 8.7 8.0 Avg daily volume 0.9MM shares P/B (x) 1.8 1.4 1.2 1.0 KOSPI 2,069.9 EV/EBITDA (x) 9.8 7.6 7.0 6.2 Exchange Rate W1,124.1/US$ Source: Bloomberg, J.P. Morgan estimates. Price as of Jan 21, 2011

Asia Pacific Equity Research 21 January 2011
ITC Limited
Overweight ITC.BO, ITC IN
Q3FY11 : strong quarter; encouraging cigarette volume growth trends
Price: Rs169.00
Price Target: Rs190.00
India Tobacco
Latika Chopra, CFAAC
(91-22) 6157-3584 [email protected]
J.P. Morgan India Private Limited
110
140
170
Rs
Jan-10 Apr-10 Jul-10 Oct-10 Jan-11
Pr ice Per fo rman ce
ITC.BO share price (Rs)NIFTY (rebased)
YTD 1m 3m 12m Abs -3.4% 1.0% -3.1% 38.2% Rel 3.5% 5.0% 1.4% 26.1%
• Q3FY11 earnings 5% above estimates: Net s ales, EBITDA, and P AT grew 19%, 19%, and 2 1% y /y, respectively. H igher-than-estimated cigarette, agri and other FMCG business revenues led to sales coming in 4% above our e xpectations. However, EBITDA wa s in line w ith our expectations as l ower ( than estimated) margins f or c igarette and paper business of fset margin ga ins f or a gri a nd hot el bus iness. H igher ot her income ( supported t o s ome e xtent by s ale of s ome i nvestments) l ed t o higher PAT growth.
• Cigarette vol growth trends are encouraging with revenues rising 18.4% y/y and we estimate volume growth contributing 2-3% to the same (vs. c-2% vol growth during 1HFY11). However, margins were marginally weak (-30bp y/y) during Q 3FY11. Importantly, product m ix c hanges r emain encouraging and r ecent pr ice hikes unde rtaken by the c ompany should be positive f or margins i n c oming qua rters. Lower pr ocurement c osts f or tobacco (c-10% y/y) should further support FY12 margins.
• Non-tobacco business: A mixed bag: Agri bus iness pos ted impressive performance driven by higher trading of coffee & soya and better margins for leaf tobacco. While revenue growth for Other FMCG was healthy, losses increased sequentially due to expenses on new launches (noodles, skin care) and firm input costs. Hotel division reported modest recovery with improved ARRs (+8-10% y/y) and higher occupancy levels (65-68%). Paper business performance w as s ubdued due t o one -off pi peline c orrection i n v iew of uncertainty related to change in pictorial warning for cigarette packaging.
• Tobacco and taxes: Over the next few days there will probably be a debate on the extent of excise duty hikes l ikely on c igarettes, particularly against the backdrop of a strained fiscal situation. As demand trends are healthy, we believe the industry can absorb an excise duty hike of up to 10% (implying price hi ke of 4 -6%) w ithout i mpacting de mand m eaningfully. A t c onstant prices, the current sensitivity to earnings of excise duty is 1%.
• Maintain OW: We expect ITC to deliver EPS CAGR of 18% over FY10-13E. I t i s our preferred pi ck in consumer s taples sector and in the current volatile market, should do relatively better.
Bloomberg: ITC IN; Reuters: ITC.BO Rs mn, year end Mar FY09 FY10 FY11E FY12E FY13E Net sales 156,119 181,532 212,304 248,820 289,756 52-week range (Rs) 112-185 Net profit 32,636 40,610 49,231 58,383 67,509 Market cap (Rs B) 1298 EPS (Rs) 4.3 5.3 6.4 7.6 8.8 Market cap (US$ B) 28.5 DPS (Rs) 1.9 5.0 3.0 3.5 4.5 Shrs outsting (MM) 7683 Net sales growth (%) 12% 16% 17% 17% 16% Free float (%) 68 Net profit growth (%) 5% 24% 21% 19% 16% Avg daily value (Rs MM) 1197 EPS growth (%) 5% 23% 21% 19% 16% Avg daily value (US$ MM) 26.3 ROE (%) 24% 29% 34% 33% 33% Avg dly volume (MM shs) 7.9 P/E (x) 39.1 31.8 26.3 22.1 19.2 Exchange rate (Rs/US$) 45.6 EV/EBITDA (x) 24.5 19.2 16.0 13.2 11.3 BSE sensex 19008 Dividend yield 1.1% 2.9% 1.7% 2.0% 2.6%
Source: Bloomberg, Company reports and J.P. Morgan estimates.

Asia Pacific Equity Research 23 January 2011
Mapletree Logistics Trust
Neutral MAPL.SI, MLT SP
FY10 results review - better growth
Price: S$1.00
Price Target: S$1.00
Singapore REITs
Joy WangAC
(65) 6882-2312 [email protected]
Christopher Gee, CFA (65) 6882-2345 [email protected]
J.P. Morgan Securities Singapore Private Limited
0.70
0.85S$
Jan-10 Apr-10 Jul-10 Oct-10 Jan-11
Pr ice Per fo rman ce
MAPL.SI share price (S$)FTSTI (rebased)
YTD 1m 3m 12m Abs 3.6% 5.3% 9.9% 25.9% Rel 5.2% 3.9% 9.2% 14.2%
Unit data 52-week range S$0.75 - 1.00 Market cap (S$MM) 2,414 Market cap (US$MM) 1,880 Shares outstanding (MM) 2,426 Date of price 21-Jan-11 Avg daily value (S$MM) 1.2 Avg daily value (US$MM) 1.0 Avg daily volume (shares) 1.3 FSSTI 3,185 Exchange rate S$1.284/US$ Source: Bloomberg
• MLT announced 4Q FY10 results, w ith 4Q D PU of S $0.0155/ un it and F Y10 D PU o f S $0.0609/unit, a nnualizing a t a 6 .3% y ield, i n line with J.P. Morgan and consensus estimates. Rental r evenue grew 12% Q/Q a nd 6% Y /Y on the ba ck of improvement i n r ental r ates a nd contributions from ne wly acquired p roperties, w hile D PU grew by a modest 1% as a result of the impact of dilution from recently completed equity fundraising. Portfolio value recorded 1% revaluation gain of S$32mn i n F Y10 v s. 1 % loss in F Y09. B ook v alue stood f lat Y /Y in FY10 at S$0.085/ unit. The trust will trade ex dividend on 26 Jan 2011.
• Better organic growth outlook. Occupancy r ates a cross t he po rtfolio remained strong at 98% in Dec 10, with Malaysia recording an increase of 5% to 99% in 4Q10, in line with the pick up in the physical market. This, along w ith positive rental reversion across the portfolio on the back of h igher demand, resulted in an organic growth of 2% in 4Q10. Management indicated that strong rental reversion should continue with better physical market outlook.
• Inorganic growth the key focus areas for FY11. MLT completed 14 acquisitions in FY10, with NPI yield ranging from 7-10%. Management indicated t hat the g roup w ill c ontinue i ts inorganic g rowth s trategy i n 2011, bu t n ote a 5 0bps potential cap rate com pression. Besides t his, management indicated that it is in negotiations for 3-4 built-to-suit (BTS) opportunities w orth US$300-500mn i n Singapore, which w ould allow the trust to open new avenues of growth in the long run, in our view.
• We retain our Neutral rating on MLT, with Dec-11 DDM based price target unchanged for now at S$1.00/unit. Key upside risks to our rating and price target include better-than-expected operating performance and management's ability to announce sizable accretive deals. Key downside risks i nclude cu rrency f luctuations a s w ell as a po tential i ncrease i n borrowing cost from the current 2.3% level.
Mapletree Logistics Trust: summary of FY10 results S$ in millions, otherwise specified 4Q10 3Q10 % Q/Q 4Q09 % Y/Y FY10 FY09 % Y/Y JPM FY10E % change Gross revenue 61.1 54.5 12% 50.8 20% 218.9 206.8 6% 231.0 -5% Property expenses 7.2 6.9 4% 5.8 23% 25.8 25.9 0% 29.0 -11% Net property income 53.8 47.6 13% 44.9 20% 193.0 180.8 7% 202.0 -4% Borrowing costs 7.6 7.5 1% 7.6 0% 29.2 33.2 -12% 34.2 -15% Distributable income 36.8 31.5 17% 31.8 16% 130.1 117.9 10% 129.9 0% DPU (S¢) 1.55 1.54 1% 1.59 -3% 6.09 6.02 1% 6.05 1% Source: Company data, J.P. Morgan estimates
Asia Pacific Equity Research 23 January 2011
Neowiz Games Corp.
Overweight 095660.KS, 095660 KS
Lawsuit result is slightly positive - ALERT
Price: W44,550
21 January 2011
Internet
Sungmin Chang, CFAAC
(82-2) 758-5719 [email protected]
Gon Suk Lee (82-2) 758 5710 [email protected]
J.P. Morgan Securities (Far East) Ltd, Seoul Branch
Bloomberg JPMA CHANG <GO>
• Seoul Central District Court ruled on Friday that Neowiz Games owes Game Holdings, a private equity that owns 25.9% of Neowiz’s Japanese subsidiary G ameOn, W 74.8b f or the breach of c ontract. N eowiz ha d provided G ame H oldings with a pu t ba ck opt ion o n t heir s take but honoring the commitment was not possible under Japanese law. As such, Game Holdings brought the case to court in Jan 2010. Both parties can appeal within two weeks of the court decision.
• This is s lightly pos itive development f or the Neowiz i n t he sense t hat Game Holdings sued for W97.4b and uncertainties are now behind them. As Neowiz had W117b in net cash as of 3Q10, they don‘t need financing to m ake t he pa yment. G iven 2011E E BITDA of W 137b, w e believe Neowiz will be able to maintain net cash balance going forward.
• We maintain OW and our price target is based on 2011E PE of 12.3X. We no te that the s tock i s now t rading a t on ly 8.7 X 2011E P E against 22% revenue and 33% EPS growth this year. We believe the multiples could expand on ( 1) improving e arnings v isibility on diversifying revenue composition; (2) narrowing revenue gap with larger peers; (3) an expected i ncrease i n g ame I Ps v ia acqu isitions as w ell as i nternal development on the back of growing in-house R&D personnel.

Asia Pacific Equity Research 22 January 2011
Punjab National Bank
Overweight PNBK.BO, PNB IN
3Q11: NII growth strong, but asset quality disappoints
Price: Rs1,125.35
Price Target: Rs1,525.00
India Banks
Adarsh ParasrampuriaAC
(91-22) 6157-3576 [email protected]
J.P. Morgan India Private Limited
Seshadri K Sen, CFA (91-22) 6157-3575 [email protected]
J.P. Morgan India Private Limited
Sunil Garg (852) 2800-8518 [email protected]
J.P. Morgan Securities (Asia Pacific) Limited
700
1,000
1,300
Rs
Jan-10 Apr-10 Jul-10 Oct-10 Jan-11
Pr ice Per fo rman ce
PNBK.BO share price (Rs)BSE30 (rebased)
YTD 1m 3m 12m Abs -6.7% -5.3% -12.0% 29.1% Rel 0.4% -1.1% -7.8% 20.1%
Punjab National Bank (Reuters: PNBK.BO, Bloomberg: PNB IN) Year-end Mar (Rs in mn) FY09A FY10A FY11E FY12E FY13E Operating Profit 50,779 65,206 88,348 102,347 123,094 Net Profit 30,889 39,055 44,030 55,456 66,852 Cash EPS (Rs) 97.97 123.87 139.64 175.88 212.03 Fully Diluted EPS (Rs) 84.26 106.96 133.37 169.60 205.75 DPS (Rs) 20.00 22.00 26.40 31.68 38.02 EPS growth (%) 50.8% 26.4% 12.7% 26.0% 20.5% ROE 25.8% 26.6% 24.6% 25.4% 25.1% P/E 11.5 9.1 8.1 6.4 5.3 BVPS (Rs) 416.74 514.09 622.84 761.66 929.21 P/BV 2.7 2.2 1.8 1.5 1.2 Div. Yield 1.8% 2.0% 2.3% 2.8% 3.4%
52-wk range (Rs) 1,399.90 - 842.10 Market cap (Rs mn) 354,826 Market cap ($ mn) 7,792 Shares outstanding (mn) 315 Fiscal Year End Mar Price (Rs) 1,125.35 Date Of Price 21 Jan 11 Avg daily value (Rs mn) 217.2 Avg daily value ($ mn) 4.8 Avg daily vol (mn) 0.1 BSE30 19,008 Exchange Rate 45.54
Source: Company data, Bloomberg, J.P. Morgan estimates.
• 3Q11 misses estimates: PNB reported Rs10.9bn of net profit, up 8% y/y but below our and the consensus estimate of Rs11.4bn. Overall revenue growth w as s trong, with positive m argin s urprise and strong ba lance sheet growth but higher NPA provisions and operating costs led t o t he earnings miss.
• Strong top-line growth: NII growth at 38% y/y was a positive surprise, driven by higher-than-expected credit growth of 30% y/y and a surprise margin improvement. Margins should moderate from current levels due to rising rates a nd thus we f actor i n ~ 30-40bps contraction in margins from current levels for FY12.
• Asset quality disappointed: Gross N PAs increased by 13% q/ q t o ~2.0% of total advances, reaching the upper band management has been guiding for NPAs. Credit costs thus inched up to >1.0% in 3Q10, with overall NPA provisions up 38% y/y. Asset quality remains a concern but management ha s i ndicated t hat they expe ct s lippages t o improve and recoveries to accelerate going forward.
• Pension liability in line with expectations: Management has disclosed that pe nsion liability is ~Rs36bn and that is in line w ith e xpectations. Opex was high mainly due to the higher provisions in pensions and we would e xpect l ow ope rating growth i n F Y12, given t he hi gh ba se i n FY11.
• Marginal change in estimates, maintain Overweight: We adjust our estimates m arginally f or P NB, factoring i n higher credit c osts in FY12/13. PNB's asset quality over the last two to three quarters has been disappointing and that could weigh on near-term stock performance. But in spite o f f actoring i n higher cr edit co sts, we be lieve P NB should be able to sustain ROEs at ~24-25% and current valuations at 1.5x FY12E book look attractive to us; thus, we maintain our OW rating.

Asia Pacific Equity Research 23 January 2011
State Bank of India
Neutral SBI.BO, SBIN IN
Cheap, but high NPLs persist
Price: Rs2,596.90
Price Target: Rs2,800.00
India Banks
Seshadri K Sen, CFAAC
(91-22) 6157-3575 [email protected]
J.P. Morgan India Private Limited
Adarsh Parasrampuria (91-22) 6157-3576 [email protected]
J.P. Morgan India Private Limited
Sunil Garg (852) 2800-8518 [email protected]
J.P. Morgan Securities (Asia Pacific) Limited
1,800
2,600
3,400
Rs
Jan-10 Apr-10 Jul-10 Oct-10 Jan-11
Pr ice Per fo rman ce
SBI.BO share price (Rs)NIFTY (rebased)
State Bank of India (Reuters: SBI.BO, Bloomberg: SBIN IN) Year-end Mar (Rs in mn) FY09A FY10A FY11E FY12E FY13E Operating Profit 213,040 225,518 323,436 351,420 407,550 Net Profit 112,392 116,982 144,116 159,514 197,245 Cash EPS (Rs) 177.03 184.26 227.00 230.32 284.80 Fully Diluted EPS (Rs) 135.18 153.21 219.44 222.52 276.14 DPS (Rs) 25.17 30.00 36.00 43.20 51.84 EPS growth (%) 22.1% 4.1% 23.2% 1.5% 23.7% ROE 16.8% 15.0% 16.2% 14.7% 15.2% P/E 14.7 14.1 11.4 11.3 9.1 BVPS (Rs) 1,140.22 1,309.46 1,494.34 1,766.22 1,990.37 P/BV 2.3 2.0 1.7 1.5 1.3 Div. Yield 1.0% 1.2% 1.4% 1.7% 2.0%
52-wk range (Rs) 3,515.00 - 1,863.00 Market cap (Rs mn) 824,513 Market cap ($ mn) 18,074 Shares outstanding (mn) 317 Fiscal Year End Mar Price (Rs) 2,596.90 Date Of Price 21 Jan 11 Avg daily value (Rs mn) 1,279.6 Avg daily value ($ mn) 28.0 Avg daily vol (mn) 0.9 NIFTY 5,697 Exchange Rate 45.62
Source: Company data, Bloomberg, J.P. Morgan estimates.
• 3Q11: Headline beat estimates but asset quality concern remains: SBI r eported ne t pr ofit o f R s28bn up 14 % y /y v/s our expectation of Rs26bn. S tronger than e xpected m argin a nd l ower pr ovisions w as t he primary reason for the profit beat. But ~500bps of coverage shortfall and provisioning for teaser loans could put future profits at risk.
• High slippages continue: Slippages continued at >2.0% and was higher than peers. Reported Gross NPAs was flat due an accounting adjustment. Though increase in restructured book was pr imarily on account of known airline exposure, we remain concerned on high NPA accretion in spite of a strong economic recovery. Credit costs did fall in this qtr but coverage shortfall remains high at 500bps.
• Margins and loan growth positive: Margins surprised positively with ~20bps improvement in NIMs to 3.6% with cost of deposits down 5bps to 5.2% in 3Q11. CASA remained steady at ~48% with y/y contraction in bulk deposits. Management expects to maintain margins in 4Q11 but rising costs would impact margins in 1HFY12. Loan growth was strong at 7% q/q growth with large corporates/retail credit driving loan growth.
• Risks to earnings: Our FY11 estimates imply Rs27bn of PAT for 4Q11 lower t han 3Q 11 profits. But w e see r isks f rom N PA shor tfall an d possible pr ovisioning r equired on teaser l oans though management believes that they will not have to provide for teaser loans. Also higher duration AFS book could lead to relatively higher MTM losses.
• Maintain Neutral: With the 25% correction over the last 3 months, we believe current valuations at 1.4x FY12 book are no longer demanding. But we remain concerned on the high slippage trend and risks to profitability from higher provisioning requirements and thus maintain our Neutral recommendation.

Asia Pacific Equity Research 23 January 2011
Suntec REIT
Neutral SUNT.SI, SUN SP
FY10 results review - carrying least office leasing risk
Price: S$1.58
Price Target: S$1.60
Singapore REITs
Joy WangAC
(65) 6882-2312 [email protected]
Christopher Gee, CFA (65) 6882-2345 [email protected]
J.P. Morgan Securities Singapore Private Limited
1.20
1.35
1.50S$
Jan-10 Apr-10 Jul-10 Oct-10 Jan-11
Pr ice Per fo rman ce
SUNT.SI share price (S$)FTSTI (rebased)
YTD 1m 3m 12m Abs 4.6% 7.5% 5.3% 17.0% Rel 6.2% 6.1% 4.6% 5.3%
Unit data 52-week range S$1.22 - 1.59 Market cap (S$MM) 3,484 Market cap (US$MM) 2,714 Shares outstanding (MM) 2,205 Date of price 21-Jan-11 Avg daily value (S$MM) 11.9 Avg daily value (US$MM) 9.2 Avg daily volume (shares) 7.9 FSSTI 3,185 Exchange rate S$1.284/US$ Source: Bloomberg
• Suntec REIT reported 4QFY10 results, DPU of S$0.023/unit, annualizing 5.9% yield. FY10 DPU of S$0.099/unit is slightly ahead of J.P. Morgan estimates on the back of lower property tax and expenses. Suntec office rents saw significant pick up Q/Q whilst retail rents remain under pressure. Total asset value for Suntec now stood at S$7billion, the second largest REIT by asset value. Book value as of 31 Dec 10 is S$1.78/unit. Stock will trade ex 0.593cents distribution on 27 Jan.
• Carrying least office leasing risks. Occupancy r ate f or S untec C ity office strengthened further to 99.1% with lease secured for the quarter at an average rent of S$8.16 psf pm, a 10% increase Q/Q. Moreover, the trust ha s don e a s ignificant a mount of forward l easing f or 2011, p re-committed more than 60% of the total office expiry, leaving only 6.8% of i ts total office portfolio up f or renewal in 2011. Whilst we see l ittle risk for the trust's office portfolio, its retail portfolio - which is 30% of the total NLA remains as the key leasing risk.
• Capital management - an ongoing issue. Gearing for the trust is 38.4% with average all-in interest co st of 2.80%, weighted av erage t erm t o expiry of 3.3 years and only S$132.5million debt up for renewal in 2011. Whilst t he c redit p rofile a ppears reasonably he althy, w e hi ghlight t he risks a ssociate w ith the g roup's hi gher p ortion of f loating de bt and relative high gearing. We believe the trust's capital structure is still sub-optimal and another equity fundraising might be necessary, in our view. That said, we see this potential equity fundraising a share price catalyst.
• We retain our Neutral rating, with our Dec-11 DDM-based price target unchanged f or now a t S $1.60/unit. Key ups ide r isks t o our r ating a nd price t arget i nclude 1) a s tronger than expected rental r eversions; 2 ) a turnaround in Suntec City retail mall operations. Key downside r isk l ie within the t rust's c apital structure. An inability to recapitalization or a sharp increase i n short-term i nterest r ate w ould adversely i mpact t he trust's share price performance.
Suntec REIT: summary of FY10 results S$ in millions, otherwise specified 4Q10 3Q10 %Q/Q 4Q09 %Y/Y FY10 FY09 %Y/Y JPM FY10E % variance Gross revenue 61.4 63.2 -2.9% 61.8 -0.6% 249.5 253.1 -1.4% 253.7 -1.7% Property operating expenses 14.2 12.6 12.3% 14.5 -2.5% 56.4 60.9 -7.4% 62.8 -10.2% Net property income 47.2 50.6 -6.7% 47.2 0.0% 193.1 192.2 0.4% 190.9 1.1% Borrowing costs (net) 25.0 12.5 100.0% 18.9 31.8% 55.9 56.0 -0.2% 57.9 -3.4% Distributable income 45.0 46.2 -2.8% 47.8 -6.0% 182.5 189.6 -3.8% 175.8 3.8% Distribution per unit (S$/unit) 0.023 0.025 -7.4% 0.029 -19.8% 0.099 0.117 -15.8% 0.096 3.1% Source: Company data, J.P. Morgan estimates

Asia Pacific Equity Research 21 January 2011
WCT Berhad
Overweight WCTE.KL, WCT MK
Warrant exercise price fixed at M$2.75 - ALERT
Price: M$3.35
21 January 2011
Construction
Hoy Kit MakAC
(60-3) 2270-4728 [email protected]
JPMorgan Securities (Malaysia) Sdn. Bhd. (18146-X)
• New warrant exercise price fixed at M$2.75: WCT has fixed the exercise pr ice f or i ts upc oming i ssue of up t o 193,7MM w arrants a t M$2.75, r epresenting a 21. 4% di scount t o t he 5 -day volume w eighted average market price of WCT shares of M$3.50. Exercise price of WCT’s existing Warrant 1 (WCTW1 MK) expiring April 2013 has been adjusted from M$3.00 to M$2.50.
• An effort to increase share capital and liquidity: This seems to us to be an effort by m anagement t o increase t he c ompany’s s hare capi tal a nd liquidity that will increase from 787MM shares to a maximum of 1.1B shares upon f ull c onversion ( including e xisting w arrants a nd I CPS). W e estimate that WCT will be able to raise M$532.7MM upon full conversion of the new warrants. Management said that the proceeds from new warrant conversion ( if any) will be ut ilised to fund i ts property l andbank growth and i nvestment pr operties. C onstruction projects r equire l ittle w orking capital needs, as payments are on a progressive basis.
• Property development and investments: We estimate W CT’s c urrent outstanding pr operty de velopment l andbank a t m ore t han 420 a cres i n Malaysia, translating into a GDV of M$7.8B. With M$2.9B sold to date, outstanding G DV s tands a t M $4.9B t o be de veloped over s ix years. In Vietnam, WCT’s P latinum P laza pr oject ha s a n estimated GDV of M$1.5B. For investment properties, WCT will be adding on t he 700,000 sq f t net lettable area Paradigm shopping mall. WCT is also building the LCCT Integrated Complex (shopping mall) that will have a 437,000 sq ft net le ttable a rea. I n Vietnam, W CT w ill be bui lding t he Platinum Plaza mall with a size of 1.2MM sq ft net lettable area, the largest shopping mall in Vietnam.
• We recommend subscribing to the new warrants: Management said the announcement of the ex-date is likely to be on 25 January, and the ex-date for e ntitlement is like ly to be be fore m id-February. No c hange t o ou r earnings for ecasts and valuation as they ha ve been adjusted on a f ully diluted basis for the new warrants. We recommend subscribing to the new warrants. With a M$0.34 warrant price, the warrants will be in-the-money, if the share price holds at current levels.
Table 2: New warrant details Entitlement 1:5 to all existing shareholders Warrant Price (M$) 0.34 Exercise Price (M$) 2.75 Expiry (years) 5 Conversion 1 Warrant into 1 WCT share
Source: Company.
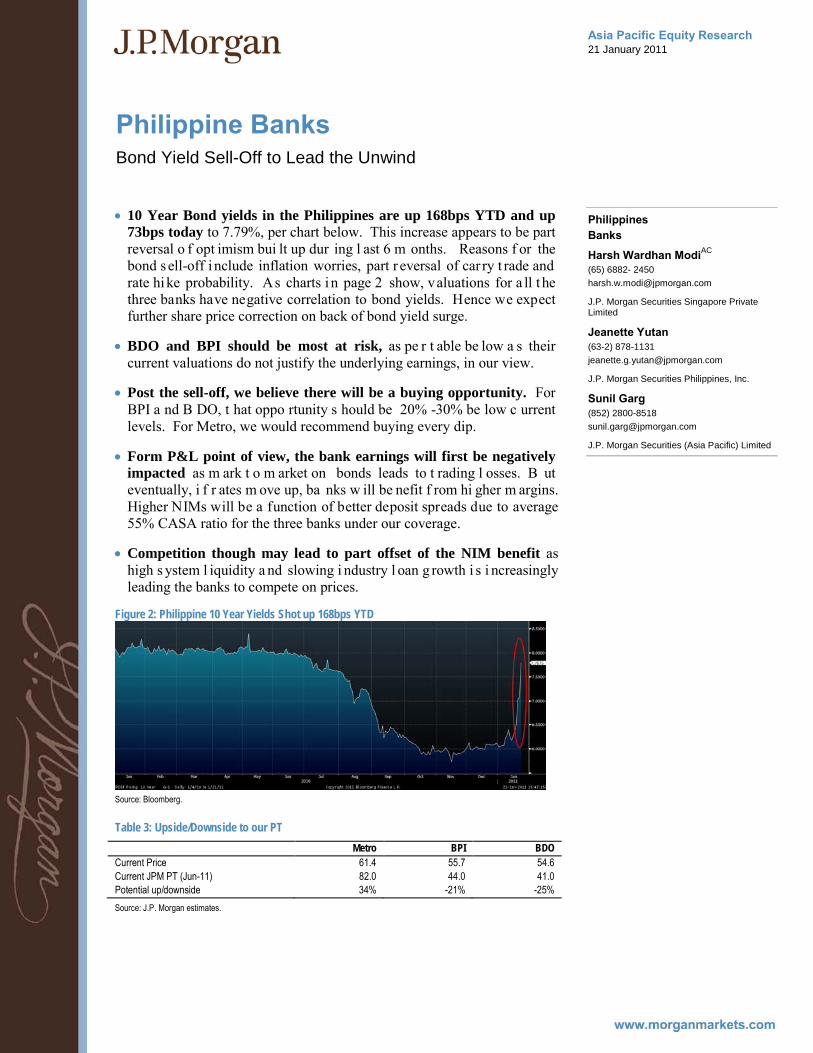
Asia Pacific Equity Research 21 January 2011
Philippine Banks
Bond Yield Sell-Off to Lead the Unwind
Philippines Banks
Harsh Wardhan ModiAC
(65) 6882- 2450 [email protected]
J.P. Morgan Securities Singapore Private Limited
Jeanette Yutan (63-2) 878-1131 [email protected]
J.P. Morgan Securities Philippines, Inc.
Sunil Garg (852) 2800-8518 [email protected]
J.P. Morgan Securities (Asia Pacific) Limited
• 10 Year Bond yields in the Philippines are up 168bps YTD and up 73bps today to 7.79%, per chart below. This increase appears to be part reversal o f opt imism bui lt up dur ing l ast 6 m onths. Reasons f or the bond sell-off i nclude inflation worries, part r eversal of car ry t rade and rate hike probability. As charts i n page 2 show, valuations for a ll t he three banks have negative correlation to bond yields. Hence we expect further share price correction on back of bond yield surge.
• BDO and BPI should be most at risk, as pe r t able be low a s their current valuations do not justify the underlying earnings, in our view.
• Post the sell-off, we believe there will be a buying opportunity. For BPI a nd B DO, t hat oppo rtunity s hould be 20% -30% be low c urrent levels. For Metro, we would recommend buying every dip.
• Form P&L point of view, the bank earnings will first be negatively impacted as m ark t o m arket on bonds leads to t rading l osses. B ut eventually, i f r ates m ove up, ba nks w ill be nefit f rom hi gher m argins. Higher NIMs will be a function of better deposit spreads due to average 55% CASA ratio for the three banks under our coverage.
• Competition though may lead to part offset of the NIM benefit as high s ystem l iquidity a nd slowing i ndustry l oan g rowth i s i ncreasingly leading the banks to compete on prices.
Figure 2: Philippine 10 Year Yields Shot up 168bps YTD
Source: Bloomberg.
Table 3: Upside/Downside to our PT Metro BPI BDO
Current Price 61.4 55.7 54.6 Current JPM PT (Jun-11) 82.0 44.0 41.0 Potential up/downside 34% -21% -25% Source: J.P. Morgan estimates.
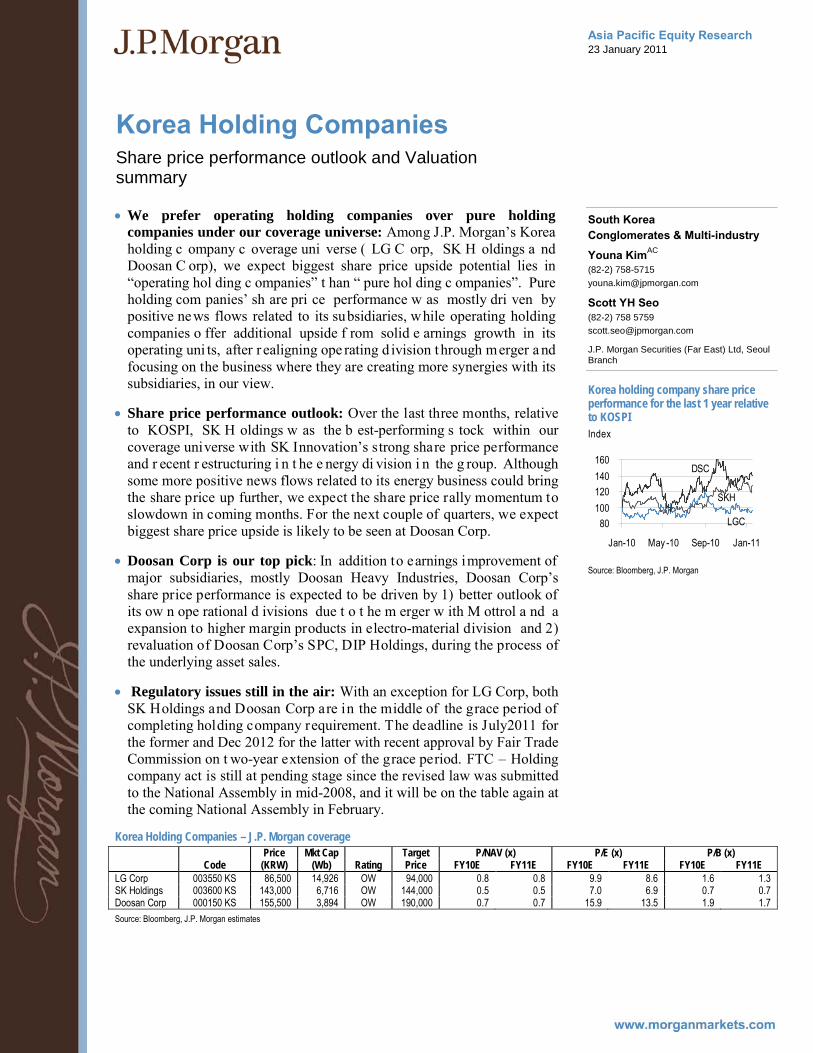
Asia Pacific Equity Research 23 January 2011
Korea Holding Companies
Share price performance outlook and Valuation summary
South Korea Conglomerates & Multi-industry
Youna KimAC
(82-2) 758-5715 [email protected]
Scott YH Seo (82-2) 758 5759 [email protected]
J.P. Morgan Securities (Far East) Ltd, Seoul Branch
Korea holding company share price performance for the last 1 year relative to KOSPI Index
80100120140160
Jan-10 May -10 Sep-10 Jan-11
DSC
SKH
LGC
Source: Bloomberg, J.P. Morgan
• We prefer operating holding companies over pure holding companies under our coverage universe: Among J.P. Morgan’s Korea holding c ompany c overage uni verse ( LG C orp, SK H oldings a nd Doosan C orp), we expect biggest share price upside potential lies in “operating hol ding c ompanies” t han “ pure hol ding c ompanies”. Pure holding com panies’ sh are pri ce performance w as mostly dri ven by positive news flows related to its subsidiaries, while operating holding companies o ffer additional upside f rom solid e arnings growth in its operating uni ts, after r ealigning ope rating d ivision t hrough merger a nd focusing on the business where they are creating more synergies with its subsidiaries, in our view.
• Share price performance outlook: Over the last three months, relative to KOSPI, SK H oldings w as the b est-performing s tock within our coverage universe with SK Innovation’s strong share price performance and r ecent r estructuring i n t he e nergy di vision i n the g roup. Although some more positive news flows related to its energy business could bring the share price up further, we expect the share price rally momentum to slowdown in coming months. For the next couple of quarters, we expect biggest share price upside is likely to be seen at Doosan Corp.
• Doosan Corp is our top pick: In addition to earnings improvement of major subsidiaries, mostly Doosan Heavy Industries, Doosan Corp’s share price performance is expected to be driven by 1) better outlook of its ow n ope rational d ivisions due t o t he m erger w ith M ottrol a nd a expansion to higher margin products in electro-material division and 2) revaluation of Doosan Corp’s SPC, DIP Holdings, during the process of the underlying asset sales.
• Regulatory issues still in the air: With an exception for LG Corp, both SK Holdings and Doosan Corp are in the middle of the grace period of completing holding company requirement. The deadline is July2011 for the former and Dec 2012 for the latter with recent approval by Fair Trade Commission on t wo-year extension of the grace period. FTC – Holding company act is still at pending stage since the revised law was submitted to the National Assembly in mid-2008, and it will be on the table again at the coming National Assembly in February.
Korea Holding Companies – J.P. Morgan coverage Price Mkt Cap Target P/NAV (x) P/E (x) P/B (x) Code (KRW) (Wb) Rating Price FY10E FY11E FY10E FY11E FY10E FY11E
LG Corp 003550 KS 86,500 14,926 OW 94,000 0.8 0.8 9.9 8.6 1.6 1.3 SK Holdings 003600 KS 143,000 6,716 OW 144,000 0.5 0.5 7.0 6.9 0.7 0.7 Doosan Corp 000150 KS 155,500 3,894 OW 190,000 0.7 0.7 15.9 13.5 1.9 1.7 Source: Bloomberg, J.P. Morgan estimates
Asia Pacific Equity Research 21 January 2011
China tollroad sector
Limited impact from potential toll rate reform, and Class 2 government-funded highways turning toll free - ALERT
Infrastructure
Karen Li, CFAAC
(852) 2800-8589 [email protected]
J.P. Morgan Securities (Asia Pacific) Limited
Fuel tax reform in 2009 China's NDRC, Ministry of Finance, Ministry of Communications, and State Taxation Bureau jointly released its Fuel Tax Reform Proposal at end-2008. Effective from Jan. 1st 2009, China will raise the fuel consumption tax for gasoline (to Rmb1 per liter from Rmb0.2 per liter), and that for diesel (to Rmb0.8 per liter from Rmb0.1 per liter), to be charged at the refineries' level based on volume sold. Meanwhile, the government would remove six relevant levies, including road maintenance fees, in addition to gradually phasing out charges on government-funded level two highways.
• News #1: China may lower toll rates while extending concession periods for tollroads. Key government officials from the Ministry of Communications ( MOC) not ed y esterday ( Jan. 19th) t hat i t is contemplating a nationwide toll rate reform, under which rates may be reduced in exchange for extended concession periods.
J.P. Morgan remarks: At present this is still only a proposal which should have neutral impact from a valuation standpoint even if implemented: Toll r ates in C hina are s et by pr ovincial gov ernments while the MO C t ypically t akes a h ands-off a pproach a nd d oes not intervene. The proposal of reducing tariff rates in exchange for longer concession periods has been discussed at t he central l evel with some preliminary w ork don e on t his front. B ased on our di scussion w ith listed tollroad operators, a final decision is likely to be reached within the next three years. Even if such policy is approved and implemented across provinces, it may not necessarily be a negative in our view from a v aluation s tandpoint, as t he t arget I RR r ates a re l ikely t o be maintained.
• News #2: All Class 2 government-funded highways will be turned toll free. Key officials from the MOR noted on Jan. 18th that all Class 2 hi ghways w ill b e t urned t oll f ree. c 20% o f C lass 2 hi ghways, or a total length of 90,000 km, turned free of charge as of end-2010.
J.P. Morgan remarks: Local governments have started turning class II government-funded highways into toll-free, in a gradual fashion, since the introduction of fuel-cost reform from beginning of 2009. By end of 2010, a total of 17 pr ovinces ha ve a lready c ompleted t he task o f removing charges for government-funded Class 2 h ighways, including Zhejiang, Guangdong, Jiangsu and Anhui, in which the listed tollroad operators under our coverage are located.
• Recommendations: The above-mentioned remarks from the MOC are not indicative of any major policy shift in our view. We stay positive on China tollroad sector and retain OW rating on Shenzhen Exy, Anhui Exy, Zhejiang Exy, Jiangsu Exy.

Asia Pacific Equity Research 21 January 2011
China oil product marketing
China R&M margins strong in 4Q - Sinopec should benefit the most
China Integrated Oils
Brynjar Eirik Bustnes, CFAAC
(852) 2800-8578 [email protected]
J.P. Morgan Securities (Asia Pacific) Limited
China refinery throughput
6.06.57.07.58.08.59.09.5
Jan-
07Ap
r-07
Jul-0
7Oc
t-07
Jan-
08Ap
r-08
Jul-0
8Oc
t-08
Jan-
09Ap
r-09
Jul-0
9Oc
t-09
Jan-
10Ap
r-10
Jul-1
0Oc
t-10
Ref T 'put (mn BOPD)
Source: Bloomberg
• Oil product marketing in China was likely strong in 4Q2010: Due to the strong di esel demand, related to power cut s t o meet cer tain efficiency targets, we be lieve marketing margins on diesel i n particular w as v ery strong. We be lieve that wholesale di esel was at t imes sold at above r etail price levels, and Sinopec and PetroChina were doing this in order to l imit the amount of products ending up in independent wholesalers tanks, as these operators were amassing inventories in expectation of price hikes (one price hike came through on Dec 22 2010).
• Teapots running at higher utilization rates in 4Q10: Further substantiating this v iew is h ow the marginally pr ofitable s maller r efineries were ope rating. I n t he period, ut ilization a mong S handong t eapots (Shandong has 1.2 mn BOPD of teapot capacity) increased from low 30s in 3Q10 to low 40s in 4Q10. It is a lso evident f rom CNPC da ta that margins expanded from around zero in 3Q10 to Rmb200-600/ton in 4Q10. Teapots have l imited access t o crude, but t he one s ha ving access t o S hengli c rude saw m argins doubl e or t riple, w hile ba sed on R ussian M -100 f uel oi l feedstock, margins expanded from zero to around Rmb200/ton.
• Power cuts now likely over; diesel demand could be coming off taking margins down also: Again, based on CNPCs data, margins for teapots are expected to come off in 1Q11. This is very likely due to lower real demand for diesel a long with further ramp-up in domestic production by the major refiners. Net imports of diesel never actually made into positive territory late last year ( as w as expe cted), and Sinopec an d PetroChina ha ve recently decreased significantly imports of diesel.
• We expect Sinopec (OW) to report good 4Q10 results due to high oil price and good overall R&M profitability: Looking f orward i t may be slightly more difficult in 1Q11 due to the higher oil price and lack of product price hikes. We do however expect a price hike post Chinese New Year if oil stays at elevated levels (which we act ually don’ t expect). We be lieve PetroChina (UW) will also have benefited from 4Q10 margins, but with less overall impact.
Shandong teapot utilization and margins
0%
10%
20%
30%
40%
50%
Aug,
10
Sep,
10
Oct,1
0
Nov,
10
Dec,
10
Jan,
11
Feb,
11
-200
0
200
400
600
800
Utilization, LHS Shengli c rude (Rmb/t), RHS M100 FO (Rmb/t), RHS
Source: J.P. Morgan estimates, CNPC.

Asia Pacific Equity Research 21 January 2011
The Lodestone
While scrap prices surge seems to be peaking out (for the time at least), HRC price surge continues
Metals & Mining
Pinakin Parekh, CFAAC
(91-22) 6157-3588 [email protected]
Neha Manpuria (91-22) 6157-3589 [email protected]
J.P. Morgan India Private Limited
J.P. Morgan Metal Index
50%150%250%350%450%
Jan-06 Jan-08 Jan-10
Source: Bloomberg. Prices as of Jan 20, 2011.
Summary of Metal Coverage Rs/share Rating TP Price Tata Steel OW 820 635 JSW Steel UW 1000 1043 Coal India N 320 316 Sterlite OW 205 181 Hindalco N 245 237 Nalco UW 325 380 Source: Bloomberg and J.P. Morgan estimates. Prices as of Jan 20, 2011.
• Scrap prices peaking out? Long steel prices could hit near term ‘air pocket', HRC price surge continues: Scrap p rices af ter a s harp rally s ince Nov, seems to be peaking out with recent transactions taking below MB index price o f $ 503/MT an d as a r esult ex port p rices o f b illets and r e-bars f rom Turkey ha ve fallen b y $20/MT. JPM Europe Steel analyst believes pullback of T urkish s crap b uyers co uld h it l ong p roduct p rices. H RC p rice i ncrease continues with C IS i mport pr ices i ncreasing t o $72 5/MT ( implying l anded domestic steel prices of Rs37.5K/MT v/s estimated domestic prices of Rs34.5K/MT). While headline HRC price increase is positive for Indian mills (imports ar e n ot yet t aking place as t here i s a gap b etween i mported an d domestic prices with the latter being lower), sluggish domestic demand in our view i s not al lowing for l arge p rice i ncreases. W e b elieve t he r ecent sharp increase in s teel p rices, co uld p otentially i mpact ap parent d emand ( as r e-stocking ebbs down).
• Spot iron ore hits $190/MT, potential re-start of exports out from Karnataka, but also potential increase in export tax: Spot iron ore price surge continues hitting $190/MT. Unless the s tate Government in Karnataka, renews its July order next week, we see strong possibility of re-start in exports. However, there have b een media reports (FE) that t here could b e a uniform export tax of 20% on iron ore. Export taxes on fines is currently 5%, and over the past few years export taxes have been increased with an increase in spot iron o re p rices an d we would n ot b e s urprised t o s ee ex port t ax i ncrease t o 10% from current 5%.
• Coking coal update: BHP’s Dec quarter met coal production was down 24% q/q. JPM a nalyst Amos F letcher hi ghlights t hat ‘ increased water pumping capacity following the last floods in 2008 so there has been minimal water accumulation in-pit, however, overburden removal has been restricted; thus, the company expects an ongoing impact on production, sales and costs through H2. Sales of 7.3Mt from Queensland were down 15% QoQ as production was augmented by drawdown of stockpiles but in line with our estimates’. Rio’s c oking c oal pr oduction f ell 6% b ut s ales i ncreased 22% through inventory run down. Spot thermal coal prices remain very strong and are between $130-140/MT.
• Energy capex coming back? Indian pipe mill wins export order: JPM Oil Services analyst David Anderson expects global upstream spending to increase 15% in 2011. Transportation capex (pipelines) has a significant lag. However we would point out that Indian pipe mill Jindal SAW (JSAW, NR) this week announced an order win of HSAW pipes of $150mn. Indian pipe exports have declined and a revival in demand for pipes would be positive for steel demand (LSAW uses plates, while HSAW uses HR Coils)
• Spot a lumina pr ices c ontinue t o r emain s trong a nd h ave r isen t o $380/ MT.

Asia Pacific Equity Research 21 January 2011
Mining
We view that export ban scare on low ranked coal is unfounded - ALERT
Mining
Stevanus JuandaAC
(62-21) 5291 8574 [email protected]
PT J.P. Morgan Securities Indonesia
Price Performance
50.070.0
90.0110.0
130.0150.0
170.0
Jan-10 Apr-10 Jul-10 Oct-10 Jan-11JAKMINE Rebased JCI Rebased
Source: Bloomberg
• News on export ban on low ranked coal: There is news in Investor Daily quoting t he s ecretary o f D G Minerals Witoro S ularno th at th ere is a p lan to stop the export of thermal coal with CV under 5,600kcal. The government will require the co al t o be crushed and upgraded, before they get exported. There was a parliamentary hearing on the matter yesterday for DPR commission VII. The initiative is to add value to the coal export.
• Majority of Indonesian coal deposit is below 5,600kcal/kg: Our d ata h as indicated that the majority of Indonesian coal deposits are below 5,600kcal/kg. Only I TMG an d B UMI h ave s izable a mount o f co al d eposit ab ove 5 ,600 kcal/kg. For several other large producers such as Adaro – 2nd largest, Kideco (Indika) – 3rd l argest, B erau – 5th l argest, th eir d eposits a re b elow 5,600kcal/kg. I n a ddition, future r eserve may not b e a ble t o s ustain t he continuous maintenance of coal export at above 5,600 kcal/kg.
• Production volume could come down: If en acted, w e view the I ndonesia volume pr oduction c ould come d own as co al p roducers will ei ther have to blend t he c oal; l ikely using i mported c oal or /and a t r isk l osing t heir e xport revenue. We also view that the industry is likely to lobby against this proposed measure.
• Coal upgrading technology is still not proven: Our industry knowledge has indicated that the coal upgrading technology is still unproven. For information, the la test c oal u pgrading venture a t B ayan ( with W hite E nergy) i s yet to generate satisfactory result.
• Too much is at stake; including government revenue: We view that there is too m uch a t stake; i ncluding go vernments revenue f rom b oth r oyalty a nd income tax. Calculating the forecast of royalty and income tax expected to be paid by the six t op Indonesian coal c ompanies ( 2/3 t hird of F Y11E t otal production), we estimate that a total of US$4.1 billion could be collected from royalty and income tax. This excludes income tax receivable from companies that are related to the coal industry: barging, shipping, etc.
• Maintain 6-12 months positive view: Admittedly in the short term, we do see downside r isk f or the co al s tocks due t o market s ell o ff as I ndonesian coal stocks have high b eta an d al so n egative ne ws f low. ( In t oday’s morning section, t he u nderperformers are SMGR-7%, UNV R-7%, PT BA-6%, CP IN-6%). Despite the potential short term pressure on the share price, we still l ike the fundamental story o f c oal stocks and maintain o ur 6 -12 months pos itive view on the sector.
35
Asia Pacific Equity Research 24 January 2011
Sunil Garg (852) 2800-8518 [email protected]
Analyst Certification: The research analyst who is primarily responsible for this research and whose name is listed first on the front cover certifies (or in a case where multiple research analysts are primarily responsible for this research, the research analyst named first in each group on the front cover or named within the document individually certifies, with respect to each security or issuer that the research analyst covered in this research) that: (1) all of the views expressed in this research accurately reflect his or her personal views about any and all of the subject securities or issuers; and (2) no part of any of the research analyst’s compensation was, is, or will be directly or indirectly related to the specific recommendations or views expressed by the research analyst in this research.
Important Disclosures
• Lead or Co-manager: J.P. Morgan acted as lead or co-manager in a public offering of equity and/or debt securities for Bank of the Philippine Islands (BPI), CapitaMall Trust, CapitaMalls Asia, CapitaMalls Malaysia Trust, China Railway Construction Corporation Limited, Honda Motor (7267), Hyundai Motor Company, Inpex Corporation, ITC Limited, Mando, State Bank of India within the past 12 months.
• Analyst Position: The following analysts (and/or their associates or household members) own a long position in the shares of CapitaRetail China Trust: Adrian Mowat. The following analysts (and/or their associates or household members) own a long position in the shares of Dish TV: Bharat Iyer. The following analysts (and/or their associates or household members) own a long position in the shares of Metropolitan Bank: Jeanette Yutan. The following analysts (and/or their associates or household members) own a long position in the shares of State Bank of India: Bijay Kumar. The following analysts (and/or their associates or household members) own a long position in the shares of Zhejiang Expressway: Adrian Mowat.
• Beneficial Ownership (1% or more): J.P. Morgan beneficially owns 1% or more of a class of common equity securities of Hyundai Motor Company, Nikon (7731).
• Client of the Firm: Banco de Oro is or was in the past 12 months a client of JPM; during the past 12 months, JPM provided to the company non-investment banking securities-related service and non-securities-related services. Bangkok Bank is or was in the past 12 months a client of JPM; during the past 12 months, JPM provided to the company non-investment banking securities-related service and non-securities-related services. Bank of Ayudhya is or was in the past 12 months a client of JPM; during the past 12 months, JPM provided to the company non-investment banking securities-related service and non-securities-related services. Bank of India is or was in the past 12 months a client of JPM; during the past 12 months, JPM provided to the company non-investment banking securities-related service and non-securities-related services. Bank of the Philippine Islands (BPI) is or was in the past 12 months a client of JPM; during the past 12 months, JPM provided to the company investment banking services, non-investment banking securities-related service and non-securities-related services. Canon (7751) is or was in the past 12 months a client of JPM; during the past 12 months, JPM provided to the company non-investment banking securities-related service and non-securities-related services. CapitaLand is or was in the past 12 months a client of JPM; during the past 12 months, JPM provided to the company investment banking services. CapitaMall Trust is or was in the past 12 months a client of JPM; during the past 12 months, JPM provided to the company investment banking services. CapitaMalls Asia is or was in the past 12 months a client of JPM; during the past 12 months, JPM provided to the company investment banking services. CapitaMalls Malaysia Trust is or was in the past 12 months a client of JPM; during the past 12 months, JPM provided to the company investment banking services. CapitaRetail China Trust is or was in the past 12 months a client of JPM. China Railway Construction Corporation Limited is or was in the past 12 months a client of JPM; during the past 12 months, JPM provided to the company investment banking services. Doosan Corp is or was in the past 12 months a client of JPM; during the past 12 months, JPM provided to the company non-securities-related services. FUJIFILM Holdings (4901) is or was in the past 12 months a client of JPM; during the past 12 months, JPM provided to the company non-investment banking securities-related service and non-securities-related services. Hankook Tire is or was in the past 12 months a client of JPM. Hitachi (6501) is or was in the past 12 months a client of JPM; during the past 12 months, JPM provided to the company investment banking services, non-investment banking securities-related service and non-securities-related services. Honda Motor (7267) is or was in the past 12 months a client of JPM; during the past 12 months, JPM provided to the company investment banking services, non-investment banking securities-related service and non-securities-related services. HTC Corp is or was in the past 12 months a client of JPM. Hyundai Mobis is or was in the past 12 months a client of JPM; during the past 12 months, JPM provided to the company non-investment banking securities-related service. Hyundai Motor Company is or was in the past 12 months a client of JPM; during the past 12 months, JPM provided to the company investment banking services, non-investment banking securities-related service and non-securities-related services. Inpex Corporation is or was in the past 12 months a client of JPM; during the past 12 months, JPM provided to the company investment banking services and non-investment banking securities-related service. ITC Limited is or was in the past 12 months a client of JPM; during the past 12 months, JPM provided to the company investment banking services. JSW Energy Ltd. is or was in the past 12 months a client of JPM; during the past 12 months, JPM provided to the company investment banking services. LG Chem Ltd is or was in the past 12 months a client of JPM. LG Display is or was in the past 12 months a client of JPM; during the past 12 months, JPM provided to the company investment banking services and non-investment banking securities-related service. LG Electronics is or was in the past 12 months a client of JPM; during the past 12 months, JPM provided to the company investment banking services, non-investment banking securities-related service and non-securities-related services. Mando is or was in the past 12 months a client of JPM; during the past 12 months, JPM provided to the company investment banking services. Mapletree Logistics Trust is or was in the past 12 months a client of JPM; during the past 12 months, JPM provided to the company non-securities-related services. MediaTek Inc. is or was in the past
36
Asia Pacific Equity Research 24 January 2011
Sunil Garg (852) 2800-8518 [email protected]
12 months a client of JPM; during the past 12 months, JPM provided to the company non-securities-related services. Metropolitan Bank is or was in the past 12 months a client of JPM; during the past 12 months, JPM provided to the company non-investment banking securities-related service and non-securities-related services. Nikon (7731) is or was in the past 12 months a client of JPM; during the past 12 months, JPM provided to the company non-investment banking securities-related service. PetroChina is or was in the past 12 months a client of JPM. Punjab National Bank is or was in the past 12 months a client of JPM; during the past 12 months, JPM provided to the company non-investment banking securities-related service and non-securities-related services. Reliance Industries Ltd is or was in the past 12 months a client of JPM; during the past 12 months, JPM provided to the company non-investment banking securities-related service and non-securities-related services. Samsung SDI is or was in the past 12 months a client of JPM; during the past 12 months, JPM provided to the company non-investment banking securities-related service. Shenzhen Expressway - A is or was in the past 12 months a client of JPM. Shenzhen Expressway - H is or was in the past 12 months a client of JPM. Sinopec Corp - H is or was in the past 12 months a client of JPM; during the past 12 months, JPM provided to the company non-investment banking securities-related service and non-securities-related services. SK Energy Co Ltd is or was in the past 12 months a client of JPM; during the past 12 months, JPM provided to the company non-investment banking securities-related service and non-securities-related services. State Bank of India is or was in the past 12 months a client of JPM; during the past 12 months, JPM provided to the company investment banking services, non-investment banking securities-related service and non-securities-related services.
• Investment Banking (past 12 months): J.P. Morgan received, in the past 12 months, compensation for investment banking services from Bank of the Philippine Islands (BPI), CapitaLand, CapitaMall Trust, CapitaMalls Asia, CapitaMalls Malaysia Trust, China Railway Construction Corporation Limited, Hitachi (6501), Honda Motor (7267), Hyundai Motor Company, Inpex Corporation, ITC Limited, JSW Energy Ltd., LG Display, LG Electronics, Mando, State Bank of India.
• Investment Banking (next 3 months): J.P. Morgan expects to receive, or intends to seek, compensation for investment banking services in the next three months from Bank of the Philippine Islands (BPI), CapitaLand, CapitaMall Trust, CapitaMalls Asia, CapitaMalls Malaysia Trust, China Railway Construction Corporation Limited, Hitachi (6501), Honda Motor (7267), Hyundai Motor Company, Inpex Corporation, ITC Limited, JSW Energy Ltd., LG Display, LG Electronics, Mando, MediaTek Inc., State Bank of India.
• Non-Investment Banking Compensation: JPMS has received compensation in the past 12 months for products or services other than investment banking from Banco de Oro, Bangkok Bank, Bank of Ayudhya, Bank of India, Bank of the Philippine Islands (BPI), Canon (7751), FUJIFILM Holdings (4901), Hitachi (6501), Honda Motor (7267), Hyundai Mobis, Hyundai Motor Company, Inpex Corporation, LG Display, LG Electronics, Metropolitan Bank, Nikon (7731), Punjab National Bank, Reliance Industries Ltd, Samsung SDI, Sinopec Corp - H, SK Energy Co Ltd, State Bank of India. An affiliate of JPMS has received compensation in the past 12 months for products or services other than investment banking from Banco de Oro, Bangkok Bank, Bank of Ayudhya, Bank of India, Bank of the Philippine Islands (BPI), Canon (7751), CapitaLand, Doosan Corp, FUJIFILM Holdings (4901), Hitachi (6501), Honda Motor (7267), Hyundai Mobis, Hyundai Motor Company, Inpex Corporation, LG Chem Ltd, LG Display, LG Electronics, Mapletree Logistics Trust, MediaTek Inc., Metropolitan Bank, Nikon (7731), Punjab National Bank, Reliance Industries Ltd, SK Energy Co Ltd, State Bank of India.
• J.P. Morgan Securities (Far East) Ltd, Seoul branch is acting as a Market Maker (Liquidity Provider) for the Equity Linked Warrants of Hyundai Mobis and owns 13,706,530 as of 21-Jan-11.
• J.P. Morgan Securities (Far East) Ltd, Seoul branch is acting as a Market Maker (Liquidity Provider) for the Equity Linked Warrants of Hyundai Motor Company and owns 26,489,880 as of 21-Jan-11.
• J.P. Morgan Securities (Far East) Ltd, Seoul branch is acting as a Market Maker (Liquidity Provider) for the Equity Linked Warrants of LG Chem Ltd and owns 10,469,410 as of 21-Jan-11.
• J.P. Morgan Securities (Far East) Ltd, Seoul branch is acting as a Market Maker (Liquidity Provider) for the Equity Linked Warrants of LG Display and owns 16,625,300 as of 21-Jan-11.
• J.P. Morgan Securities (Far East) Ltd, Seoul branch is acting as a Market Maker (Liquidity Provider) for the Equity Linked Warrants of LG Electronics and owns 13,984,600 as of 21-Jan-11.
• J.P. Morgan Securities (Far East) Ltd, Seoul branch is acting as a Market Maker (Liquidity Provider) for the Equity Linked Warrants of Samsung SDI and owns 13,793,850 as of 21-Jan-11.
• J.P. Morgan Securities (Far East) Ltd, Seoul branch is acting as a Market Maker (Liquidity Provider) for the Equity Linked Warrants of SK Energy Co Ltd and owns 10,614,160 as of 21-Jan-11.
• MSCI: The MSCI sourced information is the exclusive property of Morgan Stanley Capital International Inc. (MSCI). Without prior written permission of MSCI, this information and any other MSCI intellectual property may not be reproduced, redisseminated or used to create any financial products, including any indices. This information is provided on an 'as is' basis. The user assumes the entire risk of any use made of this information. MSCI, its affiliates and any third party involved in, or related to, computing or compiling the information hereby expressly disclaim all warranties of originality, accuracy, completeness, merchantability or fitness for a particular purpose with respect to any of this information. Without limiting any of the foregoing, in no event shall MSCI, any of its affiliates or any third party involved in, or related to, computing or compiling the information have any liability for any damages of any kind. MSCI, Morgan Stanley Capital International and the MSCI indexes are services marks of MSCI and its affiliates.

37
Asia Pacific Equity Research 24 January 2011
Sunil Garg (852) 2800-8518 [email protected]
Important Disclosures for Equity Research Compendium Reports: Important disclosures, including price charts for all companies under coverage for at least one year, are available through the search function on J.P. Morgan’s website https://mm.jpmorgan.com/disclosures/company or by calling this U.S. toll-free number (1-800-477-0406)
Explanation of Equity Research Ratings and Analyst(s) Coverage Universe: J.P. Morgan uses the following rating system: Overweight [Over the next six to twelve months, we expect this stock will outperform the average total return of the stocks in the analyst’s (or the analyst’s team’s) coverage universe.] Neutral [Over the next six to twelve months, we expect this stock will perform in line with the average total return of the stocks in the analyst’s (or the analyst’s team’s) coverage universe.] Underweight [Over the next six to twelve months, we expect this stock will underperform the average total return of the stocks in the analyst’s (or the analyst’s team’s) coverage universe.] J.P. Morgan Cazenove’s UK Small/Mid-Cap dedicated research analysts use the same rating categories; however, each stock’s expected total return is compared to the expected total return of the FTSE All Share Index, not to those analysts’ coverage universe. A list of these analysts is available on request. The analyst or analyst’s team’s coverage universe is the sector and/or country shown on the cover of each publication. See below for the specific stocks in the certifying analyst(s) coverage universe.
J.P. Morgan Equity Research Ratings Distribution, as of December 31, 2010
Overweight (buy)
Neutral (hold)
Underweight (sell)
J.P. Morgan Global Equity Research Coverage 46% 42% 12% IB clients* 53% 50% 38% JPMS Equity Research Coverage 43% 49% 8% IB clients* 71% 63% 59%
*Percentage of investment banking clients in each rating category. For purposes only of FINRA/NYSE ratings distribution rules, our Overweight rating falls into a buy rating category; our Neutral rating falls into a hold rating category; and our Underweight rating falls into a sell rating category.
Valuation and Risks: Please see the most recent company-specific research report for an analysis of valuation methodology and risks on any securities recommended herein. Research is available at http://www.morganmarkets.com , or you can contact the analyst named on the front of this note or your J.P. Morgan representative.
Analysts’ Compensation: The equity research analysts responsible for the preparation of this report receive compensation based upon various factors, including the quality and accuracy of research, client feedback, competitive factors, and overall firm revenues, which include revenues from, among other business units, Institutional Equities and Investment Banking.
Registration of non-US Analysts: Unless otherwise noted, the non-US analysts listed on the front of this report are employees of non-US affiliates of JPMS, are not registered/qualified as research analysts under FINRA/NYSE rules, may not be associated persons of JPMS, and may not be subject to FINRA Rule 2711 and NYSE Rule 472 restrictions on communications with covered companies, public appearances, and trading securities held by a research analyst account.
Other Disclosures
J.P. Morgan ("JPM") is the global brand name for J.P. Morgan Securities LLC ("JPMS") and its affiliates worldwide. J.P. Morgan Cazenove is a marketing name for the U.K. investment banking businesses and EMEA cash equities and equity research businesses of JPMorgan Chase & Co. and its subsidiaries.
Options related research: If the information contained herein regards options related research, such information is available only to persons who have received the proper option risk disclosure documents. For a copy of the Option Clearing Corporation’s Characteristics and Risks of Standardized Options, please contact your J.P. Morgan Representative or visit the OCC’s website at http://www.optionsclearing.com/publications/risks/riskstoc.pdf.
Legal Entities Disclosures U.S.: JPMS is a member of NYSE, FINRA and SIPC. J.P. Morgan Futures Inc. is a member of the NFA. JPMorgan Chase Bank, N.A. is a member of FDIC and is authorized and regulated in the UK by the Financial Services Authority. U.K.: J.P. Morgan Securities Ltd. (JPMSL) is a member of the London Stock Exchange and is authorized and regulated by the Financial Services Authority. Registered in England & Wales No. 2711006. Registered Office 125 London Wall, London EC2Y 5AJ. South Africa: J.P. Morgan Equities Limited is a member of the Johannesburg Securities Exchange and is regulated by the FSB. Hong Kong: J.P. Morgan Securities (Asia Pacific) Limited (CE number AAJ321) is regulated by the Hong Kong Monetary Authority and the Securities and Futures Commission in Hong Kong. Korea: J.P. Morgan Securities (Far East) Ltd, Seoul Branch, is regulated by the Korea Financial Supervisory Service. Australia: J.P. Morgan Australia Limited (ABN 52 002 888 011/AFS Licence No: 238188) is regulated by ASIC and J.P. Morgan Securities Australia Limited (ABN 61 003 245 234/AFS Licence No: 238066) is a

38
Asia Pacific Equity Research 24 January 2011
Sunil Garg (852) 2800-8518 [email protected]
Market Participant with the ASX and regulated by ASIC. Taiwan: J.P.Morgan Securities (Taiwan) Limited is a participant of the Taiwan Stock Exchange (company-type) and regulated by the Taiwan Securities and Futures Bureau. India: J.P. Morgan India Private Limited, having its registered office at J.P. Morgan Tower, Off. C.S.T. Road, Kalina, Santacruz East, Mumbai - 400098, is a member of the National Stock Exchange of India Limited (SEBI Registration Number - INB 230675231/INF 230675231/INE 230675231) and Bombay Stock Exchange Limited (SEBI Registration Number - INB010675237/INB010675237) and is regulated by Securities and Exchange Board of India. Thailand: JPMorgan Securities (Thailand) Limited is a member of the Stock Exchange of Thailand and is regulated by the Ministry of Finance and the Securities and Exchange Commission. Indonesia: PT J.P. Morgan Securities Indonesia is a member of the Indonesia Stock Exchange and is regulated by the BAPEPAM LK. Philippines: J.P. Morgan Securities Philippines Inc. is a member of the Philippine Stock Exchange and is regulated by the Securities and Exchange Commission. Brazil: Banco J.P. Morgan S.A. is regulated by the Comissao de Valores Mobiliarios (CVM) and by the Central Bank of Brazil. Mexico: J.P. Morgan Casa de Bolsa, S.A. de C.V., J.P. Morgan Grupo Financiero is a member of the Mexican Stock Exchange and authorized to act as a broker dealer by the National Banking and Securities Exchange Commission. Singapore: This material is issued and distributed in Singapore by J.P. Morgan Securities Singapore Private Limited (JPMSS) [MICA (P) 025/01/2011 and Co. Reg. No.: 199405335R] which is a member of the Singapore Exchange Securities Trading Limited and is regulated by the Monetary Authority of Singapore (MAS) and/or JPMorgan Chase Bank, N.A., Singapore branch (JPMCB Singapore) which is regulated by the MAS. Malaysia: This material is issued and distributed in Malaysia by JPMorgan Securities (Malaysia) Sdn Bhd (18146-X) which is a Participating Organization of Bursa Malaysia Berhad and a holder of Capital Markets Services License issued by the Securities Commission in Malaysia. Pakistan: J. P. Morgan Pakistan Broking (Pvt.) Ltd is a member of the Karachi Stock Exchange and regulated by the Securities and Exchange Commission of Pakistan. Saudi Arabia: J.P. Morgan Saudi Arabia Ltd. is authorized by the Capital Market Authority of the Kingdom of Saudi Arabia (CMA) to carry out dealing as an agent, arranging, advising and custody, with respect to securities business under licence number 35-07079 and its registered address is at 8th Floor, Al-Faisaliyah Tower, King Fahad Road, P.O. Box 51907, Riyadh 11553, Kingdom of Saudi Arabia. Dubai: JPMorgan Chase Bank, N.A., Dubai Branch is regulated by the Dubai Financial Services Authority (DFSA) and its registered address is Dubai International Financial Centre - Building 3, Level 7, PO Box 506551, Dubai, UAE.
Country and Region Specific Disclosures U.K. and European Economic Area (EEA): Unless specified to the contrary, issued and approved for distribution in the U.K. and the EEA by JPMSL. Investment research issued by JPMSL has been prepared in accordance with JPMSL's policies for managing conflicts of interest arising as a result of publication and distribution of investment research. Many European regulators require a firm to establish, implement and maintain such a policy. This report has been issued in the U.K. only to persons of a kind described in Article 19 (5), 38, 47 and 49 of the Financial Services and Markets Act 2000 (Financial Promotion) Order 2005 (all such persons being referred to as "relevant persons"). This document must not be acted on or relied on by persons who are not relevant persons. Any investment or investment activity to which this document relates is only available to relevant persons and will be engaged in only with relevant persons. In other EEA countries, the report has been issued to persons regarded as professional investors (or equivalent) in their home jurisdiction. Australia: This material is issued and distributed by JPMSAL in Australia to “wholesale clients” only. JPMSAL does not issue or distribute this material to “retail clients.” The recipient of this material must not distribute it to any third party or outside Australia without the prior written consent of JPMSAL. For the purposes of this paragraph the terms “wholesale client” and “retail client” have the meanings given to them in section 761G of the Corporations Act 2001. Germany: This material is distributed in Germany by J.P. Morgan Securities Ltd., Frankfurt Branch and J.P.Morgan Chase Bank, N.A., Frankfurt Branch which are regulated by the Bundesanstalt für Finanzdienstleistungsaufsicht. Hong Kong: The 1% ownership disclosure as of the previous month end satisfies the requirements under Paragraph 16.5(a) of the Hong Kong Code of Conduct for Persons Licensed by or Registered with the Securities and Futures Commission. (For research published within the first ten days of the month, the disclosure may be based on the month end data from two months’ prior.) J.P. Morgan Broking (Hong Kong) Limited is the liquidity provider/market maker for derivative warrants, callable bull bear contracts and stock options listed on the Stock Exchange of Hong Kong Limited. An updated list can be found on HKEx website: http://www.hkex.com.hk. Japan: There is a risk that a loss may occur due to a change in the price of the shares in the case of share trading, and that a loss may occur due to the exchange rate in the case of foreign share trading. In the case of share trading, JPMorgan Securities Japan Co., Ltd., will be receiving a brokerage fee and consumption tax (shouhizei) calculated by multiplying the executed price by the commission rate which was individually agreed between JPMorgan Securities Japan Co., Ltd., and the customer in advance. Financial Instruments Firms: JPMorgan Securities Japan Co., Ltd., Kanto Local Finance Bureau (kinsho) No. 82 Participating Association / Japan Securities Dealers Association, The Financial Futures Association of Japan. Korea: This report may have been edited or contributed to from time to time by affiliates of J.P. Morgan Securities (Far East) Ltd, Seoul Branch. Singapore: JPMSS and/or its affiliates may have a holding in any of the securities discussed in this report; for securities where the holding is 1% or greater, the specific holding is disclosed in the Important Disclosures section above. India: For private circulation only, not for sale. Pakistan: For private circulation only, not for sale. New Zealand: This material is issued and distributed by JPMSAL in New Zealand only to persons whose principal business is the investment of money or who, in the course of and for the purposes of their business, habitually invest money. JPMSAL does not issue or distribute this material to members of "the public" as determined in accordance with section 3 of the Securities Act 1978. The recipient of this material must not distribute it to any third party or outside New Zealand without the prior written consent of JPMSAL. Canada: The information contained herein is not, and under no circumstances is to be construed as, a prospectus, an advertisement, a public offering, an offer to sell securities described herein, or solicitation of an offer to buy securities described herein, in Canada or any province or territory thereof. Any offer or sale of the securities described herein in Canada will be made only under an exemption from the requirements to file a prospectus with the relevant Canadian securities regulators and only by a dealer properly registered under applicable securities laws or, alternatively, pursuant to an exemption from the dealer registration requirement in the relevant province or territory of Canada in which such offer or sale is made. The information contained herein is under no circumstances to be construed as investment advice in any province or territory of Canada and is not tailored to the needs of the recipient. To the extent that the information contained herein references securities of an issuer incorporated, formed or created under the laws of Canada or a province or territory of Canada, any trades in such securities must be conducted through a dealer registered in Canada. No securities commission or similar regulatory authority in Canada has reviewed or in any way passed judgment upon these materials, the information contained herein or the merits of the
39
Asia Pacific Equity Research 24 January 2011
Sunil Garg (852) 2800-8518 [email protected]
securities described herein, and any representation to the contrary is an offence. Dubai: This report has been issued to persons regarded as professional clients as defined under the DFSA rules.
General: Additional information is available upon request. Information has been obtained from sources believed to be reliable but JPMorgan Chase & Co. or its affiliates and/or subsidiaries (collectively J.P. Morgan) do not warrant its completeness or accuracy except with respect to any disclosures relative to JPMS and/or its affiliates and the analyst’s involvement with the issuer that is the subject of the research. All pricing is as of the close of market for the securities discussed, unless otherwise stated. Opinions and estimates constitute our judgment as of the date of this material and are subject to change without notice. Past performance is not indicative of future results. This material is not intended as an offer or solicitation for the purchase or sale of any financial instrument. The opinions and recommendations herein do not take into account individual client circumstances, objectives, or needs and are not intended as recommendations of particular securities, financial instruments or strategies to particular clients. The recipient of this report must make its own independent decisions regarding any securities or financial instruments mentioned herein. JPMS distributes in the U.S. research published by non-U.S. affiliates and accepts responsibility for its contents. Periodic updates may be provided on companies/industries based on company specific developments or announcements, market conditions or any other publicly available information. Clients should contact analysts and execute transactions through a J.P. Morgan subsidiary or affiliate in their home jurisdiction unless governing law permits otherwise.
“Other Disclosures” last revised January 8, 2011.
Copyright 2011 JPMorgan Chase & Co. All rights reserved. This report or any portion hereof may not be reprinted, sold or redistributed without the written consent of J.P. Morgan.#$J&098$#*P