article electron cryotomography of intact motile cilia
TRANSCRIPT

ARTICLE
Electron cryotomography of intact motile ciliadefines the basal body to axoneme transitionGarrett A. Greenan1,2,3, Ronald D. Vale2,3, and David A. Agard1,3
Cells use motile cilia to generate force in the extracellular space. The structure of a cilium can be classified into threesubdomains: the intracellular basal body (BB) that templates cilium formation, the extracellular axoneme that generates force,and the transition zone (TZ) that bridges them. While the BB is composed of triplet microtubules (TMTs), the axoneme iscomposed of doublet microtubules (DMTs), meaning the cilium must convert between different microtubule geometries.Here, we performed electron cryotomography to define this conversion, and our reconstructions reveal identifying structuralfeatures of the BB, TZ, and axoneme. Each region is distinct in terms of microtubule number and geometry, microtubule innerproteins, and microtubule linkers. TMT to DMT conversion occurs within the BB, and microtubule geometry changes toaxonemal by the end of the TZ, followed by the addition of axoneme-specific components essential for cilium motility. Ourresults provide the highest-resolution images of the motile cilium to date and reveal how BBs template axonemes.
IntroductionCilia are cellular compartments with specialized functions thatextend from the surface of most animal cells. There are twotypes of cilia: motile cilia that generate force in the extracellularspace, and immotile/primary cilia that detect and relay extra-cellular signals to the cell body (Malicki and Johnson, 2017; Satirand Christensen, 2007; Satir et al., 2010). Motile cilia play crit-ical roles during development to define left-right asymmetry,empower sperm motility, help transport oocytes through thefallopian tubes, and coat the respiratory tract to expel mucus andcontaminants from the lungs. This latter activity requires thecoordinated beating of hundreds of cilia on billions of epithelialcells. Conversely, primary cilia do not generate force and arepresent in just one copy on the surface of a cell. Primary ciliaserve a signaling function for many cell types: for example,retinal cells that detect light, nephrons that detect extracellularflow and ions, and nasal cells involved in olfactory perception.Extracellular signals detected by primary cilia are then trans-mitted to the cell body, where they integrate with intracellularcues to regulate cell growth and division.
Regardless of their type or function, the formation and corestructure of motile and primary cilia are quite similar (Fisch andDupuis-Williams, 2011; Ishikawa, 2017; Reiter et al., 2012).During the process of cilium formation (ciliogenesis), the cen-triole migrates to and docks with the plasmamembrane via a setof structures called distal appendages (Reiter et al., 2012). This
docking event is a key step in the cellular commitment to cili-ogenesis, and the centriole is subsequently referred to as a basalbody (BB). After docking, the microtubules of the distal BB po-lymerize to form the axoneme, the core structural unit of thecilium. The axoneme elongates and protrudes from the cellsurface, covered in membrane, forming a unique cellular com-partment with a distinct protein and lipid content.
While motile and primary cilia have many structural simi-larities, it is their molecular differences that give rise to theirfunctional differences. The doublet microtubules (DMTs) of themotile axoneme are bridged by inner dynein arms (IDAs), outerdynein arms (ODAs), and nexin-dynein regulatory complex(nexin-DRC), whose coordinated action confers motility to thewhole cilium (Heuser et al., 2009; Satir et al., 2014). Sensorycilia lack these components and are unable to generate force.Instead, primary cilia have receptors in the ciliary membranethat sense extracellular signals and transduce them into the cellbody. For example, the ciliary membrane of some primary ciliais enriched for the receptor Patched, allowing it to sense thesignaling molecule Hedgehog, unlike the surrounding plasmamembrane (Rohatgi et al., 2007).
Mutations that affect the initiation of ciliogenesis, ciliumstructure, motility, or compartment integrity result in a group ofdiseases called ciliopathies (Reiter and Leroux, 2017). Manyciliopathy-associated mutations map to a poorly defined ciliary
.............................................................................................................................................................................1Department of Biochemistry and Biophysics, University of California, San Francisco, San Francisco, CA; 2Department of Cellular and Molecular Pharmacology, University ofCalifornia, San Francisco, San Francisco, CA; 3The Howard Hughes Medical Institute, Chevy Chase, MD.
Correspondence to David A. Agard: [email protected].
© 2019 Greenan et al. This article is distributed under the terms of an Attribution–Noncommercial–Share Alike–No Mirror Sites license for the first six months after thepublication date (see http://www.rupress.org/terms/). After six months it is available under a Creative Commons License (Attribution–Noncommercial–Share Alike 4.0International license, as described at https://creativecommons.org/licenses/by-nc-sa/4.0/).
Rockefeller University Press https://doi.org/10.1083/jcb.201907060 1
J. Cell Biol. 2019
Dow
nloaded from http://rupress.org/jcb/article-pdf/219/1/e201907060/1399949/jcb_201907060.pdf by guest on 31 January 2022

subdomain that lies between the BB and the axoneme, called thetransition zone (TZ; Gonçalves and Pelletier, 2017; Reiter andLeroux, 2017; Yang et al., 2015). Collectively, the region thatencompasses the distal end of the BB and the TZ is referred to asthe ciliary base. The TZ is thought to form a selectivity barrier atthe ciliary base that separates the ciliary compartment from thecytosol (Reiter et al., 2012). This separation is proposed to beachieved by Y-shaped structures that bridge the microtubulesand the plasma membrane at the ciliary base (Gilula and Satir,1972). Studies on the flagellum of Chlamydomonas show a barrel-shaped body and wedge-shaped structures within the ciliumlumen of the TZ region (Craige et al., 2010). However, there islittle structural data on the TZ ofmammalianmotile cilia, or howit fits within the BB to axoneme transition.
Previous structural studies describe three major differencesbetween the BB and the motile axoneme. First, the BB is charac-terized by nine triplet microtubules (TMTs), whereas nine DMTsmake up the axoneme (Guichard et al., 2012; Li et al., 2012; Sui andDowning, 2006). Furthermore, the angled geometry of the BBTMTs is markedly different from the inline geometry of the ax-onemal DMTs (Paintrand et al., 1992; Sui and Downing, 2006;Vaughan and Gull, 2016). Finally, while the BB TMTs are linkedand stabilized via structures such as the A-C linker (Greenan et al.,2018; Guichard et al., 2012; Li et al., 2012), the axoneme DMTs arelinked via axonemal dyneins and nexin-DRC necessary for ciliarymotility (Heuser et al., 2009; Ishikawa, 2017). Although many ofthese components have been studied at different resolutions usinga combination of light and electron microscopy, the basic processby which the BB transitions to the axoneme is unknown. Forexample, it is unclear where the TMTs of the BB give way to theDMTs of the TZ/axoneme andwhere the geometry of the axonemeis established. One reason for the lack of structural information onthe TZ is the difficulty in imaging it in context, in a sample thatencompasses the BB, the TZ, and the axoneme.
In this work, we used electron cryotomography (cryoET) tostudy the structure of the motile cilium and determined how a BBtemplates an axoneme. The ciliated epithelium of the cow tracheaallowed us to obtain sufficient material to perform cryoET of theciliary base, followed by cryoET imaging and subvolume averaging.This has provided a structural description of the complete ciliarybase and how the mammalian TZ contributes to the overall ge-ometry of the cilium. Our data show that microtubule inner pro-teins (MIPs) are a defining feature of the ciliary base, with specificMIP patterns defining the BB, TZ, and axoneme. The data show thatthe transition from TMT to DMT axonemal geometry is a gradualprocess that happens throughout the BB and TZ domains and isdefined before axonemal components are detected. Together, ourdata suggest an axoneme-generating model whereby the TMT toDMT transition occurs first, closely followed by axoneme-geometrysetting, and finally the addition of axonemal components such asdyneins and radial spokes (RS) to generate the axoneme.
ResultsMotile cilium overviewWe purified motile cilia from the respiratory epithelium of bo-vine tracheae and imaged them by cryoET to generate feature-
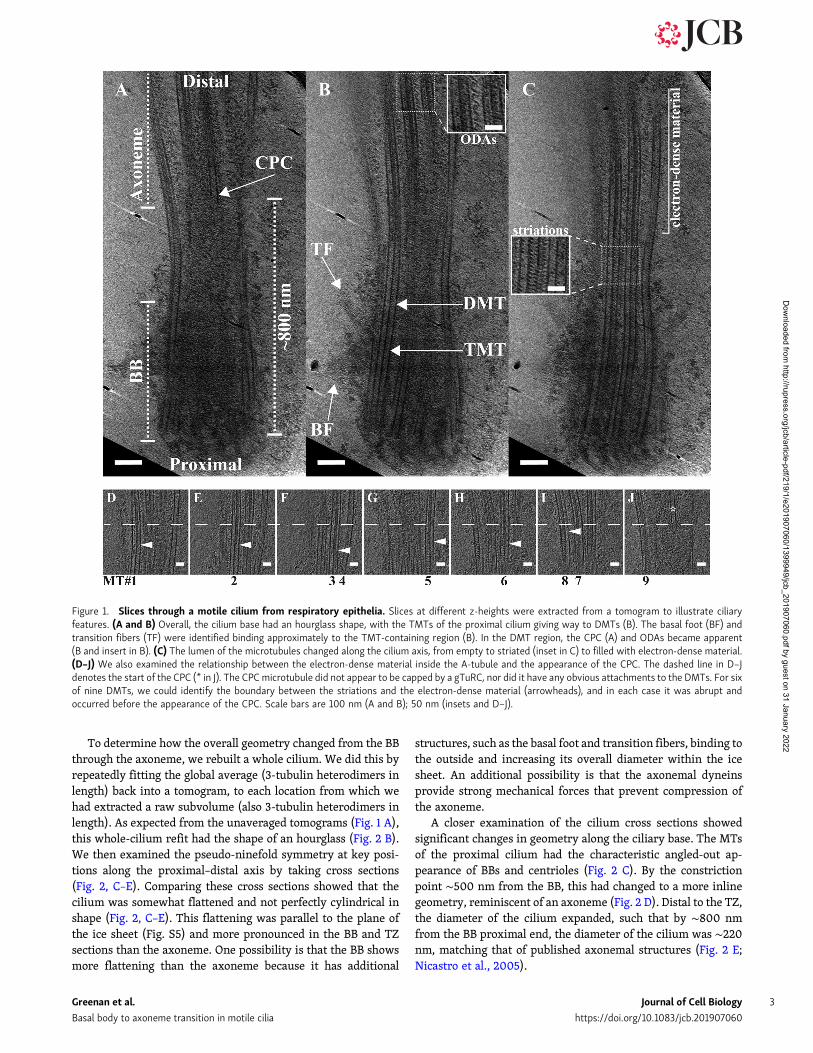
rich tomograms (n = 21 cilia). Imaging focused on a region of∼1 µm, extending from the proximal BB through the TZ and intothe axoneme (Fig. 1). Overall, this region was shaped like anhourglass, with a constriction point ∼500 nm from the proximalend (Fig. 1 A). Previous EM studies have identified features ofthe BB and the axoneme, which we also observed in our rawtomograms (Anderson, 1972; Fisch and Dupuis-Williams, 2011; Liet al., 2012). Close to the proximal end of the cilium, we observedboth the basal foot and the transition fibers binding to the TMTsof the BB (Fig. 1 B). Distal to that, in a region composed of DMTs,we observed characteristic axonemal features, including thecentral pair complex (CPC; Fig. 1 A) and ODAs (Fig. 1 B, inset).The TZ has been broadly defined as the region between the BBand axoneme (Reiter et al., 2012). In our data, this region hadstriations at 8-nm intervals, both inside the DMTs and betweenadjacent DMTs (Fig. 1 C, inset). Distal to this striated region, themicrotubules appeared to contain electron-dense material (Fig. 1C) that persisted within the microtubules for the entire field thatwas imaged (Fig. 1 B, inset). Together, these observations re-vealed distinct microtubule domains along the cilium based onmicrotubule number and MIPs.
We proceeded to more closely examine the transition be-tween the striated MIPs and the electron-dense material withinthe DMTs of the distal ciliary base. By taking several z-slicesthrough the cilium at this region, we could determine theboundary between the MIP patterns in seven of nine DMTs(Fig. 1, D–J, white arrowheads). In two of nine, the viewing an-gles did not allow this determination. While the boundary wasnot coincident across all seven of the nine DMTs, theMIP changeoccurred with an ∼100-nm window for all microtubules. Thischange in MIP pattern preceded the appearance of the first CPCmicrotubule (Fig. 1 J, asterisk). The CPC microtubule had anuncapped appearance, and it did not appear to make any con-nections with the surrounding DMTs. Furthermore, the lumenalregion preceding the CPC showed no evidence for the barrel-shaped body that has been previously observed in Chlamydo-monas flagella (Craige et al., 2010). This initial analysis showedmany unique features of the ciliary base that wewanted to studyin greater detail.
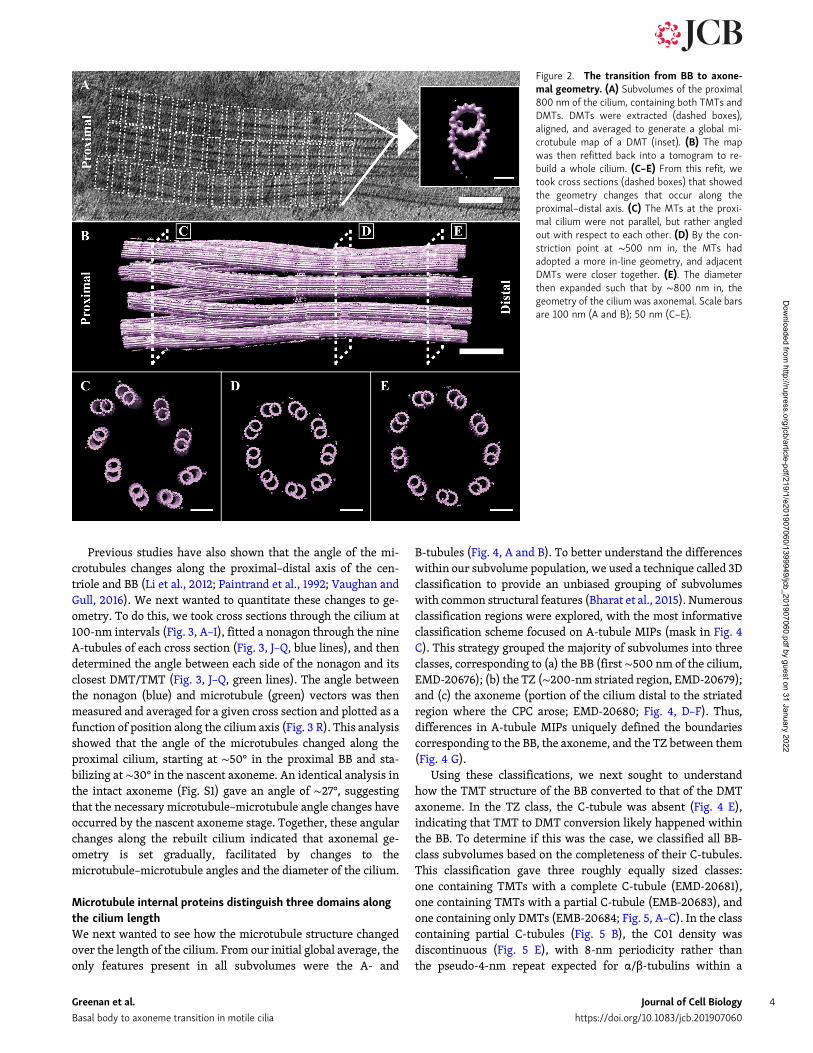
From BB to axonemal geometryOur analysis thus far had focused on the unaveraged tomograms.To view more subtle features of our data, we needed to deter-mine the structure of the cilium at higher resolution. To ac-complish this, we used subvolume averaging to combine andenhance the signal from many structurally similar units to re-veal the structure at higher resolution (Bharat et al., 2015;Briggs, 2013). Disk-shaped subvolumes, 3-tubulin heterodimers(∼24 nm) in height, were extracted along the first 800 nm of theproximal cilium, a region that contained both TMTs and DMTs(Fig. 2 A, dashed boxes). These subvolumes (n = 9,450)were thenaligned to a common reference and averaged using RELION togenerate a map representative of the entire microtubule popu-lation (Bharat et al., 2015). This average (EMBL-EBI accessionnumber EMD-20675) showed robust signal for the A- andB-tubules, whilemost other features including the C-tubulewereat <100% occupancy (Fig. 2 A, inset; and see Fig. 4, A and B).
Greenan et al. Journal of Cell Biology 2
Basal body to axoneme transition in motile cilia https://doi.org/10.1083/jcb.201907060
Dow
nloaded from http://rupress.org/jcb/article-pdf/219/1/e201907060/1399949/jcb_201907060.pdf by guest on 31 January 2022
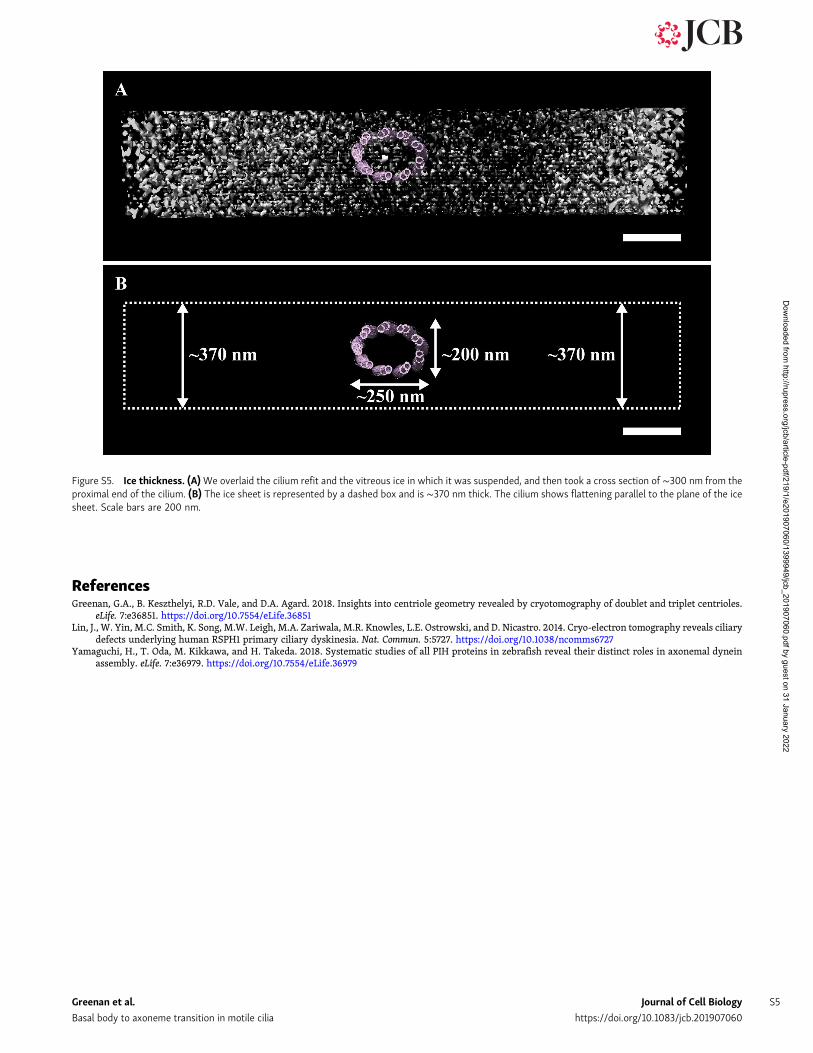
To determine how the overall geometry changed from the BBthrough the axoneme, we rebuilt a whole cilium. We did this byrepeatedly fitting the global average (3-tubulin heterodimers inlength) back into a tomogram, to each location from which wehad extracted a raw subvolume (also 3-tubulin heterodimers inlength). As expected from the unaveraged tomograms (Fig. 1 A),this whole-cilium refit had the shape of an hourglass (Fig. 2 B).We then examined the pseudo-ninefold symmetry at key posi-tions along the proximal–distal axis by taking cross sections(Fig. 2, C–E). Comparing these cross sections showed that thecilium was somewhat flattened and not perfectly cylindrical inshape (Fig. 2, C–E). This flattening was parallel to the plane ofthe ice sheet (Fig. S5) and more pronounced in the BB and TZsections than the axoneme. One possibility is that the BB showsmore flattening than the axoneme because it has additional
structures, such as the basal foot and transition fibers, binding tothe outside and increasing its overall diameter within the icesheet. An additional possibility is that the axonemal dyneinsprovide strong mechanical forces that prevent compression ofthe axoneme.
A closer examination of the cilium cross sections showedsignificant changes in geometry along the ciliary base. The MTsof the proximal cilium had the characteristic angled-out ap-pearance of BBs and centrioles (Fig. 2 C). By the constrictionpoint ∼500 nm from the BB, this had changed to a more inlinegeometry, reminiscent of an axoneme (Fig. 2 D). Distal to the TZ,the diameter of the cilium expanded, such that by ∼800 nmfrom the BB proximal end, the diameter of the cilium was ∼220nm, matching that of published axonemal structures (Fig. 2 E;Nicastro et al., 2005).
Figure 1. Slices through a motile cilium from respiratory epithelia. Slices at different z-heights were extracted from a tomogram to illustrate ciliaryfeatures. (A and B) Overall, the cilium base had an hourglass shape, with the TMTs of the proximal cilium giving way to DMTs (B). The basal foot (BF) andtransition fibers (TF) were identified binding approximately to the TMT-containing region (B). In the DMT region, the CPC (A) and ODAs became apparent(B and insert in B). (C) The lumen of the microtubules changed along the cilium axis, from empty to striated (inset in C) to filled with electron-dense material.(D–J) We also examined the relationship between the electron-dense material inside the A-tubule and the appearance of the CPC. The dashed line in D–Jdenotes the start of the CPC (* in J). The CPCmicrotubule did not appear to be capped by a gTuRC, nor did it have any obvious attachments to the DMTs. For sixof nine DMTs, we could identify the boundary between the striations and the electron-dense material (arrowheads), and in each case it was abrupt andoccurred before the appearance of the CPC. Scale bars are 100 nm (A and B); 50 nm (insets and D–J).
Greenan et al. Journal of Cell Biology 3
Basal body to axoneme transition in motile cilia https://doi.org/10.1083/jcb.201907060
Dow
nloaded from http://rupress.org/jcb/article-pdf/219/1/e201907060/1399949/jcb_201907060.pdf by guest on 31 January 2022
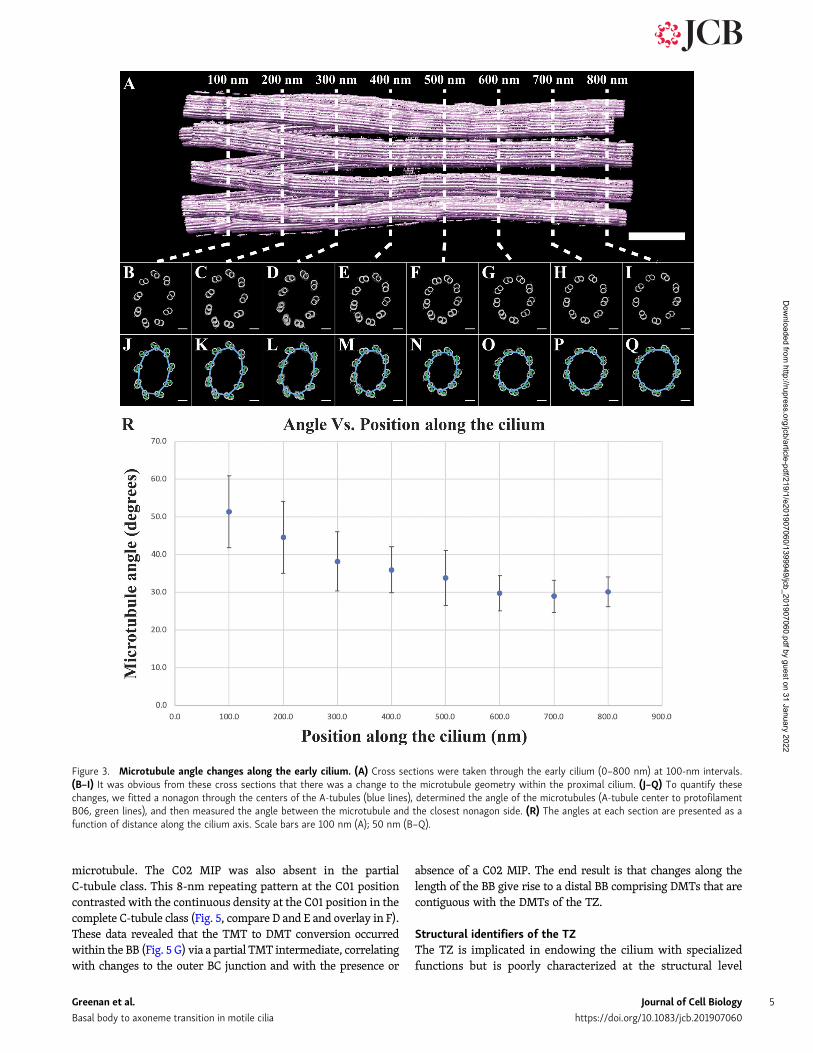
Previous studies have also shown that the angle of the mi-crotubules changes along the proximal–distal axis of the cen-triole and BB (Li et al., 2012; Paintrand et al., 1992; Vaughan andGull, 2016). We next wanted to quantitate these changes to ge-ometry. To do this, we took cross sections through the cilium at100-nm intervals (Fig. 3, A–I), fitted a nonagon through the nineA-tubules of each cross section (Fig. 3, J–Q, blue lines), and thendetermined the angle between each side of the nonagon and itsclosest DMT/TMT (Fig. 3, J–Q, green lines). The angle betweenthe nonagon (blue) and microtubule (green) vectors was thenmeasured and averaged for a given cross section and plotted as afunction of position along the cilium axis (Fig. 3 R). This analysisshowed that the angle of the microtubules changed along theproximal cilium, starting at ∼50° in the proximal BB and sta-bilizing at ∼30° in the nascent axoneme. An identical analysis inthe intact axoneme (Fig. S1) gave an angle of ∼27°, suggestingthat the necessary microtubule–microtubule angle changes haveoccurred by the nascent axoneme stage. Together, these angularchanges along the rebuilt cilium indicated that axonemal ge-ometry is set gradually, facilitated by changes to themicrotubule–microtubule angles and the diameter of the cilium.
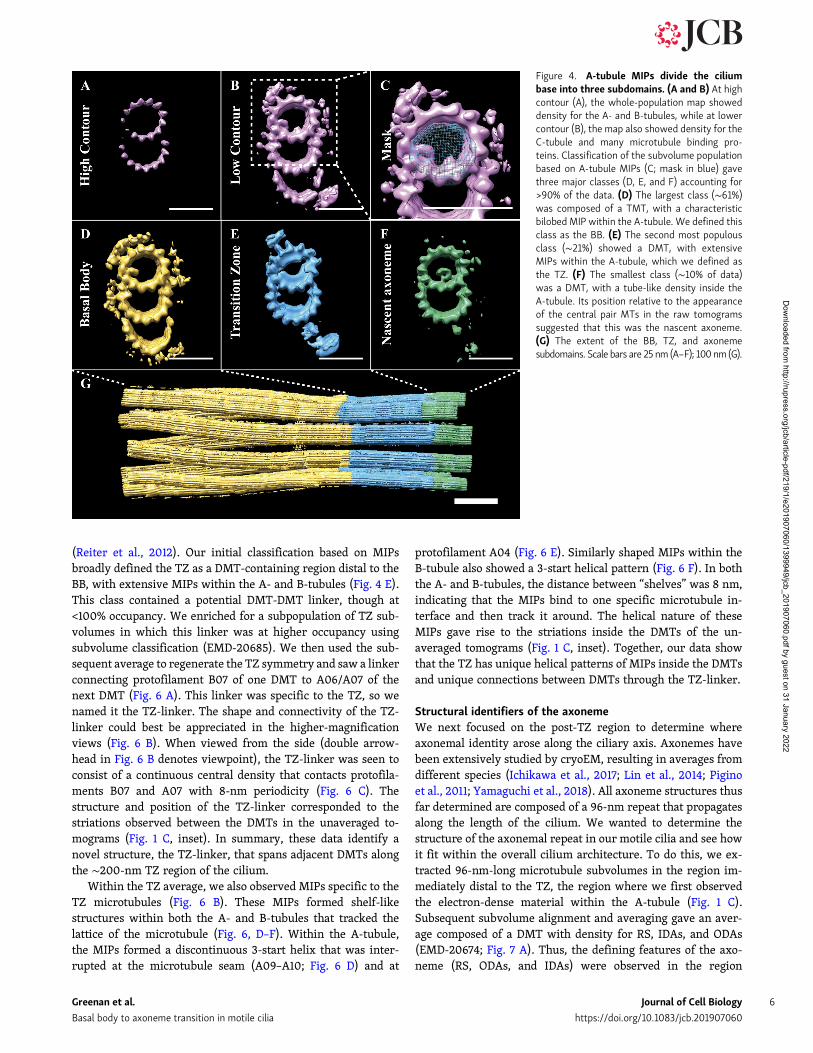
Microtubule internal proteins distinguish three domains alongthe cilium lengthWe next wanted to see how the microtubule structure changedover the length of the cilium. From our initial global average, theonly features present in all subvolumes were the A- and
B-tubules (Fig. 4, A and B). To better understand the differenceswithin our subvolume population, we used a technique called 3Dclassification to provide an unbiased grouping of subvolumeswith common structural features (Bharat et al., 2015). Numerousclassification regions were explored, with the most informativeclassification scheme focused on A-tubule MIPs (mask in Fig. 4C). This strategy grouped the majority of subvolumes into threeclasses, corresponding to (a) the BB (first∼500 nm of the cilium,EMD-20676); (b) the TZ (∼200-nm striated region, EMD-20679);and (c) the axoneme (portion of the cilium distal to the striatedregion where the CPC arose; EMD-20680; Fig. 4, D–F). Thus,differences in A-tubule MIPs uniquely defined the boundariescorresponding to the BB, the axoneme, and the TZ between them(Fig. 4 G).
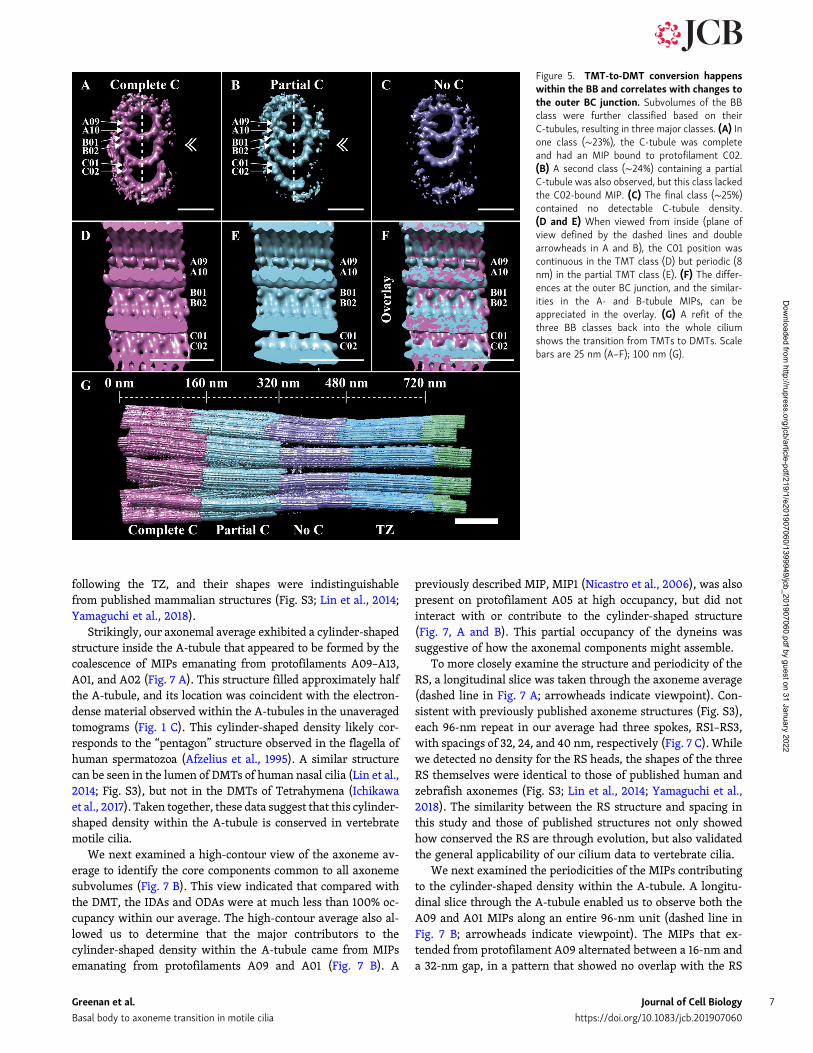
Using these classifications, we next sought to understandhow the TMT structure of the BB converted to that of the DMTaxoneme. In the TZ class, the C-tubule was absent (Fig. 4 E),indicating that TMT to DMT conversion likely happened withinthe BB. To determine if this was the case, we classified all BB-class subvolumes based on the completeness of their C-tubules.This classification gave three roughly equally sized classes:one containing TMTs with a complete C-tubule (EMD-20681),one containing TMTs with a partial C-tubule (EMB-20683), andone containing only DMTs (EMB-20684; Fig. 5, A–C). In the classcontaining partial C-tubules (Fig. 5 B), the C01 density wasdiscontinuous (Fig. 5 E), with 8-nm periodicity rather thanthe pseudo-4-nm repeat expected for α/β-tubulins within a
Figure 2. The transition from BB to axone-mal geometry. (A) Subvolumes of the proximal800 nm of the cilium, containing both TMTs andDMTs. DMTs were extracted (dashed boxes),aligned, and averaged to generate a global mi-crotubule map of a DMT (inset). (B) The mapwas then refitted back into a tomogram to re-build a whole cilium. (C–E) From this refit, wetook cross sections (dashed boxes) that showedthe geometry changes that occur along theproximal–distal axis. (C) The MTs at the proxi-mal cilium were not parallel, but rather angledout with respect to each other. (D) By the con-striction point at ∼500 nm in, the MTs hadadopted a more in-line geometry, and adjacentDMTs were closer together. (E). The diameterthen expanded such that by ∼800 nm in, thegeometry of the cilium was axonemal. Scale barsare 100 nm (A and B); 50 nm (C–E).
Greenan et al. Journal of Cell Biology 4
Basal body to axoneme transition in motile cilia https://doi.org/10.1083/jcb.201907060
Dow
nloaded from http://rupress.org/jcb/article-pdf/219/1/e201907060/1399949/jcb_201907060.pdf by guest on 31 January 2022
microtubule. The C02 MIP was also absent in the partialC-tubule class. This 8-nm repeating pattern at the C01 positioncontrasted with the continuous density at the C01 position in thecomplete C-tubule class (Fig. 5, compare D and E and overlay in F).These data revealed that the TMT to DMT conversion occurredwithin the BB (Fig. 5 G) via a partial TMT intermediate, correlatingwith changes to the outer BC junction and with the presence or
absence of a C02 MIP. The end result is that changes along thelength of the BB give rise to a distal BB comprising DMTs that arecontiguous with the DMTs of the TZ.
Structural identifiers of the TZThe TZ is implicated in endowing the cilium with specializedfunctions but is poorly characterized at the structural level
Figure 3. Microtubule angle changes along the early cilium. (A) Cross sections were taken through the early cilium (0–800 nm) at 100-nm intervals.(B–I) It was obvious from these cross sections that there was a change to the microtubule geometry within the proximal cilium. (J–Q) To quantify thesechanges, we fitted a nonagon through the centers of the A-tubules (blue lines), determined the angle of the microtubules (A-tubule center to protofilamentB06, green lines), and then measured the angle between the microtubule and the closest nonagon side. (R) The angles at each section are presented as afunction of distance along the cilium axis. Scale bars are 100 nm (A); 50 nm (B–Q).
Greenan et al. Journal of Cell Biology 5
Basal body to axoneme transition in motile cilia https://doi.org/10.1083/jcb.201907060
Dow
nloaded from http://rupress.org/jcb/article-pdf/219/1/e201907060/1399949/jcb_201907060.pdf by guest on 31 January 2022
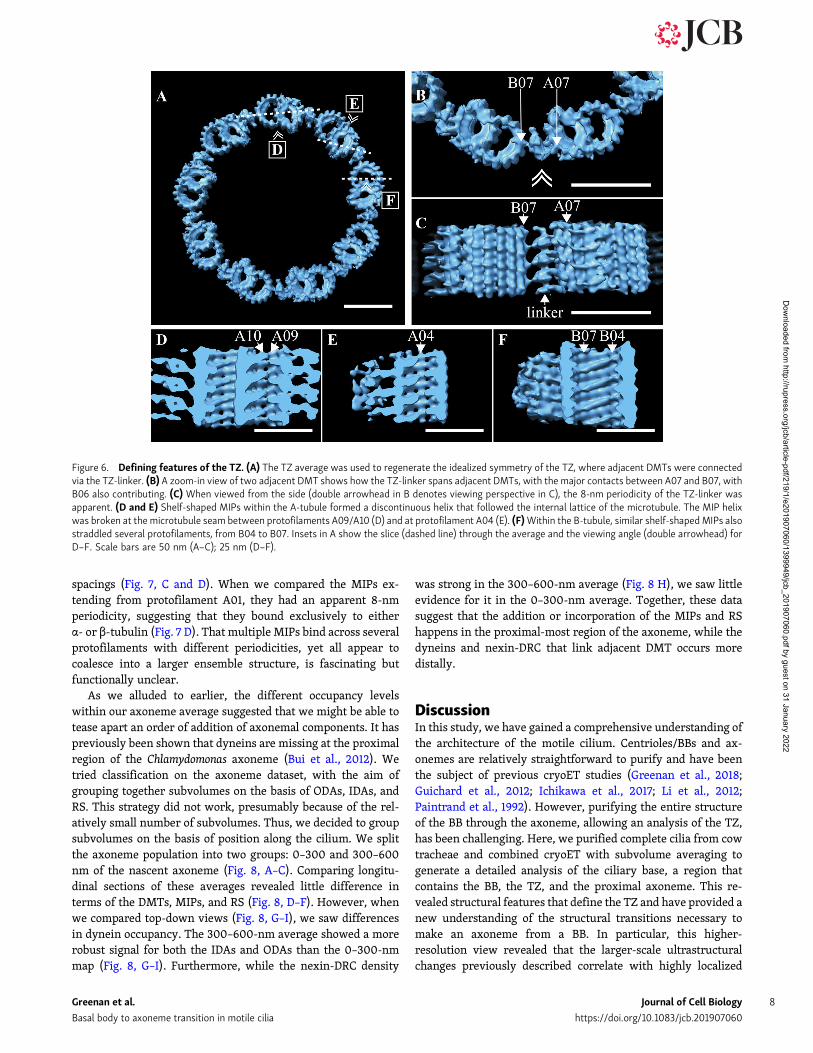
(Reiter et al., 2012). Our initial classification based on MIPsbroadly defined the TZ as a DMT-containing region distal to theBB, with extensive MIPs within the A- and B-tubules (Fig. 4 E).This class contained a potential DMT-DMT linker, though at<100% occupancy. We enriched for a subpopulation of TZ sub-volumes in which this linker was at higher occupancy usingsubvolume classification (EMD-20685). We then used the sub-sequent average to regenerate the TZ symmetry and saw a linkerconnecting protofilament B07 of one DMT to A06/A07 of thenext DMT (Fig. 6 A). This linker was specific to the TZ, so wenamed it the TZ-linker. The shape and connectivity of the TZ-linker could best be appreciated in the higher-magnificationviews (Fig. 6 B). When viewed from the side (double arrow-head in Fig. 6 B denotes viewpoint), the TZ-linker was seen toconsist of a continuous central density that contacts protofila-ments B07 and A07 with 8-nm periodicity (Fig. 6 C). Thestructure and position of the TZ-linker corresponded to thestriations observed between the DMTs in the unaveraged to-mograms (Fig. 1 C, inset). In summary, these data identify anovel structure, the TZ-linker, that spans adjacent DMTs alongthe ∼200-nm TZ region of the cilium.
Within the TZ average, we also observed MIPs specific to theTZ microtubules (Fig. 6 B). These MIPs formed shelf-likestructures within both the A- and B-tubules that tracked thelattice of the microtubule (Fig. 6, D–F). Within the A-tubule,the MIPs formed a discontinuous 3-start helix that was inter-rupted at the microtubule seam (A09–A10; Fig. 6 D) and at
protofilament A04 (Fig. 6 E). Similarly shaped MIPs within theB-tubule also showed a 3-start helical pattern (Fig. 6 F). In boththe A- and B-tubules, the distance between “shelves” was 8 nm,indicating that the MIPs bind to one specific microtubule in-terface and then track it around. The helical nature of theseMIPs gave rise to the striations inside the DMTs of the un-averaged tomograms (Fig. 1 C, inset). Together, our data showthat the TZ has unique helical patterns of MIPs inside the DMTsand unique connections between DMTs through the TZ-linker.
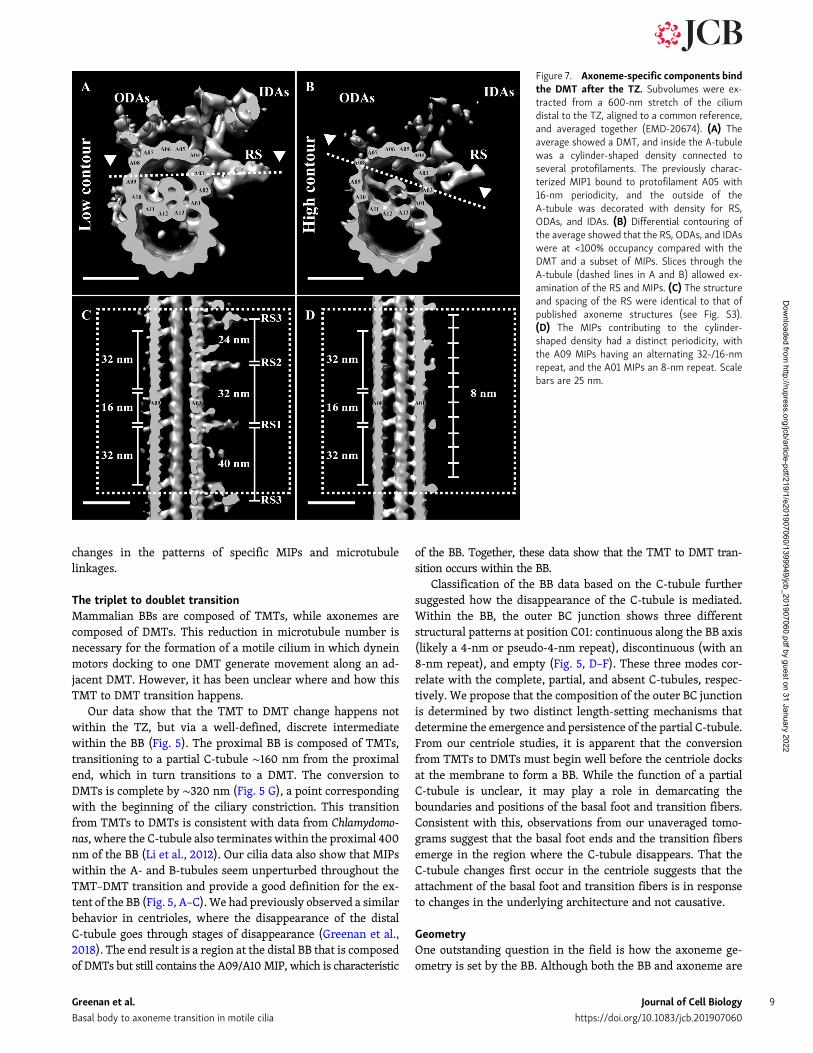
Structural identifiers of the axonemeWe next focused on the post-TZ region to determine whereaxonemal identity arose along the ciliary axis. Axonemes havebeen extensively studied by cryoEM, resulting in averages fromdifferent species (Ichikawa et al., 2017; Lin et al., 2014; Piginoet al., 2011; Yamaguchi et al., 2018). All axoneme structures thusfar determined are composed of a 96-nm repeat that propagatesalong the length of the cilium. We wanted to determine thestructure of the axonemal repeat in our motile cilia and see howit fit within the overall cilium architecture. To do this, we ex-tracted 96-nm-long microtubule subvolumes in the region im-mediately distal to the TZ, the region where we first observedthe electron-dense material within the A-tubule (Fig. 1 C).Subsequent subvolume alignment and averaging gave an aver-age composed of a DMT with density for RS, IDAs, and ODAs(EMD-20674; Fig. 7 A). Thus, the defining features of the axo-neme (RS, ODAs, and IDAs) were observed in the region
Figure 4. A-tubule MIPs divide the ciliumbase into three subdomains. (A and B) At highcontour (A), the whole-population map showeddensity for the A- and B-tubules, while at lowercontour (B), the map also showed density for theC-tubule and many microtubule binding pro-teins. Classification of the subvolume populationbased on A-tubule MIPs (C; mask in blue) gavethree major classes (D, E, and F) accounting for>90% of the data. (D) The largest class (∼61%)was composed of a TMT, with a characteristicbilobed MIP within the A-tubule. We defined thisclass as the BB. (E) The second most populousclass (∼21%) showed a DMT, with extensiveMIPs within the A-tubule, which we defined asthe TZ. (F) The smallest class (∼10% of data)was a DMT, with a tube-like density inside theA-tubule. Its position relative to the appearanceof the central pair MTs in the raw tomogramssuggested that this was the nascent axoneme.(G) The extent of the BB, TZ, and axonemesubdomains. Scale bars are 25 nm (A–F); 100 nm (G).
Greenan et al. Journal of Cell Biology 6
Basal body to axoneme transition in motile cilia https://doi.org/10.1083/jcb.201907060
Dow
nloaded from http://rupress.org/jcb/article-pdf/219/1/e201907060/1399949/jcb_201907060.pdf by guest on 31 January 2022
following the TZ, and their shapes were indistinguishablefrom published mammalian structures (Fig. S3; Lin et al., 2014;Yamaguchi et al., 2018).
Strikingly, our axonemal average exhibited a cylinder-shapedstructure inside the A-tubule that appeared to be formed by thecoalescence of MIPs emanating from protofilaments A09–A13,A01, and A02 (Fig. 7 A). This structure filled approximately halfthe A-tubule, and its location was coincident with the electron-dense material observed within the A-tubules in the unaveragedtomograms (Fig. 1 C). This cylinder-shaped density likely cor-responds to the “pentagon” structure observed in the flagella ofhuman spermatozoa (Afzelius et al., 1995). A similar structurecan be seen in the lumen of DMTs of human nasal cilia (Lin et al.,2014; Fig. S3), but not in the DMTs of Tetrahymena (Ichikawaet al., 2017). Taken together, these data suggest that this cylinder-shaped density within the A-tubule is conserved in vertebratemotile cilia.
We next examined a high-contour view of the axoneme av-erage to identify the core components common to all axonemesubvolumes (Fig. 7 B). This view indicated that compared withthe DMT, the IDAs and ODAs were at much less than 100% oc-cupancy within our average. The high-contour average also al-lowed us to determine that the major contributors to thecylinder-shaped density within the A-tubule came from MIPsemanating from protofilaments A09 and A01 (Fig. 7 B). A
previously described MIP, MIP1 (Nicastro et al., 2006), was alsopresent on protofilament A05 at high occupancy, but did notinteract with or contribute to the cylinder-shaped structure(Fig. 7, A and B). This partial occupancy of the dyneins wassuggestive of how the axonemal components might assemble.
To more closely examine the structure and periodicity of theRS, a longitudinal slice was taken through the axoneme average(dashed line in Fig. 7 A; arrowheads indicate viewpoint). Con-sistent with previously published axoneme structures (Fig. S3),each 96-nm repeat in our average had three spokes, RS1–RS3,with spacings of 32, 24, and 40 nm, respectively (Fig. 7 C). Whilewe detected no density for the RS heads, the shapes of the threeRS themselves were identical to those of published human andzebrafish axonemes (Fig. S3; Lin et al., 2014; Yamaguchi et al.,2018). The similarity between the RS structure and spacing inthis study and those of published structures not only showedhow conserved the RS are through evolution, but also validatedthe general applicability of our cilium data to vertebrate cilia.
We next examined the periodicities of the MIPs contributingto the cylinder-shaped density within the A-tubule. A longitu-dinal slice through the A-tubule enabled us to observe both theA09 and A01 MIPs along an entire 96-nm unit (dashed line inFig. 7 B; arrowheads indicate viewpoint). The MIPs that ex-tended from protofilament A09 alternated between a 16-nm anda 32-nm gap, in a pattern that showed no overlap with the RS
Figure 5. TMT-to-DMT conversion happenswithin the BB and correlates with changes tothe outer BC junction. Subvolumes of the BBclass were further classified based on theirC-tubules, resulting in three major classes. (A) Inone class (∼23%), the C-tubule was completeand had an MIP bound to protofilament C02.(B) A second class (∼24%) containing a partialC-tubule was also observed, but this class lackedthe C02-bound MIP. (C) The final class (∼25%)contained no detectable C-tubule density.(D and E) When viewed from inside (plane ofview defined by the dashed lines and doublearrowheads in A and B), the C01 position wascontinuous in the TMT class (D) but periodic (8nm) in the partial TMT class (E). (F) The differ-ences at the outer BC junction, and the similar-ities in the A- and B-tubule MIPs, can beappreciated in the overlay. (G) A refit of thethree BB classes back into the whole ciliumshows the transition from TMTs to DMTs. Scalebars are 25 nm (A–F); 100 nm (G).
Greenan et al. Journal of Cell Biology 7
Basal body to axoneme transition in motile cilia https://doi.org/10.1083/jcb.201907060
Dow
nloaded from http://rupress.org/jcb/article-pdf/219/1/e201907060/1399949/jcb_201907060.pdf by guest on 31 January 2022
spacings (Fig. 7, C and D). When we compared the MIPs ex-tending from protofilament A01, they had an apparent 8-nmperiodicity, suggesting that they bound exclusively to eitherα- or β-tubulin (Fig. 7 D). That multiple MIPs bind across severalprotofilaments with different periodicities, yet all appear tocoalesce into a larger ensemble structure, is fascinating butfunctionally unclear.
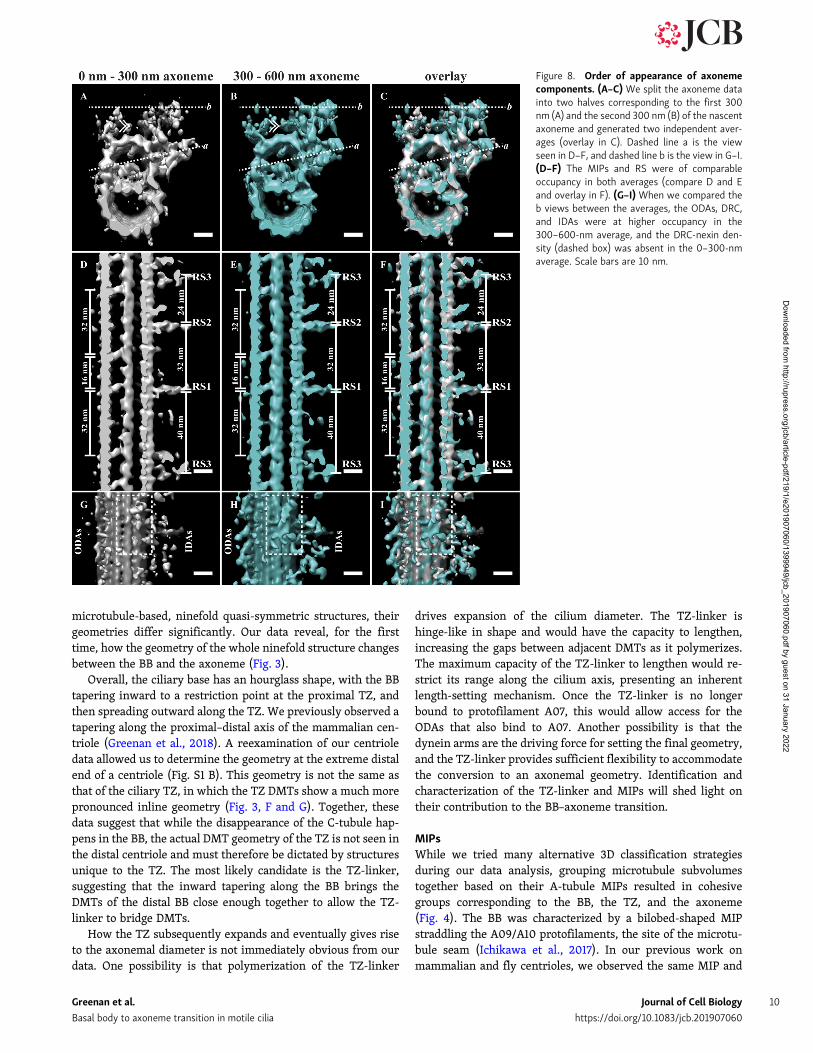
As we alluded to earlier, the different occupancy levelswithin our axoneme average suggested that we might be able totease apart an order of addition of axonemal components. It haspreviously been shown that dyneins are missing at the proximalregion of the Chlamydomonas axoneme (Bui et al., 2012). Wetried classification on the axoneme dataset, with the aim ofgrouping together subvolumes on the basis of ODAs, IDAs, andRS. This strategy did not work, presumably because of the rel-atively small number of subvolumes. Thus, we decided to groupsubvolumes on the basis of position along the cilium. We splitthe axoneme population into two groups: 0–300 and 300–600nm of the nascent axoneme (Fig. 8, A–C). Comparing longitu-dinal sections of these averages revealed little difference interms of the DMTs, MIPs, and RS (Fig. 8, D–F). However, whenwe compared top-down views (Fig. 8, G–I), we saw differencesin dynein occupancy. The 300–600-nm average showed a morerobust signal for both the IDAs and ODAs than the 0–300-nmmap (Fig. 8, G–I). Furthermore, while the nexin-DRC density
was strong in the 300–600-nm average (Fig. 8 H), we saw littleevidence for it in the 0–300-nm average. Together, these datasuggest that the addition or incorporation of the MIPs and RShappens in the proximal-most region of the axoneme, while thedyneins and nexin-DRC that link adjacent DMT occurs moredistally.
DiscussionIn this study, we have gained a comprehensive understanding ofthe architecture of the motile cilium. Centrioles/BBs and ax-onemes are relatively straightforward to purify and have beenthe subject of previous cryoET studies (Greenan et al., 2018;Guichard et al., 2012; Ichikawa et al., 2017; Li et al., 2012;Paintrand et al., 1992). However, purifying the entire structureof the BB through the axoneme, allowing an analysis of the TZ,has been challenging. Here, we purified complete cilia from cowtracheae and combined cryoET with subvolume averaging togenerate a detailed analysis of the ciliary base, a region thatcontains the BB, the TZ, and the proximal axoneme. This re-vealed structural features that define the TZ and have provided anew understanding of the structural transitions necessary tomake an axoneme from a BB. In particular, this higher-resolution view revealed that the larger-scale ultrastructuralchanges previously described correlate with highly localized
Figure 6. Defining features of the TZ. (A) The TZ average was used to regenerate the idealized symmetry of the TZ, where adjacent DMTs were connectedvia the TZ-linker. (B) A zoom-in view of two adjacent DMT shows how the TZ-linker spans adjacent DMTs, with the major contacts between A07 and B07, withB06 also contributing. (C) When viewed from the side (double arrowhead in B denotes viewing perspective in C), the 8-nm periodicity of the TZ-linker wasapparent. (D and E) Shelf-shaped MIPs within the A-tubule formed a discontinuous helix that followed the internal lattice of the microtubule. The MIP helixwas broken at the microtubule seam between protofilaments A09/A10 (D) and at protofilament A04 (E). (F)Within the B-tubule, similar shelf-shapedMIPs alsostraddled several protofilaments, from B04 to B07. Insets in A show the slice (dashed line) through the average and the viewing angle (double arrowhead) forD–F. Scale bars are 50 nm (A–C); 25 nm (D–F).
Greenan et al. Journal of Cell Biology 8
Basal body to axoneme transition in motile cilia https://doi.org/10.1083/jcb.201907060
Dow
nloaded from http://rupress.org/jcb/article-pdf/219/1/e201907060/1399949/jcb_201907060.pdf by guest on 31 January 2022
changes in the patterns of specific MIPs and microtubulelinkages.
The triplet to doublet transitionMammalian BBs are composed of TMTs, while axonemes arecomposed of DMTs. This reduction in microtubule number isnecessary for the formation of a motile cilium in which dyneinmotors docking to one DMT generate movement along an ad-jacent DMT. However, it has been unclear where and how thisTMT to DMT transition happens.
Our data show that the TMT to DMT change happens notwithin the TZ, but via a well-defined, discrete intermediatewithin the BB (Fig. 5). The proximal BB is composed of TMTs,transitioning to a partial C-tubule ∼160 nm from the proximalend, which in turn transitions to a DMT. The conversion toDMTs is complete by ∼320 nm (Fig. 5 G), a point correspondingwith the beginning of the ciliary constriction. This transitionfrom TMTs to DMTs is consistent with data from Chlamydomo-nas, where the C-tubule also terminates within the proximal 400nm of the BB (Li et al., 2012). Our cilia data also show that MIPswithin the A- and B-tubules seem unperturbed throughout theTMT–DMT transition and provide a good definition for the ex-tent of the BB (Fig. 5, A–C).We had previously observed a similarbehavior in centrioles, where the disappearance of the distalC-tubule goes through stages of disappearance (Greenan et al.,2018). The end result is a region at the distal BB that is composedof DMTs but still contains the A09/A10MIP, which is characteristic
of the BB. Together, these data show that the TMT to DMT tran-sition occurs within the BB.
Classification of the BB data based on the C-tubule furthersuggested how the disappearance of the C-tubule is mediated.Within the BB, the outer BC junction shows three differentstructural patterns at position C01: continuous along the BB axis(likely a 4-nm or pseudo-4-nm repeat), discontinuous (with an8-nm repeat), and empty (Fig. 5, D–F). These three modes cor-relate with the complete, partial, and absent C-tubules, respec-tively. We propose that the composition of the outer BC junctionis determined by two distinct length-setting mechanisms thatdetermine the emergence and persistence of the partial C-tubule.From our centriole studies, it is apparent that the conversionfrom TMTs to DMTs must begin well before the centriole docksat the membrane to form a BB. While the function of a partialC-tubule is unclear, it may play a role in demarcating theboundaries and positions of the basal foot and transition fibers.Consistent with this, observations from our unaveraged tomo-grams suggest that the basal foot ends and the transition fibersemerge in the region where the C-tubule disappears. That theC-tubule changes first occur in the centriole suggests that theattachment of the basal foot and transition fibers is in responseto changes in the underlying architecture and not causative.
GeometryOne outstanding question in the field is how the axoneme ge-ometry is set by the BB. Although both the BB and axoneme are
Figure 7. Axoneme-specific components bindthe DMT after the TZ. Subvolumes were ex-tracted from a 600-nm stretch of the ciliumdistal to the TZ, aligned to a common reference,and averaged together (EMD-20674). (A) Theaverage showed a DMT, and inside the A-tubulewas a cylinder-shaped density connected toseveral protofilaments. The previously charac-terized MIP1 bound to protofilament A05 with16-nm periodicity, and the outside of theA-tubule was decorated with density for RS,ODAs, and IDAs. (B) Differential contouring ofthe average showed that the RS, ODAs, and IDAswere at <100% occupancy compared with theDMT and a subset of MIPs. Slices through theA-tubule (dashed lines in A and B) allowed ex-amination of the RS and MIPs. (C) The structureand spacing of the RS were identical to that ofpublished axoneme structures (see Fig. S3).(D) The MIPs contributing to the cylinder-shaped density had a distinct periodicity, withthe A09 MIPs having an alternating 32-/16-nmrepeat, and the A01 MIPs an 8-nm repeat. Scalebars are 25 nm.
Greenan et al. Journal of Cell Biology 9
Basal body to axoneme transition in motile cilia https://doi.org/10.1083/jcb.201907060
Dow
nloaded from http://rupress.org/jcb/article-pdf/219/1/e201907060/1399949/jcb_201907060.pdf by guest on 31 January 2022
microtubule-based, ninefold quasi-symmetric structures, theirgeometries differ significantly. Our data reveal, for the firsttime, how the geometry of the whole ninefold structure changesbetween the BB and the axoneme (Fig. 3).
Overall, the ciliary base has an hourglass shape, with the BBtapering inward to a restriction point at the proximal TZ, andthen spreading outward along the TZ. We previously observed atapering along the proximal–distal axis of the mammalian cen-triole (Greenan et al., 2018). A reexamination of our centrioledata allowed us to determine the geometry at the extreme distalend of a centriole (Fig. S1 B). This geometry is not the same asthat of the ciliary TZ, in which the TZ DMTs show a much morepronounced inline geometry (Fig. 3, F and G). Together, thesedata suggest that while the disappearance of the C-tubule hap-pens in the BB, the actual DMT geometry of the TZ is not seen inthe distal centriole and must therefore be dictated by structuresunique to the TZ. The most likely candidate is the TZ-linker,suggesting that the inward tapering along the BB brings theDMTs of the distal BB close enough together to allow the TZ-linker to bridge DMTs.
How the TZ subsequently expands and eventually gives riseto the axonemal diameter is not immediately obvious from ourdata. One possibility is that polymerization of the TZ-linker
drives expansion of the cilium diameter. The TZ-linker ishinge-like in shape and would have the capacity to lengthen,increasing the gaps between adjacent DMTs as it polymerizes.The maximum capacity of the TZ-linker to lengthen would re-strict its range along the cilium axis, presenting an inherentlength-setting mechanism. Once the TZ-linker is no longerbound to protofilament A07, this would allow access for theODAs that also bind to A07. Another possibility is that thedynein arms are the driving force for setting the final geometry,and the TZ-linker provides sufficient flexibility to accommodatethe conversion to an axonemal geometry. Identification andcharacterization of the TZ-linker and MIPs will shed light ontheir contribution to the BB–axoneme transition.
MIPsWhile we tried many alternative 3D classification strategiesduring our data analysis, grouping microtubule subvolumestogether based on their A-tubule MIPs resulted in cohesivegroups corresponding to the BB, the TZ, and the axoneme(Fig. 4). The BB was characterized by a bilobed-shaped MIPstraddling the A09/A10 protofilaments, the site of the microtu-bule seam (Ichikawa et al., 2017). In our previous work onmammalian and fly centrioles, we observed the same MIP and
Figure 8. Order of appearance of axonemecomponents. (A–C) We split the axoneme datainto two halves corresponding to the first 300nm (A) and the second 300 nm (B) of the nascentaxoneme and generated two independent aver-ages (overlay in C). Dashed line a is the viewseen in D–F, and dashed line b is the view in G–I.(D–F) The MIPs and RS were of comparableoccupancy in both averages (compare D and Eand overlay in F). (G–I) When we compared theb views between the averages, the ODAs, DRC,and IDAs were at higher occupancy in the300–600-nm average, and the DRC-nexin den-sity (dashed box) was absent in the 0–300-nmaverage. Scale bars are 10 nm.
Greenan et al. Journal of Cell Biology 10
Basal body to axoneme transition in motile cilia https://doi.org/10.1083/jcb.201907060
Dow
nloaded from http://rupress.org/jcb/article-pdf/219/1/e201907060/1399949/jcb_201907060.pdf by guest on 31 January 2022

suggested it as a centriole marker (Greenan et al., 2018). Theposition and structure of this MIP are highly conserved betweencentrioles and BBs in this study, and we speculate that it couldplay a role in the stability or functionalization of themicrotubuleseam, or in limiting the extent of microtubule depolymerizationduring cilium resorption.
A structurally unrelated MIP pattern is the defining featureof the TZ. The MIPs in the TZ form shelf-like protrusions withinthe lumen of the A- and B-tubules (Fig. 6). Within the A-tubule,these shelf-like MIPs form a discontinuous 3-start helix thatappears to track the lattice of the microtubule. Similarly, themore limited B-tubule MIPs of the TZ also track the microtubulelattice. A similar helix was previously described binding to theinside of the distal microtubules of human sperm (Zabeo et al.,2018). Defining the function of these helical MIPs is an impor-tant direction for future work; possible roles could be as struc-tural struts, helping to define TZ geometry, or inducingconformational changes in the microtubule that functionalizethe outer surface of the microtubule lattice.
From both the unaveraged data and our subvolume averages,the TZ MIPs terminate abruptly, giving rise to a third MIP do-main that characterizes the axoneme (Fig. 1 C). We observed anelaborate structure in which MIPs extending from multipleprotofilaments appear to coalesce to form a cylinder-shapeddensity within the A-tubule (Fig. 7). Such a structure has pre-viously been described as a pentagon within the A-tubule ofhuman spermatozoa (Afzelius et al., 1995). In light of our currentfindings, a reexamination of published cryoET maps is consis-tent with such a structure in human-respiratory axonemes (Fig.S3; Lin et al., 2014). Previous published axonemal structures ofcomparable and better resolution have not revealed this struc-ture (Ishikawa, 2017; Yamaguchi et al., 2018), suggesting that thecylinder-shaped density may be specific to motile, mammalianaxonemes. While we do not know the function of the cylinder-shaped density, given its protofilament-bridging nature, wepostulate that it acts as a structural brace.
Defining the TZOne feature that is often used to define the TZ are the Y-links,structures that bridge the gap between the DMTs and themembrane (Gilula and Satir, 1972). These Y-links have beenobserved in thin sections of embedded cilia and appear distal tothe transition fibers, which would place them in the distal BB orproximal TZ. However, we see no evidence for Y-links in eitherthe unaveraged tomograms or subvolume averages of these re-gions, perhaps due to detergent removal of membrane in ourcilium preparations.
From our motile cilia data, the unifying feature of TZ mi-crotubules is the shelf-like MIPs that decorate the lumen of theA-tubule. A second feature are the TZ-linkers (Fig. 6 B). Theseare distinct linkages that connect adjacent TZ DMTs and producethe striated pattern observed in the raw data. These linkers werenot at 100% occupancy in the overall TZ average, suggestingeither structural flexibility or that they do not persist through-out the entire TZ. Upon enriching for the linker by subvolume3D classification, we can see that the TZ-linker bridges adjacentDMTs, providing a novel linkage between the A07 and B06/B07
protofilaments (Fig. 6 B). The position of this TZ-linker is dif-ferent from the position of the A-C linker seen in centrioles(protofilament A09), indicating yet another novel lineage thatcan link DMTs (see Fig. S2 for comparison). One function of theTZ-linker would appear to be to hold the DMTs together. Inaddition, the TZ-linker may play a role in defining the geometryof the axoneme, since the appearance of the TZ-linker is coin-cident with the expansion in diameter of the axoneme. Furtherwork identifying the components of the TZ-linker will provide afoundation for addressing these questions.
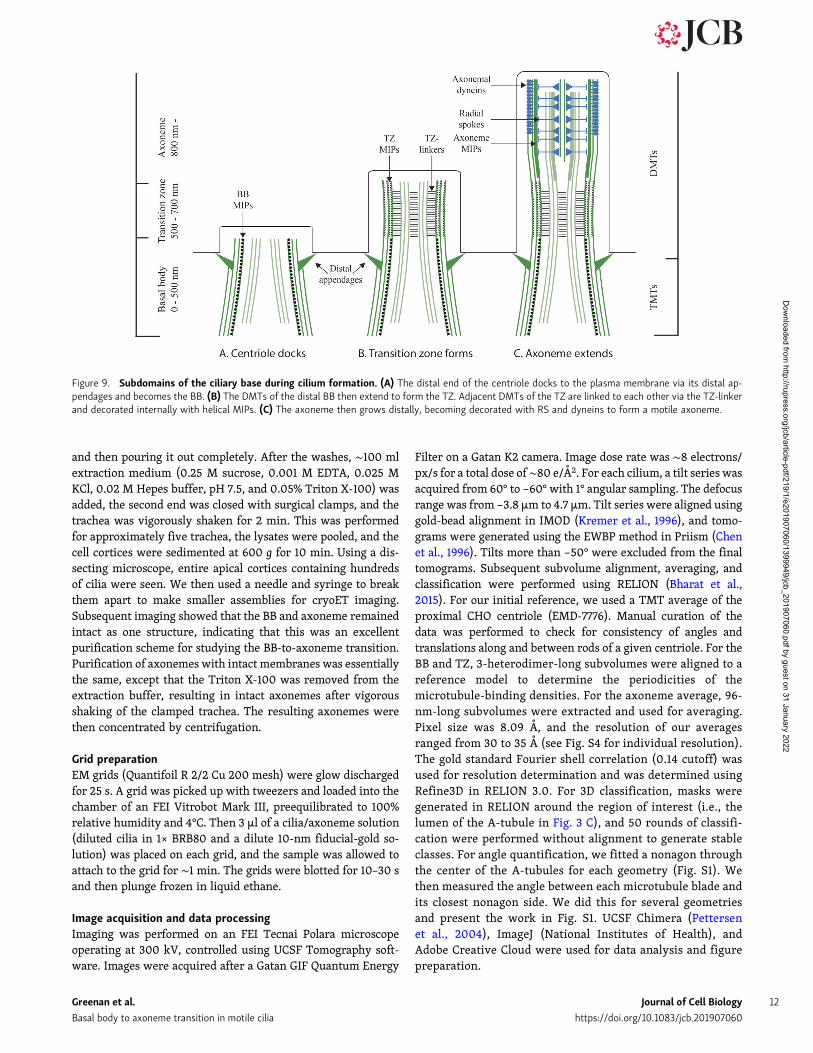
OutlookIntegrating our current data with that from previous studies oncentrioles, BBs, and axonemes has allowed us to speculate whatroles the nonmicrotubule densities play in microtubule func-tionalization and stabilization, and in the process of ciliogenesismore broadly. Following docking of a centriole to the plasmamembrane via its distal appendages, the ciliary compartment isestablished and is distinct from the cytoplasm (Fig. 9 A). In thisnewly established compartment, the DMTs of the distal BBelongate and are bound by the TZ-linker and the shelf-like TZMIPs that characterize the TZ (Fig. 9 B). The diameter of thecilium expands along the length of the TZ, resulting in axoneme-like geometry. Well-characterized proteins of the axoneme suchas the RS, IDAs, and ODAs are then able to bind to the DMTs(Fig. 9 C). Within the DMTs of the axoneme, MIPs coalesce toform a cylinder-like density, presumably providing structuralsupport to the axonemal microtubules, perhaps even providingpositional cues to other microtubule-associated proteins such asthe RS (Fig. 9 C). Once established, the axoneme elongates toform a functional motile cilium several micrometers in length.
Our cryoET imaging of cilia followed by subvolume averagingallowed us to visualize the numerous densities decorating boththe internal and external surfaces of the ciliary microtubules.The work of assigning identities to the nonmicrotubule densitiesthroughout the cilium, and assessing their contribution to afunctional cilium, are now critical directions for future research.Furthermore, the major limitation of this current study was ourinability to identify how the microtubules interact with theplasma and ciliary membranes. Interactions between the distalappendages and the plasma membrane, and the ciliary mem-brane and microtubules of the TZ, are central to cilium forma-tion and function. Understanding these interactions requiresimaging cilia in situ, the next big challenge for the field.
Materials and methodsSample preparationFresh bovine tracheae were collected from the slaughterhouseand immediately placed in ice-cold PBS. Transport to the labo-ratory took ∼90 min, and all subsequent steps were performedin the cold room at 4°C. The purification of intact cilia was basedon published work (Anderson, 1974), with several adaptations.The tracheae were left as an intact unit for the preparation andnot cut into pieces as previously described. Large surgicalclamps were used to close one end of the trachea. The tracheawas then washed with PBS and saline by filling it up (∼500 ml)
Greenan et al. Journal of Cell Biology 11
Basal body to axoneme transition in motile cilia https://doi.org/10.1083/jcb.201907060
Dow
nloaded from http://rupress.org/jcb/article-pdf/219/1/e201907060/1399949/jcb_201907060.pdf by guest on 31 January 2022
and then pouring it out completely. After the washes, ∼100 mlextraction medium (0.25 M sucrose, 0.001 M EDTA, 0.025 MKCl, 0.02 M Hepes buffer, pH 7.5, and 0.05% Triton X-100) wasadded, the second end was closed with surgical clamps, and thetrachea was vigorously shaken for 2 min. This was performedfor approximately five trachea, the lysates were pooled, and thecell cortices were sedimented at 600 g for 10 min. Using a dis-secting microscope, entire apical cortices containing hundredsof cilia were seen. We then used a needle and syringe to breakthem apart to make smaller assemblies for cryoET imaging.Subsequent imaging showed that the BB and axoneme remainedintact as one structure, indicating that this was an excellentpurification scheme for studying the BB-to-axoneme transition.Purification of axonemes with intact membranes was essentiallythe same, except that the Triton X-100 was removed from theextraction buffer, resulting in intact axonemes after vigorousshaking of the clamped trachea. The resulting axonemes werethen concentrated by centrifugation.
Grid preparationEM grids (Quantifoil R 2/2 Cu 200 mesh) were glow dischargedfor 25 s. A grid was picked up with tweezers and loaded into thechamber of an FEI Vitrobot Mark III, preequilibrated to 100%relative humidity and 4°C. Then 3 µl of a cilia/axoneme solution(diluted cilia in 1× BRB80 and a dilute 10-nm fiducial-gold so-lution) was placed on each grid, and the sample was allowed toattach to the grid for ∼1 min. The grids were blotted for 10–30 sand then plunge frozen in liquid ethane.
Image acquisition and data processingImaging was performed on an FEI Tecnai Polara microscopeoperating at 300 kV, controlled using UCSF Tomography soft-ware. Images were acquired after a Gatan GIF Quantum Energy
Filter on a Gatan K2 camera. Image dose rate was ∼8 electrons/px/s for a total dose of∼80 e/A2. For each cilium, a tilt series wasacquired from 60° to −60° with 1° angular sampling. The defocusrange was from −3.8 µm to 4.7 µm. Tilt series were aligned usinggold-bead alignment in IMOD (Kremer et al., 1996), and tomo-grams were generated using the EWBP method in Priism (Chenet al., 1996). Tilts more than −50° were excluded from the finaltomograms. Subsequent subvolume alignment, averaging, andclassification were performed using RELION (Bharat et al.,2015). For our initial reference, we used a TMT average of theproximal CHO centriole (EMD-7776). Manual curation of thedata was performed to check for consistency of angles andtranslations along and between rods of a given centriole. For theBB and TZ, 3-heterodimer-long subvolumes were aligned to areference model to determine the periodicities of themicrotubule-binding densities. For the axoneme average, 96-nm-long subvolumes were extracted and used for averaging.Pixel size was 8.09 A, and the resolution of our averagesranged from 30 to 35 A (see Fig. S4 for individual resolution).The gold standard Fourier shell correlation (0.14 cutoff) wasused for resolution determination and was determined usingRefine3D in RELION 3.0. For 3D classification, masks weregenerated in RELION around the region of interest (i.e., thelumen of the A-tubule in Fig. 3 C), and 50 rounds of classifi-cation were performed without alignment to generate stableclasses. For angle quantification, we fitted a nonagon throughthe center of the A-tubules for each geometry (Fig. S1). Wethen measured the angle between each microtubule blade andits closest nonagon side. We did this for several geometriesand present the work in Fig. S1. UCSF Chimera (Pettersenet al., 2004), ImageJ (National Institutes of Health), andAdobe Creative Cloud were used for data analysis and figurepreparation.
Figure 9. Subdomains of the ciliary base during cilium formation. (A) The distal end of the centriole docks to the plasma membrane via its distal ap-pendages and becomes the BB. (B) The DMTs of the distal BB then extend to form the TZ. Adjacent DMTs of the TZ are linked to each other via the TZ-linkerand decorated internally with helical MIPs. (C) The axoneme then grows distally, becoming decorated with RS and dyneins to form a motile axoneme.
Greenan et al. Journal of Cell Biology 12
Basal body to axoneme transition in motile cilia https://doi.org/10.1083/jcb.201907060
Dow
nloaded from http://rupress.org/jcb/article-pdf/219/1/e201907060/1399949/jcb_201907060.pdf by guest on 31 January 2022
Data availabilityThe following maps are available in the Electron Microscopy DataBank: EMD-20674, nascent axoneme from bovine respiratory ep-ithelial cells; EMD-20675, whole-population average of the first800 nm of the bovine respiratory epithelium; EMD-20676, averageof the BB from bovine respiratory cilia; EMD-20679, average of theTZ from bovine respiratory cilia; EMD-20680, average of theproximal axoneme from bovine respiratory cilia; EMD-20681,average of the proximal BB from bovine respiratory cilia; EMD-20683, average of the mid BB from bovine respiratory cilia;EMD-20684, average of the distal BB from bovine respiratorycilia; and EMD-20685, average of the TZ-linker from bovinerespiratory cilia.
Online supplemental materialFig. S1 shows the quantification of microtubule angles inthe mammalian centriole and axoneme. Fig. S2 comparesmicrotubule–microtubule linkers between centrioles and themotile cilium. Fig. S3 compares axoneme structures frompreviously published studies to axonemes with our currentaverage. Fig. S4 shows the resolution determination of eachof our averages using the gold standard Fourier shell corre-lation in RELION. Fig. S5 shows that the ice thickness in ourtomograms is thicker than the axoneme, but flattening isalong the plane of the ice sheet.
AcknowledgmentsWe thank members of the Agard and Vale laboratories forproviding a unique scientific environment in which to per-form these experiments. In particular, we thank Nan Zhang,Stefan Niekamp, Gira Bhabha, and Iris Grossmann for helpwith the trachea preps. CryoET imaging and analysis weredone with the help and support of the amazing EM facility atthe University of California, San Francisco (Michael Braunfeldand David Bulkley), and the Wynton computing cluster at theUniversity of California, San Francisco. Special thanks to MattHarrington and Eric Branlund for help and advice on com-puting issues and Kara McKinley for discussions and feedbackon manuscript preparation.
This work was made possible by generous funding fromNational Institutes of Health grants GM031627 (D.A. Agard),GM118099 (D.A. Agard), and GM118106 (R.D. Vale), NationalInstitutes of Health S10 equipment grants (S10OD020054 andS10OD021741), and funding from the Howard Hughes MedicalInstitute (D.A. Agard and R.D. Vale).
The authors declare no competing financial interests.Author contributions: G.A. Greenan, R.D. Vale, and D.A.
Agard conceived the study and designed the experiments. G.A.Greenan performed the biochemistry, data acquisition, andstructure refinement. G.A. Greenan, R.D. Vale, and D.A. Agardtogether analyzed the data and prepared the manuscript forpublication.
Submitted: 9 July 2019Revised: 23 October 2019Accepted: 28 October 2019
ReferencesAfzelius, B.A., R. Dallai, S. Lanzavecchia, and P.L. Bellon. 1995. Flagellar
structure in normal human spermatozoa and in spermatozoa that lackdynein arms. Tissue Cell. 27:241–247. https://doi.org/10.1016/S0040-8166(95)80044-1
Anderson, R.G. 1972. The three-dimensional structure of the basal body fromthe rhesus monkey oviduct. J. Cell Biol. 54:246–265. https://doi.org/10.1083/jcb.54.2.246
Anderson, R.G. 1974. Isolation of ciliated or unciliated basal bodies from therabbit oviduct. J. Cell Biol. 60:393–404. https://doi.org/10.1083/jcb.60.2.393
Bharat, T.A.M., C.J. Russo, J. Lowe, L.A. Passmore, and S.H.W. Scheres. 2015.Advances in Single-Particle Electron Cryomicroscopy Structure Deter-mination applied to Sub-tomogram Averaging. Structure. 23:1743–1753.https://doi.org/10.1016/j.str.2015.06.026
Briggs, J.A. 2013. Structural biology in situ--the potential of subtomogramaveraging. Curr. Opin. Struct. Biol. 23:261–267. https://doi.org/10.1016/j.sbi.2013.02.003
Bui, K.H., T. Yagi, R. Yamamoto, R. Kamiya, and T. Ishikawa. 2012. Polarityand asymmetry in the arrangement of dynein and related structures inthe Chlamydomonas axoneme. J. Cell Biol. 198:913–925. https://doi.org/10.1083/jcb.201201120
Chen, H., D.D. Hughes, T.A. Chan, J.W. Sedat, and D.A. Agard. 1996. IVE(Image Visualization Environment): a software platform for all three-dimensional microscopy applications. J. Struct. Biol. 116:56–60. https://doi.org/10.1006/jsbi.1996.0010
Craige, B., C.C. Tsao, D.R. Diener, Y. Hou, K.F. Lechtreck, J.L. Rosenbaum, andG.B. Witman. 2010. CEP290 tethers flagellar transition zone micro-tubules to the membrane and regulates flagellar protein content. J. CellBiol. 190:927–940. https://doi.org/10.1083/jcb.201006105
Fisch, C., and P. Dupuis-Williams. 2011. Ultrastructure of cilia and flagella - backto the future! Biol. Cell. 103:249–270. https://doi.org/10.1042/BC20100139
Gilula, N.B., and P. Satir. 1972. The ciliary necklace. A ciliary membrane spe-cialization. J. Cell Biol. 53:494–509. https://doi.org/10.1083/jcb.53.2.494
Gonçalves, J., and L. Pelletier. 2017. The Ciliary Transition Zone: Finding thePieces and Assembling the Gate.Mol. Cells. 40:243–253. https://doi.org/10.14348/molcells.2017.0054
Greenan, G.A., B. Keszthelyi, R.D. Vale, and D.A. Agard. 2018. Insights intocentriole geometry revealed by cryotomography of doublet and tripletcentrioles. eLife. 7:e36851. https://doi.org/10.7554/eLife.36851
Guichard, P., A. Desfosses, A. Maheshwari, V. Hachet, C. Dietrich, A. Brune, T.Ishikawa, C. Sachse, and P. Gonczy. 2012. Cartwheel architecture of Tricho-nympha basal body. Science. 337:553. https://doi.org/10.1126/science.1222789
Heuser, T., M. Raytchev, J. Krell, M.E. Porter, and D. Nicastro. 2009. Thedynein regulatory complex is the nexin link and a major regulatorynode in cilia and flagella. J. Cell Biol. 187:921–933. https://doi.org/10.1083/jcb.200908067
Ichikawa, M., D. Liu, P.L. Kastritis, K. Basu, T.C. Hsu, S. Yang, and K.H. Bui.2017. Subnanometre-resolution structure of the doublet microtubulereveals new classes of microtubule-associated proteins.Nat. Commun. 8:15035. https://doi.org/10.1038/ncomms15035
Ishikawa, T. 2017. Axoneme Structure from Motile Cilia. Cold Spring Harb.Perspect. Biol. 9:a028076. https://doi.org/10.1101/cshperspect.a028076
Kremer, J.R., D.N. Mastronarde, and J.R. McIntosh. 1996. Computer visuali-zation of three-dimensional image data using IMOD. J. Struct. Biol. 116:71–76. https://doi.org/10.1006/jsbi.1996.0013
Li, S., J.J. Fernandez, W.F. Marshall, and D.A. Agard. 2012. Three-dimensionalstructure of basal body triplet revealed by electron cryo-tomography.EMBO J. 31:552–562. https://doi.org/10.1038/emboj.2011.460
Lin, J., W. Yin, M.C. Smith, K. Song, M.W. Leigh, M.A. Zariwala, M.R.Knowles, L.E. Ostrowski, and D. Nicastro. 2014. Cryo-electron tomog-raphy reveals ciliary defects underlying human RSPH1 primary ciliarydyskinesia. Nat. Commun. 5:5727. https://doi.org/10.1038/ncomms6727
Malicki, J.J., and C.A. Johnson. 2017. The Cilium: Cellular Antenna and CentralProcessing Unit. Trends Cell Biol. 27:126–140. https://doi.org/10.1016/j.tcb.2016.08.002
Nicastro, D., J.R. McIntosh, and W. Baumeister. 2005. 3D structure of eu-karyotic flagella in a quiescent state revealed by cryo-electron tomog-raphy. Proc. Natl. Acad. Sci. USA. 102:15889–15894. https://doi.org/10.1073/pnas.0508274102
Nicastro, D., C. Schwartz, J. Pierson, R. Gaudette, M.E. Porter, and J.R. McIntosh.2006. The molecular architecture of axonemes revealed by cryoelectrontomography. Science. 313:944–948. https://doi.org/10.1126/science.1128618
Paintrand, M., M. Moudjou, H. Delacroix, and M. Bornens. 1992. Centrosomeorganization and centriole architecture: their sensitivity to divalent cations.J. Struct. Biol. 108:107–128. https://doi.org/10.1016/1047-8477(92)90011-X
Greenan et al. Journal of Cell Biology 13
Basal body to axoneme transition in motile cilia https://doi.org/10.1083/jcb.201907060
Dow
nloaded from http://rupress.org/jcb/article-pdf/219/1/e201907060/1399949/jcb_201907060.pdf by guest on 31 January 2022
Pettersen, E.F., T.D. Goddard, C.C. Huang, G.S. Couch, D.M. Greenblatt, E.C.Meng, and T.E. Ferrin. 2004. UCSF Chimera--a visualization system forexploratory research and analysis. J. Comput. Chem. 25:1605–1612.https://doi.org/10.1002/jcc.20084
Pigino, G., K.H. Bui, A. Maheshwari, P. Lupetti, D. Diener, and T. Ishikawa.2011. Cryoelectron tomography of radial spokes in cilia and flagella.J. Cell Biol. 195:673–687. https://doi.org/10.1083/jcb.201106125
Reiter, J.F., and M.R. Leroux. 2017. Genes and molecular pathways under-pinning ciliopathies. Nat. Rev. Mol. Cell Biol. 18:533–547. https://doi.org/10.1038/nrm.2017.60
Reiter, J.F., O.E. Blacque, andM.R. Leroux. 2012. The base of the cilium: roles fortransition fibres and the transition zone in ciliary formation, maintenanceand compartmentalization. EMBO Rep. 13:608–618. https://doi.org/10.1038/embor.2012.73
Rohatgi, R., L. Milenkovic, andM.P. Scott. 2007. Patched1 regulates hedgehogsignaling at the primary cilium. Science. 317:372–376. https://doi.org/10.1126/science.1139740
Satir, P., and S.T. Christensen. 2007. Overview of structure and function ofmammalian cilia. Annu. Rev. Physiol. 69:377–400. https://doi.org/10.1146/annurev.physiol.69.040705.141236
Satir, P., T. Heuser, andW.S. Sale. 2014. A Structural Basis for HowMotile CiliaBeat. Bioscience. 64:1073–1083. https://doi.org/10.1093/biosci/biu180
Satir, P., L.B. Pedersen, and S.T. Christensen. 2010. The primary cilium at aglance. J. Cell Sci. 123:499–503. https://doi.org/10.1242/jcs.050377
Sui, H., and K.H. Downing. 2006. Molecular architecture of axonemal mi-crotubule doublets revealed by cryo-electron tomography. Nature. 442:475–478. https://doi.org/10.1038/nature04816
Vaughan, S., and K. Gull. 2016. Basal body structure and cell cycle-dependentbiogenesis in Trypanosoma brucei. Cilia. 5:5. https://doi.org/10.1186/s13630-016-0023-7
Yamaguchi, H., T. Oda, M. Kikkawa, and H. Takeda. 2018. Systematic studiesof all PIH proteins in zebrafish reveal their distinct roles in axonemaldynein assembly. eLife. 7:e36979. https://doi.org/10.7554/eLife.36979
Yang, T.T., J. Su, W.J. Wang, B. Craige, G.B. Witman, M.F. Tsou, and J.C. Liao.2015. Superresolution Pattern Recognition Reveals the ArchitecturalMap of the Ciliary Transition Zone. Sci. Rep. 5:14096. https://doi.org/10.1038/srep14096
Zabeo, D., J.M. Heumann, C.L. Schwartz, A. Suzuki-Shinjo, G. Morgan, P.O. Wi-dlund, and J.L. Hoog. 2018. A lumenal interrupted helix in human sperm tailmicrotubules. Sci. Rep. 8:2727. https://doi.org/10.1038/s41598-018-21165-8
Greenan et al. Journal of Cell Biology 14
Basal body to axoneme transition in motile cilia https://doi.org/10.1083/jcb.201907060
Dow
nloaded from http://rupress.org/jcb/article-pdf/219/1/e201907060/1399949/jcb_201907060.pdf by guest on 31 January 2022

Supplemental material
Greenan et al., https://doi.org/10.1083/jcb.201907060
Figure S1. Microtubule angle quantification in the centriole and axoneme. (A and B) Cross sections were taken through a CHO centriole, ∼50 and ∼400nm from the proximal end. (C) A cross section was also taken through an axoneme from bovine tracheae. A nonagon was then fitted to the ninefold geometryof these cross sections. The sides of the nonagon were determined by drawing lines between the centers of adjacent DMTs (blue lines). The vector of the DMTswas defined by a line from the A-tubule center through protofilament B06 of the B-tubule (green lines). (D–F) The angles between a nonagon side and themicrotubule were then measured and averaged for a given geometry. Scale bars are 50 nm.
Greenan et al. Journal of Cell Biology S1
Basal body to axoneme transition in motile cilia https://doi.org/10.1083/jcb.201907060
Dow
nloaded from http://rupress.org/jcb/article-pdf/219/1/e201907060/1399949/jcb_201907060.pdf by guest on 31 January 2022
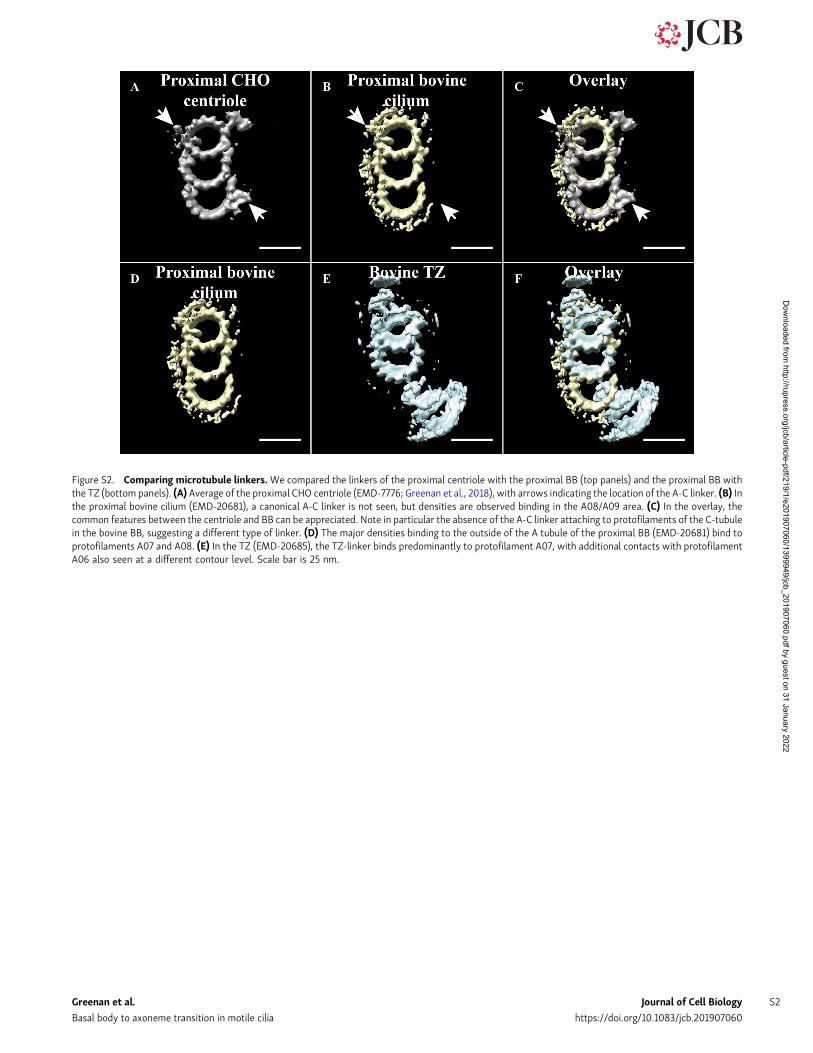
Figure S2. Comparing microtubule linkers.We compared the linkers of the proximal centriole with the proximal BB (top panels) and the proximal BB withthe TZ (bottom panels). (A) Average of the proximal CHO centriole (EMD-7776; Greenan et al., 2018), with arrows indicating the location of the A-C linker. (B) Inthe proximal bovine cilium (EMD-20681), a canonical A-C linker is not seen, but densities are observed binding in the A08/A09 area. (C) In the overlay, thecommon features between the centriole and BB can be appreciated. Note in particular the absence of the A-C linker attaching to protofilaments of the C-tubulein the bovine BB, suggesting a different type of linker. (D) The major densities binding to the outside of the A tubule of the proximal BB (EMD-20681) bind toprotofilaments A07 and A08. (E) In the TZ (EMD-20685), the TZ-linker binds predominantly to protofilament A07, with additional contacts with protofilamentA06 also seen at a different contour level. Scale bar is 25 nm.
Greenan et al. Journal of Cell Biology S2
Basal body to axoneme transition in motile cilia https://doi.org/10.1083/jcb.201907060
Dow
nloaded from http://rupress.org/jcb/article-pdf/219/1/e201907060/1399949/jcb_201907060.pdf by guest on 31 January 2022
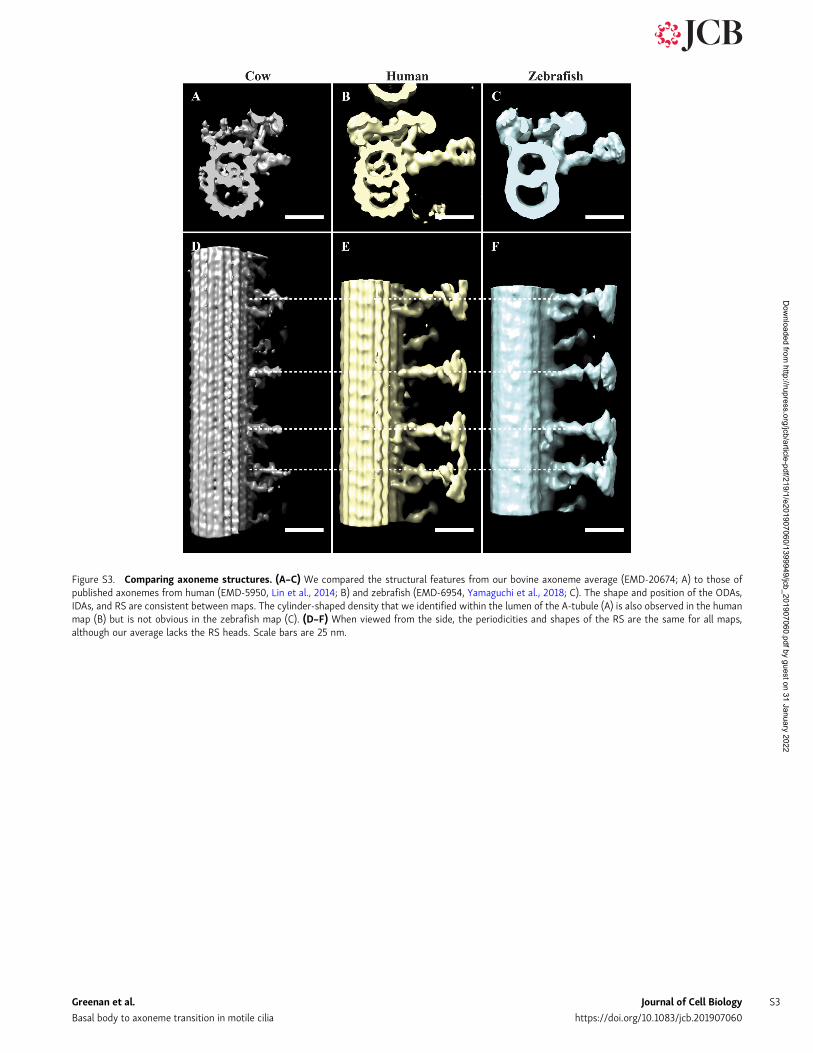
Figure S3. Comparing axoneme structures. (A–C) We compared the structural features from our bovine axoneme average (EMD-20674; A) to those ofpublished axonemes from human (EMD-5950, Lin et al., 2014; B) and zebrafish (EMD-6954, Yamaguchi et al., 2018; C). The shape and position of the ODAs,IDAs, and RS are consistent between maps. The cylinder-shaped density that we identified within the lumen of the A-tubule (A) is also observed in the humanmap (B) but is not obvious in the zebrafish map (C). (D–F) When viewed from the side, the periodicities and shapes of the RS are the same for all maps,although our average lacks the RS heads. Scale bars are 25 nm.
Greenan et al. Journal of Cell Biology S3
Basal body to axoneme transition in motile cilia https://doi.org/10.1083/jcb.201907060
Dow
nloaded from http://rupress.org/jcb/article-pdf/219/1/e201907060/1399949/jcb_201907060.pdf by guest on 31 January 2022

Figure S4. Resolution determination. The gold-standard Fourier shell correlation data from RELION 3.0 output files were used (0.14 cutoff) to determineresolution, indicated in red on each plot.
Greenan et al. Journal of Cell Biology S4
Basal body to axoneme transition in motile cilia https://doi.org/10.1083/jcb.201907060
Dow
nloaded from http://rupress.org/jcb/article-pdf/219/1/e201907060/1399949/jcb_201907060.pdf by guest on 31 January 2022
ReferencesGreenan, G.A., B. Keszthelyi, R.D. Vale, and D.A. Agard. 2018. Insights into centriole geometry revealed by cryotomography of doublet and triplet centrioles.
eLife. 7:e36851. https://doi.org/10.7554/eLife.36851Lin, J., W. Yin, M.C. Smith, K. Song, M.W. Leigh, M.A. Zariwala, M.R. Knowles, L.E. Ostrowski, and D. Nicastro. 2014. Cryo-electron tomography reveals ciliary
defects underlying human RSPH1 primary ciliary dyskinesia. Nat. Commun. 5:5727. https://doi.org/10.1038/ncomms6727Yamaguchi, H., T. Oda, M. Kikkawa, and H. Takeda. 2018. Systematic studies of all PIH proteins in zebrafish reveal their distinct roles in axonemal dynein
assembly. eLife. 7:e36979. https://doi.org/10.7554/eLife.36979
Figure S5. Ice thickness. (A)We overlaid the cilium refit and the vitreous ice in which it was suspended, and then took a cross section of ∼300 nm from theproximal end of the cilium. (B) The ice sheet is represented by a dashed box and is ∼370 nm thick. The cilium shows flattening parallel to the plane of the icesheet. Scale bars are 200 nm.
Greenan et al. Journal of Cell Biology S5
Basal body to axoneme transition in motile cilia https://doi.org/10.1083/jcb.201907060
Dow
nloaded from http://rupress.org/jcb/article-pdf/219/1/e201907060/1399949/jcb_201907060.pdf by guest on 31 January 2022