article a performance measurement tool (pmt) to control ...clok.uclan.ac.uk/13952/7/13952 facilities...
TRANSCRIPT
Article
A Performance Measurement Tool (PMT) to Control MaintenanceAssociated Infections
Njuangang, Stanley, Liyanage, Champika Lasanthi and Akintoye, Akintola
Available at http://clok.uclan.ac.uk/13952/
Njuangang, Stanley ORCID: 0000000293253749, Liyanage, Champika Lasanthi ORCID: 0000000166873611 and Akintoye, Akintola ORCID: 0000000206115824 (2016) A Performance Measurement Tool (PMT) to Control MaintenanceAssociated Infections. Facilities, 34 (13/14). pp. 766787. ISSN 02632772
It is advisable to refer to the publisher’s version if you intend to cite from the work.http://dx.doi.org/10.1108/F-12-2014-0107
For more information about UCLan’s research in this area go to http://www.uclan.ac.uk/researchgroups/ and search for <name of research Group>.
For information about Research generally at UCLan please go to http://www.uclan.ac.uk/research/
All outputs in CLoK are protected by Intellectual Property Rights law, includingCopyright law. Copyright, IPR and Moral Rights for the works on this site are retained by the individual authors and/or other copyright owners. Terms and conditions for use of this material are defined in the http://clok.uclan.ac.uk/policies/
CLoKCentral Lancashire online Knowledgewww.clok.uclan.ac.uk
For Peer Review
Performance Measurement Tool (PMT) to Control
Maintenance-Associated Infections
Journal: Facilities
Manuscript ID f-12-2014-0107.R3
Manuscript Type: Original Article
Keywords: BSC, CSFs, HAIs, Infection Control, Maintenance, Performance measures
Facilities
For Peer Review
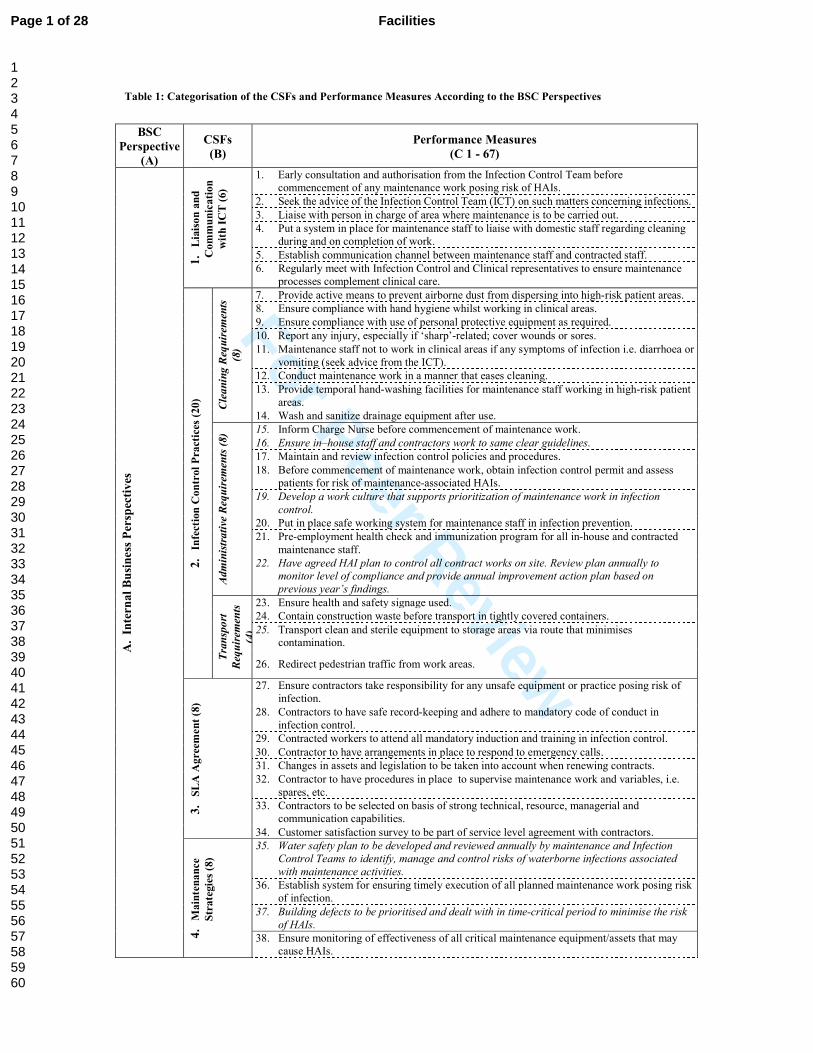
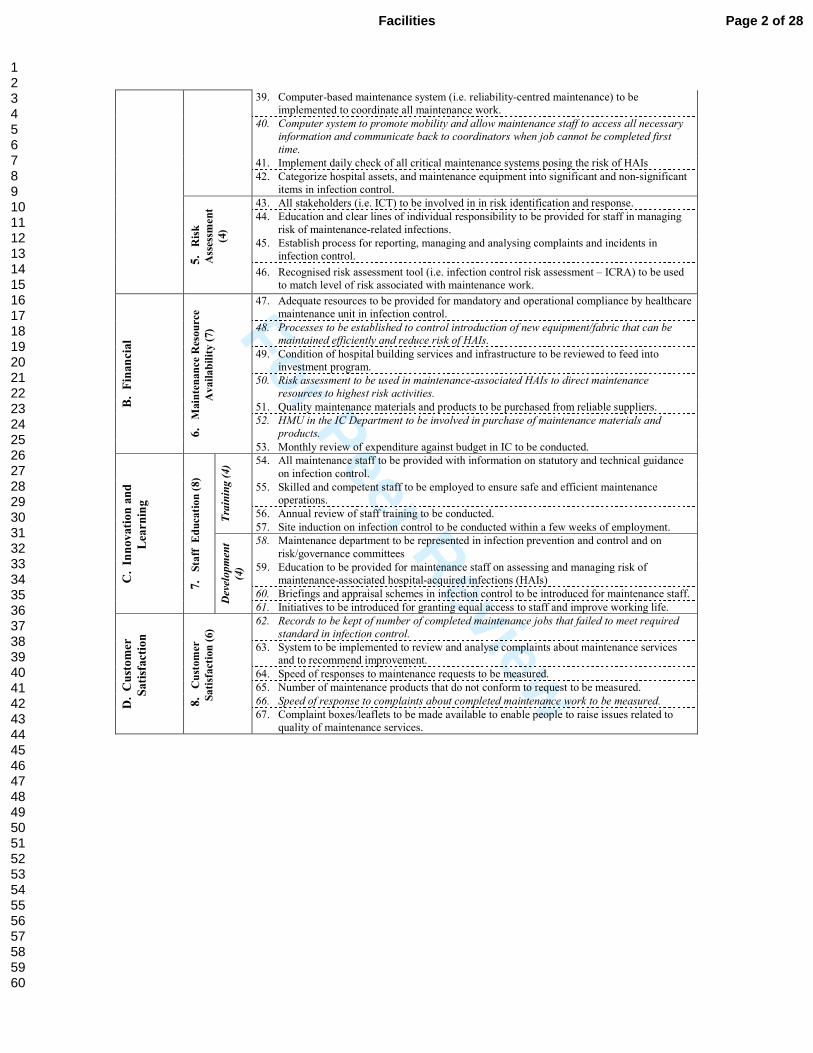
Table 1: Categorisation of the CSFs and Performance Measures According to the BSC Perspectives
BSC
Perspective
(A)
CSFs
(B)
Performance Measures
(C 1 - 67)
A.
Inte
rn
al
Bu
sin
ess
Per
spec
tiv
es
1.
Lia
iso
n a
nd
Com
mu
nic
ati
on
wit
h I
CT
(6)
1. Early consultation and authorisation from the Infection Control Team before
commencement of any maintenance work posing risk of HAIs.
2. Seek the advice of the Infection Control Team (ICT) on such matters concerning infections.
3. Liaise with person in charge of area where maintenance is to be carried out.
4. Put a system in place for maintenance staff to liaise with domestic staff regarding cleaning
during and on completion of work.
5. Establish communication channel between maintenance staff and contracted staff.
6. Regularly meet with Infection Control and Clinical representatives to ensure maintenance
processes complement clinical care.
2.
Infe
ctio
n C
on
trol
Pra
ctic
es (
20)
Cleaning Requirem
ents
(8)
7. Provide active means to prevent airborne dust from dispersing into high-risk patient areas.
8. Ensure compliance with hand hygiene whilst working in clinical areas.
9. Ensure compliance with use of personal protective equipment as required.
10. Report any injury, especially if ‘sharp’-related; cover wounds or sores.
11. Maintenance staff not to work in clinical areas if any symptoms of infection i.e. diarrhoea or
vomiting (seek advice from the ICT).
12. Conduct maintenance work in a manner that eases cleaning.
13. Provide temporal hand-washing facilities for maintenance staff working in high-risk patient
areas.
14. Wash and sanitize drainage equipment after use.
Administrative Requirem
ents (8) 15. Inform Charge Nurse before commencement of maintenance work.
16. Ensure in–house staff and contractors work to same clear guidelines.
17. Maintain and review infection control policies and procedures.
18. Before commencement of maintenance work, obtain infection control permit and assess
patients for risk of maintenance-associated HAIs.
19. Develop a work culture that supports prioritization of maintenance work in infection
control.
20. Put in place safe working system for maintenance staff in infection prevention.
21. Pre-employment health check and immunization program for all in-house and contracted
maintenance staff.
22. Have agreed HAI plan to control all contract works on site. Review plan annually to
monitor level of compliance and provide annual improvement action plan based on
previous year’s findings.
Transport
Requirem
ents
(4)
23. Ensure health and safety signage used.
24. Contain construction waste before transport in tightly covered containers.
25. Transport clean and sterile equipment to storage areas via route that minimises contamination.
26. Redirect pedestrian traffic from work areas.
3.
SL
A A
gre
emen
t (8
)
27. Ensure contractors take responsibility for any unsafe equipment or practice posing risk of
infection.
28. Contractors to have safe record-keeping and adhere to mandatory code of conduct in
infection control.
29. Contracted workers to attend all mandatory induction and training in infection control.
30. Contractor to have arrangements in place to respond to emergency calls.
31. Changes in assets and legislation to be taken into account when renewing contracts.
32. Contractor to have procedures in place to supervise maintenance work and variables, i.e.
spares, etc.
33. Contractors to be selected on basis of strong technical, resource, managerial and
communication capabilities.
34. Customer satisfaction survey to be part of service level agreement with contractors.
4.
Main
ten
an
ce
Str
ate
gie
s (8
)
35. Water safety plan to be developed and reviewed annually by maintenance and Infection
Control Teams to identify, manage and control risks of waterborne infections associated
with maintenance activities.
36. Establish system for ensuring timely execution of all planned maintenance work posing risk
of infection.
37. Building defects to be prioritised and dealt with in time-critical period to minimise the risk
of HAIs.
38. Ensure monitoring of effectiveness of all critical maintenance equipment/assets that may
cause HAIs.
Page 1 of 28 Facilities
123456789101112131415161718192021222324252627282930313233343536373839404142434445464748495051525354555657585960
For Peer Review
39. Computer-based maintenance system (i.e. reliability-centred maintenance) to be
implemented to coordinate all maintenance work.
40. Computer system to promote mobility and allow maintenance staff to access all necessary
information and communicate back to coordinators when job cannot be completed first
time.
41. Implement daily check of all critical maintenance systems posing the risk of HAIs
42. Categorize hospital assets, and maintenance equipment into significant and non-significant
items in infection control. 5
. R
isk
Ass
essm
en
t
(4)
43. All stakeholders (i.e. ICT) to be involved in in risk identification and response.
44. Education and clear lines of individual responsibility to be provided for staff in managing
risk of maintenance-related infections.
45. Establish process for reporting, managing and analysing complaints and incidents in
infection control.
46. Recognised risk assessment tool (i.e. infection control risk assessment – ICRA) to be used
to match level of risk associated with maintenance work.
B.
Fin
an
cia
l
6.
Main
ten
an
ce
Res
ou
rce
Avail
ab
ilit
y (
7)
47. Adequate resources to be provided for mandatory and operational compliance by healthcare
maintenance unit in infection control.
48. Processes to be established to control introduction of new equipment/fabric that can be maintained efficiently and reduce risk of HAIs.
49. Condition of hospital building services and infrastructure to be reviewed to feed into
investment program.
50. Risk assessment to be used in maintenance-associated HAIs to direct maintenance
resources to highest risk activities.
51. Quality maintenance materials and products to be purchased from reliable suppliers.
52. HMU in the IC Department to be involved in purchase of maintenance materials and
products.
53. Monthly review of expenditure against budget in IC to be conducted.
C.
Inn
ov
ati
on
an
d
Lea
rn
ing
7.
Sta
ff
Ed
uca
tion
(8)
Training (4) 54. All maintenance staff to be provided with information on statutory and technical guidance
on infection control.
55. Skilled and competent staff to be employed to ensure safe and efficient maintenance
operations.
56. Annual review of staff training to be conducted.
57. Site induction on infection control to be conducted within a few weeks of employment.
Development
(4)
58. Maintenance department to be represented in infection prevention and control and on
risk/governance committees
59. Education to be provided for maintenance staff on assessing and managing risk of
maintenance-associated hospital-acquired infections (HAIs)
60. Briefings and appraisal schemes in infection control to be introduced for maintenance staff.
61. Initiatives to be introduced for granting equal access to staff and improve working life.
D.
Cu
sto
mer
Sati
sfacti
on
8.
Cu
stom
er
Sati
sfact
ion
(6)
62. Records to be kept of number of completed maintenance jobs that failed to meet required
standard in infection control.
63. System to be implemented to review and analyse complaints about maintenance services and to recommend improvement.
64. Speed of responses to maintenance requests to be measured.
65. Number of maintenance products that do not conform to request to be measured.
66. Speed of response to complaints about completed maintenance work to be measured.
67. Complaint boxes/leaflets to be made available to enable people to raise issues related to
quality of maintenance services.
Page 2 of 28Facilities
123456789101112131415161718192021222324252627282930313233343536373839404142434445464748495051525354555657585960
For Peer Review
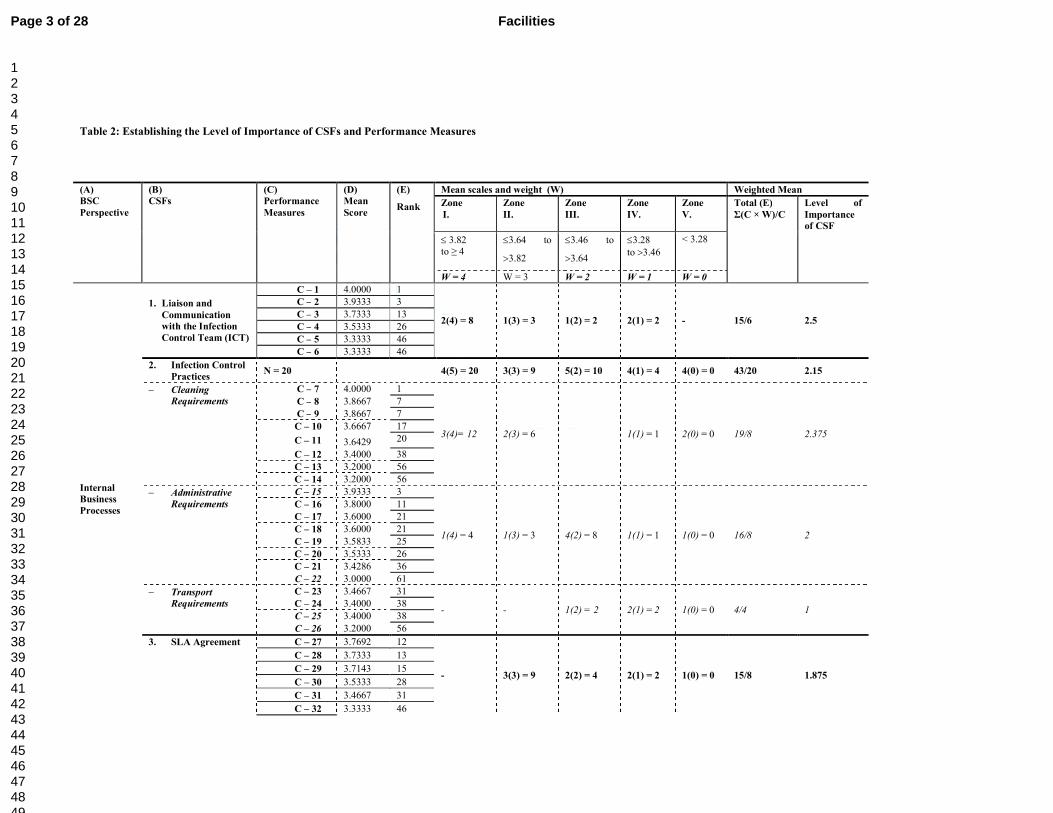
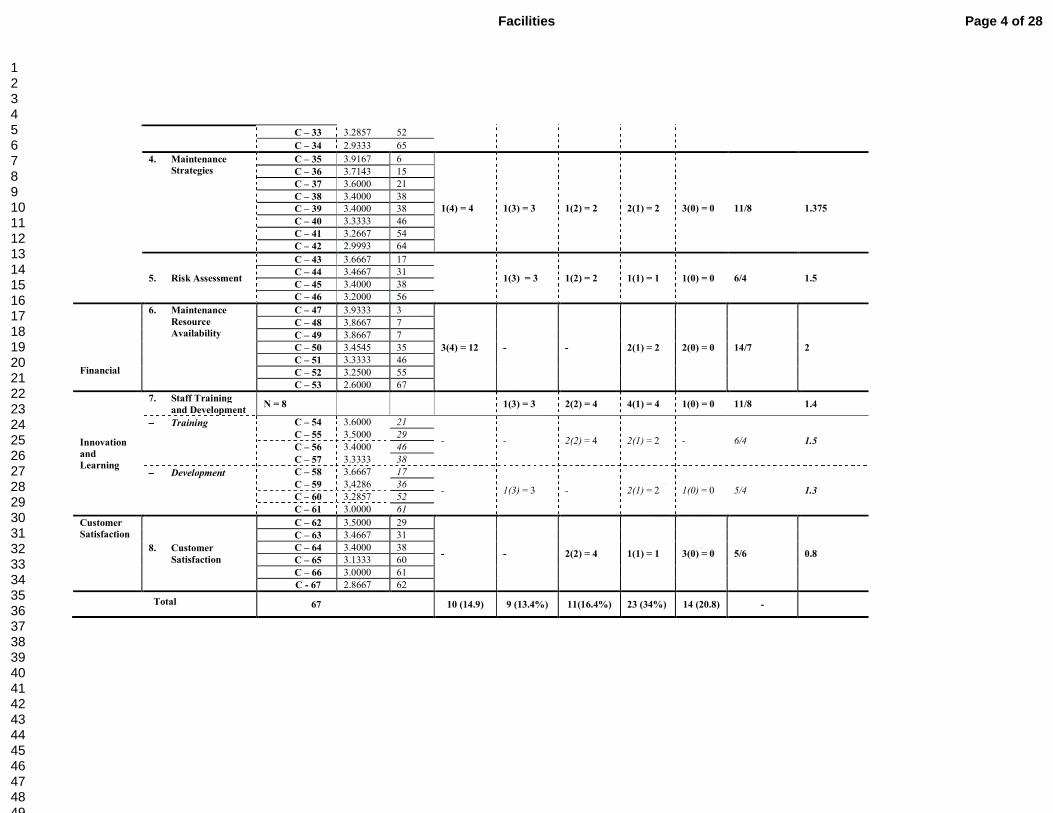
Table 2: Establishing the Level of Importance of CSFs and Performance Measures
(A)
BSC
Perspective
(B)
CSFs
(C)
Performance
Measures
(D)
Mean
Score
(E)
Rank
Mean scales and weight (W) Weighted Mean
Zone
I.
Zone
II.
Zone
III.
Zone
IV.
Zone
V.
Total (E)
Σ(C × W)/C
Level of
Importance
of CSF
≤ 3.82
to ≥ 4
≤3.64 to
>3.82
≤3.46 to
>3.64
≤3.28
to >3.46
< 3.28
W = 4 W = 3 W = 2 W = 1 W = 0
Internal
Business
Processes
1. Liaison and
Communication
with the Infection
Control Team (ICT)
C – 1 4.0000 1
2(4) = 8 1(3) = 3 1(2) = 2 2(1) = 2 - 15/6 2.5
C – 2 3.9333 3
C – 3 3.7333 13
C – 4 3.5333 26
C – 5 3.3333 46
C – 6 3.3333 46
2. Infection Control
Practices N = 20
4(5) = 20 3(3) = 9 5(2) = 10 4(1) = 4 4(0) = 0 43/20 2.15
− Cleaning
Requirements
C – 7 4.0000 1
3(4)= 12 2(3) = 6 1(1) = 1 2(0) = 0 19/8 2.375
C – 8 3.8667 7
C – 9 3.8667 7
C – 10 3.6667 17
C – 11 3.6429 20
C – 12 3.4000 38
C – 13 3.2000 56
C – 14 3.2000 56
− Administrative
Requirements
C – 15 3.9333 3
1(4) = 4 1(3) = 3 4(2) = 8 1(1) = 1 1(0) = 0 16/8 2
C – 16 3.8000 11
C – 17 3.6000 21
C – 18 3.6000 21
C – 19 3.5833 25
C – 20 3.5333 26
C – 21 3.4286 36
C – 22 3.0000 61
− Transport
Requirements
C – 23 3.4667 31
- - 1(2) = 2 2(1) = 2 1(0) = 0 4/4 1 C – 24 3.4000 38
C – 25 3.4000 38
C – 26 3.2000 56
3. SLA Agreement C – 27 3.7692 12
- 3(3) = 9 2(2) = 4 2(1) = 2 1(0) = 0 15/8 1.875
C – 28 3.7333 13
C – 29 3.7143 15
C – 30 3.5333 28
C – 31 3.4667 31
C – 32 3.3333 46
Page 3 of 28 Facilities
123456789101112131415161718192021222324252627282930313233343536373839404142434445464748495051525354555657585960
For Peer Review
C – 33 3.2857 52
C – 34 2.9333 65
4. Maintenance
Strategies
C – 35 3.9167 6
1(4) = 4
1(3) = 3
1(2) = 2
2(1) = 2
3(0) = 0
11/8
1.375
C – 36 3.7143 15
C – 37 3.6000 21
C – 38 3.4000 38
C – 39 3.4000 38
C – 40 3.3333 46
C – 41 3.2667 54
C – 42 2.9993 64
5. Risk Assessment
C – 43 3.6667 17
1(3) = 3 1(2) = 2 1(1) = 1 1(0) = 0 6/4 1.5 C – 44 3.4667 31
C – 45 3.4000 38
C – 46 3.2000 56
Financial
6. Maintenance
Resource
Availability
C – 47 3.9333 3
3(4) = 12 - - 2(1) = 2 2(0) = 0 14/7 2
C – 48 3.8667 7
C – 49 3.8667 7
C – 50 3.4545 35
C – 51 3.3333 46
C – 52 3.2500 55
C – 53 2.6000 67
Innovation
and
Learning
7. Staff Training
and Development N = 8
1(3) = 3 2(2) = 4 4(1) = 4 1(0) = 0 11/8 1.4
−−−− Training C – 54 3.6000 21
- - 2(2) = 4 2(1) = 2 - 6/4 1.5 C – 55 3.5000 29
C – 56 3.4000 46
C – 57 3.3333 38
−−−− Development C – 58 3.6667 17
- 1(3) = 3 - 2(1) = 2 1(0) = 0 5/4 1.3 C – 59 3,4286 36
C – 60 3.2857 52
C – 61 3.0000 61
Customer
Satisfaction
8. Customer
Satisfaction
C – 62 3.5000 29
- - 2(2) = 4 1(1) = 1 3(0) = 0 5/6 0.8
C – 63 3.4667 31
C – 64 3.4000 38
C – 65 3.1333 60
C – 66 3.0000 61
C - 67 2.8667 62
Total 67 10 (14.9) 9 (13.4%) 11(16.4%) 23 (34%) 14 (20.8) -
Page 4 of 28Facilities
123456789101112131415161718192021222324252627282930313233343536373839404142434445464748495051525354555657585960
For Peer Review
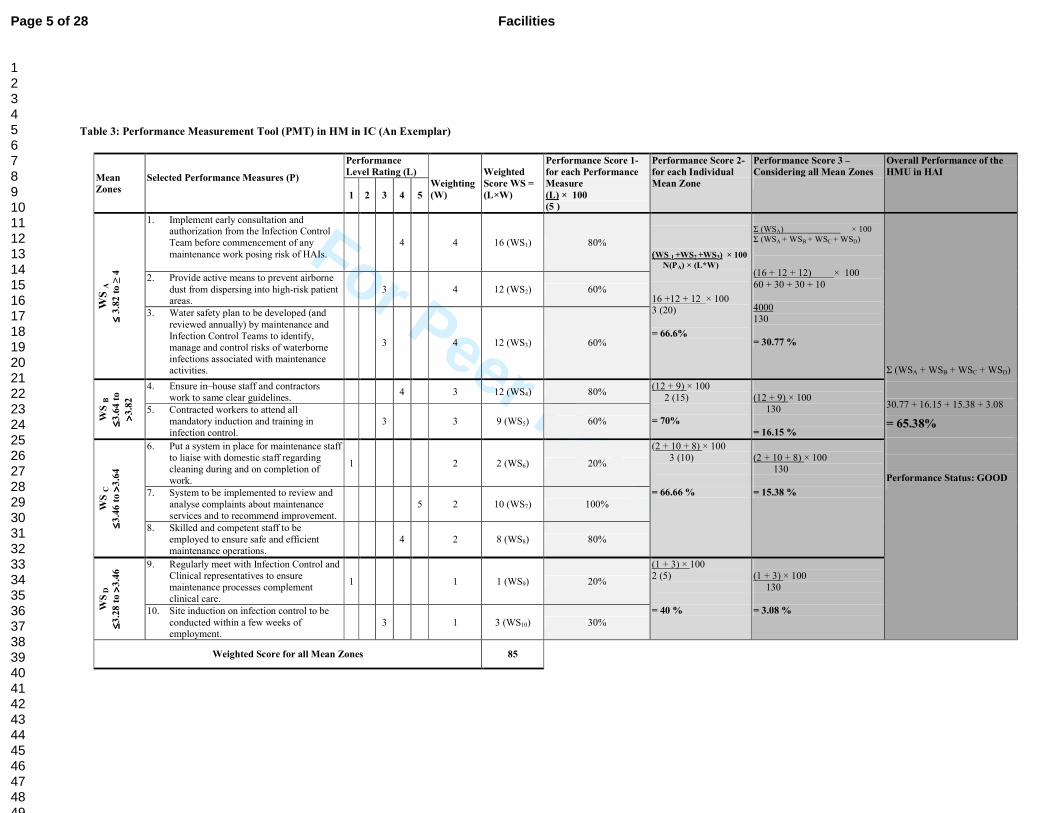
Table 3: Performance Measurement Tool (PMT) in HM in IC (An Exemplar)
Mean
Zones
Selected Performance Measures (P)
Performance
Level Rating (L)
Weighting
(W)
Weighted
Score WS =
(L×W)
Performance Score 1-
for each Performance
Measure
(L) × 100
(5 )
Performance Score 2-
for each Individual
Mean Zone
Performance Score 3 –
Considering all Mean Zones
Overall Performance of the
HMU in HAI
1 2 3 4 5
WS
A
≤≤ ≤≤ 3
.82
to
≥ 4
1. Implement early consultation and authorization from the Infection Control
Team before commencement of any
maintenance work posing risk of HAIs.
4 4 16 (WS1) 80%
(WS 1 +WS2
+WS3) × 100
N(PA) × (L*W)
16 +12 + 12 × 100 3 (20)
= 66.6%
Σ (WSA) × 100
Σ (WSA + WSB + WSC
+ WSD)
(16 + 12 + 12) × 100
60 + 30 + 30 + 10
4000
130
= 30.77 %
Σ (WSA + WSB + WSC + WSD)
30.77 + 16.15 + 15.38 + 3.08
= 65.38%
Performance Status: GOOD
2. Provide active means to prevent airborne
dust from dispersing into high-risk patient areas.
3 4 12 (WS2) 60%
3. Water safety plan to be developed (and
reviewed annually) by maintenance and
Infection Control Teams to identify,
manage and control risks of waterborne
infections associated with maintenance activities.
3 4 12 (WS3) 60%
WS B
≤≤ ≤≤3
.64
to
>> >>3
.82
4. Ensure in–house staff and contractors
work to same clear guidelines. 4 3 12 (WS4) 80%
(12 + 9) × 100
2 (15)
= 70%
(12 + 9) × 100
130
= 16.15 %
5. Contracted workers to attend all
mandatory induction and training in
infection control.
3 3 9 (WS5) 60%
WS C
≤≤ ≤≤3
.46
to >> >>
3.6
4
6. Put a system in place for maintenance staff
to liaise with domestic staff regarding
cleaning during and on completion of
work.
1 2 2 (WS6) 20%
(2 + 10 + 8) × 100
3 (10)
= 66.66 %
(2 + 10 + 8) × 100
130
= 15.38 % 7. System to be implemented to review and
analyse complaints about maintenance
services and to recommend improvement.
5 2 10 (WS7) 100%
8. Skilled and competent staff to be
employed to ensure safe and efficient
maintenance operations.
4 2 8 (WS8) 80%
WS
D
≤≤ ≤≤3
.28
to >> >>
3.4
6 9. Regularly meet with Infection Control and
Clinical representatives to ensure
maintenance processes complement
clinical care.
1 1 1 (WS9) 20%
(1 + 3) × 100
2 (5)
= 40 %
(1 + 3) × 100
130
= 3.08 % 10. Site induction on infection control to be
conducted within a few weeks of employment.
3 1 3 (WS10) 30%
Weighted Score for all Mean Zones 85
Page 5 of 28 Facilities
123456789101112131415161718192021222324252627282930313233343536373839404142434445464748495051525354555657585960
For Peer Review
1
1. Introduction
The term Hospital-acquired infections (HAI) usually means infections that were neither
present nor incubating when a patient, visitor or hospital staff member enters the hospital
(National Audit Office (NAO), 2004). HAIs are a major problem to healthcare institutions
throughout the world. According to estimates by the World Health Organisation, out of every
one hundred patient admitted to hospital at any one time, seven in the developed and ten in
the developing countries acquire at least one type of HAI (WHO, 2002). The European
Centre for Disease Control and Prevention estimates that about 3.2 million patients in
European acute care hospitals acquire HAIs every year (ECDC, 2013).
Before the introduction of mandatory surveillance, about 9% of inpatients in the UK
acquired an HAI during their stay in hospital (Parliamentary Office of Science and
Technology, 2005). However, since the introduction of mandatory surveillance in 2001, there
has been a steady fall in the rate of Meticilline-resistant Staphylococcus aureus (MRSA) and
Clostridium difficile (C. difficile) in England (Health Protection Agency (HPA), 2012).
According to HPA (2009), MRSA bloodstream infections in England fell from 6,383 in
2006/07 to 2,933 in 2008/09 (a 54% reduction). Equally, the rate of C. Difficile fell from
55,499 in 2007/08 to 36,097 in 2008/09 (a 35% reduction). By reducing the rate of MRSA
and C. Difficile, the NHS has been able cut costs in areas such as drug therapy, hospital re-
admissions and ward closures.
Apart from those infections i.e. MRSA and C. Difficile, which are under mandatory
surveillance, there is no evidence suggesting that rates of HAIs are falling. The BBC (2014)
estimates that about 300,000 inpatients acquire an HAI each year - that is, one in every 16
patient being treated by the NHS. Figures released by ECDC (2013) show that the rate of C.
difficile in England is higher than in the Netherlands, France, Spain and Italy. The deputy
chief executive of the National Institute for Health and Clinical Excellence noted, “It is
Page 6 of 28Facilities
123456789101112131415161718192021222324252627282930313233343536373839404142434445464748495051525354555657585960
For Peer Review
2
unacceptable that infection rates are still so high in within the NHS” (BBC, 2014). These
figures could even be higher, as estimates of HAI in England do not take into full account
HAI acquired after a patient has been discharged from hospital. According to the NAO
(2000), about 50-70% of surgical wound infections occur post-discharge. Apart from prolong
a stay in hospital, HAIs may also worsen the patient’s underlying condition, inflict pain and
bring unnecessary misery to family members and friends.
In addition to the human cost of HAI is the financial cost, which has raised the
concern of health authorities and the public. The total cost of HAI to the NHS is about
£986.36 million annually, with the larger part of the money £930.62 million being incurred
by the in-patient services (NAO, 2000). The remaining £55.74 million is incurred post
discharge by GPs, outpatient consultants and district nursing services. The cost of treating a
patient who acquires one or more HAI whilst receiving treatment at the hospital is 2.8 times
greater than for a patient without an infection. This additional cost is incurred directly by the
NHS on such issues as increased length of hospital stay, additional antibiotic therapy,
repeated surgery, food, testing (laboratory and radiography) etc. On average, a patient
infected with HAI cost the NHS an additional £2,917 to treat. Costs generally range from
£1,222 for urinary tract infections to £6,209 for blood infections (NAO, 2000). In 2007-8, the
NHS spent at least £20 million and £75 million treating patients with MRSA and C. difficile
infections respectively (NAO, 2009). Litigation cost is also set to grow following successful
legal claims for compensation after acquiring HAI.
Despite the huge cost of HAIs, through better infection control practices, the NHS
could reduce the incidence of HAI by up to 15-30% (NAO, 2004). Any reduction in the cost
of HAI in the NHS could free up additional cash, which could then be used in the provision
of alternative healthcare related priorities. According to the National Institute for Health and
Clinical Excellence, every 5% reduction in the rate of MRSA and C. Difficile could result in a
cost saving of about £4.9 million annually to the NHS (NICE, 2011).
Page 7 of 28 Facilities
123456789101112131415161718192021222324252627282930313233343536373839404142434445464748495051525354555657585960
For Peer Review
3
All this suggests that healthcare officials need to adopt a holistic approach that
focuses on tackling the root causes of hospital-acquired infections. Usually these causes take
one of two forms, i.e. clinical or non-clinical. Presently, it appears that insufficient attention
is paid to the non-clinical causes of HAIs in hospitals. The non-clinical causes of HAIs are
normally associated with poor performance on the part of healthcare facilities management
services in infection control (IC). Such services include for example cleaning (to avoid
contamination of equipment and the built environment), catering (to avoid food
contamination), building maintenance (to avoid cross-infection), and practices of healthcare
facilities management workers (to avoid contact transmission) (WHO, 2002). The two areas
that seem to attract the most attention from healthcare authorities are cleaning and catering.
This is because cleaning is often seen by the public and trade unions (i.e. Unison) as the
cause of infections, i.e. MRSA and C. Difficile. The same is true of catering, which is often
blamed for food poisoning outbreaks such as food-borne salmonellosis at the Stanley Royd
Hospital.
Apart from cleaning and catering, however, healthcare facilities management services
are treated as though they have no connection with IC. Yet epidemiological evidence
gathered in this research also implicates healthcare maintenance in the incidence of HAIs in
hospitals. In the next section, the significance of healthcare maintenance in IC is examined in
depth. For reasons of space, this research focuses exclusively on healthcare maintenance, and
particularly on performance measurement in this area. To present this, the paper is divided
into two main sections. In the first section, the rationale for the selection of healthcare
maintenance is provided; in the second section, the focus is on the development of a
performance measurement tool (PMT) in healthcare maintenance in IC.
1.1 Maintenance services in the control of HAIs
Without an efficient and well-coordinated maintenance function, it is unlikely that buildings
will function properly. Maintenance can prevent disruption of core business activities that
Page 8 of 28Facilities
123456789101112131415161718192021222324252627282930313233343536373839404142434445464748495051525354555657585960
For Peer Review
4
may have cost implications and undesirable outcomes (e.g. customer dissatisfaction, non-
compliance with legal requirements, health and safety problems, increased energy
consumption and damage to the environment, etc. (Lam, 2007). The Yeovil District Hospital
NHS (2009, p.3) defines healthcare maintenance as the “combination of all technical and
administrative actions, including supervision actions, intended to keep an item in, or restore
it to, a state in which it can perform a required function. Given due consideration to viability
and economic financial responsibilities”.
The nature of the business of hospitals requires that the healing indoor environment
“considers infection control safety for patients and staff as an added factor for a safe
environment of care” (Streifel, 2005, p.1). Evidence gathered from the literature shows a
causal link between maintenance works carried out in and around hospitals and HAI. In
hospitals, maintenance work has been implicated in the spread of conidia through the
airborne route (Hoffman et al., 1999). According to Tabbara and Jabarti (1998), old hospitals
(termed ‘sick’ buildings) are more likely to harbour spores of fungi, including Aspergillus.
Although fungi (Aspergillum species) are naturally occurring, ubiquitous and a natural part of
the biological ecosystem (Burrill 2008), they pose a significant risk to patients whose
immunity has been compromised because of age, underlying illness or medical or surgical
treatment (Joseph 2006). Invasive aspergillosis affects ≤14 per cent of lung transplant
recipients and ≤ 28 per cent of patients who have undergone allogeneic hematopoietic stem
cell transplantation (Wald et al., 1997). In Canada alone, about 50% of negative patient
outcomes (including several deaths) have been caused by Aspergillus fumigatus (Health
Canada, 2001, cited in Burrill, 2008). Such figures have led the Centres for Disease Control
and Prevention (2005, as cited in Burrill, 2008: p. 56) to state that “HAIs may be associated
with dust exposure during building renovation [maintenance] or construction”.
Despite all this, it appears the issue of maintenance-associated infections (infections
caused by maintenance activities in hospitals) has failed to attract the full attention of
Page 9 of 28 Facilities
123456789101112131415161718192021222324252627282930313233343536373839404142434445464748495051525354555657585960
For Peer Review
5
healthcare officials. As a result, the healthcare maintenance department and NHS Trust
maybe pursuing different objectives in IC. Lee and Scott (2008) blame this on maintenance
staff for relying too much on their technical experience and skills and not connecting with
core business objectives. Others have also attributed this to confusing and piecemeal core
business objectives that pay little attention to building maintenance. According to Hicks
(2004), some healthcare establishments have not even realised the benefits of having written
missions, visions, goals and objectives for their maintenance departments. Those written
statements that are in place have focus mainly on cost (Lee and Scott, 2008). Such a culture
can create a dysfunctional maintenance department that has no business orientation.
Because top managers generally lack an understanding of the science of maintenance,
they appear to rely on the old tenet ‘if it isn’t broke, don’t fix it’ (Chalifoux and Baird, 1999).
As a result, they are often reluctant to allocate a sufficient budget to allow the maintenance
department carry out comprehensive maintenance strategies. Whilst slashing the budget
allocated to strategies such as preventive maintenance may offer short-term cost savings, it
may increase the probability of failures. In the words of Thun (2004, cited in Bivona and
Montemaggiore, 2005), this creates a vicious cycle: “‘Repairs eat up Prevention’ results in a
situation with many unexpected machine breakdowns and an overloaded maintenance
department”.
Following criticisms of the performance of healthcare maintenance services in IC,
some NHS hospitals have started formulating policies to minimise the risk of maintenance-
associated HAIs. However, there appears to be wide variation in the number of IC issues
addressed in healthcare maintenance policies across the NHS. In addition, little is known
about whether these policies are effectively implemented and realised by healthcare
maintenance departments. According to Healthcare Facilities Scotland (2007), there is a
problem with the effective dissemination and implementation of existing policies and
guidelines in a logical and accessible form to all involved in the control of HAI in the NHS.
Page 10 of 28Facilities
123456789101112131415161718192021222324252627282930313233343536373839404142434445464748495051525354555657585960
For Peer Review
6
Instead of focusing on the core business issues of the NHS (i.e., infection control), most
healthcare maintenance managers spend considerable time and energy focusing on reactive
measures to reduce costs
The above discussion clearly highlights the consequences of a lack of performance
measurement in healthcare maintenance in IC. Generally, healthcare facilities management
services like maintenance have a poor understanding of performance measurement and its
application to IC (Liyanage and Egbu, 2005). Even where attempts have been made to
measure performance in relation to infection control, they use only a limited number of
indicators and measures. The purpose of this paper is therefore to fill this gap by developing a
tool that measures performance adequately in healthcare maintenance in IC. As outlined in
the next section, this was achieved using a three-step process.
2. The process adopted for developing a performance measurement tool
(PMT)
It is clear from the above discussion that improving the performance of the healthcare
maintenance department in IC will help the NHS reduce its current rate of HAIs. As stated
earlier, a Performance Measurement Tool was developed using a three-step process:
Step 1. Identification of the critical success factors (CSFs) and performance measures in
healthcare maintenance in IC. Here, a brief discussion is provided about the
methodology, i.e. the literature reviews, grounded theory and the balanced
scorecard (BSC) used to identify the CSFs and performance measures. The BSC is
described in section 2.1.
Step 2. Ranking the CSFs according to their importance in IC. This was achieved on the
basis of the results of a three-round Delphi study (refer to section 2.2).
Step 3. Developing a PMT in healthcare maintenance to measure performance in IC. Here
weightings were assigned to the performance measures identified through the
Page 11 of 28 Facilities
123456789101112131415161718192021222324252627282930313233343536373839404142434445464748495051525354555657585960
For Peer Review
7
Delphi study, and formulae established for calculating the performance of the
healthcare maintenance department in IC at various levels.
2.1 Step 1 - Identifying the CSFs and Performance Measures in IC
Today’s business environment is much more dynamic than it used to be many years ago.
Besides stiff competition, organisations also face the challenges of meeting the needs of their
stakeholders. Healthcare maintenance departments in the NHS cannot ignore such challenges.
The widespread mechanisation and automation of companies has reduced the number of
production personnel, and increased the capital employed in production equipment.
Consequently, the number of maintenance staff has grown alongside the proportion of total
operating costs spent on maintenance. The technological needs arising from a better
understanding of the causes of diseases, together with an ever-increasing number of
susceptible patients, have revolutionised the process of healthcare maintenance. Today’s
healthcare maintenance has to grapple with complex electrical, heating, plumbing, air
conditioning, mechanical and medical equipment and devices in order to meet the needs of
the NHS.
An important step towards meeting some of these challenges is measuring the
performance of the healthcare maintenance department in IC. In this paper, it is argued that
this should be achieved through the development of a PMT. According to Tsang (1998, p.
87), “considering maintenance a purely tactical matter is myopic”. The first step in the
development of the PMT is the identification of the CSFs and performance measures in
healthcare maintenance in IC. CSFs are “…key areas of performance that are essential for
the organisation to accomplish its mission [goals, objectives, or projects]” (Caralli, 2004, p.
2). Performance measures on the other hand are “… specific standards which allow the
calibration of performance for each critical success factor, goal, or objective” (Bullen and
Rockart, 1981, p. 8). CSFs and performance measures can provide healthcare maintenance
Page 12 of 28Facilities
123456789101112131415161718192021222324252627282930313233343536373839404142434445464748495051525354555657585960
For Peer Review
8
managers with valuable information to drive performance in healthcare maintenance in IC
effectively.
An in-depth review of relevant research materials was conducted to identify the CSFs
and performance measures in healthcare maintenance in IC. Strict criteria were adopted in the
selection process. The research materials needed to contain rich information concerning the
control and prevention of maintenance-associated HAIs in hospitals. In total, the literature
review resulted in the selection of 27 key IC documents: seven government documents, 10
healthcare maintenance policies and 10 clinical peer-reviewed journals.
Grounded theory analyses of the 27 selected documents resulted in the identification of
56 performance measures in healthcare maintenance in IC. In contrast to the usual treatment
of this topic elsewhere, these performance measures were categorised under eight CSFs.
According to Lavy et al. (2010), little attempt has been made in facilities management to
group performance measures according to criteria that allow interrelationships to be properly
understood and analysed. As shown in Table 1, the eight CSFs in healthcare maintenance in
IC are Liaison and Communication with the Infection Control Team, Infection Control
Practices, Maintenance Strategies, Risk Assessment, Maintenance Resource Availability,
Staff Education and Customer Satisfaction. For the purpose of clarity, some of the CSFs were
sub-divided. For example, the ‘Infection Control Practices’ was divided into Cleaning,
Administrative and Transport Requirements (see Table 1).
Traditionally, most organisations restrict performance measurement in maintenance to the
tracking of direct costs or their surrogates such as the headcount of tradesmen (Tsang, 1998).
In order to drive overall performance across the healthcare maintenance department,
managers must also focus on non-financial measures. Therefore, the 56 performance
measures and eight CSFs were further categorised into the four perspectives of the (BSC):
Financial, Internal Business Processes, Innovation and Learning, and Customers. The BSC is
one of the most widely recognised performance measurement systems (Neely et al., 2000),
Page 13 of 28 Facilities
123456789101112131415161718192021222324252627282930313233343536373839404142434445464748495051525354555657585960
For Peer Review
9
and is the most widely applied in facilities management (Toni et al., 2007). The four
perspectives of the BSC have been commended by many for driving overall performance in
organisations. Therefore, this research draws on the strengths of the BSC perspectives in the
development of a performance measurement tool that considers the financial and non-
financial measures in healthcare maintenance in IC.
Insert Table 1
2.2 Step 2: Ranking the CSFs according to their importance in IC
In the second stage of the research process, the different levels of importance of the CSFs and
performance measures were established, as they were categorised into different mean zones.
In establishing the levels of importance of the CSFs and performance measures, a three-round
Delphi study was applied. The Delphi study has been accepted for publication in the
International Journal of Health care Quality Assurance under the title ‘Key performance
measures to control maintenance-associated HAIs’, Volume, 28; Issue, 7. The Delphi
participants were purposively selected across Acute NHS Trusts in England. For people to be
considered as Delphi participants, they needed to have extensive healthcare maintenance and
IC experience and knowledge, and to have occupied healthcare maintenance manager or IC
team member positions (i.e., as IC doctors, nurses or microbiologists) in an acute NHS trust
for at least five years. In addition, it was a requirement that participation in the Delphi study
was not to be delegated to someone else.
The CSFs and performance measures identified in the first process (literature review)
were used to design the Round 1 Delphi instrument. In the first round of the Delphi exercise,
the participants were presented with the CSFs and performance measures identified in the
literature and given the task of identifying new ones. The first round Delphi exercise results
were then used to modify the second round Delphi instrument. Delphi participants provided
comments and suggestions that led to re-wording and in some instances re-structuring
Page 14 of 28Facilities
123456789101112131415161718192021222324252627282930313233343536373839404142434445464748495051525354555657585960
For Peer Review
10
sections. The Round 1 Delphi results were analysed manually. In total, 11 new performance
measures were identified in the first round of the Delphi exercise. These are italicised in
Table I.
In the second round, participants were asked to rate 67 performance measures. The
rating was based on a four-point Likert scale, where scales 1 and 2 (‘very important’ and
‘important’) represented the positive category, and scales 3 and 4 (‘unimportant’ and ‘very
unimportant’) the negative category. The results of the Round 2 Delphi exercise were
inputted into the SPSS (version 21) statistical software, and analysed through descriptive
statistics. The decision to retain a performance measure in any Delphi round required that
both healthcare maintenance managers and IC members agreed. Therefore, for a performance
measure to be retained in any round, the participants had to achieve a group mean score of
3.28 or above. Any performance measure with a group mean less than 3.28 was re-submitted
to the Delphi participants for re-rating.
Between the second and third rounds of the Delphi exercise, healthcare maintenance
managers and IC members identified 53 important performance measures in healthcare
maintenance in IC. These are shown in Table 2 (columns D and E). The codes (C – 1 to C –
67) that are used for the performance measures in Table 2 (column C) correspond to the list
of performance measures in Table 1. Although most studies of this nature traditionally end
here, this research study did not. At this stage of the research, it appears as though all the
performance measures with a high level of consensus have the same level of importance in
IC. According to Lavy et al. (2010), this problem is caused by the fact that there are too many
performance measures (or indicators) in facilities management. For example, in a study
conducted by Hinks and McNay (2005), 172 performance measures were identified. In
another example, the Delphi participants in a study on organisational readiness for clinical
information technology/system innovation identified up to 316 performance measures
(Snyder-Halpern, 2001). According to Tangen (2004), it costs organisations money and time
Page 15 of 28 Facilities
123456789101112131415161718192021222324252627282930313233343536373839404142434445464748495051525354555657585960
For Peer Review
11
to analyse too many performance measures. Too many performance measures may result in
information overload. As the organisation grapples with many performance measures, it
becomes difficult for them to prioritize.
As time is money, it is necessary for organisations to collect data only on meaningful
CSFs and performance measures, i.e. those that offer important insights. One factor that may
limit the benefits of such an exercise in facilities is the lack of a meaningful categorisation of
CSFs and performance measures (Lavy et al., 2010). In a few studies where some sort of
categorisation has been applied, the level of importance of the CSFs under which the
performance measures are categorised has not been established. This adds to the difficulty of
selecting appropriate performance measures to drive performance in the organisation. This
study therefore attempts to establish the level of importance of the CSFs in infection control.
For this purpose, three steps were proposed:
1. Categorisation of the performance measures into different mean zones: Since
the Delphi exercises were conducted on a four-point Likert scale, the mean zones were
established by dividing the difference between the maximum and minimum level of
consensuses by four (4 − 3.28/4). This produces four mean zones (I, II, III and IV) with
intervals of approximately 0.18. These were then linked to the CSFs, which are categorised
according to the four perspectives of the BSC. If the mean score of the performance measure
is X, the mean zone it belongs to is identified using the following scale ≤ 3.82 to ≥ 4 (Mean
Zone I), ≤3.64 to >3.82 (Mean Zone 2), ≤3.46 to >3.64 (Mean Zone 3), and ≤3.28 to >3.46
Mean Zone 4). All those performance measures with a mean score of less than 3.28 were
categorised in a fifth mean zone and given a weight of zero. As shown in Table 2, there were
10 (14.9%) performance measures under mean zone 1, and 14 (20.8%) performance measures
under mean zone V. The majority of important performance measures (54.8%) were
categorised under mean zones III and IV.
Page 16 of 28Facilities
123456789101112131415161718192021222324252627282930313233343536373839404142434445464748495051525354555657585960
For Peer Review
12
2. Assign weights to the mean zones: The mean zones were given weighted
scores of between 4 and 1, where 4 and 1 represent the highest and lowest mean scores
respectively. In a number studies in fields such as education (Ohio Department of Education,
2007) and climate change (Emerson et al., 2012) methodologies that are different from this
one have been used to weight items. The weights have not been assigned according to mean
zones. In education, for example, different performance levels (‘untested students’, ‘below
limited’, ‘basic’, ‘proficient’, ‘accelerated’ and ‘advanced’) are assigned different weights.
Performance is calculated by simply multiplying the number of students in a performance
level by the weight and dividing the results by overall possible score. In this research, this has
been achieved differently (refer to section 2.3).
3. Establish the levels of importance of the CSFs: The level of importance of the
CSFs in IC was determined through a research technique called the weighted mean. The
weighted mean is different from the mean in that some data points contribute more than
others do. For every CSF, the number of performance measures categorised under the
different mean zones were multiplied by the weighted score. These were then added, and
divided by the total number of performance measures for that particular CSF to give its level
of importance. The results of the CSFs according to their levels of importance in IC are
presented in Table 2. So far, the most important CSFs in healthcare maintenance in IC are
‘Liaison and Communication between the Healthcare Maintenance Department and IC
Team’, ‘Infection Control Practices’ (Cleaning and Administrative Requirements)’, and
‘Maintenance Resource Availability’. On the other hand, the least important CSFs are
‘Customer Satisfaction’, ‘Transport Requirements’, ‘Staff Training’, and ‘Staff
Development’.
The ranking of the performance measures 1 - 67 (column E, Table 2) indicates that
some performance measures are more important than others are. For example, even though
‘Liaison and Communication with the Infection Control Team’ is the most important CSF,
Page 17 of 28 Facilities
123456789101112131415161718192021222324252627282930313233343536373839404142434445464748495051525354555657585960
For Peer Review
13
the performance measures (C – 1 to C – 6) have varying levels of important in healthcare
maintenance in IC. The six measures achieved rankings of 1, 3, 13, 26, 46 and 46, and the
range between the first and sixth performance measure is 45. Variations also exist in the level
of importance of the performance measures under the eight different CSFs. Therefore, there
is a need to develop a performance measurement tool (PMT) that enables healthcare
maintenance managers to select the most important performance measures from the eight
CSFs, in order to drive performance in IC. The PMT that has been developed in this research
attempts to meet some of these needs.
INSERT TABLE 2
2.3 The Development of a PMT in healthcare maintenance in IC
As shown in Table 3, a performance measurement tool (PMT) was devised in this research to
enable healthcare maintenance managers to quantify performance in IC. The PMT should
enable healthcare maintenance managers to establish the level of performance against
individual performance measures, as well as against a group of performance measures in a
mean zone. Where there is more than one mean zone, the PMT allows healthcare
maintenance managers to measure and compare the performance of all mean zones at the
same time. Finally, through the application of the PMT, healthcare maintenance managers
will be able state the level of performance of the healthcare maintenance department in IC.
The PMT has to be used in conjunction with the results and categorisation of the performance
measures achieved through the Delphi exercise (Table 2).
It is advised that the healthcare maintenance managers work closely with members of
the infection control team for the selection of pertinent performance measures that will help
drive the performance of the healthcare maintenance department in IC. Performance
measures should be selected according to their level of importance in IC from all the four
perspectives of the BSC. They should also be categorised according to the four mean zones of
Page 18 of 28Facilities
123456789101112131415161718192021222324252627282930313233343536373839404142434445464748495051525354555657585960
For Peer Review
14
the PMT using the mean score results presented in Table 2. The fifth mean zone (see Table 2)
contains unimportant performance measures. As shown in Table 3, the four mean zones of
the PMT are coded WSA, WSB, WSC and WSD. These mean zones are also assigned weights
of 4,3,2,1 respectively. For every selected performance measure, the healthcare maintenance
manager at the end of the measurement exercise should state the result that is achieved on a
scale of 1 – 5. In doing so, they must take into account the interpretation given to the rating
scale. The rating scale (L) that is proposed in this research ranges from very poor to excellent
(1 – ‘very poor’, 2 – ‘poor’, 3 – ‘average’, 4 – ‘good’, 5 – ‘excellent’). Conversely, the scale
for interpreting the results of the PMT ranges from poor to excellent (≥ 1% to < 25% - ‘very
poor’, ≥ 25% to < 50% - ‘average’, ≥ 50% - < 75% - ‘good’, ≥ 75% - ≤ 100% - ‘excellent’).
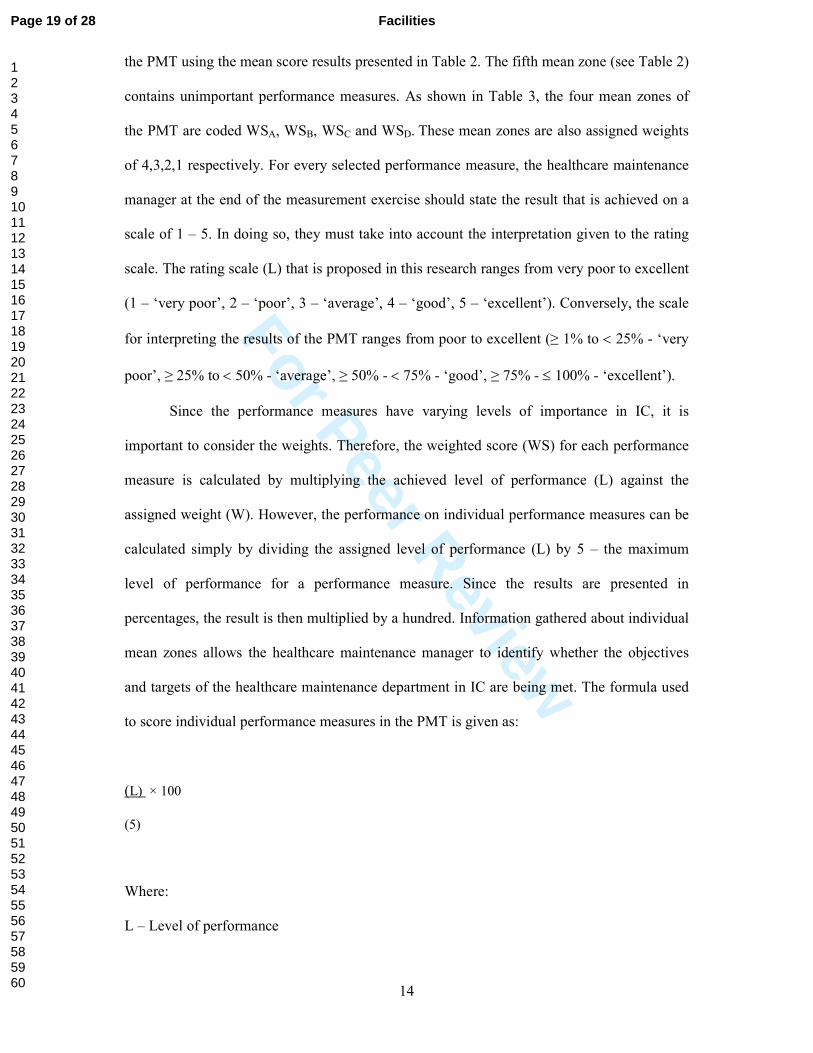
Since the performance measures have varying levels of importance in IC, it is
important to consider the weights. Therefore, the weighted score (WS) for each performance
measure is calculated by multiplying the achieved level of performance (L) against the
assigned weight (W). However, the performance on individual performance measures can be
calculated simply by dividing the assigned level of performance (L) by 5 – the maximum
level of performance for a performance measure. Since the results are presented in
percentages, the result is then multiplied by a hundred. Information gathered about individual
mean zones allows the healthcare maintenance manager to identify whether the objectives
and targets of the healthcare maintenance department in IC are being met. The formula used
to score individual performance measures in the PMT is given as:
(L) × 100
(5)
Where:
L – Level of performance
Page 19 of 28 Facilities
123456789101112131415161718192021222324252627282930313233343536373839404142434445464748495051525354555657585960
For Peer Review
15
INSERT TABLE 3
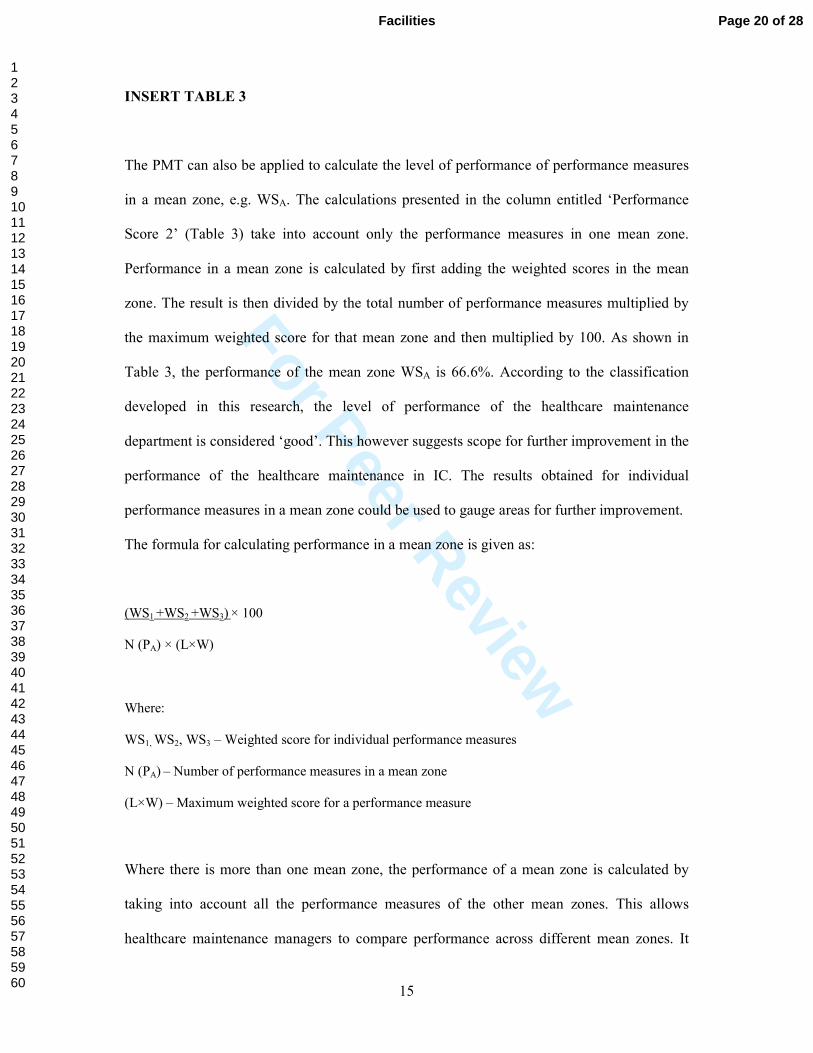
The PMT can also be applied to calculate the level of performance of performance measures
in a mean zone, e.g. WSA. The calculations presented in the column entitled ‘Performance
Score 2’ (Table 3) take into account only the performance measures in one mean zone.
Performance in a mean zone is calculated by first adding the weighted scores in the mean
zone. The result is then divided by the total number of performance measures multiplied by
the maximum weighted score for that mean zone and then multiplied by 100. As shown in
Table 3, the performance of the mean zone WSA is 66.6%. According to the classification
developed in this research, the level of performance of the healthcare maintenance
department is considered ‘good’. This however suggests scope for further improvement in the
performance of the healthcare maintenance in IC. The results obtained for individual
performance measures in a mean zone could be used to gauge areas for further improvement.
The formula for calculating performance in a mean zone is given as:
(WS1 +WS2
+WS3) × 100
N (PA) × (L×W)
Where:
WS1, WS2, WS3 – Weighted score for individual performance measures
N (PA) – Number of performance measures in a mean zone
(L×W) – Maximum weighted score for a performance measure
Where there is more than one mean zone, the performance of a mean zone is calculated by
taking into account all the performance measures of the other mean zones. This allows
healthcare maintenance managers to compare performance across different mean zones. It
Page 20 of 28Facilities
123456789101112131415161718192021222324252627282930313233343536373839404142434445464748495051525354555657585960
For Peer Review
16
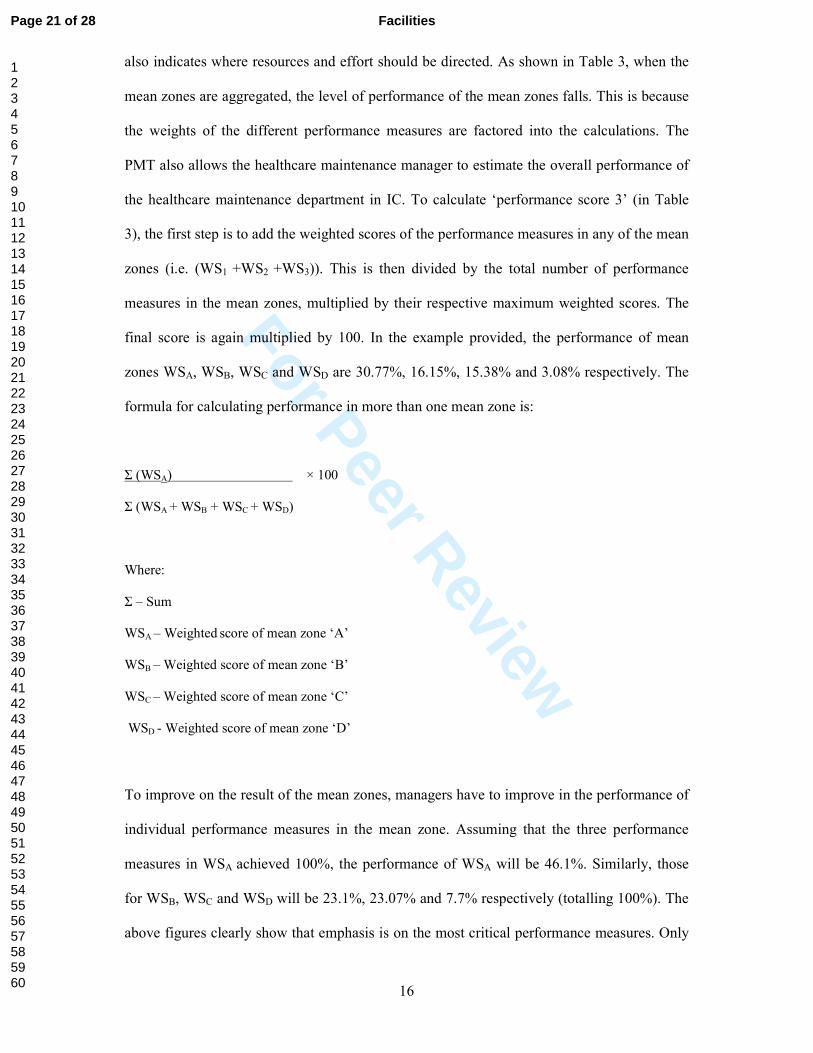
also indicates where resources and effort should be directed. As shown in Table 3, when the
mean zones are aggregated, the level of performance of the mean zones falls. This is because
the weights of the different performance measures are factored into the calculations. The
PMT also allows the healthcare maintenance manager to estimate the overall performance of
the healthcare maintenance department in IC. To calculate ‘performance score 3’ (in Table
3), the first step is to add the weighted scores of the performance measures in any of the mean
zones (i.e. (WS1 +WS2
+WS3)). This is then divided by the total number of performance
measures in the mean zones, multiplied by their respective maximum weighted scores. The
final score is again multiplied by 100. In the example provided, the performance of mean
zones WSA, WSB, WSC and WSD are 30.77%, 16.15%, 15.38% and 3.08% respectively. The
formula for calculating performance in more than one mean zone is:
Σ (WSA) × 100
Σ (WSA + WSB + WSC + WSD)
Where:
Σ – Sum
WSA – Weighted
score of mean zone ‘A’
WSB – Weighted score of mean zone ‘B’
WSC – Weighted score of mean zone ‘C’
WSD - Weighted score of mean zone ‘D’
To improve on the result of the mean zones, managers have to improve in the performance of
individual performance measures in the mean zone. Assuming that the three performance
measures in WSA achieved 100%, the performance of WSA will be 46.1%. Similarly, those
for WSB, WSC and WSD will be 23.1%, 23.07% and 7.7% respectively (totalling 100%). The
above figures clearly show that emphasis is on the most critical performance measures. Only
Page 21 of 28 Facilities
123456789101112131415161718192021222324252627282930313233343536373839404142434445464748495051525354555657585960
For Peer Review
17
three out of the ten performance measures in the PMT are categorised in the mean zone WSA.
Notwithstanding, they account for 46.1% of the overall performance score. The overall
performance score for WSB and WSC are similar, though fewer performance measures were
selected for WSB.
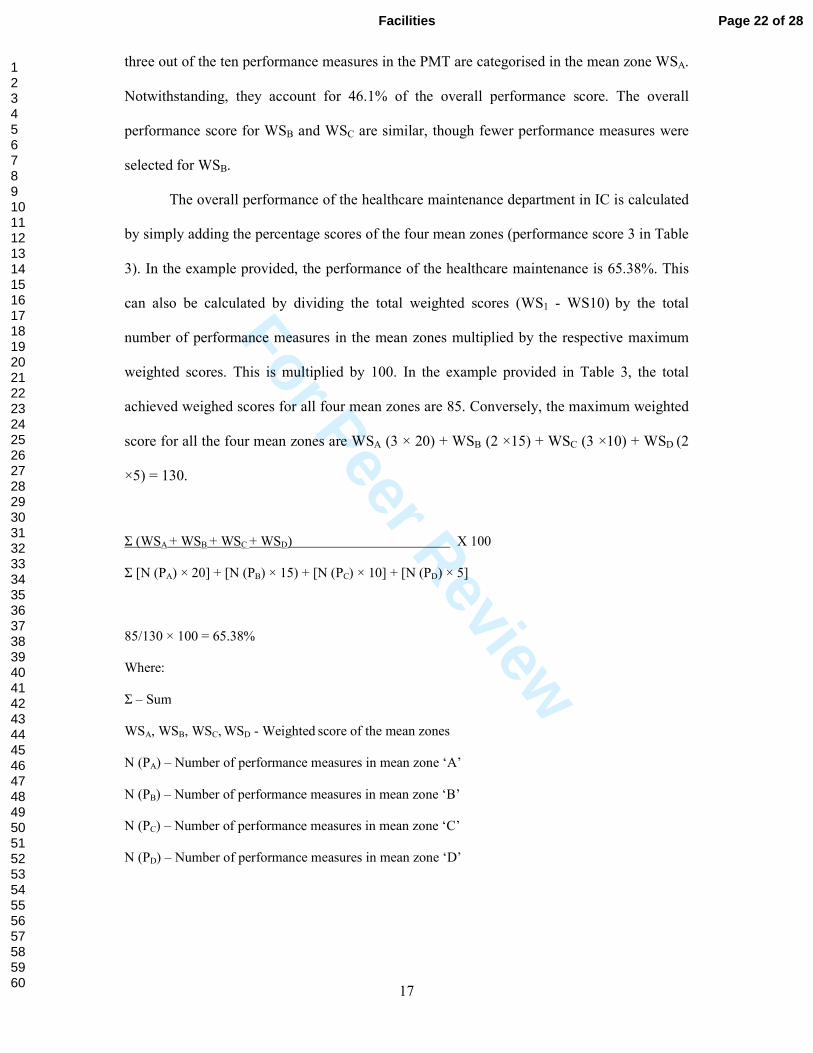
The overall performance of the healthcare maintenance department in IC is calculated
by simply adding the percentage scores of the four mean zones (performance score 3 in Table
3). In the example provided, the performance of the healthcare maintenance is 65.38%. This
can also be calculated by dividing the total weighted scores (WS1 - WS10) by the total
number of performance measures in the mean zones multiplied by the respective maximum
weighted scores. This is multiplied by 100. In the example provided in Table 3, the total
achieved weighed scores for all four mean zones are 85. Conversely, the maximum weighted
score for all the four mean zones are WSA (3 × 20) + WSB (2 ×15) + WSC (3 ×10) + WSD (2
×5) = 130.
Σ (WSA + WSB
+ WSC + WSD) X 100
Σ [N (PA) × 20] + [N (PB) × 15) + [N (PC) × 10] + [N (PD) × 5]
85/130 × 100 = 65.38%
Where:
Σ – Sum
WSA, WSB, WSC, WSD - Weighted
score of the mean zones
N (PA) – Number of performance measures in mean zone ‘A’
N (PB) – Number of performance measures in mean zone ‘B’
N (PC) – Number of performance measures in mean zone ‘C’
N (PD) – Number of performance measures in mean zone ‘D’
Page 22 of 28Facilities
123456789101112131415161718192021222324252627282930313233343536373839404142434445464748495051525354555657585960
For Peer Review
18
Relying on the scale applied in the PMT, the performance of the healthcare maintenance
department in IC in this example is interpreted as good. Yet poor performance is clearly
indicated against some of the performance measures. The results of ‘performance score 1’
indicate those performance measures with poor performance in IC. This information can be
used by the healthcare maintenance manager to focus attention on the most crucial
performance measures in IC (i.e. those with a weighted score of 4). Conversely, the
information can also be used to replace those performance measures that have achieved a
100% score in IC. The formula provided above can also be used to benchmark the
performance of healthcare maintenance departments in IC across the NHS.
3. Conclusion
This research has demonstrated how the results achieved from a Delphi study can be further
analysed to direct resources, time and effort to the most critical CSFs and performance
measures in healthcare maintenance in IC. The performance measures identified in the Delphi
study were categorised into five mean zones. By assigning weights to the mean zones, it was
possible to distinguish between the eight CSFs according to levels of importance in IC.
Through the application of a statistical method called the weighted mean, ‘Liaison and
Communication with the IC Team’ emerged as the most important CSF in healthcare
maintenance in IC. The second most important CSF identified was ‘Infection Control
Practices’. Of the three sub-groups under ‘Infection Control Practices’, ‘Cleaning
Requirements’ attained the best result in IC. Although ‘Customer Satisfaction’ and
‘Maintenance Strategies’ ranked bottom, they also contained performance measures that were
ranked highly in IC.
The five mean zones provide clarity about the level of importance of the performance
measures in healthcare maintenance in IC. Since the CSFs and performance measures are also
selected from the four areas of the BSC, performance is driven from all the critical areas of
Page 23 of 28 Facilities
123456789101112131415161718192021222324252627282930313233343536373839404142434445464748495051525354555657585960
For Peer Review
19
the healthcare maintenance department in IC. This of course is one of the key strengths of the
PMT: the selection of performance measures from eight CSFs that have been categorised into
the four perspectives of the BSC: internal business processes, financial, innovation, learning
and customer satisfaction perspectives.
Through the application of the PMT, healthcare maintenance managers are able to
measure performance in three levels. In each of these performance levels, performance
measurement is driven by the weightings of the performance measures. Healthcare
maintenance manager are thus able to verify whether poor results are coming from the most
important or least important performance measures. Since the PMT allows healthcare
maintenance managers to gather information about individual performance measures,
resources and effort can easily be prioritised. The PMT that has been developed here could be
used to benchmark healthcare maintenance services across NHS hospitals. Obviously, issues
related to the healthcare maintenance strategy, mission, goals, objectives, targets, etc. will
have to be addressed by individual healthcare maintenance departments. Having identified
the CSFs and performance measures through expert opinion, the next challenge will be to test
and validate the PMT across healthcare maintenance departments in the NHS.
References
British Broadcasting Corporation. 2014, “Hospital Infection Rates Must Come Down, Says
Watchdog”, BBC, available at: http://www.bbc.co.uk/news/health-27046990 (accessed
January 20 2015).
Bivona, E. and Montemaggiore, G. (2005), “Evaluating Fleet and Maintenance Management
Strategies through System Dynamics Model in a City Bus Company”, available at:
http://www.systemdynamics.org/conferences/2005/proceed/papers/MONTE431.pdf
(accesses 22 September 2014).
Page 24 of 28Facilities
123456789101112131415161718192021222324252627282930313233343536373839404142434445464748495051525354555657585960
For Peer Review
20
Bullen, C. V. and Rockart, J. F. (1981), “A primer on critical success factors”, no. 1220-81,
Centre for Information Systems Research, Massachusetts Institute of Technology (MIT).
Burrill, G. (2008), “Healthcare Construction under way”, available at:
http://www.touchbriefings.com/pdf/3202/burrill.pdf (accessed 27 September 2012).
Caralli, R. (2004), “The Critical Success Factor Method: Establishing a Foundation for
Enterprise Security Management”, Carnegie Mellon Software Engineering Institute,
Pittsburgh.
Centres for Disease Control and Prevention. (2003), “CDC guidelines for infection control”,
available at: https://www.premierinc.com/safety/topics/guidelines/cdc_guidelines.jsp
(accessed 20 July 2012).
Chalifoux, A. and Baird, J. (1999), “Reliability Centered Maintenance (RCM) Guide:
Operating a More Effective Maintenance Program, US Army Corps of Engineers,
Illinois.
Emerson, J., Esty, D., Hsu, A., Levy, M., Sherbinin, A., Mara, V. and Jaiteh, M. 2012, “2012
Environmental Performance Index and Pilot Trend Environmental Performance Index”,
Yale University.
European Centre for Disease Prevention and Control. (2013), “Point Prevalence Survey of
Healthcare-Associated Infections and Antimicrobial use in European Acute Care
Hospitals 2011–2012”, Surveillance Report no. 2011–2012, ECDPC, Stockholm.
Hicks, M. L. (2004), “Hospital Maintenance Strategic Plan at the University of Michigan
Hospital and Health Centers”, Business Briefing, available at:
http://www.touchbriefings.com/pdf/747/hosp041_hicks.pdf (Accessed 5 October 2011).
Hinks, J. and McNay, P. (1999), “the Creation of a Management‐by‐variance Tool for
Facilities Management Performance Assessment”, Facilities, Vol. 17 No. ½, pp. 31–53.
Hoffman, P. N., Bennett, A. M. and Scott, G. M. (1999), “Controlling Airborne Infections”,
Journal of Hospital Infection, Vol. 43, pp. 203-210.
Page 25 of 28 Facilities
123456789101112131415161718192021222324252627282930313233343536373839404142434445464748495051525354555657585960
For Peer Review
21
Joseph, A. (2006), “The Impact of Environment on Infections in Healthcare Facilities”
Centre for Health Design, California.
Kidd, F., Buttner, C. and Kressel, A. B. (2007), “Construction: A Model Program for
Infection Control Compliance”, American Journal of Infection Control, Vol. 35 No. 5,
pp. 347–350.
Lam, K. (2007), “Design for Maintenance from the Viewpoint of Sustainable Hospital
Buildings”, available at: http://mail.airah.org.au/downloads/2007-12-02.pdf (accessed 5
February 2011).
Lavy, S., Garcia, J. A. and Dixit, M. K. (2010), “Establishment of KPIs for Facility
Performance Measurement: Review of Literature”, Facilities, Vol. 28 No. 9/10, pp.
440–464.
Lee, H., Hackman and Scott, D. (2008), “Development of a Conceptual Framework for the
Study of Building Maintenance Operation Processes in the Context of Facility
Management”, Surveying and Built Environment, Vol. 19 No. 19, pp. 81–101.
Liyanage, C. and Egbu, C. (2005), “Controlling Healthcare Associated Infections (HAI) and
the Role of Facilities Management in Achieving “Quality” in Healthcare: a Three-
Dimensional View”, Facilities, Vol. 23 No. 5/6, pp. 194–215.
National Audit Office, 2009. “Reducing healthcare associated infections in hospitals in
England”. NAO, London.
National Audit Office, 2004. “Improving patient care by reducing the risk of hospital
acquired infection”, NAO, London.
National Audit Office. (2000), “The Management and Control of Hospital Acquired Infection
in Acute NHS Trusts in England HC”, NAO, London.
National Institute for Health and Clinical Excellence. (2011), “Prevention and Control of
Healthcare-Associated Infections”, Costing report No. 36, NICE, Manchester.
Page 26 of 28Facilities
123456789101112131415161718192021222324252627282930313233343536373839404142434445464748495051525354555657585960
For Peer Review
22
Neely, A., Mills, J., Platts, K., Richards, H., Gregory, M., Bourne, M. and Kennerley, M.
(2000), “Performance Measurement System Design: Developing and Testing a Process-
based Approach”, International Journal of Operations & Production Management, Vol.
20 No. 10, pp.1119–1145.
Ohio Department of Education. (2007), ‘Performance Index’, Educational Management
Information System (EMIS), Ohio.
Ohsaki, Y., Koyano, S., Tachibana, M., Shibukawa, K., Kuroki, M., Yoshida, I. and Ito, Y.
(2007), “Undetected Bacillus Pseudo-Outbreak after Renovation Work in a Teaching
Hospital”. Journal of Infection, Vol. 54 No. 6, pp. 617–622.
Riley, D., Freihaut, J., Bahnfleth, W. and Karapatyan, Z. (2004), “Indoor Air Quality
Management and Infection Control in Healthcare Facilities”, available at
www.engr.psu.edu/iec/publications/papers/indoor_air_quality.pdf (accessed 27 July
2012).
Snyder-Halpern, R. (2001), “Indicators of Organizational Readiness for Clinical Information
Technology/Systems Innovation: a Delphi Study”, International Journal of Medical
Informatics, Vol. 63 No. 3, pp. 179–204.
Streifel, A. (2005), “Infection Control Factors in Hospital Building Maintenance and
Operations”, Hospital Engineering and Facilities.
Tabbara, K. F., & Jabarti, A. A. (1998), “Hospital Construction-Associated Outbreak of
Ocular Aspergillosis after Cataract Surgery”, Ophthalmology, Vol. 105 No. 3, pp. 522–
526.
Tangen, S. (2004), “Performance Measurement: from Philosophy to Practice” International
Journal of Productivity and Performance Management, Vol. 53 No. 8, pp. 726–737.
Toni, A. F. D., Fornasier, A., Montagner, M. and Nonino, F. (2007), “A Performance
Measurement System for Facility Management: The Case Study of a Medical Service
Page 27 of 28 Facilities
123456789101112131415161718192021222324252627282930313233343536373839404142434445464748495051525354555657585960
For Peer Review
23
Authority”, International Journal of Productivity and Performance Management, Vol.
56 No. 5/6, pp. 417–435.
Tsang, A. H. C. (1998), “A Strategic Approach to Managing Maintenance Performance”,
Journal of Quality in Maintenance Engineering, Vol. 4 No. 2, pp. 87–94.
Wald, A., Leisenring, W., Burik, J. and Bowden, R. A. 1997, “Epidemiology of Aspergillus
Infections in a Large Cohort of Patients Undergoing Bone Marrow Transplantation”,
Journal of Infectious Diseases, Vol. 175 No. 6, pp. 1459–66.
World Health Organisation. (2002), “Guidelines on Prevention and Control of Hospital
Associated Infections”, WHO, New Delhi.
Yeovil District Hospital NHS. (2009). Estates Maintenance Policy (including Planned
Preventative Maintenance), NHS, Yeovil.
Page 28 of 28Facilities
123456789101112131415161718192021222324252627282930313233343536373839404142434445464748495051525354555657585960