arrl laboratory expanded test-result report icom ic...
TRANSCRIPT

ARRL Laboratory Expanded Test-Result Report
ICOM IC-7800 Prepared by: American Radio Relay League, Inc. Technical Department Laboratory 225 Main St. Newington, CT 06111 Telephone: (860) 594-0214 Internet: [email protected] Order From: American Radio Relay League, Inc. Technical Department Secretary 225 Main St. Newington, CT 06111 Telephone: (860) 594-0278 Internet: [email protected] Price: $7.50 for ARRL Members, $12.50 for non-Members, postpaid. Model Information: ICOM IC-7800 Serial #: 0201062 QST "Product Review" August, 2004 Manufacturer: ICOM America, Inc. 2380 116th Ave NE Bellevue, WA 98004 Telephone: 425-454-8155
ARRL Laboratory Expanded Test-Result Report Model: ICOM IC-7800 Serial: 0201062 Copyright 2004, American Radio Relay League, Inc. All Rights Reserved.
Page 1

Table of Contents: Introduction..................................................................................................................................................3 Transmitter Output Power............................................................................................................................3 Transmitter Output Power Results ...............................................................................................................4 Transverter Jack Output Power....................................................................................................................4 Transmit Frequency Range ..........................................................................................................................4 CW Transmit Frequency Accuracy..............................................................................................................5 Spectral Purity..............................................................................................................................................5 Spectral-Purity Graphs.................................................................................................................................6 Transmit Two-Tone IMD.............................................................................................................................8 Transmit IMD Graphs ..................................................................................................................................8 SSB Carrier and Unwanted Sideband Suppression....................................................................................10 CW Keying Waveforms and Sidebands.....................................................................................................11 CW Keyer Speed Range.............................................................................................................................11 Keyer Sidetone Frequency .........................................................................................................................12 Transmit/Receive Turnaround Time..........................................................................................................12 Transmit Delay Time .................................................................................................................................12 Transmit Composite Noise.........................................................................................................................12 Transmit Composite Noise Graphs ............................................................................................................13 Receiver Noise Floor (Minimum Discernible Signal) ...............................................................................14 Receive Frequency Range..........................................................................................................................14 AM Sensitivity ...........................................................................................................................................15 FM SINAD.................................................................................................................................................15 Antenna Port Isolation ...............................................................................................................................15 Blocking Dynamic Range ..........................................................................................................................16 Two-Tone 3rd-Order IMD Dynamic Range ..............................................................................................17 Third-Order Intercept.................................................................................................................................18 Swept Dynamic Range Graphs ..................................................................................................................18 Second-Order Intercept ..............................................................................................................................20 Receiver Phase Noise.................................................................................................................................21 In-Band Receiver IMD...............................................................................................................................21 In-Band Receiver IMD Graphs ..................................................................................................................22 FM Adjacent Channel Selectivity ..............................................................................................................23 FM Two-Tone 3rd-Order Dynamic Range ................................................................................................23 IF and Image Rejection ..............................................................................................................................24 Audio Output Power ..................................................................................................................................24 Audio Hiss..................................................................................................................................................24 IF and Audio Frequency Response ............................................................................................................24 Squelch Sensitivity.....................................................................................................................................25 S-Meter Sensitivity ....................................................................................................................................25 Notch Filter Depth .....................................................................................................................................25
ARRL Laboratory Expanded Test-Result Report Model: ICOM IC-7800 Serial: 0201062 Copyright 2004, American Radio Relay League, Inc. All Rights Reserved.
Page 2
Introduction This document summarizes the extensive battery of tests performed by the ARRL Laboratory for each unit that is featured in QST "Product Review." For all tests, there is a discussion of the test and test method used in ARRL Laboratory testing. For most tests, critical conditions are listed to enable other engineers to duplicate our methods. For some of the tests, a block diagram of the test setup is included. The ARRL Laboratory has a document, the ARRL Laboratory Test Procedures Manual, which explains our specific test methods in detail. While this is not available as a regular ARRL publication, it may be downloaded from our web page. Most of the tests used in ARRL product testing are derived from recognized standards and test methods. Other tests have been developed by the ARRL Lab. The ARRL Laboratory test equipment is calibrated annually, with traceability to National Institute of Standards and Technology (NIST). The units being tested are operated as specified by the equipment manufacturer. Equipment that can be operated from 13.8 volts (nominal) is also tested for function, output power and frequency accuracy at the minimum specified voltage, or 11.5 volts if not specified. Also, units that are capable of mobile or portable operation are tested at their rated temperature range, or at –10 to +60 degrees Celsius in a commercial temperature chamber. ARRL "Product Review" testing represents a sample of only one unit (although we sometimes obtain an extra sample or two for comparison purposes). This is not necessarily representative of all units of the same model number. It is not uncommon that some parameters will vary significantly from unit to unit. The ARRL Laboratory and Product Review editor work with manufacturers to resolve any deviation from specifications or other problems encountered in the review process. These problems are documented in the Product Review.
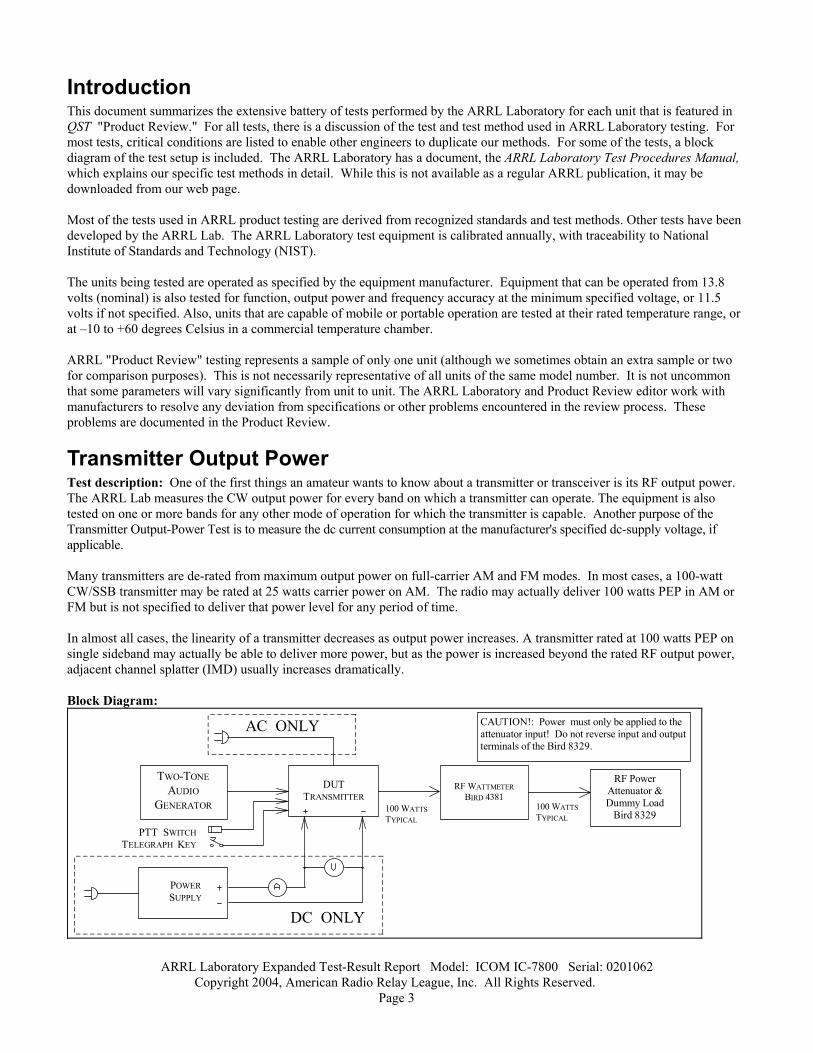
Transmitter Output Power Test description: One of the first things an amateur wants to know about a transmitter or transceiver is its RF output power. The ARRL Lab measures the CW output power for every band on which a transmitter can operate. The equipment is also tested on one or more bands for any other mode of operation for which the transmitter is capable. Another purpose of the Transmitter Output-Power Test is to measure the dc current consumption at the manufacturer's specified dc-supply voltage, if applicable. Many transmitters are de-rated from maximum output power on full-carrier AM and FM modes. In most cases, a 100-watt CW/SSB transmitter may be rated at 25 watts carrier power on AM. The radio may actually deliver 100 watts PEP in AM or FM but is not specified to deliver that power level for any period of time. In almost all cases, the linearity of a transmitter decreases as output power increases. A transmitter rated at 100 watts PEP on single sideband may actually be able to deliver more power, but as the power is increased beyond the rated RF output power, adjacent channel splatter (IMD) usually increases dramatically. Block Diagram:
CAUTION!: Power must only be applied to theattenuator input! Do not reverse input and outputterminals of the Bird 8329.
RF PowerAttenuator &Dummy Load
Bird 8329100 WATTSTYPICAL
100 WATTSTYPICAL
RF WATTMETERBIRD 4381
TWO-TONEAUDIO
GENERATOR
DC ONLY
AC ONLY
PTT SWITCHTELEGRAPH KEY
DUTTRANSMITTER
POWERSUPPLY
ARRL Laboratory Expanded Test-Result Report Model: ICOM IC-7800 Serial: 0201062 Copyright 2004, American Radio Relay League, Inc. All Rights Reserved.
Page 3

Transmitter Output Power Results Frequency Band
Mode Unit Minimum Power (W)
Measured Minimum Power (W)
Unit Maximum Power (W)
Measured Maximum Power (W)
Notes
1.8 MHz CW – 1.8 205 204 3.5 MHz CW – 1.9 205 204 3.5 MHz AM – – 60 52 W carrier 5.25 MHz USB – – 205 205 7.0 MHz CW – – – 206 10.1 MHz CW – – – 204 14 MHz CW – 1.8 – 205 14 MHz USB – – – 200 18 MHz CW – – – 204 21 MHz CW – – – 203 24 MHz CW – – – 203 28 MHz CW – – – 203 28 MHz FM – – – 200 50 MHz CW – 1.9 200 197 50 MHz USB – – 205 192 50 MHz AM – – 55 54 50 MHz FM – – – 195
Notes:
Transverter Jack Output Power Test Description: Transverter jack output power can be important to selection of an external transverter. Low-level transverter outputs are typically in the range of –10 to +10 dBm (0.1 mW to 10 mW). Transverter Output: Band Transverter Output Transverter Leakage (transverter
off, transmitter at max output) 20M –4.2 dBm –13 dBm 15M –4.8 dBm –15 dBm 10M –3.3 dBm < –30 dBm 6M 4.5 dBm < –30 dBm Notes:
Transmit Frequency Range Test Description: Many transmitters can transmit outside the amateur bands, either intentionally, to accommodate MARS operation, for example, or unintentionally as the result of the design and internal software. The ARRL Lab tests the transmit frequency range inside the screen room. Most modern synthesized transmitters are capable of operation outside the ham bands, but spectral purity is not always legal outside the bands, so caution must be used. In addition, most other radio services require that transmitting equipment be type accepted for that service. Amateur equipment is not legal for use on other than amateur and MARS frequencies.
ARRL Laboratory Expanded Test-Result Report Model: ICOM IC-7800 Serial: 0201062 Copyright 2004, American Radio Relay League, Inc. All Rights Reserved.
Page 4

Test Results:
Frequency Low-Frequency Limit High-Frequency Limit Notes 160 M 1.800 000 MHz 1.999 999 MHz 80 M 3.500 000 MHz 3.999 999 MHz 60 M 5.330 500 MHz 5.403 500 MHz 1 40 M 7.000 000 MHz 7.299 999 MHz 30 M 10.100 000 MHz 10.149 999 MHz 20 M 14.000 000 MHz 14.349 999 MHz 17 M 18.068 000 MHz 18.167 999 MHz 15 M 21.000 000 MHz 21.449 999 MHz 12 M 24.890 000 MHz 24.989 999 MHz 10 M 28.000 000 MHz 29.699 999 MHz 6M 50.000 000 MHz 53.999 999 MHz
Notes: 1. Transmitter firmware limits transmission to the specific suppressed-carrier frequencies of the allocation on this band.
CW Transmit Frequency Accuracy Test Description: Most modern amateur equipment is surprisingly accurate in frequency. It is not uncommon to find equipment operating within a few Hz of the frequency indicated on the frequency display. However, some units, notably "analog" units, not using a phase-lock loop in the VFO design, can be off by a considerable amount. Frequency is also measured at minimum output power, low supply voltage (12 volt units only) and over the operating temperature range (mobile and portable units only). Non-portable equipment is not tested in the temperature chamber. Test Results:
Unit Display Frequency
Temperature Measured Frequency Full Output Power
Notes
14.020 000 MHz 25 C 14.020 011 MHz 50.020 000 MHz 25 C 50.020 049 MHz
Spectral Purity Test Description: All transmitters emit some signals outside their assigned frequency or frequency range. These signals are known as spurious emissions or "spurs." Part 97 of the FCC rules and regulations specify the amount of spurious emissions that can be emitted by a transmitter operating in the Amateur Radio Service. The ARRL Laboratory uses a spectrum analyzer to measure the spurious emission on each band on which a transmitter can operate. The transmitter is tested across the band and the worst-case spectral purity on each band is saved to a file on disk. Spectral purity is reported in dBc, meaning dB relative to the transmitted carrier. The graphs and tables indicate the relative level of any spurious emissions from the transmitter. The lower that level, the better the transmitter is. So a transmitter whose spurious emissions are –60 dBc is spectrally cleaner than is one whose spurious emissions are –30 dBc. Key Test Conditions: Output power is adjusted to full power on each amateur band. The resolution bandwidth of the spectrum analyzer is 10 kHz on HF, 100 kHz on VHF, 1 MHz on UHF.
ARRL Laboratory Expanded Test-Result Report Model: ICOM IC-7800 Serial: 0201062 Copyright 2004, American Radio Relay League, Inc. All Rights Reserved.
Page 5

Spectral Purity Test Block Diagram:
CAUTION!: Power must only be applied tothe attenuator input! Do not reverse inputand output terminals of the Bird 8329.
RF PowerAttenuator &Dummy Load
Bird 8329100 WATTSTYPICAL
100 WATTSTYPICAL
RF WATTMETERBIRD 4381
TWO-TONEAUDIO
GENERATOR
TELEGRAPH KEY
DUTTRANSMITTER
POWER SOURCE
10 dB STEPATTENUATOR
HP 355D
1 dB STEPATTENUATOR
HP 3555C
SPECTRUMANALYZERHP 8563E
DO NOTEXCEED0 dBm
Spectral-Purity Graphs 160M
0 5 10 15 20 25 30 35 40 45 50–80
–70
–60
–50
–40
–30
–20
–10
0
Frequency (MHz)
Reference Level: 0 dBc
80M
0 5 10 15 20 25 30 35 40 45 50–80
–70
–60
–50
–40
–30
–20
–10
0
Frequency (MHz)
Reference Level: 0 dBc
40M
0 5 10 15 20 25 30 35 40 45 50–80
–70
–60
–50
–40
–30
–20
–10
0
Frequency (MHz)
Reference Level: 0 dBc
30M
0 10 20 30 40 50 60 70 80 90 100–80
–70
–60
–50
–40
–30
–20
–10
0
Frequency (MHz)
Reference Level: 0 dBc
ARRL Laboratory Expanded Test-Result Report Model: ICOM IC-7800 Serial: 0201062 Copyright 2004, American Radio Relay League, Inc. All Rights Reserved.
Page 6

20M
0 10 20 30 40 50 60 70 80 90 100–80
–70
–60
–50
–40
–30
–20
–10
0
Frequency (MHz)
Reference Level: 0 dBc
17M
0 10 20 30 40 50 60 70 80 90 100–80
–70
–60
–50
–40
–30
–20
–10
0
Frequency (MHz)
Reference Level: 0 dBc
15M
0 10 20 30 40 50 60 70 80 90 100–80
–70
–60
–50
–40
–30
–20
–10
0
Frequency (MHz)
Reference Level: 0 dBc
12M
0 10 20 30 40 50 60 70 80 90 100–80
–70
–60
–50
–40
–30
–20
–10
0
Frequency (MHz)
Reference Level: 0 dBc
10M
0 20 40 60 80 100 120 140 160 180 200–80
–70
–60
–50
–40
–30
–20
–10
0
Frequency (MHz)
Reference Level: 0 dBc
6M
0 50 100 150 200 250 300 350 400 450 500–80
–70
–60
–50
–40
–30
–20
–10
0
Frequency (MHz)
Reference Level: 0 dBc
ARRL Laboratory Expanded Test-Result Report Model: ICOM IC-7800 Serial: 0201062 Copyright 2004, American Radio Relay League, Inc. All Rights Reserved.
Page 7

Transmit Two-Tone IMD Test Description: Investigating the sidebands from a modulated transmitter requires a narrow-band spectrum analysis. In this test, a two-tone signal is used to modulate the transmitter. The spectral display shows the test tones plus some of the IMD products produced by the SSB transmitter. In the ARRL Lab, frequencies of 700 and 1900 Hz is used to modulate the transmitter. These frequencies were selected to be within the audio passband of the typical transmitter, resulting in a meaningful display of transmitter IMD. The intermodulation products appear on the spectral plot above and below the two tones. The lower the products, the better the transmitter. In general, it is the products that are farthest removed from the two tones (typically > 3 kHz away) that cause the most problems. These can cause splatter up and down the band from strong signals. Key Test Conditions: Transmitter operated at rated output power. Audio tones and drive level adjusted for best performance. Both audio tones adjusted for equal RF output. Level to spectrum analyzer, –10 dBm maximum. Resolution bandwidth, 10 Hz Block Diagram:
CAUTION!: Power must only be applied tothe attenuator input! Do not reverse inputand output terminals of the Bird 8329.
RF PowerAttenuator &Dummy Load
Bird 8329100 WATTSTYPICAL
100 WATTSTYPICAL
RF WATTMETERBIRD 4381
TWO-TONEAUDIO
GENERATOR
TELEGRAPH KEY
DUTTRANSMITTER
POWER SOURCE
10 dB STEPATTENUATOR
HP 355D
1 dB STEPATTENUATOR
HP 3555C
SPECTRUMANALYZERHP 8563E
DO NOTEXCEED0 dBm
Transmit IMD Graphs 160M
–10 –8 –6 –4 –2 0 2 4 6 8 10–80
–70
–60
–50
–40
–30
–20
–10
0
Frequency Offset (kHz)
Reference Level: 0 dB PEP
80M
–10 –8 –6 –4 –2 0 2 4 6 8 10–80
–70
–60
–50
–40
–30
–20
–10
0
Frequency Offset (kHz)
Reference Level: 0 dB PEP
ARRL Laboratory Expanded Test-Result Report Model: ICOM IC-7800 Serial: 0201062 Copyright 2004, American Radio Relay League, Inc. All Rights Reserved.
Page 8

60M
–10 –8 –6 –4 –2 0 2 4 6 8 10–80
–70
–60
–50
–40
–30
–20
–10
0
Frequency Offset (kHz)
Reference Level: 0 dB PEP
40M
–10 –8 –6 –4 –2 0 2 4 6 8 10–80
–70
–60
–50
–40
–30
–20
–10
0
Frequency Offset (kHz)
Reference Level: 0 dB PEP
30M
–10 –8 –6 –4 –2 0 2 4 6 8 10–80
–70
–60
–50
–40
–30
–20
–10
0
Frequency Offset (kHz)
Reference Level: 0 dB PEP
20M
–10 –8 –6 –4 –2 0 2 4 6 8 10–80
–70
–60
–50
–40
–30
–20
–10
0
Frequency Offset (kHz)
Reference Level: 0 dB PEP
17M
–10 –8 –6 –4 –2 0 2 4 6 8 10–80
–70
–60
–50
–40
–30
–20
–10
0
Frequency Offset (kHz)
Reference Level: 0 dB PEP
15M
–10 –8 –6 –4 –2 0 2 4 6 8 10–80
–70
–60
–50
–40
–30
–20
–10
0
Frequency Offset (kHz)
Reference Level: 0 dB PEP
ARRL Laboratory Expanded Test-Result Report Model: ICOM IC-7800 Serial: 0201062 Copyright 2004, American Radio Relay League, Inc. All Rights Reserved.
Page 9

12M
–10 –8 –6 –4 –2 0 2 4 6 8 10–80
–70
–60
–50
–40
–30
–20
–10
0
Frequency Offset (kHz)
Reference Level: 0 dB PEP
10M
–10 –8 –6 –4 –2 0 2 4 6 8 10–80
–70
–60
–50
–40
–30
–20
–10
0
Frequency Offset (kHz)
Reference Level: 0 dB PEP
6M
–10 –8 –6 –4 –2 0 2 4 6 8 10–80
–70
–60
–50
–40
–30
–20
–10
0
Frequency Offset (kHz)
Reference Level: 0 dB PEP
SSB Carrier and Unwanted Sideband Suppression Test Description: The purpose of the SSB Carrier and opposite-sideband Suppression test is to determine the level of carrier and unwanted sideband suppression relative to Peak Envelope Power (PEP). The transmitter output is observed on the spectrum analyzer and the unwanted components are compared to the desired sideband. The level to the spectrum analyzer is –10 dBm nominal. The measurement bandwidth is 100 Hz. The greater the amount of suppression, the better the transmitter. For example, opposite sideband suppression of 60 dB is better than suppression of 50 dB. Test Results:
Frequency Carrier Suppression Opposite Sideband Suppression
Notes
14.2 MHz USB/LSB –63/–63 dB PEP > –73/–73 dB PEP 50.2 MHz USB/LSB –60/–60 dB PEP > –70/–72 dB PEP
ARRL Laboratory Expanded Test-Result Report Model: ICOM IC-7800 Serial: 0201062 Copyright 2004, American Radio Relay League, Inc. All Rights Reserved.
Page 10

CW Keying Waveforms and Sidebands Test Description: The purpose of the CW Keying Waveform Test is to determine the shape of the transmitter's RF output envelope in the CW mode. If the transmitter under test has several CW modes, (VOX, QSK) these are also tested. A picture of the oscilloscope screen is taken of the results. The first and second dits are shown in all modes. If the rise or fall times become too short, the transmitter may generate key clicks. Most click-free transmitters have rise and fall times between 1 and 5 ms. However, key clicks are most often generated by sudden transitions in the keying envelope (e.g., "square corners"), so a short rise or fall time is not a guarantee of clicks. The absolute values of the on delay and off delay are not critical, but it is important that they be approximately the same so that CW weighting will not be affected. Some transmitters used in the VOX mode exhibit a first dit that is shorter than subsequent dits. Other transmitters can show significant shortening of all dits when used in the QSK mode. The latter will cause keying to sound choppy. This test also measures the sidebands generated by the transceiver on high speed CW. This is an indication of the degree to which a transmitter may exhibit 'key clicks'. The transmitter is keyed at 60-wpm by an external circuit. The sidebands are measured on the spectrum analyzer using a resolution bandwidth of 10 Hz, and a long sweep time (30 seconds) so the worst-case spectrum is captured.
Figure A – Keying Waveform Figure B – Keying Spectrum
14015 14017 14019 14021 14023 14025–100
–90
–80
–70
–60
–50
–40
–30
–20
–10
0
Frequency Sweep: -5 to +5 kHz from Carrier
Reference Level: 0 dBcVertical Scale: dB
02.00Figure Notes: 1. Figure 'A' shows the keying waveform from the oscilloscope. The top trace is the voltage on the keying line of the transceiver (the external keying circuit uses an open-collector transistor in its output). A low voltage on this line indicates the transmitter "key down" condition. The second trace is the actual transmitter output. The horizontal axis is 10 ms/division, and the keying rate is 60 wpm. The first and second dits are shown, and some traces also show the beginning of the third dit 2. Figure 'B' shows the keying sidebands from the spectrum analyzer for a continuous string of dits at 60 wpm.
CW Keyer Speed Range Test Description: This test measures the speed of the internal keyer on transmitters so equipped. The keyer is tests at minimum, midrange and maximum speeds and the time from dit to dit is measured using an oscilloscope and used to calculate the speed using the "Paris" method of code speed calculation. (In the Paris method, the word "Paris" is used as the standard word to calculate words per minute.)
ARRL Laboratory Expanded Test-Result Report Model: ICOM IC-7800 Serial: 0201062 Copyright 2004, American Radio Relay League, Inc. All Rights Reserved.
Page 11
Test Results:
Minimum Maximum Default Notes 6.0 WPM 48 WPM 27 WPM
Notes:
Keyer Sidetone Frequency Test Description: This test measures the audio frequency of the keyer sidetone. Test Result:
Default pitch Minimum Maximum Notes 600 Hz 300 Hz 900 Hz
Transmit/Receive Turnaround Time Test Description: The purpose of the Transmit/Receive turnaround test is to measure the delay required to switch from transmit mode to receive mode. Test Results:
Frequency T/R Delay AGC Fast T/R Delay AGC Slow Notes 14.02 MHz 17 ms 18 ms 1, 2
Notes: 1. T/R delay less than or equal to 35 ms is suitable for use on AMTOR. 2. No significant variation in CW mode.
Transmit Delay Time Test Description: The purpose of the Transmit Delay test is to measure the time between PTT closure and 50% RF output. It is measured on SSB, modulated with a single tone and on FM, unmodulated. Test Results:
Frequency Mode Delay Notes 14.2 MHz SSB 12.5 ms 29.2 MHz FM 12 ms
Transmit Composite Noise Test Description: The purpose of the Composite-Noise Test is to observe and measure the phase and amplitude noise, as well as any spurious signals generated by the device under test transmitter. Since phase noise is the primary noise component in any well-designed transmitter, it can be assumed, therefore, that almost all the noise observed during this test is phase noise. This measurement is accomplished by converting the output of the transmitter down to a frequency about 10 or 20 Hz above baseband. A mixer and a signal generator used as a local oscillator are used to perform this conversion. Filters remove the dc component as well as the unwanted heterodyne components. The remaining noise and spurious signals are then observed on the spectrum analyzer. The lower the noise as seen on the plot, the better the transmitter. Key Test Conditions: Frequencies from 2 to 22 kHz from the carrier are measured. Ten sweeps are averaged on the spectrum analyzer to reduce noise.
ARRL Laboratory Expanded Test-Result Report Model: ICOM IC-7800 Serial: 0201062 Copyright 2004, American Radio Relay League, Inc. All Rights Reserved.
Page 12

Block Diagram:
RF POWERATTENUATOR
BIRD 8329
10 dB STEPATTENUATOR
HP 355D
1 dB STEPATTENUATOR
HP 355C
RFWATTMETERBIRD 4381
6 dBATTENUATOR
1.25 MHZLOW PASS
FILTER
1 KHZHIGH PASS
FILTER
SPECTRUMANALYZERHP 8563E
DUT
TRANSMITTER
MIXER
CAUTION!: POWER MUST ONLY BEAPPLIED TO THE ATTENUATOR INPUT!DO NOT REVERSE THE INPUT ANDOUTPUT TERMINALS OF THE BIRD 8329.
COMPOSITE NOISE MIXER
RF SIGNALGENERATOR
MARCONI 4031
LOW-NOISEAMPLIFIER
PHASE LOCK SIGNAL
I IF IN
R
IF OUTL
Transmit Composite Noise Graphs
80M
2 4 6 8 10 12 14 16 18 20 22–140
–130
–120
–110
–100
–90
–80
–70
–60
Frequency Sweep: 2 to 22 kHz from Carrier
Reference Level: - 60 dBc/HzVertical Scale: dBc/Hz
20M
2 4 6 8 10 12 14 16 18 20 22–140
–130
–120
–110
–100
–90
–80
–70
–60
Frequency Sweep: 2 to 22 kHz from Carrier
Reference Level: - 60 dBc/HzVertical Scale: dBc/Hz
6M
2 4 6 8 10 12 14 16 18 20 22–140
–130
–120
–110
–100
–90
–80
–70
–60
Frequency Sweep: 2 to 22 kHz from Carrier
Reference Level: - 60 dBc/HzVertical Scale: dBc/Hz
ARRL Laboratory Expanded Test-Result Report Model: ICOM IC-7800 Serial: 0201062 Copyright 2004, American Radio Relay League, Inc. All Rights Reserved.
Page 13

Receiver Noise Floor (Minimum Discernible Signal) Test Description: The noise floor of a receiver is the level of input signal that gives a desired audio output level that is equal to the noise output level. This is sometimes called "minimum discernible signal " (MDS), although a skilled operator can detect a signal up to 10 dB or so below the noise floor. Most modern receivers have a noise floor within a few dB of "perfect." A perfect receiver would hear only the noise of a resistor at room temperature. However, HF receiving systems, the noise of the system usually exceeds that of the receiver. In most cases, external noise is many dB higher than the receiver's internal noise. Making the receiver more sensitive will only allow it to hear more noise. It will also make it more prone to overload. In many cases, especially in the lower HF bands, receiver performance can be improved by sacrificing unneeded sensitivity by placing an attenuator in front of the receiver. The more negative the sensitivity number expressed in dBm, or the smaller the number expressed in voltage, the better the receiver. Key Test Conditions: Source impedance (generator) of 50-ohms. Receiver audio output to be terminated with specified impedance. Receiver is tested using 500 Hz bandwidth, or closest available bandwidth to 500 Hz. Block Diagram:
RF SIGNALGENERATOR
MARCONI 2041
10 dB STEPATTENUATOR
HP 355D
1 dB STEPATTENUATOR
HP 355C
DUTRECEIVER
AUDIO/DISTORTION
METERHP 339A
HI-ZMONITOR AMP
Noise Floor:
Main Receiver (MDS, dBm) Second Receiver (MDS, dBm) Notes Frequency Preamp Off
Preamp One
Preamp Two
Preamp Off
Preamp One
Preamp Two
1.02 MHz –123.2 –129.3 –129.9 – – – 1.82 MHz –124.9 –130.3 –131.1 – – – 3.52 MHz –128.0 –138.0 –141.2 –127.5 –139.2 –143.5 7.02 MHz –128.5 –138.7 –141.7 – – – 10.12 MHz –127.7 –138.7 –142.0 – – – 14.02 MHz –126.6 –137.9 –142.2 –126.7 –139.3 –142.2 18.088 MHz –127.4 –138.5 –142.0 – – – 21.02 MHz –126.4 –138.0 –141.0 – – – 24.91 MHz –126.1 –138.7 –141.6 – – – 28.02 MHz –125.2 –138.6 –142.0 – – – 50.02 MHz –129.2 –139.6 –142.3 –130.1 –140.6 –142.7
Notes:
Receive Frequency Range Test Description: This test measures the tuning range of the receiver. The range expressed is the range over which the receiver can be tuned. Most receivers exhibit some degradation of sensitivity near the limits of their tuning range. In cases where this degradation renders the receiver unusable, we report both the actual and useful tuning range.
ARRL Laboratory Expanded Test-Result Report Model: ICOM IC-7800 Serial: 0201062 Copyright 2004, American Radio Relay League, Inc. All Rights Reserved.
Page 14

Test Results:
Minimum Frequency Maximum Frequency Notes 0.030 MHz 59.999 999 MHz
Notes:
AM Sensitivity Test Description: The purpose of the AM receive Sensitivity Test is to determine the level of an AM signal, 30% modulated at 1 kHz, that results in a tone 10 dB above the noise level (MDS) of the receiver. Two frequencies, 1.020 MHz and 3.800 MHz are used for this test. The more negative the number, expressed in dBm, or the smaller the number expressed in voltage, the better the sensitivity. Test Results:
Frequency Preamp Off Preamp One Preamp Two Notes 1.020 MHz 3.7 µV 1.2 µV 1.0 µV 3.900 MHz 1.9 µV 0.56 µV 0.43 µV 53.0 MHz 2.0 µV 0.63 µV 0.52 µV
Notes: Main receiver only.
FM SINAD Test Description: The purpose of the FM SINAD test is to determine the 12 dB SINAD value. SINAD is an acronym for "SIgnal plus Noise And Distortion" and is a measure of signal quality: SINAD = (Signal + Noise + Distortion) / (Noise + Distortion) Distortion can be considered to be merely another form of noise, (distortion, like noise, is something unwanted added to the signal). Further, for circumstances where the signal is much greater than the noise: SINAD = Signal / Noise For the 12 dB SINAD level in this test, a relatively simple audio distortion meter can be used (by limiting the frequency range). A level of 25% level of distortion is equivalent to 12 dB SINAD: SINAD = 20 log (1/25%) = 20 log 4 = 12 dB Although this is a fairly high ratio of S/N, it is nonetheless considered to be the minimum useful signal level for FM because copy degrades rapidly below this point. SINAD Test Results: Frequency Preamp Off Preamp One Preamp Two Notes 29.0 MHz 0.93 µV 0.23 µV 0.17 µV 52.0 MHz 0.69 µV 0.22 µV 0.18 µV
Notes: Main receiver only.
Antenna Port Isolation Test Description: This test measures the RF isolation between the active (selected) antenna port and the other available antenna ports. This isolation can be important where the unselected port is connected to an antenna that is resonant (or near resonant) on some of the same frequencies as the main antenna. Isolation of 60 dB or better is considered good.
ARRL Laboratory Expanded Test-Result Report Model: ICOM IC-7800 Serial: 0201062 Copyright 2004, American Radio Relay League, Inc. All Rights Reserved.
Page 15

Test Results: Frequency Selected
Port Unselected Port
Isolation (dB)
Notes
14 MHz 1 2 66 1 14 MHz 1 3 68 14 MHz 1 4 72 14 MHz 2 3 69 14 MHz 2 4 73 14 MHz 3 4 71
Notes: 1. Isolation degrades about 20 dB when the second receiver is connected to the antenna port adjacent to the main receiver’s port.
Blocking Dynamic Range Test Description: Dynamic range is a measurement of a receiver's ability to function well on one frequency in the presence of one or more unwanted signals on other frequency. It is essentially a measurement of the difference between a receiver's noise floor and the loudest off-channel signal that can be accommodated without measurable degradation of the receiver's response to a relatively weak signal to which it is tuned. This difference is usually expressed in dB. Thus, a receiver with a dynamic range of 100 dB would be able to tolerate an off-channel signal 100 dB stronger than the receiver's noise floor. The greater the dynamic range, the better the receiver performance. In the case of blocking dynamic range (BDR), the degradation criterion is receiver desense. BDR is the difference, in dB, between the noise floor and an off-channel signal that causes 1 dB of gain compression (desensitization) in the receiver. BDR is calculated by taking the difference between the receiver's noise floor and the level of the undesired off-frequency signal. Key Test Conditions: AGC is normally turned off; the receiver is operated in its linear region. Desired signal set to 10 dB below the 1-dB compression point. The receiver bandwidth is set as close as possible to 500 Hz (see note 1). Block Diagram:
RF SIGNAL GENERATOR
MARCONI 2041
10 dB STEP ATTENUATOR
HP 355D
1 dB STEP ATTENUATOR
HP 355C
DUT
RECEIVER AUDIO/
DISTORTION METER
HP 339A
HI-Z
MONITOR AMP
RF SIGNAL GENERATOR
IFR 2041
2-PORT COUPLER
MCL ZSFC 2-6
ARRL Laboratory Expanded Test-Result Report Model: ICOM IC-7800 Serial: 0201062 Copyright 2004, American Radio Relay League, Inc. All Rights Reserved.
Page 16

Blocking Dynamic Range Test Result:
Main Receiver Second Receiver Band Spacing Preamp Off
Preamp One
Preamp Two
Preamp Off
Preamp One
Preamp Two
Notes
3.52 MHz 20 kHz 139 dB*
139* 135* 140* 138* 135*
3.52 MHz 5 kHz 114 113 107 114 113 109 14.02 MHz 50 kHz >147 – – – – – 1 14.02 MHz 20 kHz 137* 138* 135* 142* 143* 139* 14.02 MHz 5 kHz 115 112 110 114 113 110 14.02 MHz 2 kHz 97* – – – – – 14.02 MHz 1 kHz 96* – – – – – 50.02 MHz 20 kHz 139* 139* 136* – – – 50.02 MHz 5 kHz 111 105 102 – – –
Notes: * Noise-limited at the value indicated. 1. BDR beyond 40 kHz spacing could not be measured without exceeding a level of signal that was unsafe to apply to the receiver’s input.
Two-Tone 3rd-Order IMD Dynamic Range Test Description: Two-tone IMD Dynamic Range (IMD DR) measures the impact of the intermodulation of two strong (undesired) signals within a receiver. IMD is the production of spurious responses resulting from the mixing of two or more undesired signals in a receiver. Two-Tone IMD DR is the difference, in dB, between the noise floor and the strength of two equal off-channel signals that produce a third-order product equal to the noise floor. This test determines the range of signals that can be tolerated by the receiver while producing essentially no undesired spurious responses. To perform the 3rd Order test, two signals of equal amplitude and spaced a given distance (such as 20 kHz) apart, are injected into the input of the receiver. If we call these frequencies f1 and f2, the third-order products will appear at frequencies of (2f1-f2) and (2f2-f1). The greater the dynamic range, expressed in dB, or the higher the intercept point, the better the performance. Key Test Conditions: Sufficient attenuation and isolation must exist between the two signal generators. The two-port coupler must be terminated in a load that exhibits a 20-dB or better return loss at the coupler output. The receiver is set as close as possible to a 500 Hz bandwidth (see note in BDR test results). TT IMD DR Block Diagram:
RF SIGNAL
GENERATOR
MARCONI 2041
10 dB STEP ATTENUATOR
HP 355D
1 dB STEP ATTENUATOR
HP 355C
DUT
RECEIVER AUDIO/
DISTORTION METER
HP 339A
HI-Z
MONITOR AMP
RF SIGNAL GENERATOR
IFR 2041
2-PORT COUPLER
MCL ZSFC 2-6
ARRL Laboratory Expanded Test-Result Report Model: ICOM IC-7800 Serial: 0201062 Copyright 2004, American Radio Relay League, Inc. All Rights Reserved.
Page 17

Two-Tone IMD DR Test Result Summary:
Main Receiver Second Receiver Notes Band Spacing Preamp Off
Preamp One
Preamp Two
Preamp Off
Preamp One
Preamp Two
3.52 MHz 20 kHz 105 dB 104 101 104 104 103 3.52 MHz 5 kHz 88 86 84 85 84 83 14.02 MHz 100 kHz 107 – – – – – 14.02 MHz 50 kHz 106 – – – – – 14.02 MHz 20 kHz 104 103 102 105 105 104 14.02 MHz 5 kHz 89 84 83 84 84 83 14.02 MHz 2 kHz 80* – – – – – 14.02 MHz 1 kHz 67* – – – – – 50.02 MHz 20 kHz 93 90 90 – – – 50.02 MHz 5 kHz 83 82 80 – – –
Notes:
Third-Order Intercept Test Description: Third-order intercept (IP3) is not actually a separate test, but is part of the IMD Dynamic Range test. The third-order response of the receiver can be characterized (ideal) as a straight line with a 3:1 slope. The "on-channel" response of the receiver would be a line with a 1:1 slope. Any two lines of differing slope will have a point at which they intersect. However, the "intercept" of the third-order and on-channel responses is at a level far higher than the strength of signals receivers can normally handle. Thus, it has to be calculated rather than measured. The IP3 calculation can be based on a variety of signal levels. One common level is the noise floor (aka "mds") - however, at this level, noise can cause a non-linear response in the real-world circuits of the receiver. Also, it should be noted that IP3 is generally considered to be a measure of a receiver's strong-signal handling ability, thus it is most appropriate to calculate this with signal levels well above the noise floor. In the ARRL Lab, signal levels of S5 are used for the IP3 calculation. Third-Order Intercept Summary:
Main Receiver Notes Band Spacing Preamp Off Preamp One Preamp Two
3.52 MHz 20 kHz +37 dBm +23 +11 3.52 MHz 5 kHz +19 +8.6 +0.75 14.02 MHz 20 kHz +37 +21 +11 14.02 MHz 5 kHz +22 +7.7 +0.5 50.02 MHz 20 kHz +20 +8.0 +4.6 50.02 MHz 5 kHz +14 +0.5 –4.4
Notes:
Swept Dynamic Range Graphs The following page shows one of the highlights of ARRL test result reports -- swept graphs on receiver two-tone, third-order IMD dynamic range and blocking dynamic range. These graphs are taken using National Instruments LabWindows/CVI automated test software, with a custom program written by the ARRL Laboratory. Dynamic range measures the difference between a receiver's noise floor and the receiver's degradation in the presence of strong signals. In some cases, the receiver's noise performance causes receiver degradation before blocking or a spurious response is seen. In either case, if the noise floor is degraded by 1 dB due to the presence of receiver noise during the test, the dynamic range is said to be noise limited by the level of signal that caused the receiver noise response. A noise-limited condition is indicated in the QST "Product Review" test-result tables. The Laboratory is working on software changes that will show on the test-result graphs which specific frequencies were noise limited. These will be incorporated into future test-result reports.
ARRL Laboratory Expanded Test-Result Report Model: ICOM IC-7800 Serial: 0201062 Copyright 2004, American Radio Relay League, Inc. All Rights Reserved.
Page 18

Being "noise limited" is not necessarily a bad thing. A receiver noise limited at a high level is better than a receiver whose dynamic range is lower than the noise-limited level. In essence, a receiver that is noise limited has a dynamic range that is better than its local-oscillator noise. Most of the best receivers are noise limited at rather high levels. The ARRL Laboratory has traditionally used off-channel signals spaced 20 kHz from the desired signal. This does allow easy comparisons between different receivers. There is nothing magical about the 20-kHz spacing, however. In nearly all receivers, the dynamic range varies with signal spacing, due to the specific design of the receiver. Most receivers have filter combinations that do some coarse filtering at RF and in the first IF, with additional filtering taking place in later IF or AF stages. As the signals get "inside" different filters in the receiver, the dynamic range decreases as the attenuation of the filter is no longer applied to the signal. Interestingly, the different filter shapes can sometimes be seen in the graphs of dynamic range of different receivers. In the case of the ARRL graphs, one can often see that the 20-kHz spacing falls on the slope of the curve. Many manufacturers specify dynamic range at 50 or 100 kHz. The computer is not as skilled (yet) at interpreting noisy readings as a good test engineer, so in some cases there are a few dB difference between the computer-generated data and those in the "Product Review" tables. Our test engineer takes those number manually, carefully measuring levels and interpreting noise and other phenomena that can effect the test data. (We are still taking the two-tone IMD data manually.) The graphs that follow show swept blocking and two-tone dynamic range. In the blocking test, the receiver is tuned to a signal on 14.020 MHz, the center of the graph. The X axis is the frequency (MHz) of the undesired, off-channel signal. In the two-tone test, the receiver is tuned to a signal on 14.020 MHz, the center of the graph. The X axis is the frequency of the closer of the two tones that are creating intermodulation.
Swept Blocking Dynamic Range, Main Receiver Blocking Dynamic Range, Preamp Off
13.970 13.990 14.010 14.030 14.050 14.07050.0
60.0
70.0
80.0
90.0
100.0
110.0
120.0
130.0
140.0
150.0
BDR dB
Receiver Frequency = 14.02 MHz
Note: In previous expanded reports, the swept graphs were taken with the preamp on, except in the case where a transceiver did not have a preamp (such as the Ten-Tec Omni VI+). This precedent was set with the first expanded reports in 1996. In hindsight, testing all transceivers with the preamp off would have been the more logical choice. For this report, test data is shown for preamp off. Typically, these graphs are presented for offset ranges of +/- 200 kHz and +/- 50 kHz. However, in the IC-7800, BDR testing at offsets greater than about 50 kHz would have required a level that was unsafe to use on the receiver input, so data is presented for +/- 50 kHz only.
ARRL Laboratory Expanded Test-Result Report Model: ICOM IC-7800 Serial: 0201062 Copyright 2004, American Radio Relay League, Inc. All Rights Reserved.
Page 19

Swept Two-Tone, Third-Order IMD Dynamic Range, Main Rx IMD Dynamic Range, Preamp Off
13.820 13.920 14.020 14.120 14.22050.0
60.0
70.0
80.0
90.0
100.0
110.0
120.0
130.0
140.0
150.0
IMD DR dB
Receiver Frequency = 14.02 MHz
13.970 13.990 14.010 14.030 14.050 14.07050.0
60.0
70.0
80.0
90.0
100.0
110.0
120.0
130.0
140.0
150.0
IMD DR dB
Receiver Frequency = 14.02 MHz
Second-Order Intercept Test Description: This test measures the amount of 2nd-order mixing that takes place in the receiver and calculates an intercept of the second order response with the on-channel response. Signals at 6 and 8 MHz are presented to the receiver and the resultant output at 14 MHz is measured. Test Results:
Frequency Preamplifier Mode IP2 (dBm) Notes 14.02 MHz Off CW +98 14.02 MHz One CW +87 14.02 MHz Two CW +84
ARRL Laboratory Expanded Test-Result Report Model: ICOM IC-7800 Serial: 0201062 Copyright 2004, American Radio Relay League, Inc. All Rights Reserved.
Page 20

Receiver Phase Noise Test Description: This test measures the phase noise of the receiver's local oscillator. This noise is a large part of the transmitted composite noise, so the test is not normally performed on transceivers.
Receiver Phase Noise, dBc/Hz at 14.025 MHz (Horizontal axis is the freq. offset in kHz)
0 2 4 6 8 10 12 14 16 18 20 22 24 26 28 30–160.0
–150.0
–140.0
–130.0
–120.0
–110.0
–100.0
–90.0
–80.0
Freq Offset kHz
dBc/Hz
Note: Phase noise at larger frequency offset was too low to measure with the Lab’s –10 dBm output crystal oscillator.
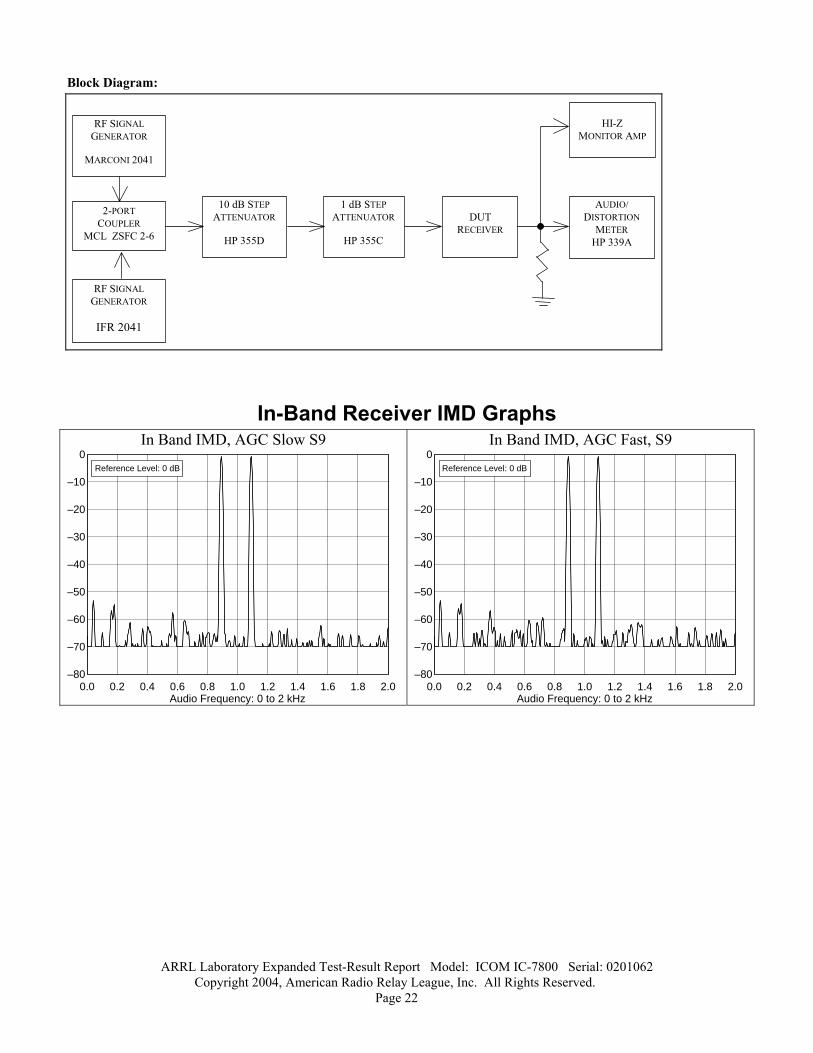
In-Band Receiver IMD Test Description: This test measures the intermodulation that occurs between two signals that are simultaneously present in the passband of a receiver. Two signals, at levels of 50 µV (nominally S9), spaced 100 Hz are used. The receiver AGC is set to FAST. The receiver is tuned so the two signals appear at 900 Hz and 1100 Hz in the receiver audio. The output of the receiver is viewed on a spectrum analyzer and the 3rd- and 5th order products are measured directly from the screen. The smaller the products as seen on the graph, the better the receiver. Generally, products that are less than 30 dB below the desired tones will not be cause objectionable receiver intermodulation distortion. Key Test Conditions: S9, and S9 +40 dB or S9 +60 dB signals Receiver set to SSB normal mode, nominal 2 - 3 kHz bandwidth
ARRL Laboratory Expanded Test-Result Report Model: ICOM IC-7800 Serial: 0201062 Copyright 2004, American Radio Relay League, Inc. All Rights Reserved.
Page 21
ARRL Laboratory Expanded Test-Result Report Model: ICOM IC-7800 Serial: 0201062 Copyright 2004, American Radio Relay League, Inc. All Rights Reserved.
Page 22
Block Diagram:
RF SIGNAL
GENERATOR
MARCONI 2041
10 dB STEP ATTENUATOR
HP 355D
1 dB STEP ATTENUATOR
HP 355C
DUT
RECEIVER AUDIO/
DISTORTION METER
HP 339A
HI-Z
MONITOR AMP
RF SIGNAL GENERATOR
IFR 2041
2-PORT COUPLER
MCL ZSFC 2-6
In-Band Receiver IMD Graphs In Band IMD, AGC Slow S9
0.0 0.2 0.4 0.6 0.8 1.0 1.2 1.4 1.6 1.8 2.0–80
–70
–60
–50
–40
–30
–20
–10
0
Audio Frequency: 0 to 2 kHz
Reference Level: 0 dB
In Band IMD, AGC Fast, S9
0.0 0.2 0.4 0.6 0.8 1.0 1.2 1.4 1.6 1.8 2.0–80
–70
–60
–50
–40
–30
–20
–10
0
Audio Frequency: 0 to 2 kHz
Reference Level: 0 dB

In Band IMD, AGC Slow S9+60
0.0 0.2 0.4 0.6 0.8 1.0 1.2 1.4 1.6 1.8 2.0–80
–70
–60
–50
–40
–30
–20
–10
0
Audio Frequency: 0 to 2 kHz
Reference Level: 0 dB
In Band IMD, AGC Fast, S9+60
0.0 0.2 0.4 0.6 0.8 1.0 1.2 1.4 1.6 1.8 2.0–80
–70
–60
–50
–40
–30
–20
–10
0
Audio Frequency: 0 to 2 kHz
Reference Level: 0 dB
FM Adjacent Channel Selectivity Test Description: The purpose of the FM Adjacent Channel Selectivity Test is to measure the ability of the device under test receiver to reject interference from individual undesired signals while receiving various levels of desired signal. The desired carrier signal will be at 29.000 MHz, modulated at 1000 Hz, and the offending signal will be located at adjacent nearby frequencies with 400 Hz modulation. The greater the number in dB, the better the rejection. Test Results:
Frequency Preamplifier Frequency Spacing Adjacent-channel rejection
Notes
29.0 MHz On 20 kHz 81 dB 52.0 MHz On 20 kHz 78 dB
FM Two-Tone 3rd-Order Dynamic Range Test Description: The purpose of the FM Two-Tone 3rd Order Dynamic Range Test is to determine the range of signals that can be tolerated by the device under testing the FM mode while producing no spurious responses greater than the 12-dB SINAD level. To perform this test, two signals, f1 and f2, of equal amplitude and spaced 20 kHz apart, are injected into the input of the receiver. The signal located 40 kHz from the distortion product being measured is modulated at 1,000 Hz with a deviation of 3 kHz. The receiver is tuned to the Third Order IMD frequencies as determined by (2f1-f2) and (2f2-f1). The input signals are then raised simultaneously by equal amounts until 25 % distortion, or the 12 dB SINAD point, is obtained. Frequencies 10 MHz outside the amateur band are used to test the wide-band dynamic range. The greater the dynamic range, the better the receiver performance. Test Results:
Frequency Preamplifier Frequency Spacing Dynamic Range Notes 29 MHz On 20 kHz 66 dB 52 MHz On 20 kHz 65 dB 52 MHz On 10 MHz 103 dB
Notes:
ARRL Laboratory Expanded Test-Result Report Model: ICOM IC-7800 Serial: 0201062 Copyright 2004, American Radio Relay League, Inc. All Rights Reserved.
Page 23

IF and Image Rejection Test Description: This test measures the amount of first IF and image rejection for superhetrodyne receivers by determining the level of signal input to the receiver at the first IF (or image frequencies) that will produce an audio output equal to the MDS level. The test is conducted with the receiver in the CW mode using the 500 Hz, or closest available, IF filters. Any audio filtering is disabled and AGC is turned OFF, if possible. The greater the number in dB, the better the image rejection. Test Results:
Frequency Preamplifier Mode First IF Rejection Image Rejection
Notes
3.520 MHz Off CW 120 dB 122 dB 14.02 MHz Off CW 118 dB 121 dB 50.2 MHz Off CW 111 dB 80 dB
Notes:
Audio Output Power Test Description: This test measures the audio power delivered by the receiver. The manufacturer's specification for load and distortion are used. For units not specified, an 8-ohm load and 10% harmonic distortion are used. Test Results:
Specified Distortion Specified Load Impedance
Audio Output Power
Notes
10% THD 8 ohms 2.7 W Notes:
Audio Hiss Test Description: This test measures the audio output power at minimum volume with no signal. It gives an indication of the noise (often referred to as "hiss") generated by the audio stages of the receiver. Test Results:
Specified Load Impedance
Hiss Level Notes
8 ohms 0.7 mV (ac)
IF and Audio Frequency Response Test Description: The purpose of the IF + Audio Frequency Response Test is to measure the audio frequencies at which the receiver audio drops 6 dB from the peak signal response. The frequency-response bandwidth is then calculated by taking the difference between the lower and upper frequency. Test Results:
Mode Nominal Bandwidth
Low Freq (Hz)
High Freq (Hz)
Difference (bandwidth)
Notes
CW 500 Hz 306 883 567 1 USB 2.7 kHz 82 2883 2801 LSB 2.7 kHz 83 2885 2801 AM 3.0 kHz 134 3110 2976
Notes: 1. High and low audio frequencies on CW vary with the offset control.
ARRL Laboratory Expanded Test-Result Report Model: ICOM IC-7800 Serial: 0201062 Copyright 2004, American Radio Relay League, Inc. All Rights Reserved.
Page 24

Squelch Sensitivity Test Description: The purpose of the Squelch Sensitivity Test is to determine the level of the input signal required to break the receiver's squelch at the threshold. This number is not usually critical. A result anywhere between 0.05 and 0.5 µV is usually useful. Test Results:
Frequency Preamplifier Mode Threshold Notes 29.0 MHz On FM 0.07 µV 52.0 MHz On FM 0.08 µV 14.2 MHz On SSB 0.68 µV
Notes:
S-Meter Sensitivity Test Description: The purpose of the S-Meter Test is to determine the level of RF input signal required to produce an S9 indication on the receiver S meter. This test is performed with the receiver in the SSB mode at a frequency of 14.200 MHz. A traditional S9 signal is a level of 50 µV (an old Collins receiver standard). Test Results:
Frequency Preamplifier S Units µV/dBm Notes 14.2 MHz Off S9 58 µV SSB mode 14.2 MHz One S9 16 µV 14.2 MHz Two S9 7.2 µV 14.2 MHz Off S1 –89 dBm CW mode 14.2 MHz Off S2 –87 dBm 14.2 MHz Off S3 –85 dBm 14.2 MHz Off S4 –82 dBm 14.2 MHz Off S5 –80 dBm 14.2 MHz Off S6 –78 dBm 14.2 MHz Off S7 –75 dBm 14.02 MHz Off S8 –72 dBm 14.2 MHz Off S9 –69 dBm
Notch Filter Depth Test Description: The purpose of the Notch Filter Test is to measure the depth of the notch filter (both manual and automatic notches, where available) and to measure the attack time (how quickly a carrier is notched) for automatic notch filters. This test is performed in SSB mode, at a frequency of 14.200 MHz. Notch Depth: > 70 dB Notch Attack Time: 36 ms (approx).
ARRL Laboratory Expanded Test-Result Report Model: ICOM IC-7800 Serial: 0201062 Copyright 2004, American Radio Relay League, Inc. All Rights Reserved.
Page 25