arrl laboratory expanded test-result report icom …jpk5lad/k5lad...
TRANSCRIPT

ARRL Laboratory Expanded Test-Result Report Model: ICOM IC-756 Pro Serial: 01313Copyright 2000, American Radio Relay League, Inc. All Rights Reserved. - Page 1
ARRL LaboratoryExpanded Test-Result ReportICOM IC-756 ProPrepared by:American Radio Relay League, Inc.Technical Department Laboratory225 Main St.Newington, CT 06111Telephone: (860) 594-0210Web Site: http://www.arrl.org/Internet email: [email protected]
Order From:American Radio Relay League, Inc.Technical Department Secretary225 Main St.Newington, CT 06111Telephone: (860) 594-0278Internet email: [email protected]
Price:$7.50 for ARRL Members, $12.50 for non-Members, postpaid.
Model Information:Model: IC-756 Pro Serial #: 01313QST "Product Review": June 2000
Manufacturer:
ICOM America, Inc2380 116th Ave NEPO Box C-90029Bellevue, WA 98004USA
Phone: 425-454-8155425-450-6088 (literature)800-858-6252Fax: 425-454-1509Web Site: http://www.icomamerica.com/

ARRL Laboratory Expanded Test-Result Report Model: ICOM IC-756 Pro Serial: 01313Copyright 2000, American Radio Relay League, Inc. All Rights Reserved. - Page 2
Contents:
Section Page
Introduction 3Transmitter Output Power 4Transverter Jack Output Power Test 4Current Consumption Test 5Transmit Frequency Range Test 5CW Transmit Frequency Accuracy Test 6Spectral Purity Test 6Transmit Two-Tone IMD Test 8SSB Carrier and Unwanted Sideband Suppression Test 10CW Keying Waveform Test 10Transmit Keyer Speed Test 12Transmit/Receive Turnaround Test 12Transmit Delay Test 12Transmit Composite Noise Test 13Receiver Noise Floor Test 14Receive Frequency Range 14AM Sensitivity Test 15FM SINAD Test 15Blocking Dynamic Range Test 16Two-Tone 3rd-Order Dynamic Range Test 17Second-Order IMD Test 18In-Band Receiver IMD Test 18FM Adjacent Channel Selectivity Test 19FM Two-Tone 3rd-Order Dynamic Range Test 20Image Rejection Test 20IF Rejection Test 20Audio Output Power Test 21IF + Audio Frequency Response Test 21Squelch Sensitivity Test 21S-Meter Test 22Notch Filter Test 22Noise Reduction Test 22Receiver Passband Response 23
ARRL Laboratory Expanded Test-Result Report Model: ICOM IC-756 Pro Serial: 01313Copyright 2000, American Radio Relay League, Inc. All Rights Reserved. - Page 3
Introduction
This document summarizes the tests performed by the ARRL Laboratory for each unit that is featured in QST"Product Review." The ARRL Laboratory has a separate document, the ARRL Laboratory Test Procedures Manual,that explains our specific test methods in detail including a complete test description, a block diagram showing thespecific equipment currently in use for each test, all equipment settings and the specific step by step procedure used.While this is not available as a regular ARRL publication, it can be downloaded from our Member's Only web page.The ARRL Technical Department Secretary can also mail out a copy at a cost of $20.00 for ARRL Members, $25.00for non-Members, postpaid.
Most of the tests used in ARRL product testing are derived from recognized standards and test methods. Other testshave been developed by the ARRL Lab. The ARRL test equipment is calibrated annually, with traceability toNational Institute of Standards and Technology (NIST) standards.
The units being tested are operated as specified by the manufacturer. Equipment that is intended for mobile andhand-held use is also tested for function, output power and frequency accuracy at the minimum specified voltage, aswell as at the extremes of their rated temperature range.
NOTE: ARRL "Product Review" testing usually represents a sample of only one unit and is not necessarilyrepresentative of all units of the same model number. Often, some parameters will vary significantly from unit tounit. The ARRL Laboratory and Product Review editor work with manufacturers to resolve any problemsencountered in the review process and these problems are documented in the Product Review.
Related ARRL Publications and Products:The 2000 ARRL Handbook for Radio Amateurs has a chapter on test equipment and measurements. The book isavailable for $32.00 plus $6 shipping and handling. The Handbook is also now available in a convenient, easy to useCD-ROM format. You can order both versions of the Handbook from our web page at http://www.arrl.org/, orcontact the ARRL Publications Sales Department at 888-277-5289 (toll free). It is also widely stocked by radio andelectronic dealers and a few large bookstores. The ARRL Technical Information Service has prepared an informationpackage that discusses Product Review testing and the features of various types of equipment. Request the “What isthe Best Rig To Buy” package from the ARRL Technical Department Secretary. The cost is $2.00 for ARRLMembers, $4.00 for non-Members, postpaid.
Many QST “Product Reviews” have been reprinted in three ARRL publications: The ARRL Radio BuyersSourcebook (order #3452) covers selected Product Reviews from 1970 to 1990. The cost is $15.00 plus $4.00shipping and handling. The ARRL Radio Buyers Sourcebook Volume II (order #4211) contains reprints of all of theProduct Reviews from 1991 and 1992. The cost is $15.00 plus $4.00 shipping and handling. The VHF/UHF RadioBuyer’s Sourcebook (order #6184) contains nearly 100 reviews of transceivers, antennas, amplifiers and accessoriesfor VHF and above.

ARRL Laboratory Expanded Test-Result Report Model: ICOM IC-756 Pro Serial: 01313Copyright 2000, American Radio Relay League, Inc. All Rights Reserved. - Page 4
Transmitter Output Power
Test description: The ARRL Lab measures the CW output power for every band on which a transmitter can operate.The unit is tested across the entire amateur band and the worst-case number for each band is reported. Theequipment is also tested on any mode of operation for which the transmitter is capable. Typically, the most popularband of operation for each mode is selected. This test also compares the accuracy of the unit's internal output-powermetering against the ARRL Laboratory's calibrated test equipment. A two-tone audio input, at a level within themanufacturer's microphone-input specifications, is used for the SSB mode. No modulation is used in the AM and FMmodes.
Note that most transmitters are de-rated from maximum output power on full-carrier AM and FM modes. Typically,a 100-watt CW/SSB transmitter may be rated at 25 watts carrier power on AM. The radio may actually deliver 100watts PEP in AM or FM, but is not specified to deliver full power for continuous duty.
In almost all cases, the linearity of a transmitter decreases as output power increases. A transmitter rated at 100 wattsPEP on single sideband may actually be able to deliver more power, but as the power is increased beyond the ratedRF output power, adjacent channel splatter (IMD) usually increases dramatically. SSB transmitter testing is typicallyperformed at the transmitter's rated PEP SSB output.
Transmitter Output Power Test Results:Frequency Mode Unit's Meter
MinimumPower (W)
MeasuredMinimumPower (W)
Unit 's MeterMaximumPower (W)
MeasuredMaximumPower (W)
Notes(99)
1.8 MHz CW N/A 0.6W 100 W 101.8W3.5 MHz CW N/A 0.7W 100 W 107.0W3.5 MHz AM N/A <1W 37 (approx.) 37.1W7 MHz CW N/A 0.7W 100 W 110.1W10.1 MHz CW N/A 0.7W 100 W 110.8W14 MHz CW N/A 0.8W 100 W 111.3W14 MHz USB N/A 0.9W 100 W 109.8W18 MHz CW N/A 1.1W 100 W 112.0W21 MHz CW N/A 1.1W 100 W 112.6W24 MHz CW N/A 1.1W 100 W 112.4W28 MHz CW N/A 1.1W 100 W 111.8W28 MHz FM N/A 1.1W 100 W 112.2W50 MHz CW N/A 0.9W 100W 108.2W50 MHz FM N/A 0.6W 100W 107.5W50 MHz SSB N/A 0.8W 100W 106.4W50 MHz AM N/A N/A 38 (approx.) 38.0W
Transverter Jack Output Power Test
Test Description: This test measures the output power from the transverter jack (if applicable). This is usuallysomewhere near 0 dBm. The transverter-jack power usually varies from band to band. The 28-MHz band is themost common band for transverter operation. Most transverter outputs are between –10 dBm and +10 dBm.
Test Results:Frequency(MHz)
Output(dBm)
Notes
20 M –15.9 dBm15 M –14.4 dBm10 M –15.3 dBm6 M –16.8 dBm
ARRL Laboratory Expanded Test-Result Report Model: ICOM IC-756 Pro Serial: 01313Copyright 2000, American Radio Relay League, Inc. All Rights Reserved. - Page 5
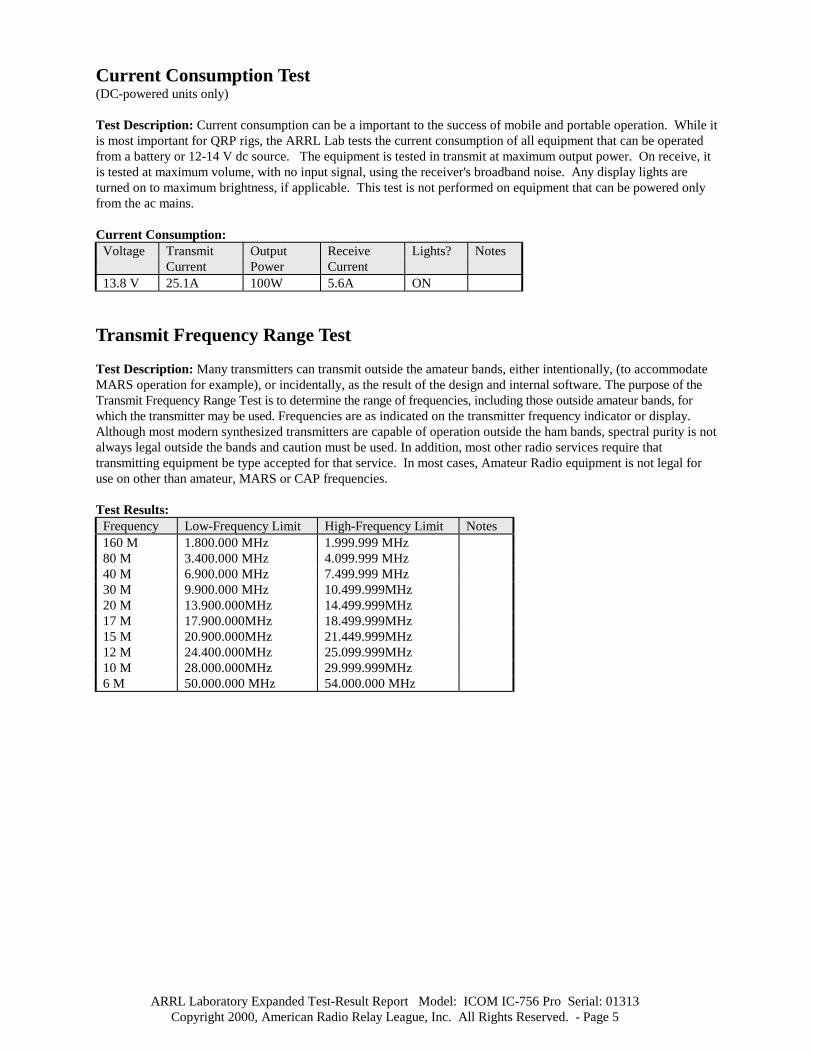
Current Consumption Test(DC-powered units only)
Test Description: Current consumption can be a important to the success of mobile and portable operation. While itis most important for QRP rigs, the ARRL Lab tests the current consumption of all equipment that can be operatedfrom a battery or 12-14 V dc source. The equipment is tested in transmit at maximum output power. On receive, itis tested at maximum volume, with no input signal, using the receiver's broadband noise. Any display lights areturned on to maximum brightness, if applicable. This test is not performed on equipment that can be powered onlyfrom the ac mains.
Current Consumption:Voltage Transmit
CurrentOutputPower
ReceiveCurrent
Lights? Notes
13.8 V 25.1A 100W 5.6A ON
Transmit Frequency Range Test
Test Description: Many transmitters can transmit outside the amateur bands, either intentionally, (to accommodateMARS operation for example), or incidentally, as the result of the design and internal software. The purpose of theTransmit Frequency Range Test is to determine the range of frequencies, including those outside amateur bands, forwhich the transmitter may be used. Frequencies are as indicated on the transmitter frequency indicator or display.Although most modern synthesized transmitters are capable of operation outside the ham bands, spectral purity is notalways legal outside the bands and caution must be used. In addition, most other radio services require thattransmitting equipment be type accepted for that service. In most cases, Amateur Radio equipment is not legal foruse on other than amateur, MARS or CAP frequencies.
Test Results:Frequency Low-Frequency Limit High-Frequency Limit Notes160 M 1.800.000 MHz 1.999.999 MHz80 M 3.400.000 MHz 4.099.999 MHz40 M 6.900.000 MHz 7.499.999 MHz30 M 9.900.000 MHz 10.499.999MHz20 M 13.900.000MHz 14.499.999MHz17 M 17.900.000MHz 18.499.999MHz15 M 20.900.000MHz 21.449.999MHz12 M 24.400.000MHz 25.099.999MHz10 M 28.000.000MHz 29.999.999MHz6 M 50.000.000 MHz 54.000.000 MHz

ARRL Laboratory Expanded Test-Result Report Model: ICOM IC-756 Pro Serial: 01313Copyright 2000, American Radio Relay League, Inc. All Rights Reserved. - Page 6
CW Transmit Frequency Accuracy Test
Test Description: Most modern amateur equipment is surprisingly accurate in frequency. It is not uncommon tofind equipment operating within a few Hz of the frequency indicated on the frequency display. However, some units,notably "analog" units, not using a phase-lock loop in the VFO design, can be off by a considerable amount. Thistest measures the output frequency with the unit operated into a 50-ohm resistive load at nominal temperature andsupply voltage. Frequency is also measured at minimum output power, low supply voltage and over the operatingtemperature range for mobile and portable units. Non-portable equipment is not tested over temperature.
Test Results:Unit Frequency Supply
VoltageTemperature Measured Frequency
Full Output PowerNotes
14.000.000MHz 13.8 V 25 C 14.000.015 MHz50.000.000 MHz 13.8 V 25 C 50.000.056 MHz
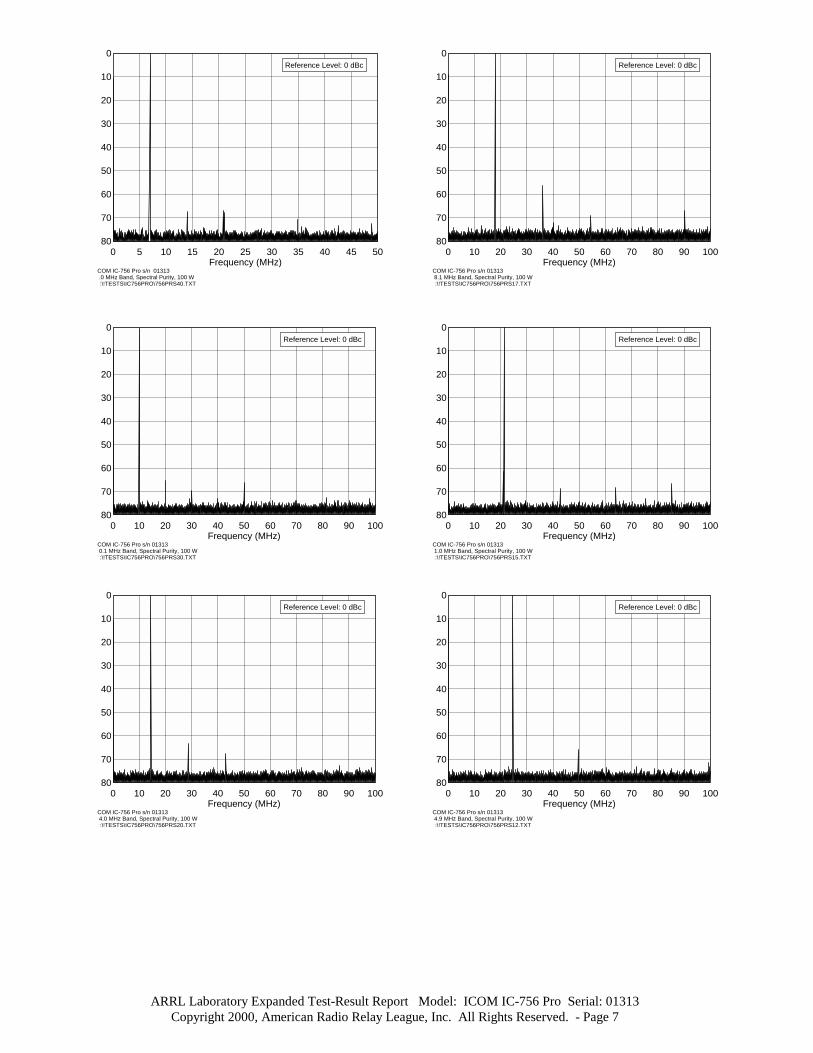
Spectral Purity Test
Test Description: All transmitters emit some signals outside their assigned frequency or frequency range. Thesesignals are generally known as spurious emissions or "spurs." Part 97 of the FCC rules and regulations specify theamount of spurious emissions that can be emitted by a transmitter operating in the Amateur Radio Service. TheARRL Laboratory uses a spectrum analyzer to measure the worst-case spurious emission on each band on which thetransmitter can operate. Spectral purity is reported in dBc, meaning dB relative to the transmitted carrier.
The graphs and tables indicate the relative level of any spurious emissions from the transmitter. The lower that level,expressed in dB relative to the output carrier, the better the transmitter is. So a transmitter whose spurious emissionsare –60 dBc is spectrally cleaner than is one whose spurious emissions are –30 dBc.
Spectral Purity Graphs
COM IC-756 Pro s/n 01313.8 MHz Band, Spectral Purity, 100 W:\!TESTS\IC756PRO\756PRSLO.TXT
0 5 10 15 20 25 30 35 40 45 5080
70
60
50
40
30
20
10
0
Frequency (MHz)
Reference Level: 0 dBc
COM IC-756 Pro s/n 01313.5 MHz Band, Spectral Purity, 100 W:\!TESTS\IC756PRO\756PRS80.TXT
0 5 10 15 20 25 30 35 40 45 5080
70
60
50
40
30
20
10
0
Frequency (MHz)
Reference Level: 0 dBc
ARRL Laboratory Expanded Test-Result Report Model: ICOM IC-756 Pro Serial: 01313Copyright 2000, American Radio Relay League, Inc. All Rights Reserved. - Page 7
COM IC-756 Pro s/n 01313.0 MHz Band, Spectral Purity, 100 W:\!TESTS\IC756PRO\756PRS40.TXT
0 5 10 15 20 25 30 35 40 45 5080
70
60
50
40
30
20
10
0
Frequency (MHz)
Reference Level: 0 dBc
COM IC-756 Pro s/n 013130.1 MHz Band, Spectral Purity, 100 W:\!TESTS\IC756PRO\756PRS30.TXT
0 10 20 30 40 50 60 70 80 90 10080
70
60
50
40
30
20
10
0
Frequency (MHz)
Reference Level: 0 dBc
COM IC-756 Pro s/n 013134.0 MHz Band, Spectral Purity, 100 W:\!TESTS\IC756PRO\756PRS20.TXT
0 10 20 30 40 50 60 70 80 90 10080
70
60
50
40
30
20
10
0
Frequency (MHz)
Reference Level: 0 dBc
COM IC-756 Pro s/n 013138.1 MHz Band, Spectral Purity, 100 W:\!TESTS\IC756PRO\756PRS17.TXT
0 10 20 30 40 50 60 70 80 90 10080
70
60
50
40
30
20
10
0
Frequency (MHz)
Reference Level: 0 dBc
COM IC-756 Pro s/n 013131.0 MHz Band, Spectral Purity, 100 W:\!TESTS\IC756PRO\756PRS15.TXT
0 10 20 30 40 50 60 70 80 90 10080
70
60
50
40
30
20
10
0
Frequency (MHz)
Reference Level: 0 dBc
COM IC-756 Pro s/n 013134.9 MHz Band, Spectral Purity, 100 W:\!TESTS\IC756PRO\756PRS12.TXT
0 10 20 30 40 50 60 70 80 90 10080
70
60
50
40
30
20
10
0
Frequency (MHz)
Reference Level: 0 dBc

ARRL Laboratory Expanded Test-Result Report Model: ICOM IC-756 Pro Serial: 01313Copyright 2000, American Radio Relay League, Inc. All Rights Reserved. - Page 8
COM IC-756 Pro s/n 013138.0 MHz Band, Spectral Purity, 100 W:\!TESTS\IC756PRO\756PRS10.TXT
0 20 40 60 80 100 120 140 160 180 20080
70
60
50
40
30
20
10
0
Frequency (MHz)
Reference Level: 0 dBc
COM IC-756 Pro s/n 013130.0 MHz Band, Spectral Purity, 100 W:\!TESTS\IC756PRO\756PRS6M.TXT
0 50 100 150 200 250 300 350 400 450 50080
70
60
50
40
30
20
10
0
Frequency (MHz)
Reference Level: 0 dBc
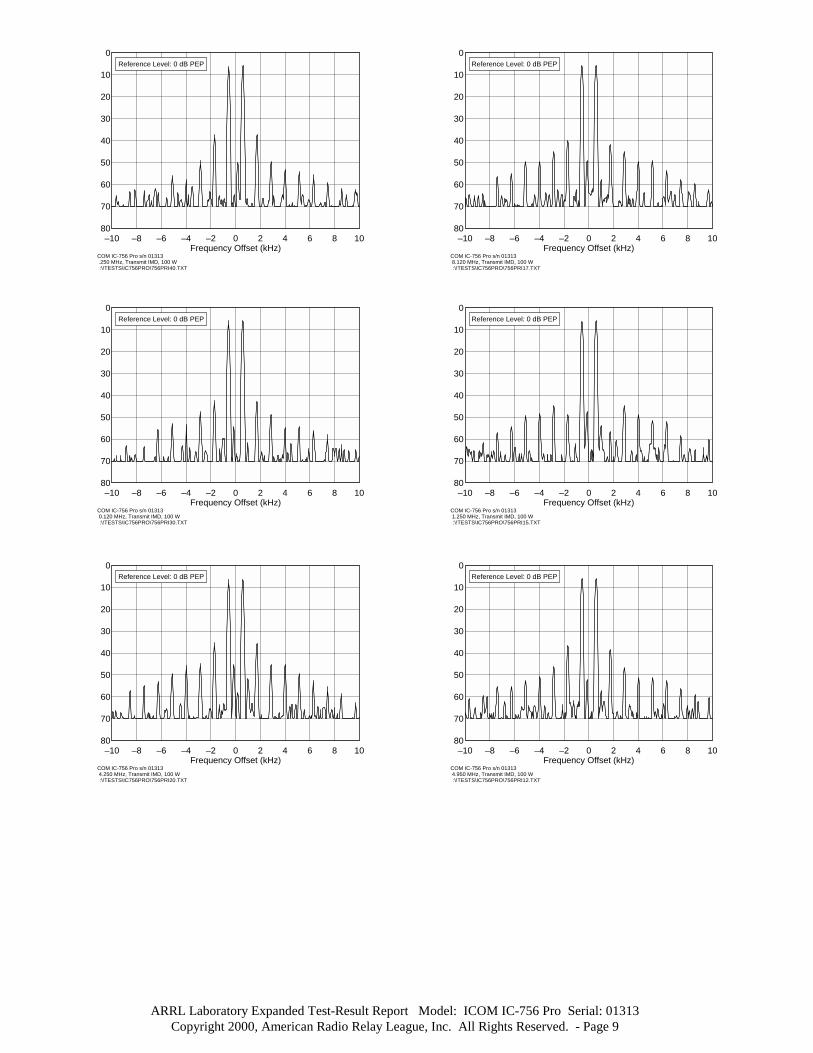
Transmit Two-Tone IMD Test
Test Description: Investigating the sidebands from a modulated transmitter requires a narrow-band spectrumanalysis. In this test, a two-tone test signal is used to modulate the transmitter. The display shows the two test tonesplus some of the IMD products produced by the SSB transmitter. In the ARRL Lab, a test signal with frequencies of700 and 1900 Hz is used to modulate the transmitter. These frequencies were selected to be within the audiopassband of the typical transmitter, resulting in a meaningful display of transmitter IMD. The intermodulationproducts appear on the spectral plot above and below the two tones. The lower the intermodulation products are, thebetter the transmitter is. In general, it is the products that are farthest removed from the two tones (typically > 3 kHzaway) that cause the most problems. These can cause splatter up and down the band from strong signals.
Transmit IMD Graphs
COM IC-756 Pro s/n 01313.850 MHz, Transmit IMD, 100 W:\!TESTS\IC756PRO\756PRILO.TXT
–10 –8 –6 –4 –2 0 2 4 6 8 1080
70
60
50
40
30
20
10
0
Frequency Offset (kHz)
Reference Level: 0 dB PEP
COM IC-756 Pro s/n 01313.900 MHz, Transmit IMD, 100 W:\!TESTS\IC756PRO\756PRI80.TXT
–10 –8 –6 –4 –2 0 2 4 6 8 1080
70
60
50
40
30
20
10
0
Frequency Offset (kHz)
Reference Level: 0 dB PEP
ARRL Laboratory Expanded Test-Result Report Model: ICOM IC-756 Pro Serial: 01313Copyright 2000, American Radio Relay League, Inc. All Rights Reserved. - Page 9
COM IC-756 Pro s/n 01313.250 MHz, Transmit IMD, 100 W:\!TESTS\IC756PRO\756PRI40.TXT
–10 –8 –6 –4 –2 0 2 4 6 8 1080
70
60
50
40
30
20
10
0
Frequency Offset (kHz)
Reference Level: 0 dB PEP
COM IC-756 Pro s/n 013130.120 MHz, Transmit IMD, 100 W:\!TESTS\IC756PRO\756PRI30.TXT
–10 –8 –6 –4 –2 0 2 4 6 8 1080
70
60
50
40
30
20
10
0
Frequency Offset (kHz)
Reference Level: 0 dB PEP
COM IC-756 Pro s/n 013134.250 MHz, Transmit IMD, 100 W:\!TESTS\IC756PRO\756PRI20.TXT
–10 –8 –6 –4 –2 0 2 4 6 8 1080
70
60
50
40
30
20
10
0
Frequency Offset (kHz)
Reference Level: 0 dB PEP
COM IC-756 Pro s/n 013138.120 MHz, Transmit IMD, 100 W:\!TESTS\IC756PRO\756PRI17.TXT
–10 –8 –6 –4 –2 0 2 4 6 8 1080
70
60
50
40
30
20
10
0
Frequency Offset (kHz)
Reference Level: 0 dB PEP
COM IC-756 Pro s/n 013131.250 MHz, Transmit IMD, 100 W:\!TESTS\IC756PRO\756PRI15.TXT
–10 –8 –6 –4 –2 0 2 4 6 8 1080
70
60
50
40
30
20
10
0
Frequency Offset (kHz)
Reference Level: 0 dB PEP
COM IC-756 Pro s/n 013134.950 MHz, Transmit IMD, 100 W:\!TESTS\IC756PRO\756PRI12.TXT
–10 –8 –6 –4 –2 0 2 4 6 8 1080
70
60
50
40
30
20
10
0
Frequency Offset (kHz)
Reference Level: 0 dB PEP

ARRL Laboratory Expanded Test-Result Report Model: ICOM IC-756 Pro Serial: 01313Copyright 2000, American Radio Relay League, Inc. All Rights Reserved. - Page 10
COM IC-756 Pro s/n 013138.350 MHz, Transmit IMD, 100 W:\!TESTS\IC756PRO\756PRI10.TXT
–10 –8 –6 –4 –2 0 2 4 6 8 1080
70
60
50
40
30
20
10
0
Frequency Offset (kHz)
Reference Level: 0 dB PEP
COM IC-756 Pro s/n 013130.200 MHz, Transmit IMD, 100 W:\!TESTS\IC756PRO\756PRI6M.TXT
–10 –8 –6 –4 –2 0 2 4 6 8 1080
70
60
50
40
30
20
10
0
Frequency Offset (kHz)
Reference Level: 0 dB PEP
SSB Carrier and Unwanted Sideband Suppression Test
Test Description: The purpose of the SSB Carrier and opposite-sideband Suppression test is to determine the level ofunwanted carrier and unwanted sideband relative to Peak Envelope Power (PEP). The transmitter output is observedon the spectrum analyzer and the unwanted components are compared to the desired sideband. The greater the amountof suppression, the better the transmitter. For example, opposite sideband suppression of 60 dB is better thansuppression of 50 dB.
Test Results:Frequency/Mode
Carrier Suppression(dB)
Opposite SidebandSuppression (dB)
Notes
14.2 MHz USB 64 dB PEP > 65 dB PEP14.2 MHz LSB 60 dB PEP > 65 dB PEP50.2 MHz USB 62 dB PEP > 65 dB PEP50.2 MHz LSB > 65 dB PEP > 65 dB PEP
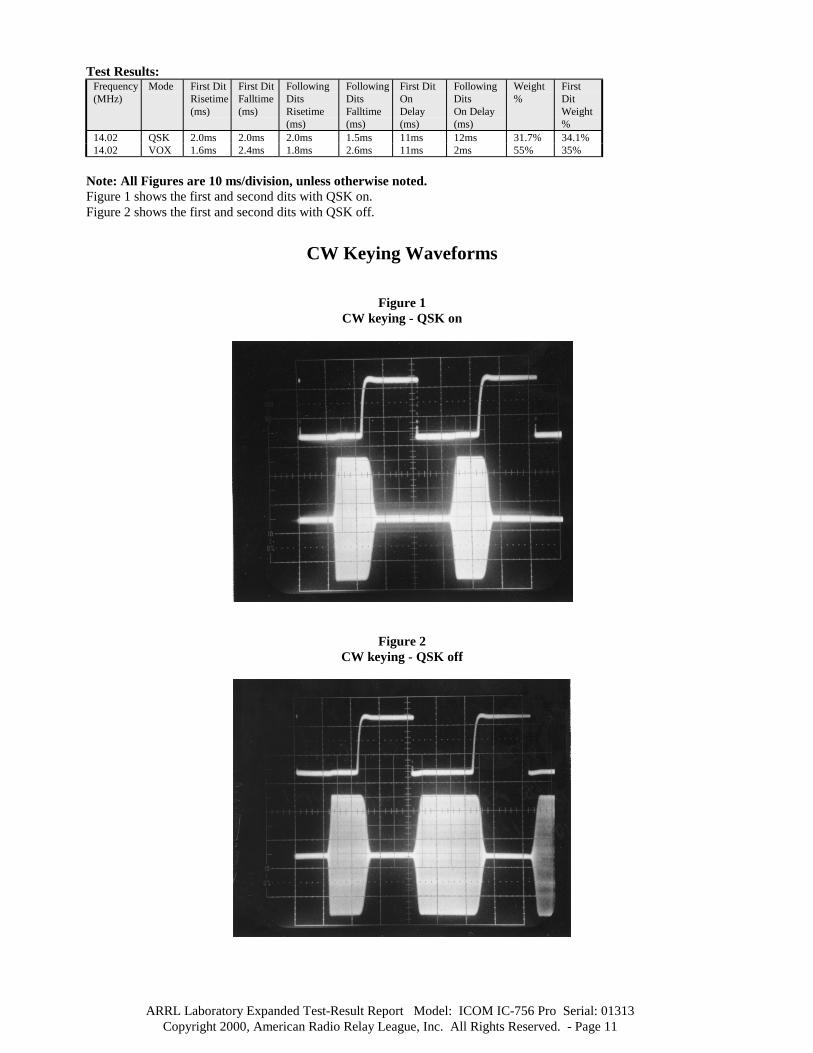
CW Keying Waveform Test
Test Description: The purpose of the CW Keying Waveform Test is to determine the rise and fall times for the 10% tothe 90% point of the device under test's RF output envelope in the CW mode. The on delay times from key closure to RFoutput are also measured. If the transmitter under test has several CW modes, (i.e. VOX, QSK) these measurements aremade at rated output power for each mode. A picture of the oscilloscope screen is taken of the results with the QSK on,and with QSK off, showing the first dit, and any other test conditions that result in a waveshape that is significantlydifferent from the others (more than 10% difference, spikes, etc.). The first and second dits are shown in all modes.
If the risetime or falltime become too short, the transmitter will generate key clicks. Most click-free transmitters havea rise and fall time between 1 ms and 5 ms. The absolute value of the on delay and off delay are not critical, but it isimportant that they be approximately the same so that CW weighting will not be affected.
Some transmitters used in "semi-QSK" (or QSK off) mode exhibit a first dit that is shorter than subsequent dits. Othertransmitters can show significant shortening of all dits when used in the QSK mode. The latter will cause keying tosound choppy at higher keying speeds.
The first dit foreshortening is expressed as a "weighting" number. In perfect keying, the weighting is 50%, meaningthat the carrier is ON for 50% of the time.
ARRL Laboratory Expanded Test-Result Report Model: ICOM IC-756 Pro Serial: 01313Copyright 2000, American Radio Relay League, Inc. All Rights Reserved. - Page 11
Test Results:Frequency(MHz)
Mode First DitRisetime(ms)
First DitFalltime(ms)
FollowingDitsRisetime(ms)
FollowingDitsFalltime(ms)
First DitOnDelay(ms)
FollowingDitsOn Delay(ms)
Weight%
FirstDitWeight%
14.02 QSK 2.0ms 2.0ms 2.0ms 1.5ms 11ms 12ms 31.7% 34.1%14.02 VOX 1.6ms 2.4ms 1.8ms 2.6ms 11ms 2ms 55% 35%
Note: All Figures are 10 ms/division, unless otherwise noted.Figure 1 shows the first and second dits with QSK on.Figure 2 shows the first and second dits with QSK off.
CW Keying Waveforms
Figure 1CW keying - QSK on
Figure 2CW keying - QSK off

ARRL Laboratory Expanded Test-Result Report Model: ICOM IC-756 Pro Serial: 01313Copyright 2000, American Radio Relay League, Inc. All Rights Reserved. - Page 12
Transmit Keyer Speed Test
Test Description: This test measures the speed of the internal keyer on transmitters so equipped. The keyer is tests atminimum, midrange and maximum speeds and the time from dit to dit is measured using an oscilloscope and used tocalculate the speed using the "Paris" method of code speed calculation. (In the Paris method, the word "Paris" is usedas the standard word to calculate words per minute.)
Test Results:Min WPM Max WPM Mid WPM Notes6 WPM 47 WPM 27.3 WPM
Transmit/Receive Turnaround Test
Test Description: The purpose of the Transmit/Receive turnaround test is to measure the delay required to switchfrom the transmit to the receive mode of a transceiver.
Test Results:Frequency Conditions T/R Delay
AGC FastT/R DelayAGC Slow
Notes
14.2 MHz SSB 23 ms 26 ms 1
Notes:1. T/R delay less than or equal to 35 ms is suitable for use on AMTOR.
Transmit Delay Test
Test Description: The purpose of the Transmit Delay test is to measure the time between PTT closure and 50% RFoutput. It is measured on SSB, modulated with a single tone and on FM, unmodulated.
Test Results:Frequency(MHz)
Mode On delay Notes
14.2 MHz SSB 20 ms50.2 MHz FM 11 ms

ARRL Laboratory Expanded Test-Result Report Model: ICOM IC-756 Pro Serial: 01313Copyright 2000, American Radio Relay League, Inc. All Rights Reserved. - Page 13
Transmit Composite Noise Test
Test Description: The purpose of the Composite-Noise Test is to observe and measure the phase and amplitude noise, aswell as any spurious signals generated by the device under test transmitter. Since phase noise is the primary noisecomponent in any well-designed transmitter, it can be assumed, therefore, that almost all the noise observed during thistest is phase noise. This measurement is accomplished by converting the output of the transmitter down to a frequencyabout 10 or 20 Hz above baseband. A mixer and a signal generator used as a local oscillator are used to perform thisconversion. Filters remove the 0 Hz component as well as the unwanted heterodyne components. The remaining noiseand spurious signals are then observed on the spectrum analyzer. The lower the noise as seen on the plot, the better thetransmitter.
Transmit Composite Noise Graphs
COM IC-756 Pro s/n 01313.520 MHz, Phase Noise, 100 W:\!TESTS\IC756PRO\756PRP80.TXT
2 4 6 8 10 12 14 16 18 20 22140
130
120
110
100
–90
–80
–70
–60
Frequency Sweep: 2 to 22 kHz from Carrier
Reference Level: - 60 dBc/HzVertical Scale: dBc/Hz
COM IC-756 Pro s/n 013134.020 MHz, Phase Noise, 100 W:\!TESTS\IC756PRO\756PRP20.TXT
2 4 6 8 10 12 14 16 18 20 22140
130
120
110
100
–90
–80
–70
–60
Frequency Sweep: 2 to 22 kHz from Carrier
Reference Level: - 60 dBc/HzVertical Scale: dBc/Hz
COM IC-756 Pro s/n 013130.020 MHz, Phase Noise, 100 W:\!TESTS\IC756PRO\756PRP6M.TXT
2 4 6 8 10 12 14 16 18 20 22140
130
120
110
100
–90
–80
–70
–60
Frequency Sweep: 2 to 22 kHz from Carrier
Reference Level: - 60 dBc/HzVertical Scale: dBc/Hz

ARRL Laboratory Expanded Test-Result Report Model: ICOM IC-756 Pro Serial: 01313Copyright 2000, American Radio Relay League, Inc. All Rights Reserved. - Page 14
Receiver Noise Floor Test(Minimum Discernible Signal)
Test Description: The noise floor of a receiver is the level of input signal that gives a desired audio output level thatis equal to the noise output level. This is sometimes called "minimum discernible signal" (MDS) although a skilledoperator can copy a signal at considerably less than the noise floor. Most modern receivers have a noise floor withina few dB of "perfect." A perfect receiver would hear only the noise of a resistor at room temperature. However inHF receivers especially, the system noise is rarely determined by the receiver circuitry. In most cases, external noiseis many dB higher than the receiver's internal noise. In this case, it is the external factors that determine the systemnoise performance. Making the receiver more sensitive will only allow it to hear more noise. It will also be moreprone to overload. In many cases, especially in the lower HF bands, receiver performance can be improved bysacrificing unneeded sensitivity by placing an attenuator in front of the receiver. The more negative the sensitivitynumber expressed in dBm, or the smaller the number expressed in voltage, the better the receiver.
Noise Floor:Frequency Preamp OFF
MDS (dBm)Preamp 1 ONMDS (dBm)
Preamp 2 ON(MDS) dBm
Notes
30 kHz –89.0 N/A N/A 1150 kHz –115.0 N/A N/A1.02 MHz –117.0 N/A N/A1.82 MHz –125.7 –134.1 –139.63.52 MHz –126.6 –135.0 –140.77.02 MHz –127.5 –135.8 –140.310.12 MHz –126.4 –136.7 –140.514.02 MHz –127.6 –136.2 –140.318.1 MHz –127.6 –137.2 –140.821.02 MHz –126.0 –135.8 –140.724.91 MHz –126.5 –136.4 –140.128.02 MHz –126.2 –135.9 –139.750.02 MHz –126.3 –132.1 –140.3
Notes:N/A means not applicable or not measured.1. For all measurements, the IF filter bandwidth was set for 500 Hz.
Receive Frequency Range
Test Description: This test measures the tuning range of the receiver. The range expressed is the range over whichthe receiver can be tuned. Most receivers exhibit some degradation of sensitivity near the limits of their tuningrange. In cases where this degradation renders the receiver unusable, we report both the actual and useful tuningrange.
Test Results:MinimumFrequency(MHz)
MinimumFrequencyMDS (dBm)
MaximumFrequency(MHz)
MaximumFrequencyMDS (dBm)
Notes
0.03 MHz –89 60 MHz –100 1
Notes:1. Measurements made with preamp off.

ARRL Laboratory Expanded Test-Result Report Model: ICOM IC-756 Pro Serial: 01313Copyright 2000, American Radio Relay League, Inc. All Rights Reserved. - Page 15
AM Sensitivity Test
Test Description: The purpose of the AM receive Sensitivity Test is to determine the level of an AM signal, 30%modulated at 1 kHz, that results in a tone 10 dB above the noise level (MDS) of the receiver. Two frequencies, 1.020MHz and 3.800 MHz are used for this test. The more negative the number, expressed in dBm, or the smaller thenumber expressed in voltage, the better the sensitivity.
Test Results:Frequency(MHz)
Preamplifier Sensitivity(µV)
Notes
1.02 MHz OFF 9.11 13.8 MHz OFF 3.103.8 MHz ON 1 1.103.8 MHz ON 2 0.6453 MHz OFF 2.8253 MHz ON 1 1.9753 MHz ON 2 0.68
Notes:1. 500 Hz nominal receiver bandwidth used for all tests
FM SINAD Test
Test Description: The purpose of the FM SINAD Test is to determine the sensitivity on FM.
SINAD is an acronym for "SIgnal plus Noise And Distortion" and is a measure of signal quality.The exact expression for SINAD is the following:
SINAD = Signal + Noise + Distortion (expressed in dB) Noise + Distortion
If we consider distortion to be merely another form of noise, (distortion, like noise, is something unwanted added to thesignal), and a practical circuit in which the signal is much greater than the noise, the SINAD equation can beapproximated by the signal to noise ratio:
SINAD = Signal (expressed in dB) Noise
For the 25% level of distortion used in this test, the SINAD value can be calculated as follows:
SINAD = 20 log (1/25%) = 20 log 4 = 12 dB
The more negative the number, expressed in dBm, or the smaller the number, expressed as voltage, the better thesensitivity.

ARRL Laboratory Expanded Test-Result Report Model: ICOM IC-756 Pro Serial: 01313Copyright 2000, American Radio Relay League, Inc. All Rights Reserved. - Page 16
FM Sensitivity test Results:Frequency(MHz)
Preamplifier Bandwidth Sensitivity(dBm)
Sensitivity(µV)
Notes
29.0 MHz OFF NAR –105.4 1.2029.0 MHz OFF WIDE –104.4 1.3529.0 MHz ON 1 NAR –116.1 0.3529.0 MHz ON 1 WIDE –115.0 0.4029.0 MHz ON 2 NAR –119.4 0.2429.0 MHz ON 2 WIDE –118.7 0.2652.0 MHz OFF NAR N/A 1.1052.0 MHz OFF WIDE N/A 1.1752.0 MHz ON 1 NAR N/A 0.6352.0 MHz ON 1 WIDE N/A 0.7052.0 MHz ON 2 NAR N/A 0.2552.0 MHz ON 2 WIDE N/A 0.26
Blocking Dynamic Range Test
Test Description: Dynamic range is a measurement of a receiver's ability to function well on one frequency in thepresence of one or more unwanted signals on other frequencies. It is essentially a measurement of the differencebetween a receiver's noise floor and the loudest off-channel signal that can be accommodated without measurabledegradation of the receiver's response to a relatively weak signal to which it is tuned. This difference is usuallyexpressed in dB. Thus, a receiver with a dynamic range of 100 dB would be able to tolerate an off-channel signal100 dB stronger than the receiver's noise floor.
In the case of blocking dynamic range, the degradation criterion is receiver desense. Blocking dynamic range(BDR) is the difference, in dB, between the noise floor and a off-channel signal that causes 1 dB of gain compressionin the receiver. It indicates the signal level, above the noise floor, that begins to cause desensitization. BDR iscalculated by subtracting the noise floor from the level of undesired signal that produces a 1-dB decrease in a weakdesired signal. It is expressed in dB. The greater the dynamic range, (expressed in dB), the better the receiverperformance. It is usual for the dynamic range to vary with frequency spacing.
Key Test Conditions: If possible, AGC is normally turned off; the receiver is operated in its linear region. Desiredsignal set to 10 dB below the 1-dB compression point, or 20 dB above the noise floor in receivers whose AGCcannot be disabled. The receiver bandwidth is set as close as possible to 500 Hz.
Test Result Summary:Frequency Preamp Spacing BDR (dB) Notes1.020 MHz OFF 50 kHz 120.6 13.52 MHz OFF 20 kHz 126.63.52 MHz ON 1 20 kHz 125.03.52 MHz ON 2 20 kHz 121.714.02 MHz OFF 20 kHz 126.614.02 MHz ON 1 20 kHz 125.214.02 MHz ON 2 20 kHz 120.328.02 MHz OFF 50 kHz 124.750.02 MHz OFF 20 kHz 127.350.02 MHz ON 1 20 kHz 130.150.02 MHz ON 2 20 kHz 122.3
Notes:1. For all measurements, the filter bandwidth was set for 500 Hz.

ARRL Laboratory Expanded Test-Result Report Model: ICOM IC-756 Pro Serial: 01313Copyright 2000, American Radio Relay League, Inc. All Rights Reserved. - Page 17
Two-Tone 3rd-Order Dynamic Range Test
Test Description: Intermodulation distortion dynamic range (IMD DR) measures the impact of two-tone IMD on areceiver. IMD is the production of spurious responses resulting from the mixing of desired and undesired signals in areceiver. IMD occurs in any receiver when signals of sufficient magnitude are present. IMD DR is the difference, indB, between the noise floor and the strength of two equal off-channel signals that produce a third-order productequal to the noise floor. In the case of two-tone, third-order dynamic range, the degradation criterion is a receiverspurious response. If the receiver generates a third-order response equal to the receiver's noise floor to two off-channel signals, the difference between the noise floor and the level of one of the off-channel signals is the blockingdynamic range. This test determines the range of signals that can be tolerated by the device under test while producingessentially no undesired spurious responses. To perform the 3rd Order test, two signals of equal amplitude and spaced 20kHz apart, are injected into the input of the receiver. If we call these frequencies f1 and f2, the third-order products willappear at frequencies of (2f1-f2) and (2f2-f1).
The greater the dynamic range, (expressed in dB), or the higher the intercept point, the better the performance.
Two-Tone Receiver IMD Dynamic Range Test Result Summary:Frequency(MHz)
Spacing Preamp OFFIMD DR (dB)
Preamp 1 ONIMD DR (dB)
Preamp 2 ONIMD DR (dB)
Notes
1.82 MHz 50 kHz N/A N/A 88.63.52 MHz 20 kHz 91.6 92.0 89.714.02 MHz 20 kHz 94.6 92.2 88.228.02 MHz 50 kHz N/A N/A 91.750.02 MHz 20 kHz 93.3 83.6 89.3
Notes:1. For all measurements, the filter bandwidth was set for 500 Hz.N/A = Not applicable or not measured.
Dynamic Range Graphs:
Dynamic range measures the difference between a receiver's noise floor and the receiver's degradation in thepresence of strong signals. In some cases, the receiver's noise performance causes receiver degradation beforeblocking or a spurious response is seen. In either case, if the noise floor is degraded by 1 dB due to the presence ofreceiver noise during the test, the dynamic range is said to be noise limited by the level of signal that caused thereceiver noise response. A noise-limited condition is indicated in the QST "Product Review" test-result tables. Onthe graphs on the following page(s), noise limited measurements are indicated with a small circle drawn on the datapoint on the graph.
Being "noise limited" is not necessarily a bad thing. A receiver noise limited at a high level is better than a receiverwhose dynamic range is lower than the noise-limited level. In essence, a receiver that is noise limited has a dynamicrange that is better than its local-oscillator noise. Most of the best receivers are noise limited at rather high levels.
The ARRL Laboratory has traditionally used off-channel signals spaced 20 kHz from the desired signal. This doesallow easy comparisons between different receivers. There is nothing magical about the 20-kHz spacing, however.In nearly all receivers, the dynamic range varies with signal spacing, due to the specific design of the receiver. Mostreceivers have filter combinations that do some coarse filtering at RF and in the first IF, with additional filteringtaking place in later IF or AF stages. As the signals get "inside" different filters in the receiver, the dynamic rangedecreases as the attenuation of the filter is no longer applied to the signal. Interestingly, the different filter shapescan sometimes be seen in the graphs of dynamic range of different receivers. In the case of the ARRL graphs, onecan often see that the 20-kHz spacing falls on the slope of the curve. Many manufacturers specify dynamic range at50 or 100 kHz.

ARRL Laboratory Expanded Test-Result Report Model: ICOM IC-756 Pro Serial: 01313Copyright 2000, American Radio Relay League, Inc. All Rights Reserved. - Page 18
The graphs that follow show swept blocking and two-tone dynamic range. In the blocking test for an HF unit, thereceiver is tuned to a signal on 14.020 MHz, the center of the graph. The X-axis is the frequency (MHz) of theundesired, off-channel signal. In the two-tone test for an HF unit, the receiver is tuned to a signal on 14.020 MHz,the center of the graph. The X axis is the frequency of the closer of the two tones that are creating intermodulation.For VHF receivers, or single-band HF receivers, a frequency that is 20 kHz higher than the lower band edge, or 20kHz from the "traditional" start of the weak-signal portion of the band, is selected.
Swept Blocking Dynamic-Range:
13.820 13.920 14.020 14.120 14.22050.0
60.0
70.0
80.0
90.0
100.0
110.0
120.0
130.0
140.0
150.0
BDR dB
Receiver Frequency = 14.02 MHz
Swept IMD Dynamic-Range:
13.820 13.920 14.020 14.120 14.22050.0
60.0
70.0
80.0
90.0
100.0
110.0
120.0
130.0
140.0
150.0
IMD DR dB
Receiver Frequency = 14.02 MHz
Second-Order IMD Test
Test Description: This test measures the amount of 2nd-order mixing that takes place in the receiver. Signals at6.000 and 8.020 MHz are presented to the receiver and the resultant output at 14.020 MHz is measured.
Test Results:Frequency Preamplifier Dynamic
Range (dB)IP2(dBm)
Notes
14.02 MHz OFF 96.6 +63.714.02 MHz ON 1 99.2 +62.614.02 MHz ON 2 92.3 +42.8
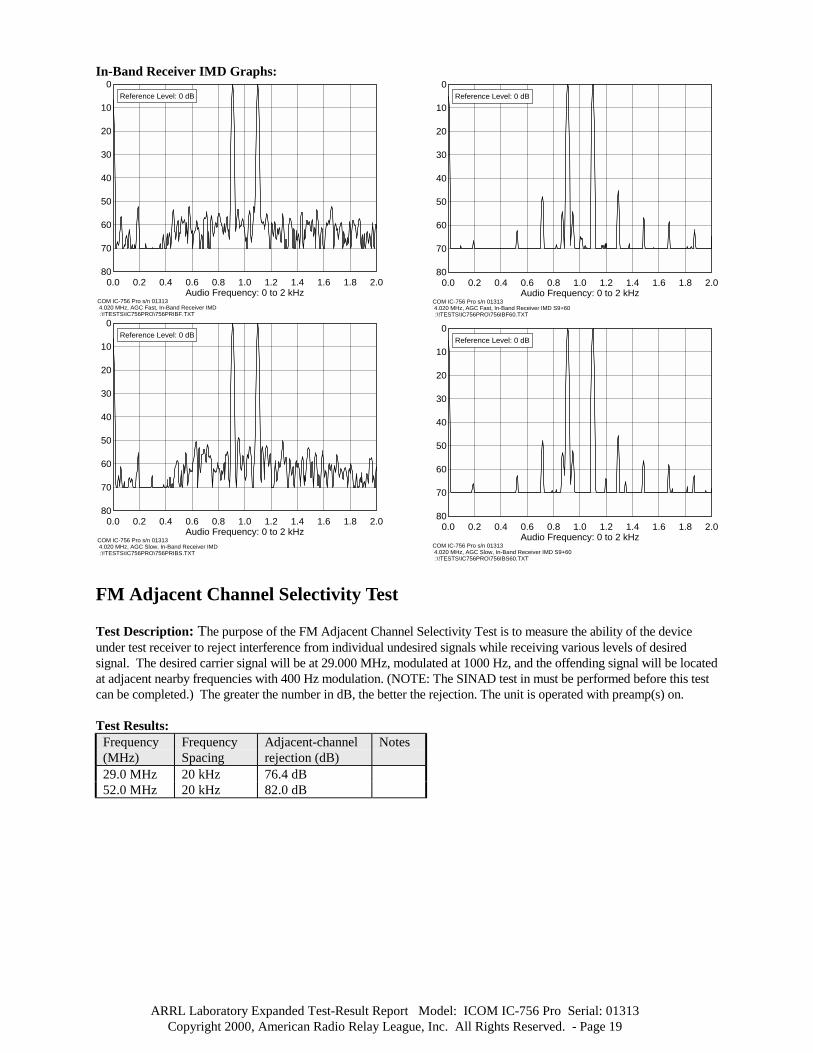
In-Band Receiver IMD Test
Test Description: This test measures the intermodulation that occurs between two signals that are simultaneouslypresent in the passband of a receiver. Two signals, at levels of 50 µV (nominally S9), spaced 200 Hz are used. Thereceiver AGC is set to FAST. The receiver is tuned so the two signals appear at 900 Hz and 1100 Hz in the receiveraudio. The output of the receiver is viewed on a spectrum analyzer and the 3rd- and 5th order products are measureddirectly from the screen. The smaller the products as seen on the graph, the better the receiver. Generally, productsthat are less than 30 dB below the desired tones will not be cause objectionable receiver intermodulation distortion.
ARRL Laboratory Expanded Test-Result Report Model: ICOM IC-756 Pro Serial: 01313Copyright 2000, American Radio Relay League, Inc. All Rights Reserved. - Page 19
In-Band Receiver IMD Graphs:
COM IC-756 Pro s/n 013134.020 MHz, AGC Fast, In-Band Receiver IMD:\!TESTS\IC756PRO\756PRIBF.TXT
0.0 0.2 0.4 0.6 0.8 1.0 1.2 1.4 1.6 1.8 2.080
70
60
50
40
30
20
10
0
Audio Frequency: 0 to 2 kHz
Reference Level: 0 dB
COM IC-756 Pro s/n 013134.020 MHz, AGC Slow, In-Band Receiver IMD:\!TESTS\IC756PRO\756PRIBS.TXT
0.0 0.2 0.4 0.6 0.8 1.0 1.2 1.4 1.6 1.8 2.080
70
60
50
40
30
20
10
0
Audio Frequency: 0 to 2 kHz
Reference Level: 0 dB
COM IC-756 Pro s/n 013134.020 MHz, AGC Fast, In-Band Receiver IMD S9+60:\!TESTS\IC756PRO\756IBF60.TXT
0.0 0.2 0.4 0.6 0.8 1.0 1.2 1.4 1.6 1.8 2.080
70
60
50
40
30
20
10
0
Audio Frequency: 0 to 2 kHz
Reference Level: 0 dB
COM IC-756 Pro s/n 013134.020 MHz, AGC Slow, In-Band Receiver IMD S9+60:\!TESTS\IC756PRO\756IBS60.TXT
0.0 0.2 0.4 0.6 0.8 1.0 1.2 1.4 1.6 1.8 2.080
70
60
50
40
30
20
10
0
Audio Frequency: 0 to 2 kHz
Reference Level: 0 dB
FM Adjacent Channel Selectivity Test
Test Description: The purpose of the FM Adjacent Channel Selectivity Test is to measure the ability of the deviceunder test receiver to reject interference from individual undesired signals while receiving various levels of desiredsignal. The desired carrier signal will be at 29.000 MHz, modulated at 1000 Hz, and the offending signal will be locatedat adjacent nearby frequencies with 400 Hz modulation. (NOTE: The SINAD test in must be performed before this testcan be completed.) The greater the number in dB, the better the rejection. The unit is operated with preamp(s) on.
Test Results:Frequency(MHz)
FrequencySpacing
Adjacent-channelrejection (dB)
Notes
29.0 MHz 20 kHz 76.4 dB52.0 MHz 20 kHz 82.0 dB

ARRL Laboratory Expanded Test-Result Report Model: ICOM IC-756 Pro Serial: 01313Copyright 2000, American Radio Relay League, Inc. All Rights Reserved. - Page 20
FM Two-Tone 3rd-Order Dynamic Range Test
Test Description: The purpose of the FM Two-Tone 3rd Order Dynamic Range Test is to determine the range ofsignals that can be tolerated by the device under testing the FM mode while producing no spurious responses greaterthan the 12-dB SINAD level. To perform this test, two signals, f1 and f2, of equal amplitude and spaced 20 kHz apart,are injected into the input of the receiver. The signal located 40 kHz from the distortion product being measured ismodulated at 1,000 Hz with a deviation of 3 kHz. The receiver is tuned to the Third Order IMD frequencies asdetermined by (2f1-f2) and (2f2-f1). The input signals are then raised simultaneously by equal amounts until 25 %distortion, or the 12-dB SINAD point, is obtained. Frequencies 10 MHz outside the amateur band are used to test thewide-band dynamic range. The greater the dynamic range, the better the receiver performance.
Test Results:Frequency(MHz)
FrequencySpacing
FM DynamicRange (dB)
Notes
29 MHz 20 kHz 78.4 dB52 MHz 20 kHz 77.0 dB52 MHz 10 MHz 105.0 dB
Image Rejection Test
Test Description: This test measures the amount of image rejection for superhetrodyne receivers by determining thelevel of signal input to the receiver at the first IF image frequencies that will produce an audio output equal to the noisefloor level. The test is conducted with the receiver in the CW mode using the 500 Hz, or closest available bandwidth.Any audio filtering is disabled and AGC is turned OFF, if possible. The test is performed with the receiver tuned to14.250 MHz for receivers that have 20 meters, or to a frequency 20 kHz up from the lower band edge for single-bandreceivers. The greater the number in dB, the better the image rejection.
Test Results:Frequency(MHz)
CalculatedImageFrequency
ImageRejection(dB)
Notes
14.2 MHz 143.11 MHz 114.050.2 MHz 179.11 MHz 114.5
IF Rejection Test
Test Description: This test measures the amount of first IF rejection for superhetrodyne receivers by determining thelevel of signal input to the receiver at the first IF that will produce an audio output equal to the MDS level. The test isconducted with the receiver in the CW mode using the 500 Hz, or closest available, IF filters. Any audio filtering isdisabled and AGC is turned OFF, if possible. The test is performed with the receiver tuned to 14.250 MHz for receiversthat have 20-meter capability, or to a frequency 20 kHz up from the lower band edge for single-band receivers. Thegreater the number in dB, the better the IF rejection.
Test Results:Frequency 1st IF
(MHz)1st IFRejection
Notes
14.2 MHz 64.455 102.0 dB50.2 MHz 64.455 69.8 dB

ARRL Laboratory Expanded Test-Result Report Model: ICOM IC-756 Pro Serial: 01313Copyright 2000, American Radio Relay League, Inc. All Rights Reserved. - Page 21
Audio Output Power Test
Test Description: This test measures the audio power delivered by the receiver. The manufacturer's specificationfor load and distortion are used. For units not specified, an 8-ohm load and 10% harmonic distortion are used.
Test Results:SpecifiedDistortion
Specified LoadImpedance
Audio OutputPower (W)
Notes
10 % 8 ohms 2.2 W
IF + Audio Frequency Response Test
Test Description: The purpose of the IF + Audio Frequency Response Test is to measure the audio frequencies atwhich the receiver audio drops 6 dB from the peak signal response. The frequency-response bandwidth is thencalculated by taking the difference between the lower and upper frequency. See also the receiver passband graphsappended to this report.
Test Results:Unit Mode/Filter BW
NominalBandwidth
Low Freq.(Hz)
High Freq.(Hz)
Difference(bandwidth)
Notes
CW Narrow 500 Hz 342 857 515 Hz 1CW Wide 1200 Hz 74 1262 1188 HzUSB Normal 2400 Hz 226 2725 2499 HzLSB Normal 2400 Hz 229 2730 2501 HzAM Normal 6000 Hz 65 3428 3363 Hz
Notes:1. CW pitch control centered for all tests
Squelch Sensitivity Test
Test Description: The purpose of the Squelch Sensitivity Test is to determine the level of the input signal requiredto break squelch at the threshold. This number is not usually critical. A result anywhere between 0.05 and 0.5 µV isusually useful.
Test Results:Frequency(MHz)
Preamplifier Mode Minimum(µV)
Notes
14.2 MHz OFF SSB 1.129.0 MHz ON 2 FM 0.3852.0 MHz ON 2 FM 0.36

ARRL Laboratory Expanded Test-Result Report Model: ICOM IC-756 Pro Serial: 01313Copyright 2000, American Radio Relay League, Inc. All Rights Reserved. - Page 22
S-Meter Test
Test Description: The purpose of the S-Meter Test is to determine the level of RF input signal required to producean S9 and S9+20 dB indication on the receiver S meter. This test is performed with the receiver in the CW mode ata frequency of 14.200 MHz. The IF filter is set to 500 Hz, nominal. The old Collins standard for S9 signal is a levelof 50 µV. The Collins standard S unit was 6 dB. However, there is no generally accepted standard among thevarious current manufacturers.
Test Results:Frequency(MHz)
Preamplifier S Units µV Notes
14.2 OFF S9 64.514.2 ON 1 S9 16.414.2 ON 2 S9 8.3150.2 OFF S9 67.650.2 ON 1 S9 29.550.2 ON 2 S9 7.841.02 OFF S9 232
Notch Filter Test
Test Description: This test measures the notch filter depth at 1 kHz audio and the time required for auto-notch DSPfilters to detect and notch a signal. The more negative the notch depth number, the better the performance.
Test Results:Frequency MODE Notch Depth Notes14.250 MHz Notch > 60 dB
Noise Reduction Test
Test Description: There are a number of noise-reduction methods used in modern receivers. Most of them use DSP.In this test, the test engineer uses a test signal that gives about a 20 dB signal-to-noise ratio. The noise reduction isengaged and a measurement or estimate is made of the amount of noise reduction. This is an approximatemeasurement because the amount of noise reduction is dependent on the original signal-to-noise ratio.
Test Results:Frequency(MHz)
MODE Noisereduction
Notes
14.250 MHz NR > 15 dB

ARRL Laboratory Expanded Test-Result Report Model: ICOM IC-756 Pro Serial: 01313Copyright 2000, American Radio Relay League, Inc. All Rights Reserved. - Page 23
Receiver Passband Response
ARRL is still refining the test methods to easily generate receiver bandpass data. For the following graphs, weconnected an RF-noise source to the input of the receiver and a spectrum analyzer to the output. After about 10averages, we obtained a reasonable representation of the receiver bandpass, under actual signal-level conditions. Aswe refine this test a bit more, we will add a section to the report that better defines the test methods, etc.
COM IC-756 Pro s/n 013134.020 MHz, USB, 100 W:\!TESTS\IC756PRO\756PRU20.TXT
0.1 0.4 0.8 1.2 1.6 2.0 2.4 2.8 3.2 3.6 4.0140
130
120
110
100
–90
Frequency Sweep: 2 to 22 kHz from Carrier
Reference Level: - 60 dBc/HzVertical Scale: dBc/Hz
COM IC-756 Pro s/n 013134.020 MHz, CW, 100 W:\!TESTS\IC756PRO\756PRC20.TXT
0.1 0.4 0.8 1.2 1.6 2.0 2.4 2.8 3.2 3.6 4.0140
130
120
110
100
–90
Frequency Sweep: 2 to 22 kHz from Carrier
Reference Level: - 60 dBc/HzVertical Scale: dBc/Hz
COM IC-756 Pro s/n 013134.020 MHz, LSB, 100 W:\!TESTS\IC756PRO\756PRL20.TXT
0.1 0.4 0.8 1.2 1.6 2.0 2.4 2.8 3.2 3.6 4.0140
130
120
110
100
–90
Frequency Sweep: 2 to 22 kHz from Carrier
Reference Level: - 60 dBc/HzVertical Scale: dBc/Hz